Special Report
Cities Where the Most People Graduate High School

Published:
Last Updated:

High school graduation rates are on the rise in the United States. In the 2016-2017 school year, 85% of seniors graduated on time, up from 84% the previous year and 80% five years prior.
In the United States, high school graduates are more likely to be in better health, less likely to be unemployed, and typically earn about 28% more annually than those who have not completed high school. In light of the benefits associated with a high school education, the climbing graduation rate comes as encouraging news.
While the national high school graduation rate is at its highest level in years, there are parts of the country where graduation rates far exceed the national rate. 24/7 Wall St. reviewed the share of high school seniors who graduated on time in 382 U.S. metropolitan areas to identify the cities where the most people graduate from high school. All data on high school graduation is from 2019 County Health Rankings & Roadmaps, a collaboration between the Robert Wood Johnson Foundation and the University of Wisconsin Population Health Institute.
According to the Bureau of Labor Statistics, American adults with a high school diploma are far more likely to have a secure job than those who have not completed high school. The 5.6% 2018 unemployment rate among adults 25 and older who did not complete high school is considerably higher than the 4.1% rate among adults who completed high school and did not go on to college.
In every city on this list, the high school graduation rate for the 2016-2017 school year is over 91%. Perhaps not surprisingly, in the majority of these cities, the annual unemployment rate is lower than the 3.9% national average.
Of course, when it comes to local and regional job markets, the educational attainment of the workforce is only part of the equation. Another important factor is whether the number of available jobs is keeping pace with the demand for work. Here is a look at the U.S. cities that have added the most jobs in the last five years.
While earning a high school diploma can be critical to ensuring one’s future financial security, Americans who go on to college are even better qualified for high-paying careers. The typical college graduate in the United States earns $54,628 annually — or $23,359 more than those whose highest level of education is high school. However, high school graduates are still qualified for several high-paying careers, even some that pay more than many of those available only to college graduates. Here is a list of the highest paying jobs you can get without a college degree.
It is important to not that while high school graduates typically earn more than those who have not completed high school, there are exceptions. In five of the 50 metro areas on this list, median earnings among high school graduates are lower than the annual median for those who did not complete high school.
Click here to see cities where the most people graduate high school
Click here to read our methodology
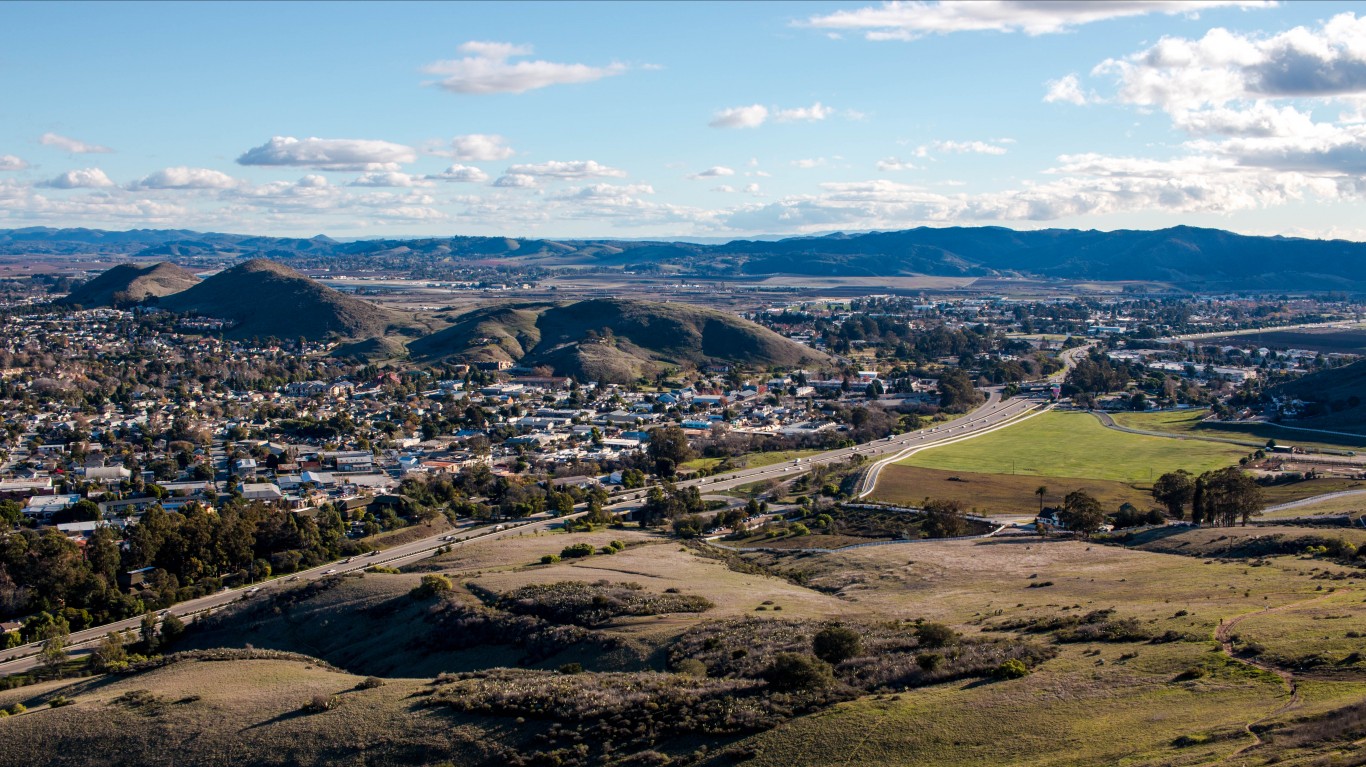
50. San Luis Obispo-Paso Robles-Arroyo Grande, CA
> High school graduation rate: 91.5%
> 2018 unemployment: 2.9% (top 25%)
> Typical income for non-high school graduates: $24,482
> Typical income for HS graduates with no college: $31,357
> Adults with a bachelor’s degree: 34.7% (top 25%)
[in-text-ad]
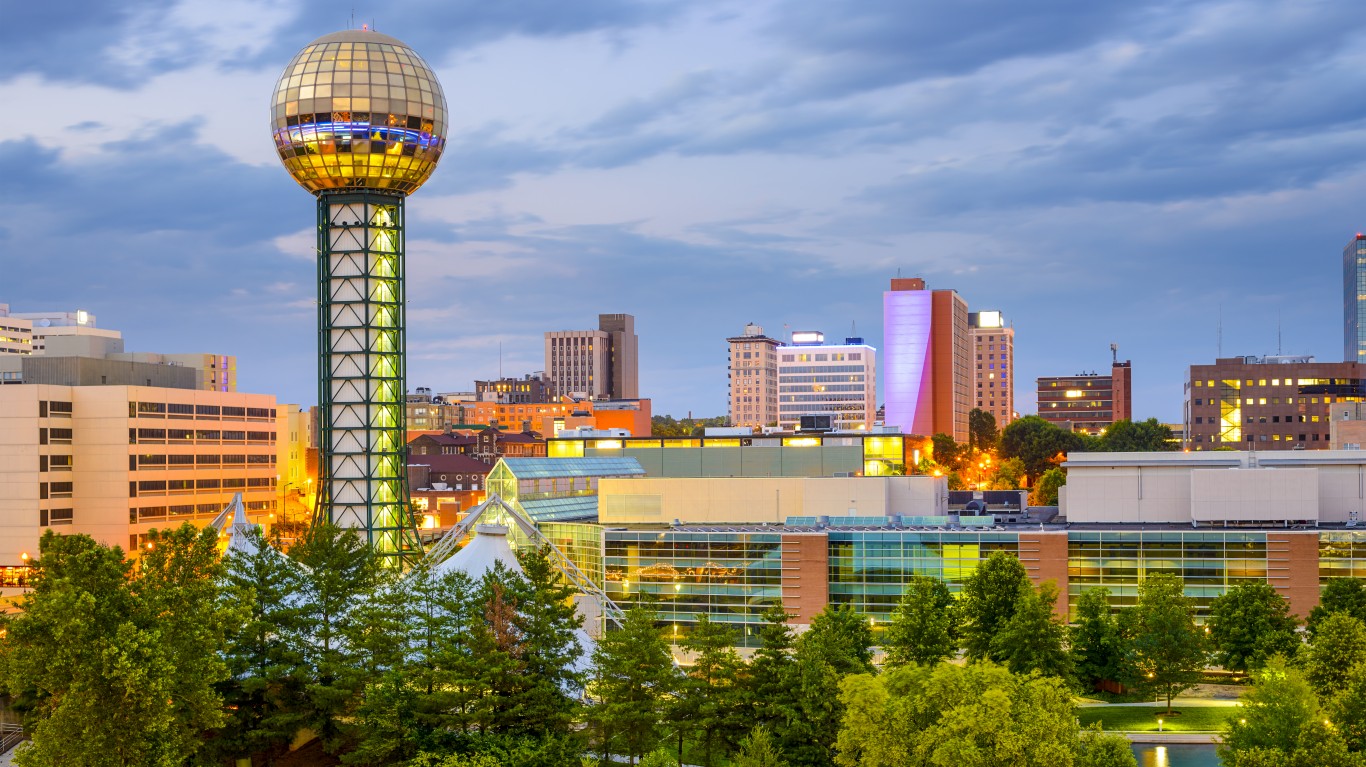
49. Knoxville, TN
> High school graduation rate: 91.6%
> 2018 unemployment: 3.3%
> Typical income for non-high school graduates: $17,327 (bottom 10%)
> Typical income for HS graduates with no college: $29,669
> Adults with a bachelor’s degree: 28.7%
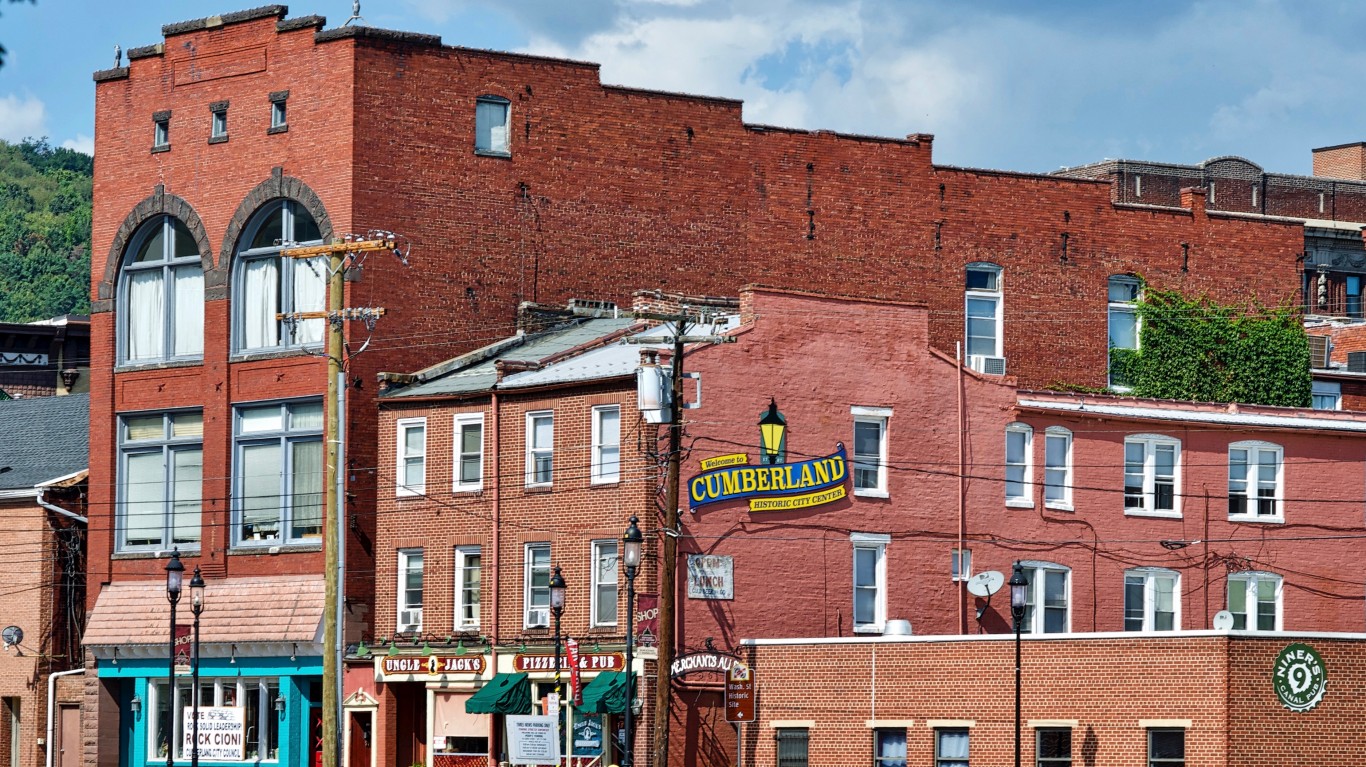
48. Cumberland, MD-WV
> High school graduation rate: 91.6%
> 2018 unemployment: 5.5% (bottom 25%)
> Typical income for non-high school graduates: $18,120 (bottom 10%)
> Typical income for HS graduates with no college: $26,426 (bottom 10%)
> Adults with a bachelor’s degree: 19.4% (bottom 25%)

47. State College, PA
> High school graduation rate: 91.6%
> 2018 unemployment: 3.2%
> Typical income for non-high school graduates: $26,283
> Typical income for HS graduates with no college: $31,010
> Adults with a bachelor’s degree: 46.7% (top 10%)
[in-text-ad-2]

46. Dothan, AL
> High school graduation rate: 91.7%
> 2018 unemployment: 4.1%
> Typical income for non-high school graduates: $20,175 (bottom 25%)
> Typical income for HS graduates with no college: $22,995 (bottom 10%)
> Adults with a bachelor’s degree: 19.7% (bottom 25%)

45. Canton-Massillon, OH
> High school graduation rate: 91.7%
> 2018 unemployment: 4.9% (bottom 25%)
> Typical income for non-high school graduates: $25,073
> Typical income for HS graduates with no college: $30,141
> Adults with a bachelor’s degree: 21.3% (bottom 25%)
[in-text-ad]

44. Cape Girardeau, MO-IL
> High school graduation rate: 91.7%
> 2018 unemployment: 3.1% (top 25%)
> Typical income for non-high school graduates: $22,336
> Typical income for HS graduates with no college: $27,258 (bottom 25%)
> Adults with a bachelor’s degree: 27.3%

43. Lubbock, TX
> High school graduation rate: 91.7%
> 2018 unemployment: 3.1% (top 25%)
> Typical income for non-high school graduates: $22,321
> Typical income for HS graduates with no college: $31,592
> Adults with a bachelor’s degree: 29.2%

42. Barnstable Town, MA
> High school graduation rate: 91.7%
> 2018 unemployment: 4.1%
> Typical income for non-high school graduates: $27,270 (top 25%)
> Typical income for HS graduates with no college: $37,758 (top 10%)
> Adults with a bachelor’s degree: 41.8% (top 10%)
[in-text-ad-2]

41. Dubuque, IA
> High school graduation rate: 91.8%
> 2018 unemployment: 2.4% (top 10%)
> Typical income for non-high school graduates: $45,320 (top 10%)
> Typical income for HS graduates with no college: $32,384
> Adults with a bachelor’s degree: 30.8%

40. Wheeling, WV-OH
> High school graduation rate: 91.8%
> 2018 unemployment: 5.3% (bottom 25%)
> Typical income for non-high school graduates: $20,057 (bottom 25%)
> Typical income for HS graduates with no college: $26,878 (bottom 25%)
> Adults with a bachelor’s degree: 22.7%
[in-text-ad]

39. Tyler, TX
> High school graduation rate: 91.9%
> 2018 unemployment: 3.6%
> Typical income for non-high school graduates: $23,025
> Typical income for HS graduates with no college: $30,873
> Adults with a bachelor’s degree: 28.3%

38. Amarillo, TX
> High school graduation rate: 91.9%
> 2018 unemployment: 2.8% (top 25%)
> Typical income for non-high school graduates: $25,657
> Typical income for HS graduates with no college: $33,355 (top 25%)
> Adults with a bachelor’s degree: 26.3%
37. Weirton-Steubenville, WV-OH
> High school graduation rate: 91.9%
> 2018 unemployment: 6.2% (bottom 10%)
> Typical income for non-high school graduates: $20,492 (bottom 25%)
> Typical income for HS graduates with no college: $27,712 (bottom 25%)
> Adults with a bachelor’s degree: 16.7% (bottom 10%)
[in-text-ad-2]
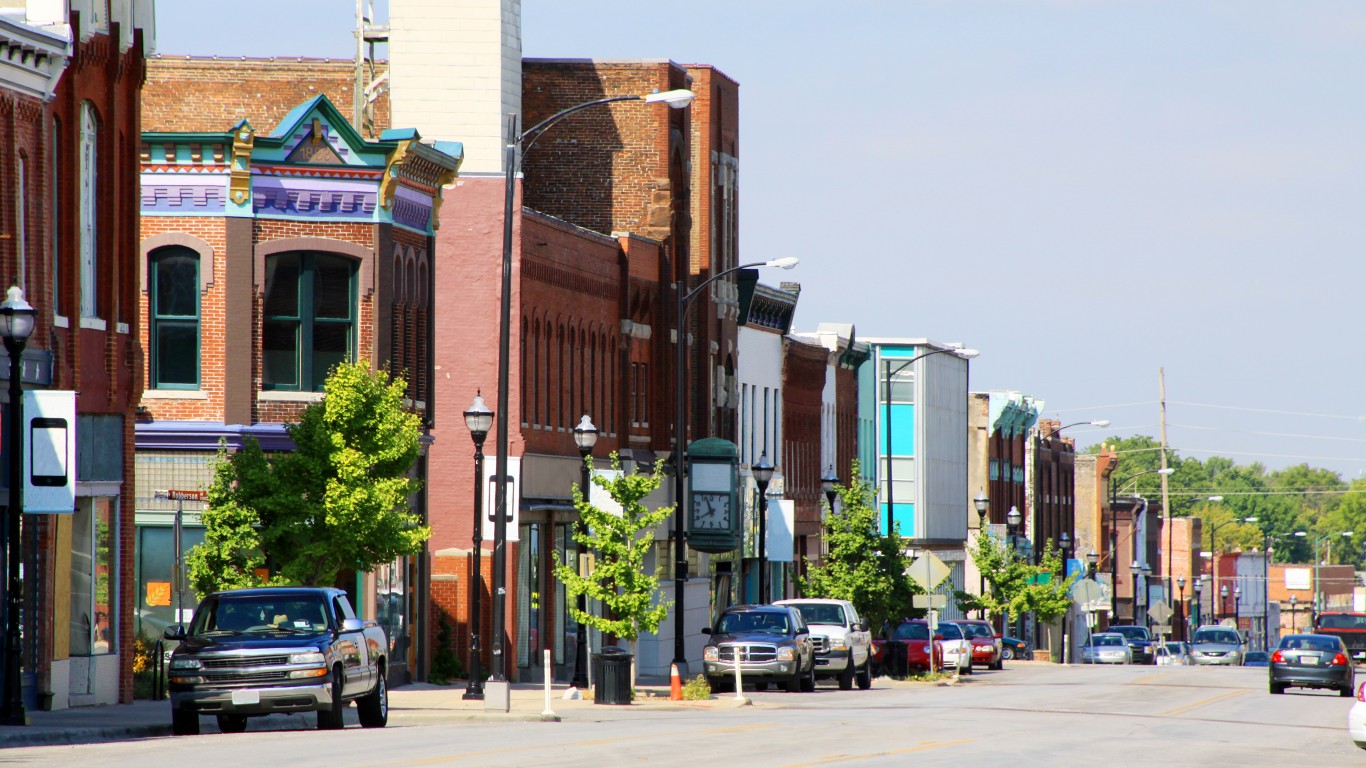
36. Springfield, MO
> High school graduation rate: 92.0%
> 2018 unemployment: 2.7% (top 25%)
> Typical income for non-high school graduates: $25,302
> Typical income for HS graduates with no college: $27,062 (bottom 25%)
> Adults with a bachelor’s degree: 26.7%

35. Des Moines-West Des Moines, IA
> High school graduation rate: 92.0%
> 2018 unemployment: 2.4% (top 10%)
> Typical income for non-high school graduates: $26,923 (top 25%)
> Typical income for HS graduates with no college: $34,077 (top 25%)
> Adults with a bachelor’s degree: 38.9% (top 25%)
[in-text-ad]
34. Logan, UT-ID
> High school graduation rate: 92.1%
> 2018 unemployment: 2.6% (top 10%)
> Typical income for non-high school graduates: $27,331 (top 25%)
> Typical income for HS graduates with no college: $36,399 (top 10%)
> Adults with a bachelor’s degree: 38.0% (top 25%)
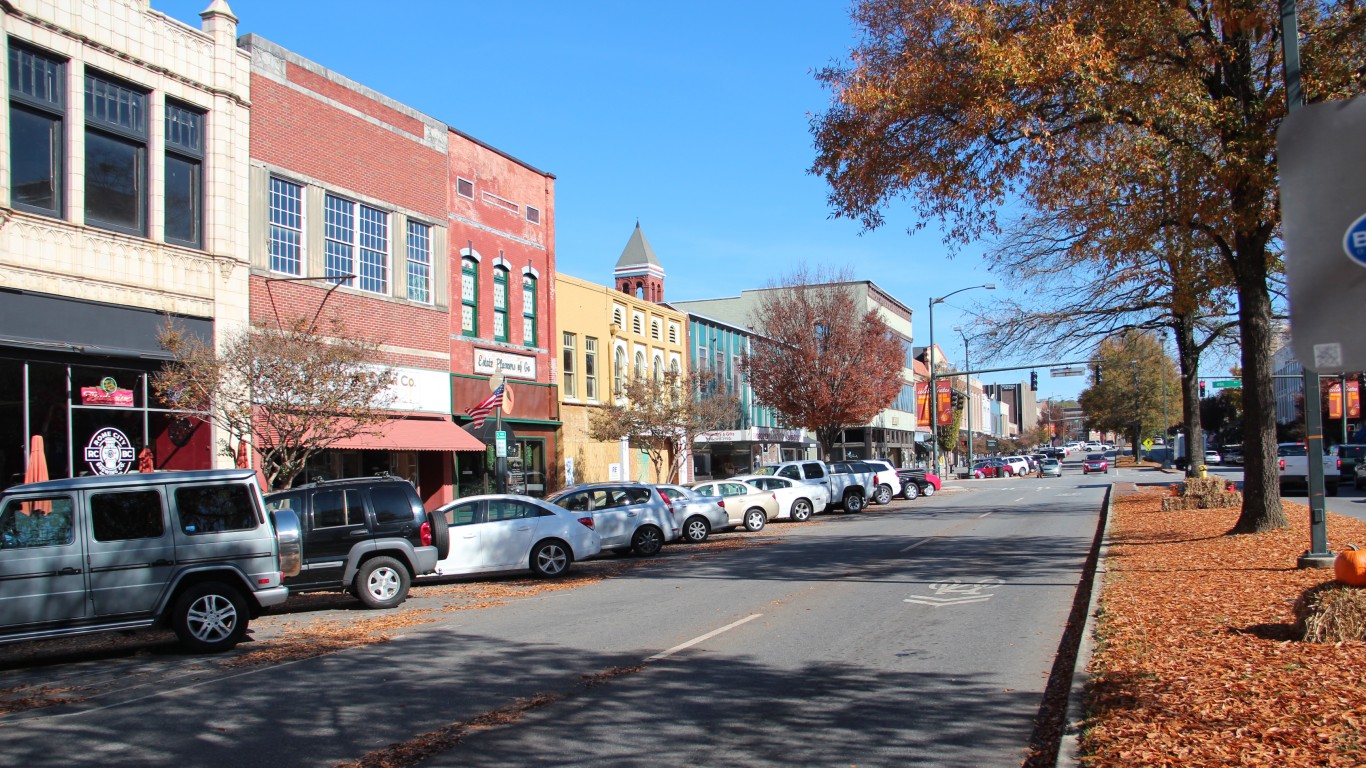
33. Rome, GA
> High school graduation rate: 92.1%
> 2018 unemployment: 4.3%
> Typical income for non-high school graduates: $21,601
> Typical income for HS graduates with no college: $27,097 (bottom 25%)
> Adults with a bachelor’s degree: 16.9% (bottom 10%)

32. Fort Wayne, IN
> High school graduation rate: 92.1%
> 2018 unemployment: 3.1% (top 25%)
> Typical income for non-high school graduates: $26,198
> Typical income for HS graduates with no college: $30,482
> Adults with a bachelor’s degree: 27.7%
[in-text-ad-2]
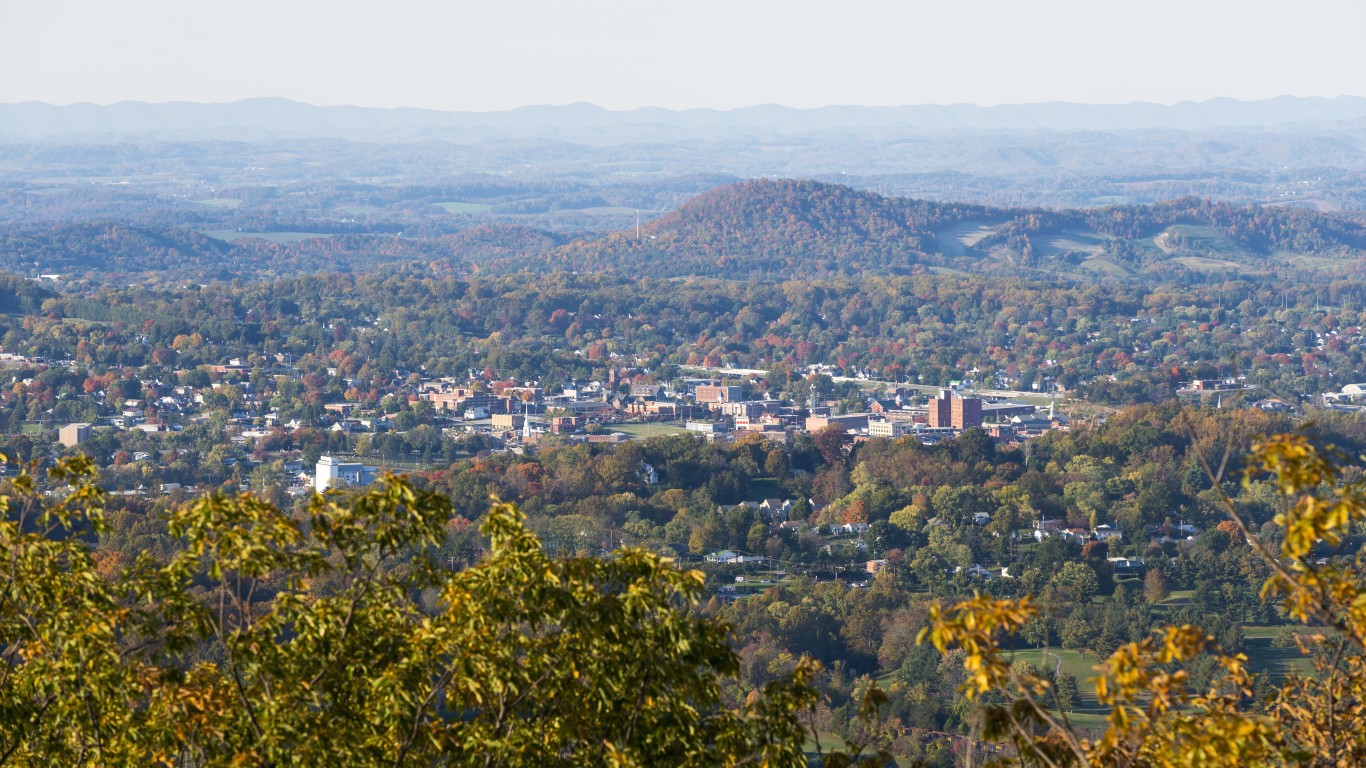
31. Johnson City, TN
> High school graduation rate: 92.1%
> 2018 unemployment: 3.8%
> Typical income for non-high school graduates: $22,497
> Typical income for HS graduates with no college: $26,029 (bottom 10%)
> Adults with a bachelor’s degree: 27.5%
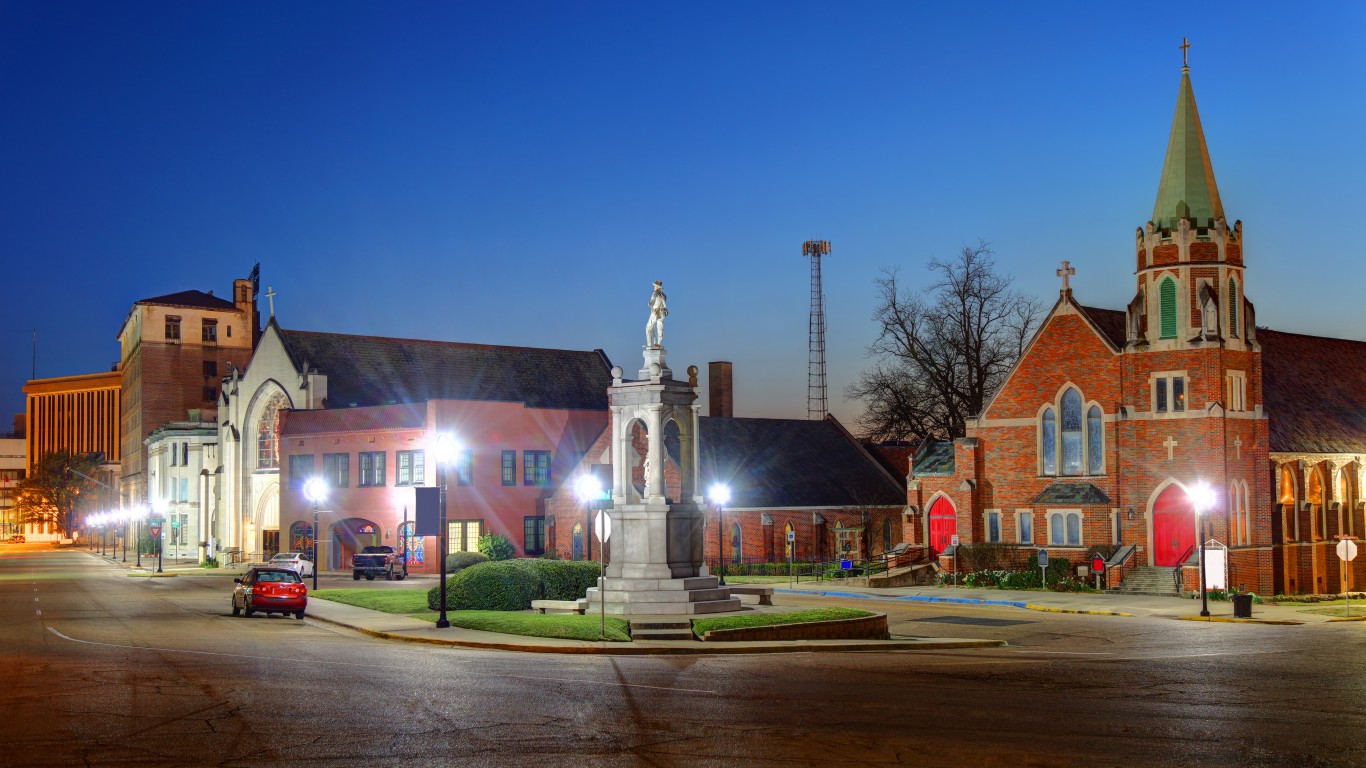
30. Texarkana, TX-AR
> High school graduation rate: 92.3%
> 2018 unemployment: 4.9% (bottom 25%)
> Typical income for non-high school graduates: $35,742 (top 10%)
> Typical income for HS graduates with no college: $31,924
> Adults with a bachelor’s degree: 19.2% (bottom 25%)
[in-text-ad]
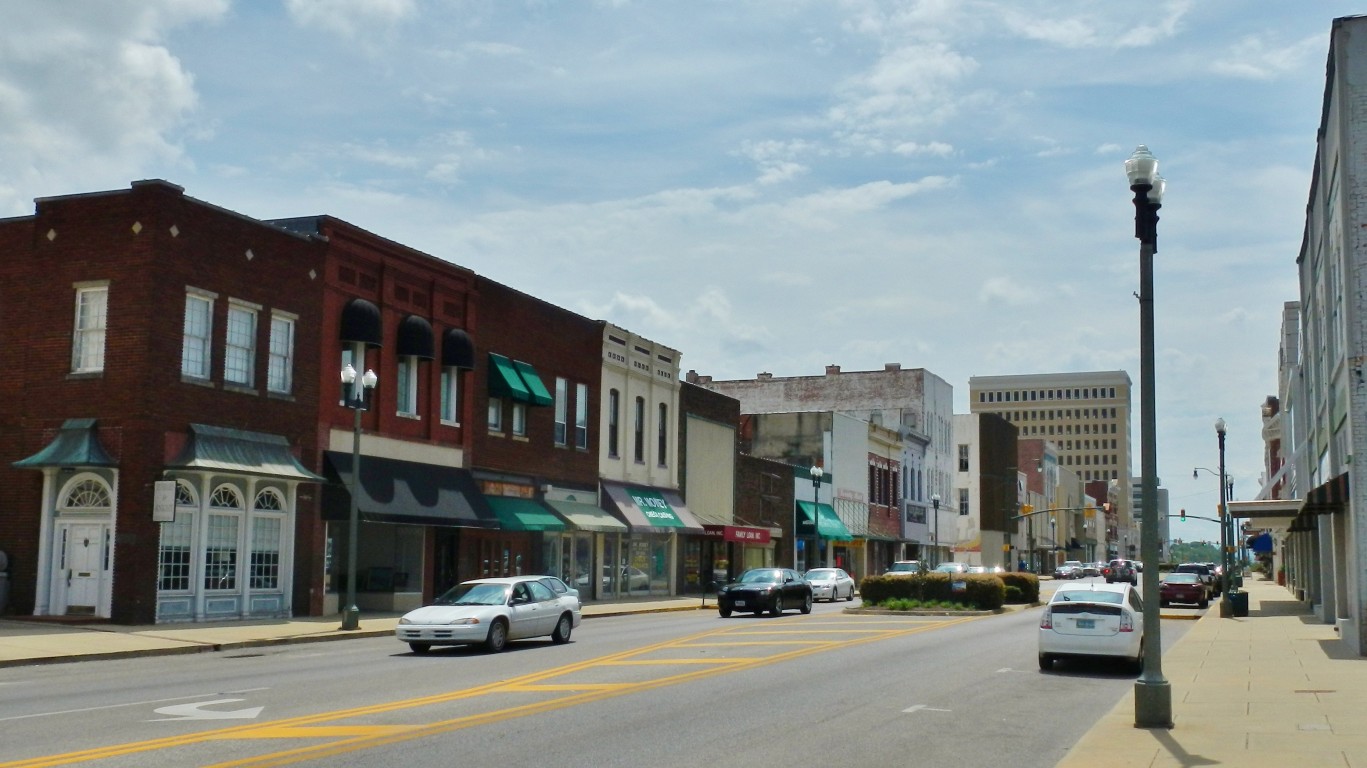
29. Anniston-Oxford-Jacksonville, AL
> High school graduation rate: 92.4%
> 2018 unemployment: 4.7% (bottom 25%)
> Typical income for non-high school graduates: $19,501 (bottom 25%)
> Typical income for HS graduates with no college: $30,772
> Adults with a bachelor’s degree: 18.0% (bottom 10%)

28. Harrisonburg, VA
> High school graduation rate: 92.5%
> 2018 unemployment: 3.0% (top 25%)
> Typical income for non-high school graduates: $30,735 (top 10%)
> Typical income for HS graduates with no college: $30,001
> Adults with a bachelor’s degree: 30.4%

27. Laredo, TX
> High school graduation rate: 92.5%
> 2018 unemployment: 3.8%
> Typical income for non-high school graduates: $18,787 (bottom 10%)
> Typical income for HS graduates with no college: $25,993 (bottom 10%)
> Adults with a bachelor’s degree: 19.9% (bottom 25%)
[in-text-ad-2]

26. Austin-Round Rock, TX
> High school graduation rate: 92.6%
> 2018 unemployment: 2.9% (top 25%)
> Typical income for non-high school graduates: $26,513
> Typical income for HS graduates with no college: $31,553
> Adults with a bachelor’s degree: 46.6% (top 10%)
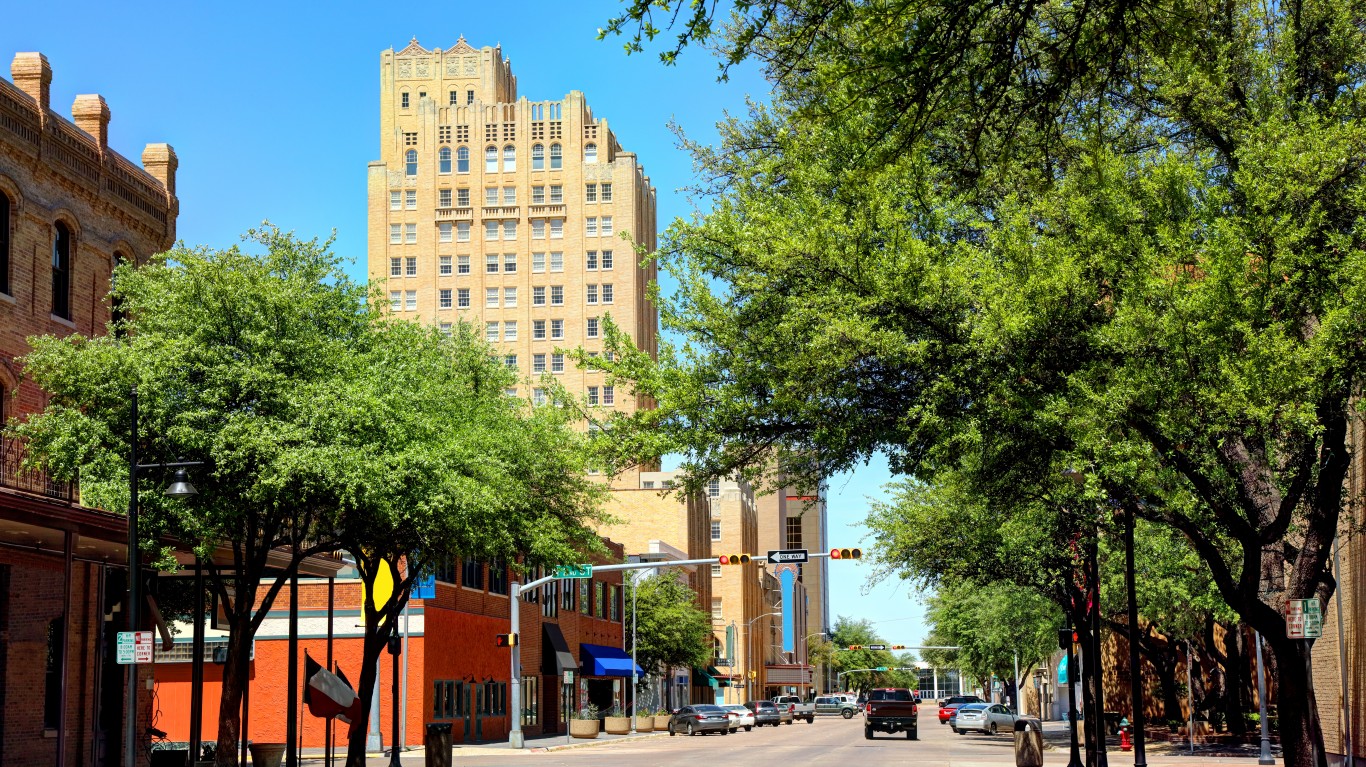
25. Abilene, TX
> High school graduation rate: 92.6%
> 2018 unemployment: 3.3%
> Typical income for non-high school graduates: $25,567
> Typical income for HS graduates with no college: $24,556 (bottom 10%)
> Adults with a bachelor’s degree: 24.7%
[in-text-ad]

24. Sherman-Denison, TX
> High school graduation rate: 92.6%
> 2018 unemployment: 3.2%
> Typical income for non-high school graduates: $20,344 (bottom 25%)
> Typical income for HS graduates with no college: $32,366
> Adults with a bachelor’s degree: 21.1% (bottom 25%)

23. Winchester, VA-WV
> High school graduation rate: 92.6%
> 2018 unemployment: 2.9% (top 25%)
> Typical income for non-high school graduates: $27,156 (top 25%)
> Typical income for HS graduates with no college: $36,578 (top 10%)
> Adults with a bachelor’s degree: 26.3%
22. East Stroudsburg, PA
> High school graduation rate: 92.7%
> 2018 unemployment: 5.4% (bottom 25%)
> Typical income for non-high school graduates: $29,215 (top 25%)
> Typical income for HS graduates with no college: $31,484
> Adults with a bachelor’s degree: 22.0% (bottom 25%)
[in-text-ad-2]

21. Roanoke, VA
> High school graduation rate: 92.7%
> 2018 unemployment: 3.0% (top 25%)
> Typical income for non-high school graduates: $20,614 (bottom 25%)
> Typical income for HS graduates with no college: $31,817
> Adults with a bachelor’s degree: 29.7%
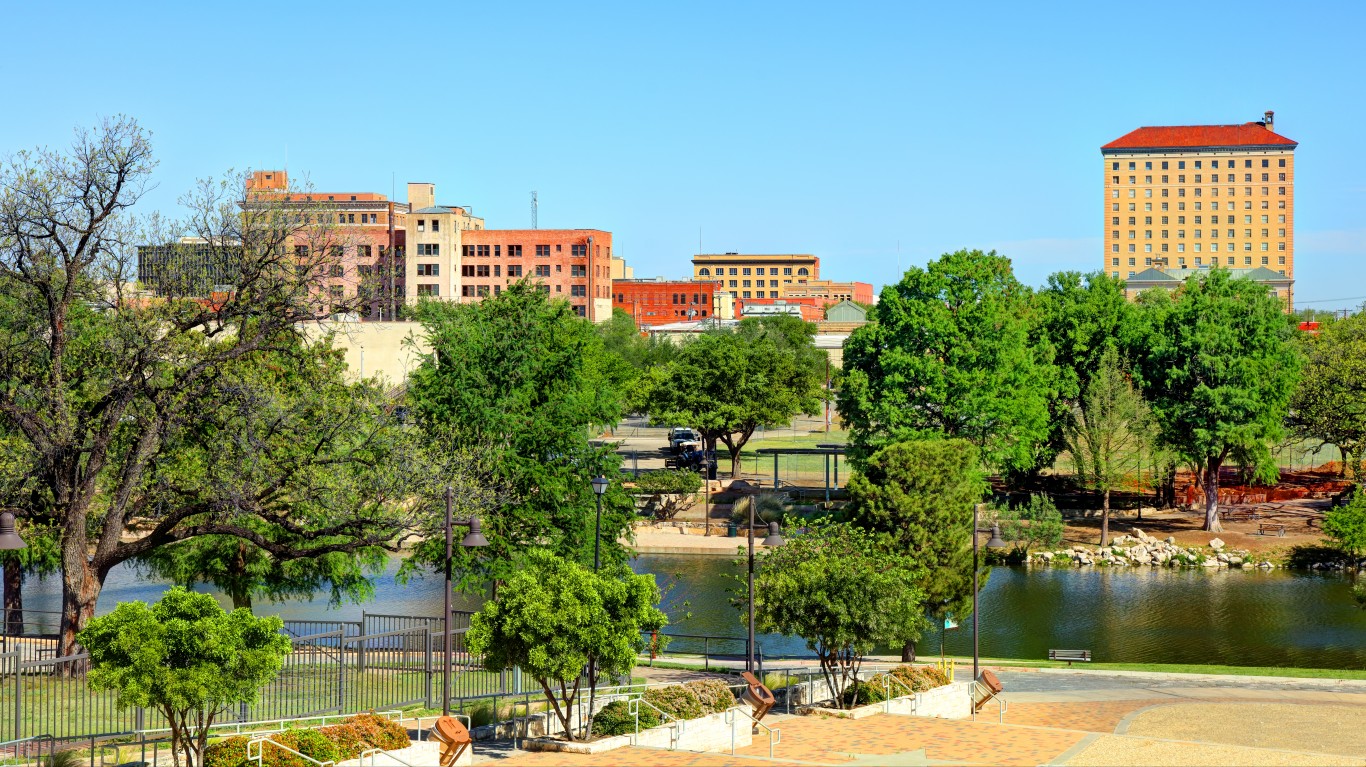
20. San Angelo, TX
> High school graduation rate: 92.8%
> 2018 unemployment: 3.2%
> Typical income for non-high school graduates: $20,778 (bottom 25%)
> Typical income for HS graduates with no college: $31,435
> Adults with a bachelor’s degree: 24.1%
[in-text-ad]
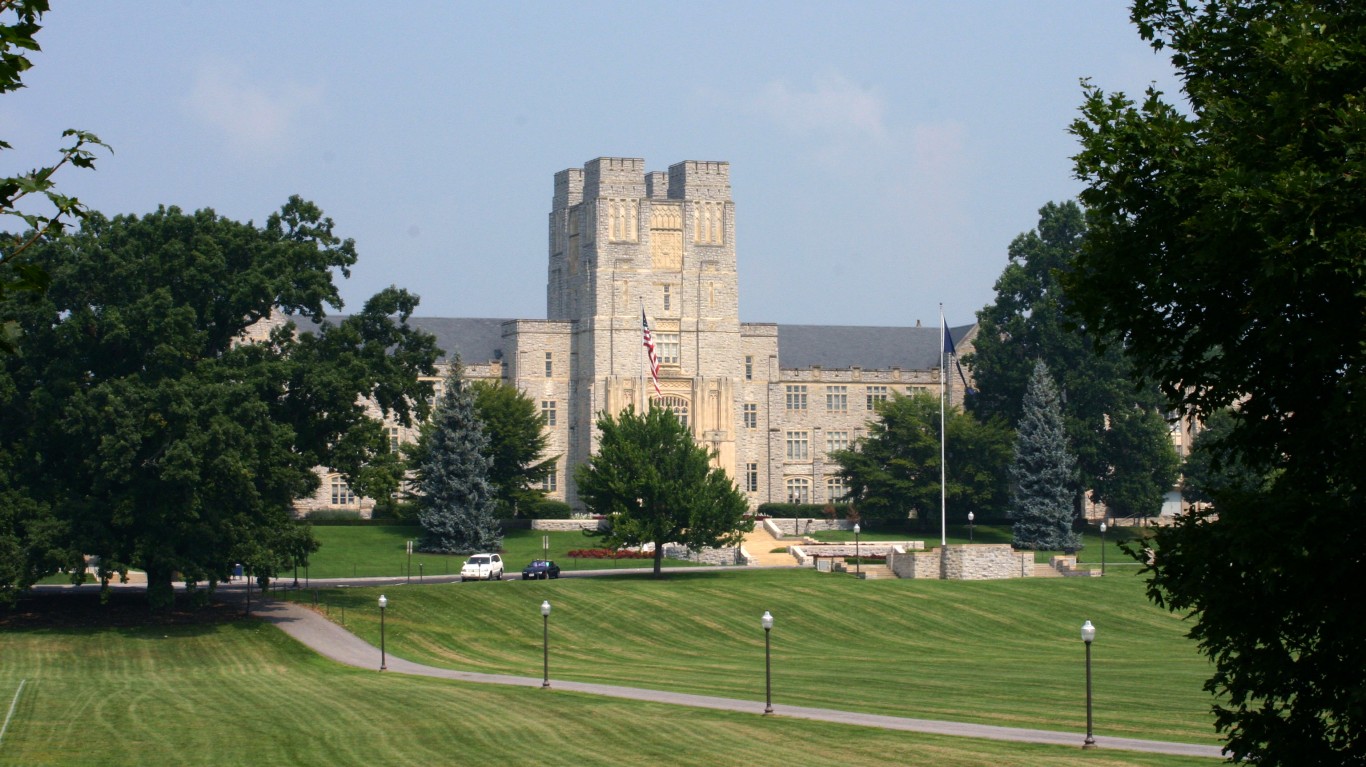
19. Blacksburg-Christiansburg-Radford, VA
> High school graduation rate: 92.9%
> 2018 unemployment: 3.1% (top 25%)
> Typical income for non-high school graduates: $21,505
> Typical income for HS graduates with no college: $30,300
> Adults with a bachelor’s degree: 33.3%
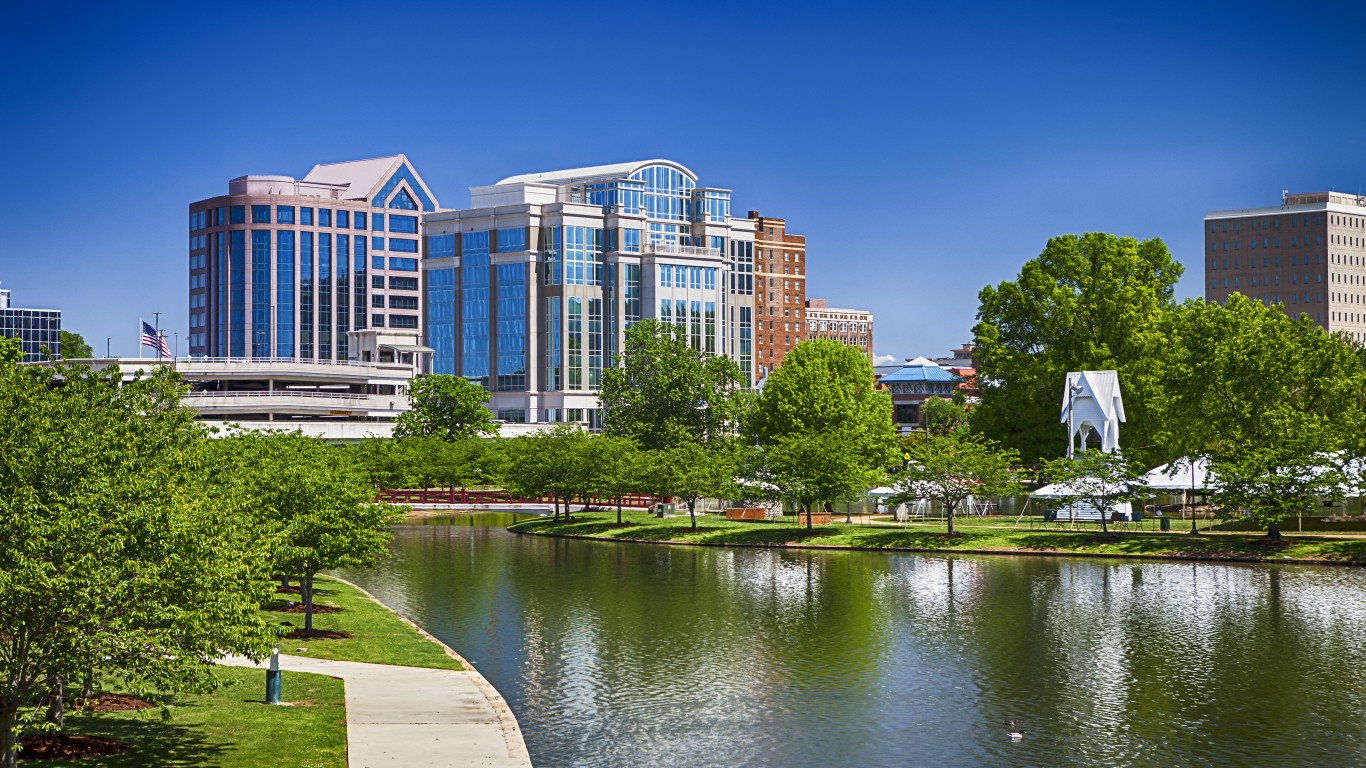
18. Huntsville, AL
> High school graduation rate: 92.9%
> 2018 unemployment: 3.5%
> Typical income for non-high school graduates: $20,915 (bottom 25%)
> Typical income for HS graduates with no college: $26,296 (bottom 10%)
> Adults with a bachelor’s degree: 40.3% (top 25%)

17. Hagerstown-Martinsburg, MD-WV
> High school graduation rate: 93.0%
> 2018 unemployment: 4.2%
> Typical income for non-high school graduates: $26,703 (top 25%)
> Typical income for HS graduates with no college: $36,007 (top 10%)
> Adults with a bachelor’s degree: 21.4% (bottom 25%)
[in-text-ad-2]

16. Johnstown, PA
> High school graduation rate: 93.3%
> 2018 unemployment: 5.2% (bottom 25%)
> Typical income for non-high school graduates: $23,325
> Typical income for HS graduates with no college: $26,096 (bottom 10%)
> Adults with a bachelor’s degree: 21.4% (bottom 25%)
15. Florence-Muscle Shoals, AL
> High school graduation rate: 93.6%
> 2018 unemployment: 4.3%
> Typical income for non-high school graduates: $21,131 (bottom 25%)
> Typical income for HS graduates with no college: $34,009 (top 25%)
> Adults with a bachelor’s degree: 21.3% (bottom 25%)
[in-text-ad]

14. Wausau, WI
> High school graduation rate: 93.6%
> 2018 unemployment: 2.7% (top 25%)
> Typical income for non-high school graduates: $22,761
> Typical income for HS graduates with no college: $33,374 (top 25%)
> Adults with a bachelor’s degree: 27.7%

13. Janesville-Beloit, WI
> High school graduation rate: 93.9%
> 2018 unemployment: 3.2%
> Typical income for non-high school graduates: $28,008 (top 25%)
> Typical income for HS graduates with no college: $33,399 (top 25%)
> Adults with a bachelor’s degree: 22.1% (bottom 25%)
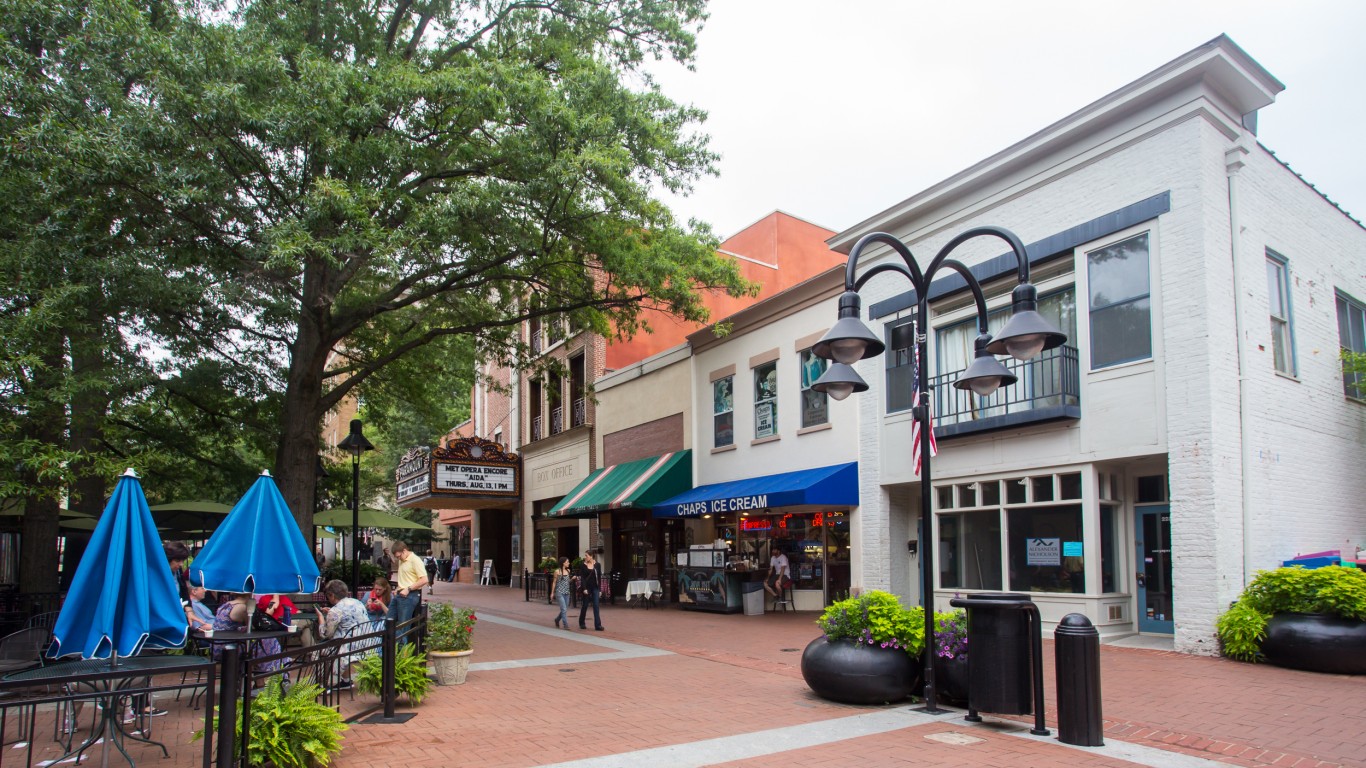
12. Charlottesville, VA
> High school graduation rate: 93.9%
> 2018 unemployment: 2.7% (top 25%)
> Typical income for non-high school graduates: $20,168 (bottom 25%)
> Typical income for HS graduates with no college: $33,333 (top 25%)
> Adults with a bachelor’s degree: 47.8% (top 10%)
[in-text-ad-2]

11. California-Lexington Park, MD
> High school graduation rate: 93.9%
> 2018 unemployment: 3.8%
> Typical income for non-high school graduates: $32,372 (top 10%)
> Typical income for HS graduates with no college: $40,123 (top 10%)
> Adults with a bachelor’s degree: 34.7% (top 25%)

10. Ames, IA
> High school graduation rate: 94.0%
> 2018 unemployment: 1.6% (top 10%)
> Typical income for non-high school graduates: $38,314 (top 10%)
> Typical income for HS graduates with no college: $33,557 (top 25%)
> Adults with a bachelor’s degree: 50.7% (top 10%)
[in-text-ad]
9. Longview, TX
> High school graduation rate: 94.1%
> 2018 unemployment: 4.1%
> Typical income for non-high school graduates: $22,146
> Typical income for HS graduates with no college: $31,215
> Adults with a bachelor’s degree: 17.4% (bottom 10%)

8. Kingsport-Bristol-Bristol, TN-VA
> High school graduation rate: 94.2%
> 2018 unemployment: 3.7%
> Typical income for non-high school graduates: $22,213
> Typical income for HS graduates with no college: $26,955 (bottom 25%)
> Adults with a bachelor’s degree: 21.2% (bottom 25%)

7. Sheboygan, WI
> High school graduation rate: 94.2%
> 2018 unemployment: 2.5% (top 10%)
> Typical income for non-high school graduates: $35,168 (top 10%)
> Typical income for HS graduates with no college: $37,045 (top 10%)
> Adults with a bachelor’s degree: 24.0%
[in-text-ad-2]
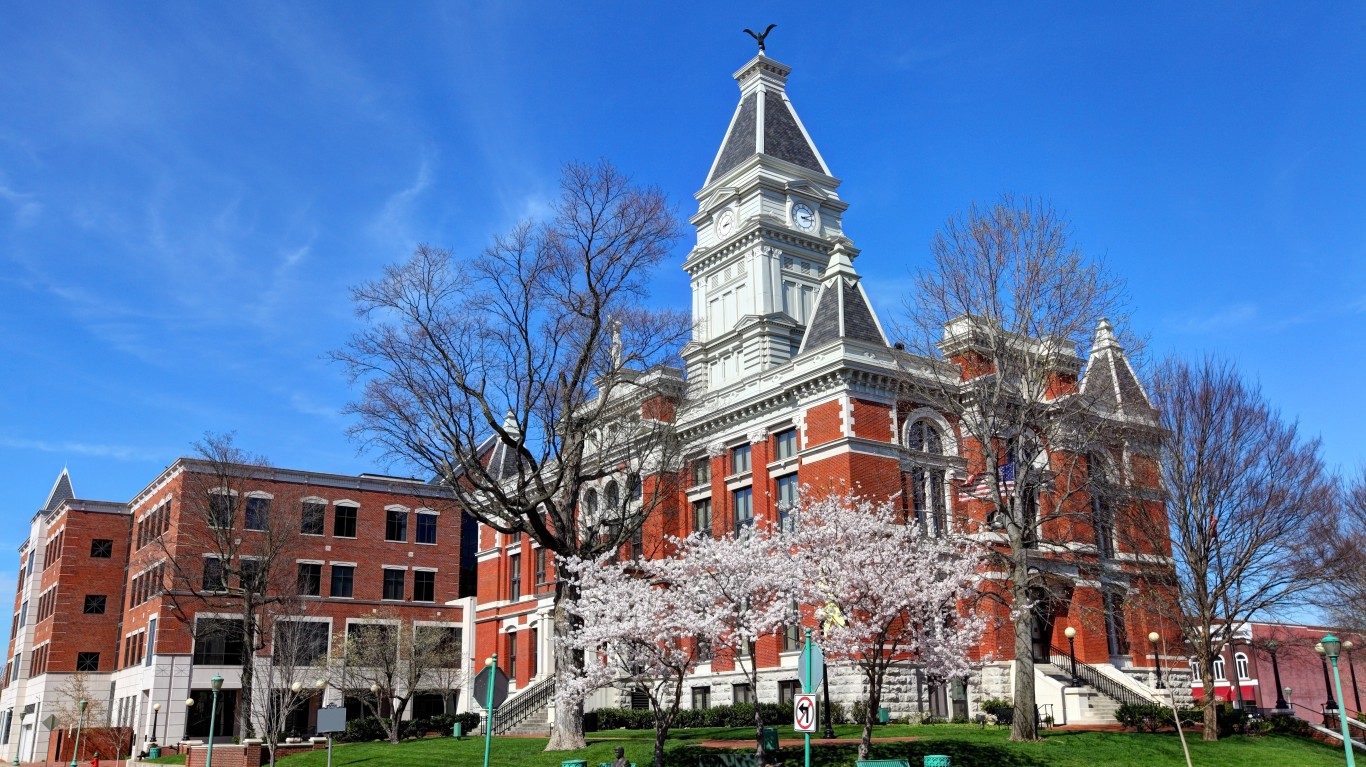
6. Clarksville, TN-KY
> High school graduation rate: 94.6%
> 2018 unemployment: 4.2%
> Typical income for non-high school graduates: $17,425 (bottom 10%)
> Typical income for HS graduates with no college: $32,823 (top 25%)
> Adults with a bachelor’s degree: 27.7%

5. Owensboro, KY
> High school graduation rate: 94.7%
> 2018 unemployment: 4.0%
> Typical income for non-high school graduates: $24,193
> Typical income for HS graduates with no college: $32,348
> Adults with a bachelor’s degree: 21.7% (bottom 25%)
[in-text-ad]
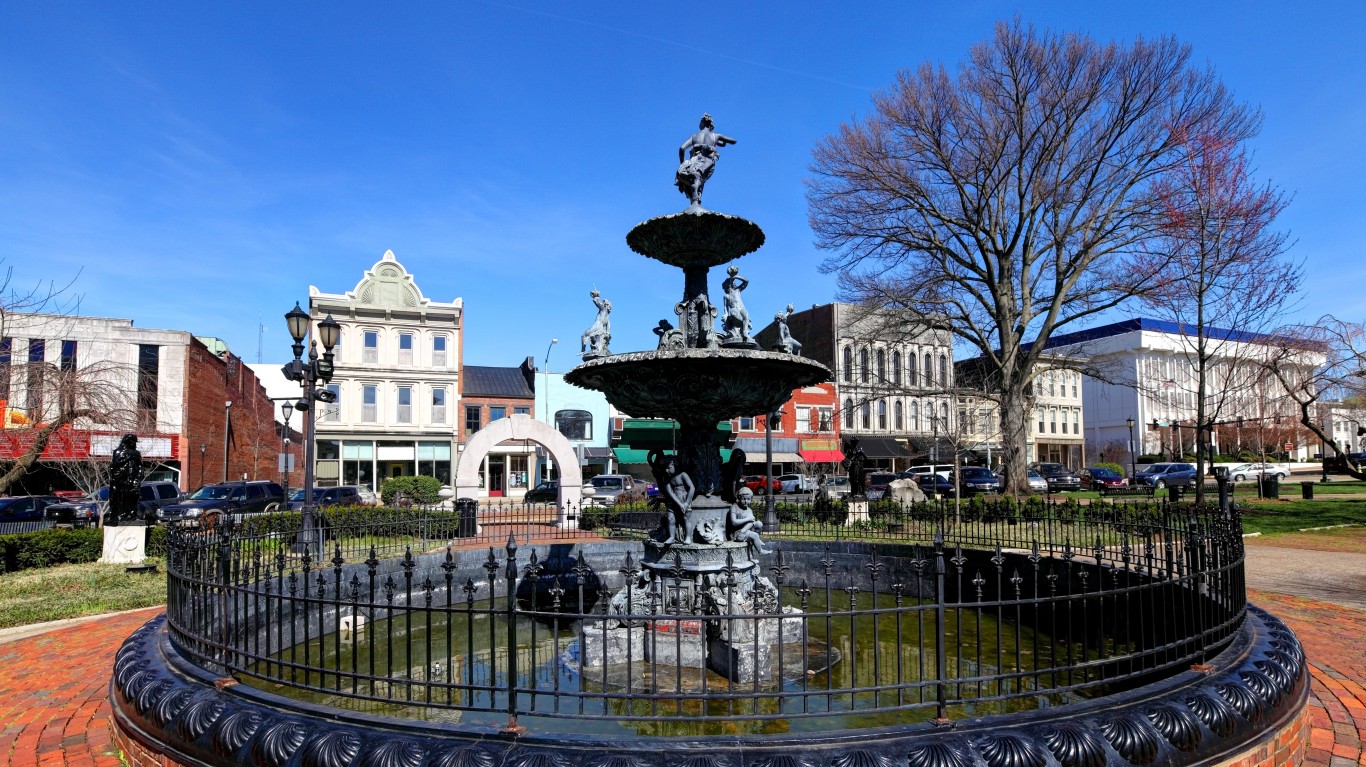
4. Bowling Green, KY
> High school graduation rate: 94.9%
> 2018 unemployment: 3.9%
> Typical income for non-high school graduates: $28,880 (top 25%)
> Typical income for HS graduates with no college: $30,304
> Adults with a bachelor’s degree: 25.3%

3. Morristown, TN
> High school graduation rate: 94.9%
> 2018 unemployment: 3.8%
> Typical income for non-high school graduates: $25,793
> Typical income for HS graduates with no college: $31,625
> Adults with a bachelor’s degree: 17.1% (bottom 10%)
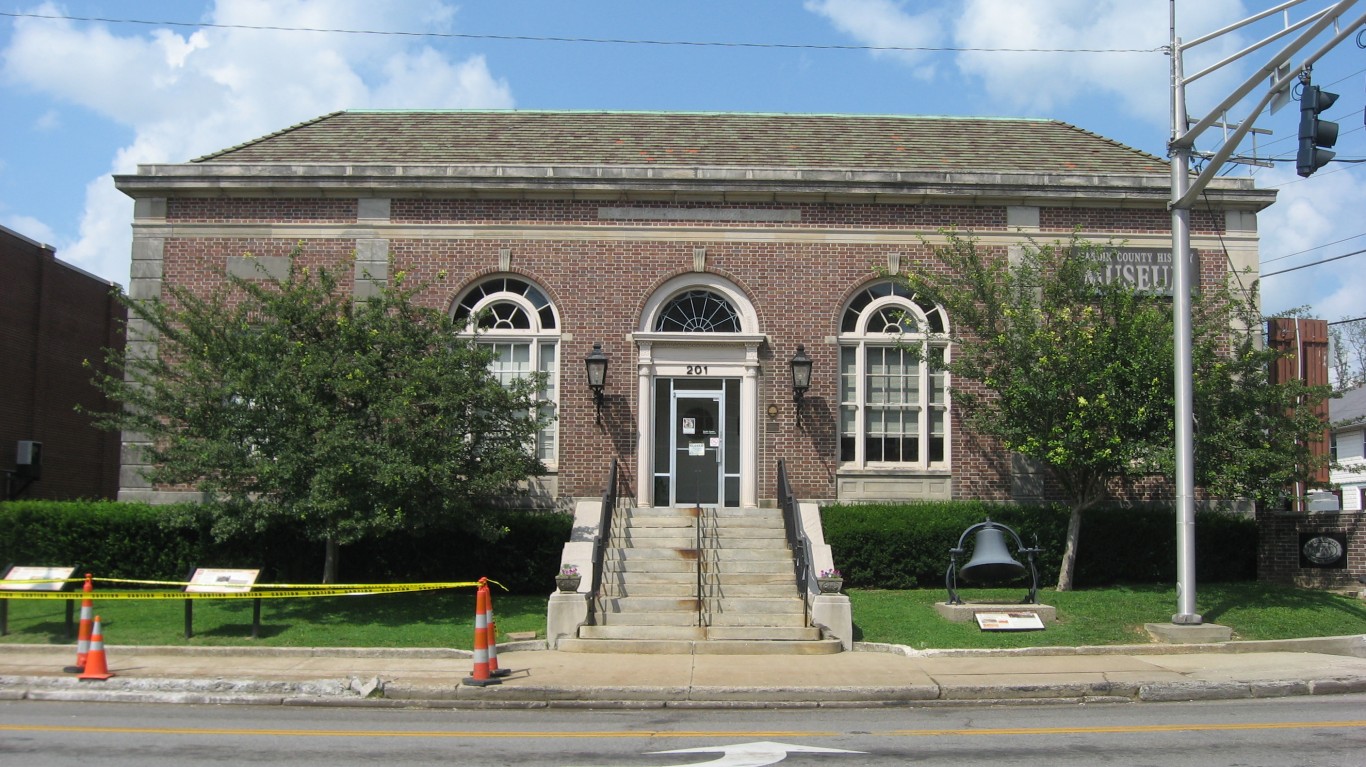
2. Elizabethtown-Fort Knox, KY
> High school graduation rate: 95.1%
> 2018 unemployment: 4.2%
> Typical income for non-high school graduates: $23,266
> Typical income for HS graduates with no college: $28,863
> Adults with a bachelor’s degree: 19.1% (bottom 25%)
[in-text-ad-2]
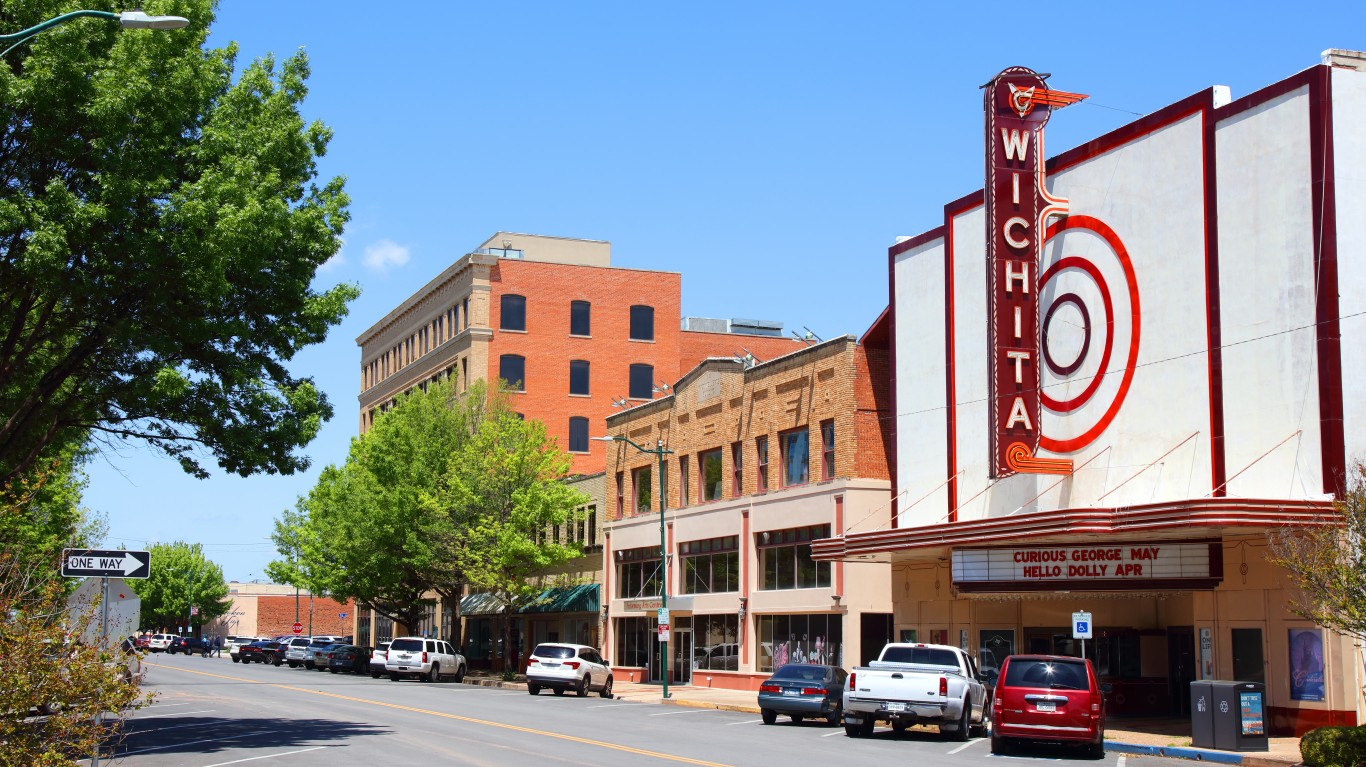
1. Wichita Falls, TX
> High school graduation rate: 96.7%
> 2018 unemployment: 3.4%
> Typical income for non-high school graduates: $17,164 (bottom 10%)
> Typical income for HS graduates with no college: $29,534
> Adults with a bachelor’s degree: 22.9%
Methodology
To determine the high school graduation rates in U.S. metro areas, 24/7 Wall St. reviewed data from the 2019 County Health Rankings & Roadmaps program, a collaboration between the Robert Wood Johnson Foundation and the University of Wisconsin Population Health Institute. High school graduation rates are defined as the percentage of the ninth-grade cohort that graduates in four years. The data represents students graduating on time in the 2016-2017 school year, the most recent available.
In metro areas with insufficient data, graduation rates were imputed with the population of 15-19 year olds in each of the metro area’s counties, provided by the U.S Census Bureau’s American Community Survey, in order to account for counties where a cohort was not provided. Metro areas that did not have at least 80% of their graduating population represented in the county data were excluded from consideration.
The estimate of the median income for adults with less than a high school diploma and the percentage of people with at least a bachelor’s degree come from the 2018 U.S. Census Bureau’s American Community Survey. The 2018 unemployment rate comes from the Bureau of Labor Statistics.
After two decades of reviewing financial products I haven’t seen anything like this. Credit card companies are at war, handing out free rewards and benefits to win the best customers.
A good cash back card can be worth thousands of dollars a year in free money, not to mention other perks like travel, insurance, and access to fancy lounges.
Our top pick today pays up to 5% cash back, a $200 bonus on top, and $0 annual fee. Click here to apply before they stop offering rewards this generous.
Flywheel Publishing has partnered with CardRatings for our coverage of credit card products. Flywheel Publishing and CardRatings may receive a commission from card issuers.
Thank you for reading! Have some feedback for us?
Contact the 24/7 Wall St. editorial team.