The United States is in the midst of its longest period of job growth in history. The total number of jobs in the country has increased for 108 consecutive months, driving down the unemployment rate. When people have good, stable jobs, they have better financial security. Nationwide, certain metro areas have benefitted from these strong economic conditions more than others.
24/7 Wall St. reviewed the share of residents living in households with incomes below the poverty line in 382 U.S. metro areas with one-year data from the U.S. Census Bureau’s 2018 American Community Survey to identify the cities with the lowest poverty rates.
The metro areas with the lowest poverty rates are spread out relatively evenly across the country. There are 42 metro areas, in 22 different states and Washington D.C., with a poverty rate of 9.3% or less — well below the national 13.1% poverty rate. California has five metro areas on this list, more than any other state, while Wisconsin and Washington each have four.
It should come as no surprise that many of these cities with a low share of residents living in poverty have many other positive economic indicators, such as low unemployment. These are the cities adding the most jobs in every state.
Not all of the metro areas with the lowest poverty rates are necessarily wealthy. Some places on the West Coast — like San Jose, San Francisco, and Seattle — are home to many wealthy residents and have median annual household incomes near or above $100,000. Yet many midwestern cities on this list have low poverty rates while having median household incomes close to or below the national median. These are America’s richest and poorest states.
Click here to see cities with the lowest poverty rates.
Click here to see our methodology.

42. Bend-Redmond, OR
> Poverty rate: 9.3% (Oregon: 12.6%)
> 2018 unemployment: 4.2% (Oregon: 4.2%)
> Households receiving SNAP benefits: 10.9% (Oregon: 14.7%)
> Median household income: $67,577 (Oregon: $63,426)
[in-text-ad]

41. Worcester, MA-CT
> Poverty rate: 9.3% (Massachusetts: 10.0%)
> 2018 unemployment: 3.6% (Massachusetts: 3.3%)
> Households receiving SNAP benefits: 12.3% (Massachusetts: 11.5%)
> Median household income: $70,869 (Massachusetts: $79,835)
[recirclink id=578236]

40. Des Moines-West Des Moines, IA
> Poverty rate: 9.3% (Iowa: 11.2%)
> 2018 unemployment: 2.4% (Iowa: 2.5%)
> Households receiving SNAP benefits: 9.3% (Iowa: 9.6%)
> Median household income: $71,352 (Iowa: $59,955)

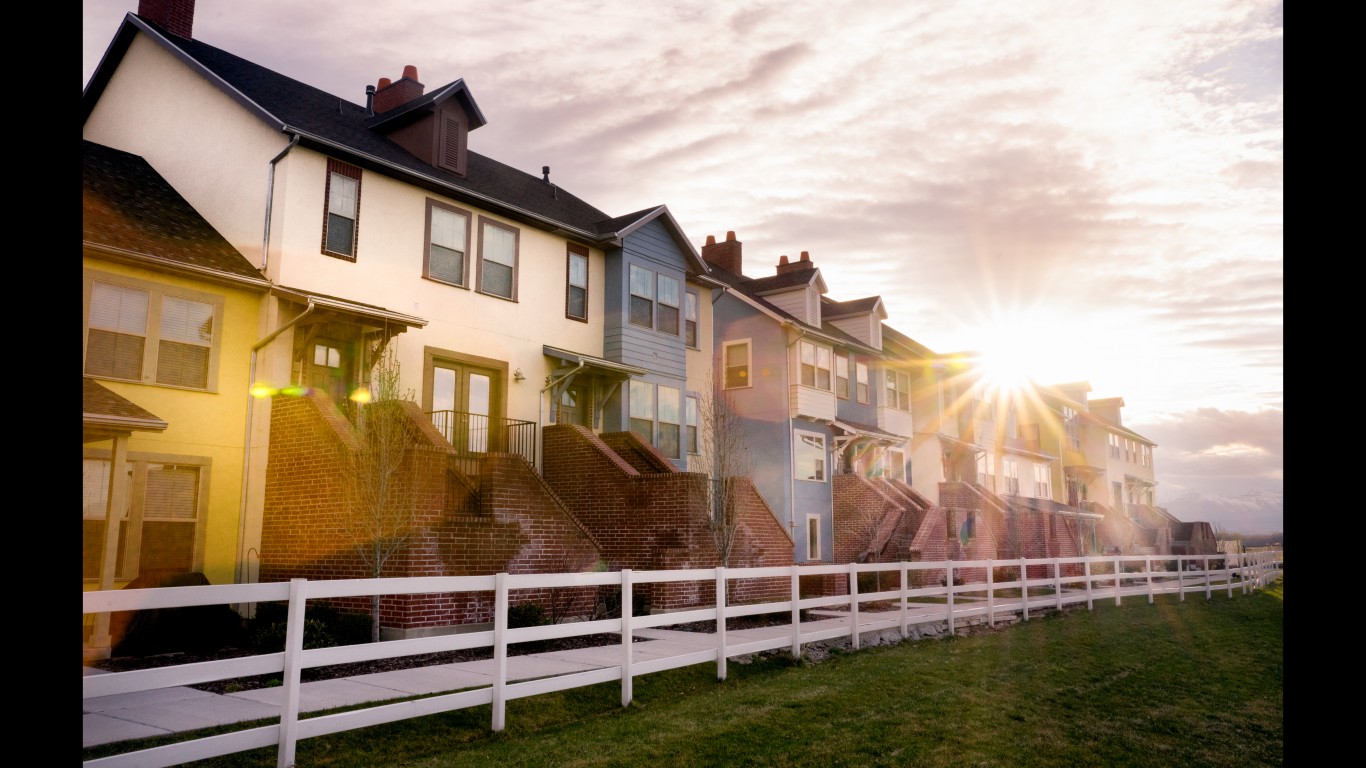
39. Provo-Orem, UT
> Poverty rate: 9.3% (Utah: 9.0%)
> 2018 unemployment: 2.8% (Utah: 3.1%)
> Households receiving SNAP benefits: 5.6% (Utah: 6.5%)
> Median household income: $75,344 (Utah: $71,414)
[in-text-ad-2]

38. Boston-Cambridge-Newton, MA-NH
> Poverty rate: 9.2% (Massachusetts: 10.0%)
> 2018 unemployment: 3.0% (Massachusetts: 3.3%)
> Households receiving SNAP benefits: 9.7% (Massachusetts: 11.5%)
> Median household income: $88,711 (Massachusetts: $79,835)
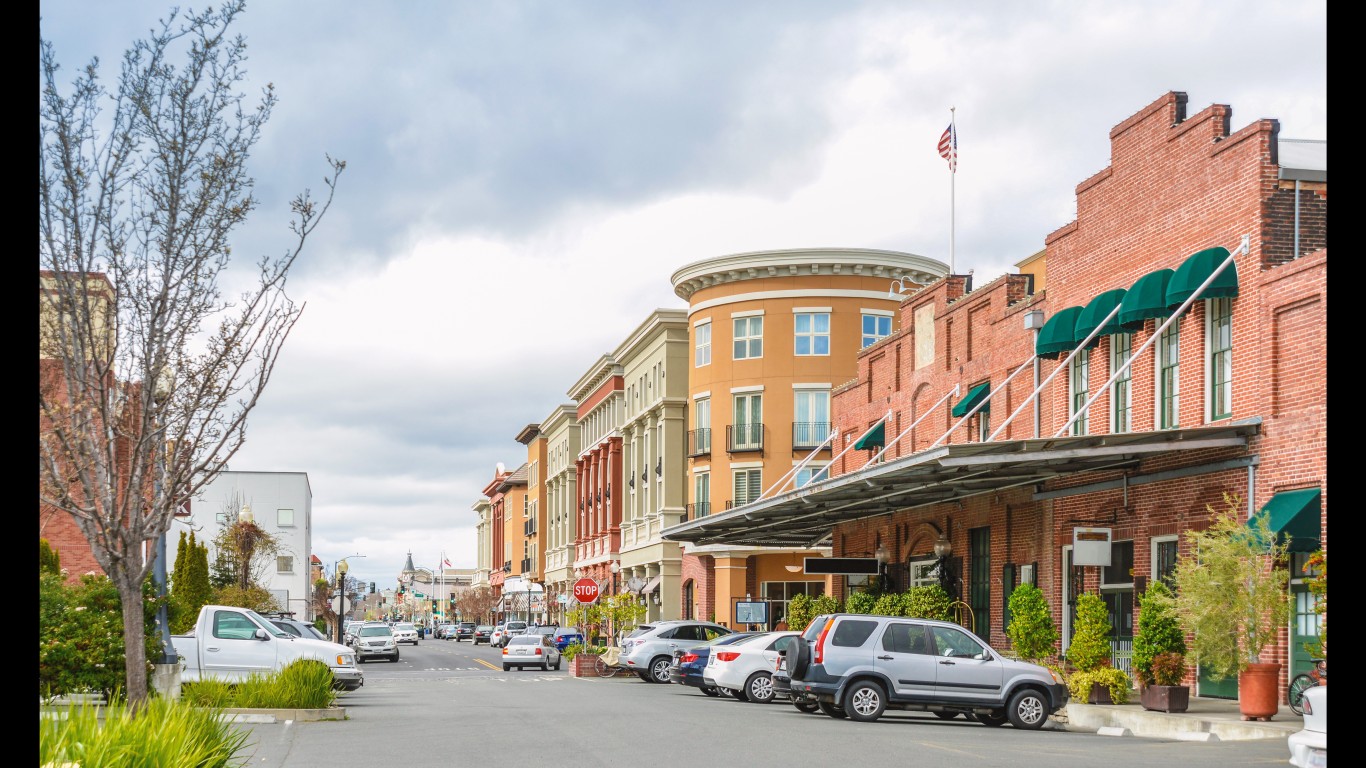
37. Napa, CA
> Poverty rate: 9.1% (California: 12.8%)
> 2018 unemployment: 2.9% (California: 4.2%)
> Households receiving SNAP benefits: 7.4% (California: 8.5%)
> Median household income: $87,025 (California: $75,277)
[in-text-ad]

36. Bremerton-Silverdale, WA
> Poverty rate: 9.0% (Washington: 10.3%)
> 2018 unemployment: 4.6% (Washington: 4.5%)
> Households receiving SNAP benefits: 10.0% (Washington: 11.1%)
> Median household income: $76,945 (Washington: $74,073)
[recirclink id=562215]

35. Daphne-Fairhope-Foley, AL
> Poverty rate: 8.9% (Alabama: 16.8%)
> 2018 unemployment: 3.6% (Alabama: 3.9%)
> Households receiving SNAP benefits: 7.6% (Alabama: 13.3%)
> Median household income: $56,813 (Alabama: $49,861)
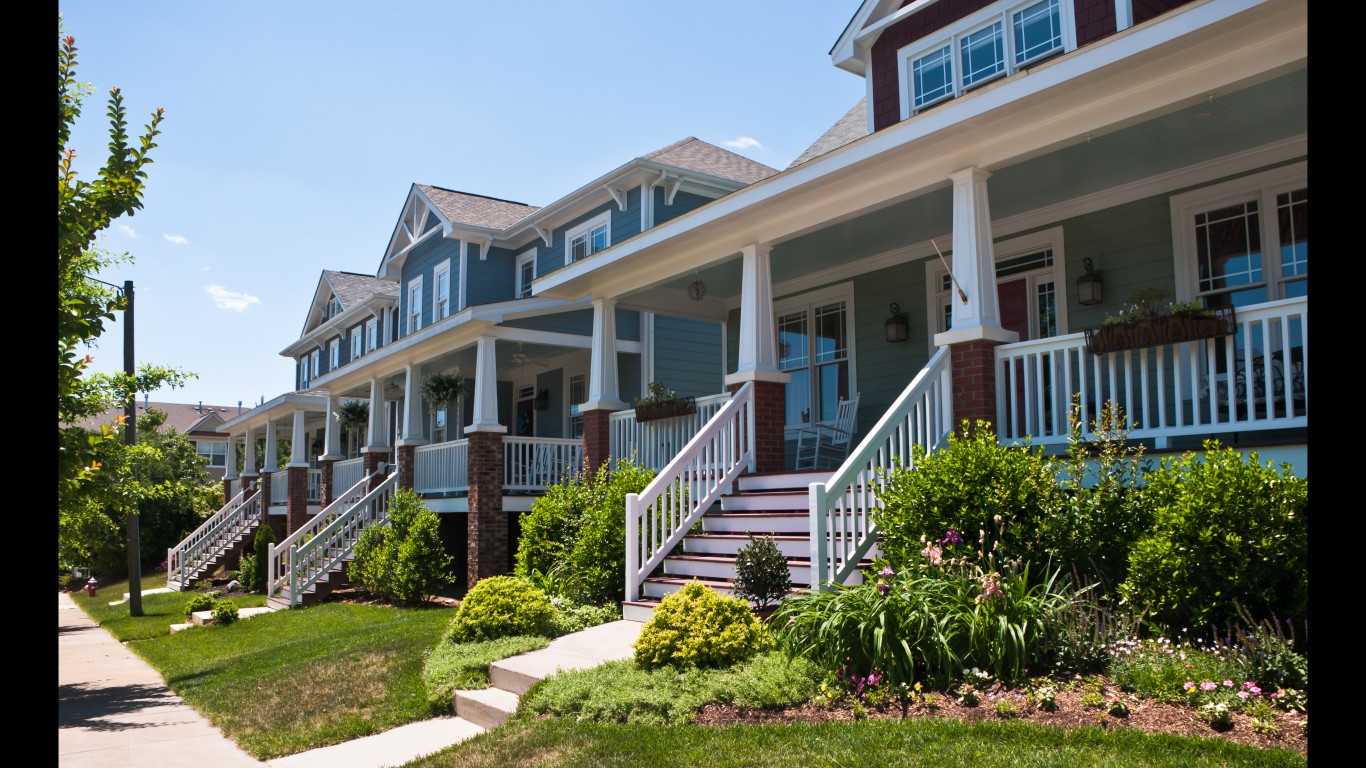
34. Raleigh, NC
> Poverty rate: 8.9% (North Carolina: 14.0%)
> 2018 unemployment: 3.4% (North Carolina: 3.9%)
> Households receiving SNAP benefits: 7.3% (North Carolina: 11.6%)
> Median household income: $75,165 (North Carolina: $53,855)
[in-text-ad-2]

33. Oxnard-Thousand Oaks-Ventura, CA
> Poverty rate: 8.9% (California: 12.8%)
> 2018 unemployment: 3.8% (California: 4.2%)
> Households receiving SNAP benefits: 7.5% (California: 8.5%)
> Median household income: $84,566 (California: $75,277)
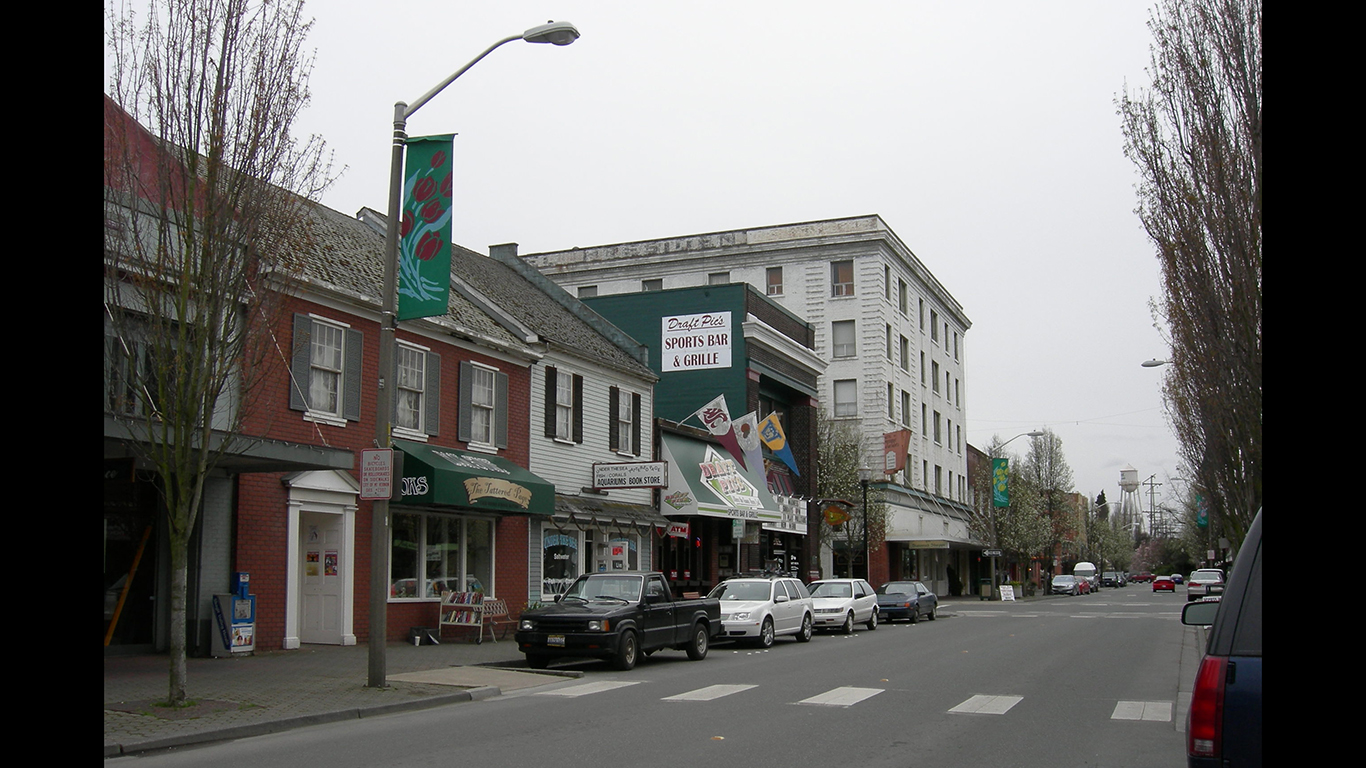
32. Mount Vernon-Anacortes, WA
> Poverty rate: 8.8% (Washington: 10.3%)
> 2018 unemployment: 5.2% (Washington: 4.5%)
> Households receiving SNAP benefits: 11.8% (Washington: 11.1%)
> Median household income: $73,206 (Washington: $74,073)
[in-text-ad]
31. Salt Lake City, UT
> Poverty rate: 8.8% (Utah: 9.0%)
> 2018 unemployment: 3.0% (Utah: 3.1%)
> Households receiving SNAP benefits: 6.7% (Utah: 6.5%)
> Median household income: $73,730 (Utah: $71,414)
[recirclink id=562217]

30. Jefferson City, MO
> Poverty rate: 8.7% (Missouri: 13.2%)
> 2018 unemployment: 2.7% (Missouri: 3.2%)
> Households receiving SNAP benefits: 8.0% (Missouri: 10.7%)
> Median household income: $60,281 (Missouri: $54,478)

29. York-Hanover, PA
> Poverty rate: 8.7% (Pennsylvania: 12.2%)
> 2018 unemployment: 3.9% (Pennsylvania: 4.3%)
> Households receiving SNAP benefits: 11.5% (Pennsylvania: 13.4%)
> Median household income: $65,239 (Pennsylvania: $60,905)
[in-text-ad-2]
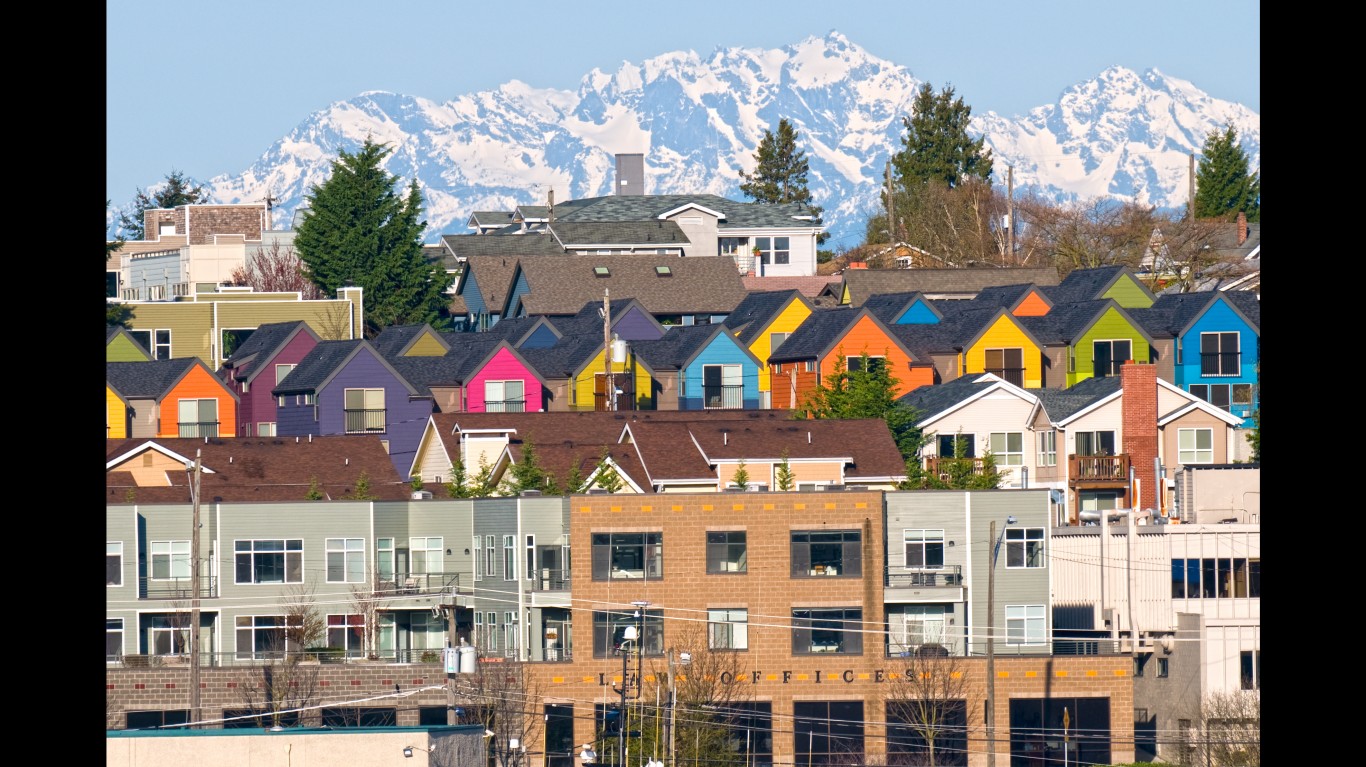
28. Seattle-Tacoma-Bellevue, WA
> Poverty rate: 8.7% (Washington: 10.3%)
> 2018 unemployment: 3.9% (Washington: 4.5%)
> Households receiving SNAP benefits: 8.7% (Washington: 11.1%)
> Median household income: $87,910 (Washington: $74,073)

27. Sioux Falls, SD
> Poverty rate: 8.6% (South Dakota: 13.1%)
> 2018 unemployment: 2.5% (South Dakota: 3.0%)
> Households receiving SNAP benefits: 8.1% (South Dakota: 8.1%)
> Median household income: $61,196 (South Dakota: $56,274)
[in-text-ad]

26. Minneapolis-St. Paul-Bloomington, MN-WI
> Poverty rate: 8.5% (Minnesota: 9.6%)
> 2018 unemployment: 2.7% (Minnesota: 2.9%)
> Households receiving SNAP benefits: 6.9% (Minnesota: 7.3%)
> Median household income: $79,578 (Minnesota: $70,315)
[recirclink id=562229]
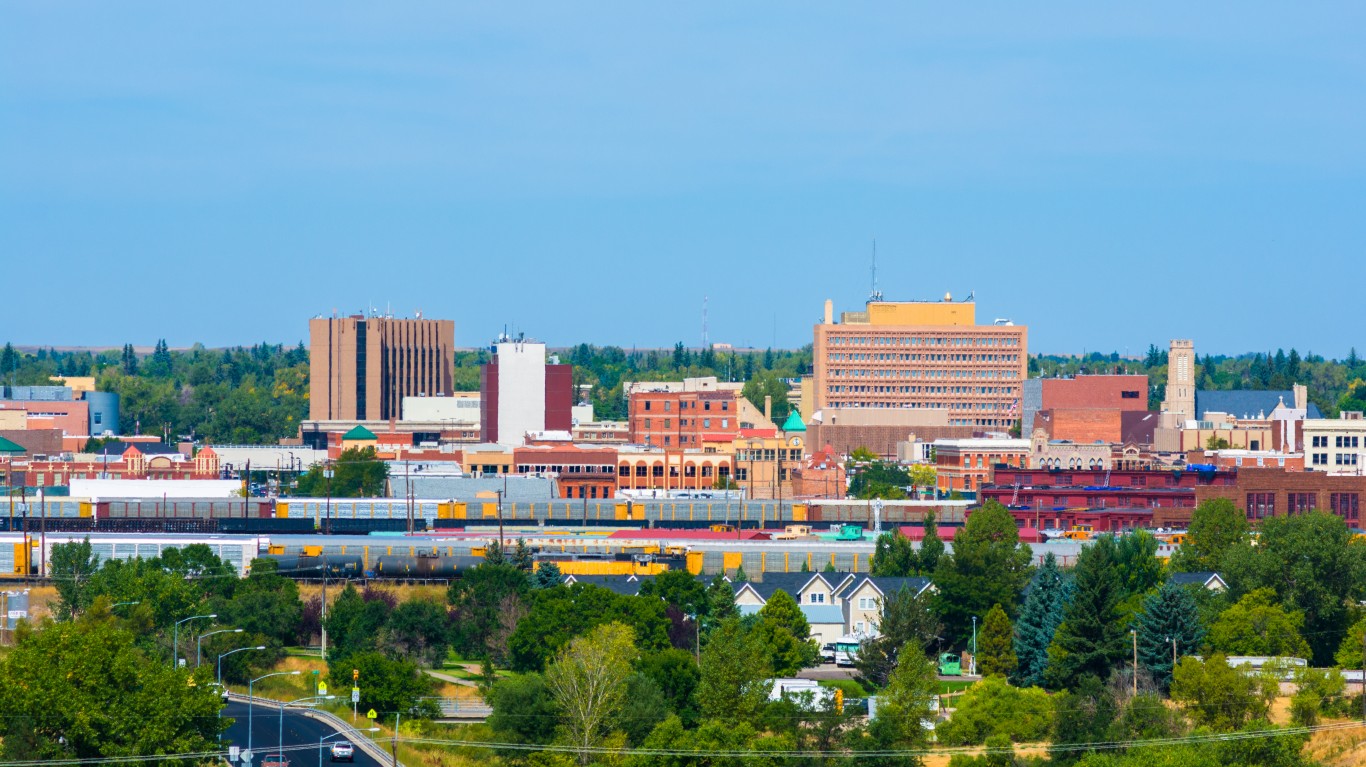
25. Cheyenne, WY
> Poverty rate: 8.4% (Wyoming: 11.1%)
> 2018 unemployment: 3.9% (Wyoming: 4.1%)
> Households receiving SNAP benefits: 7.4% (Wyoming: 5.0%)
> Median household income: $64,306 (Wyoming: $61,584)
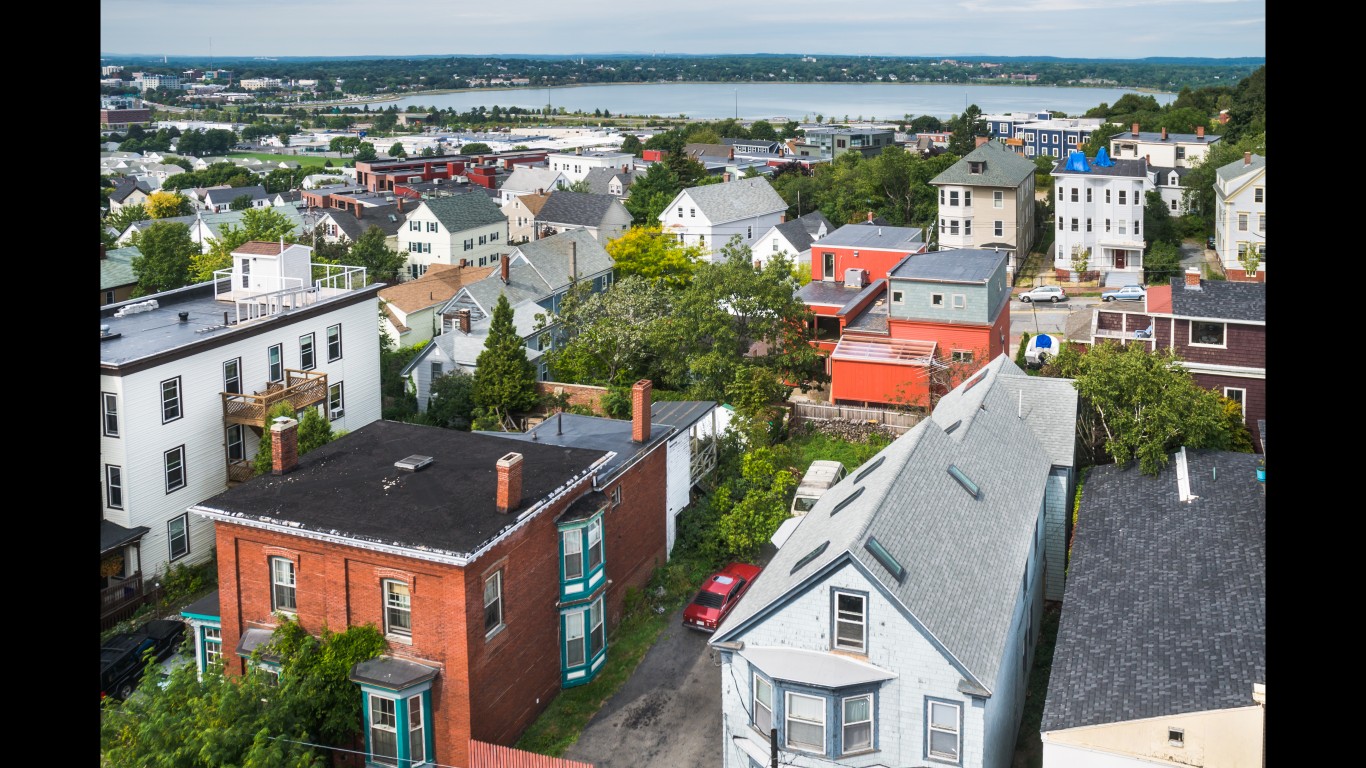
24. Portland-South Portland, ME
> Poverty rate: 8.4% (Maine: 11.6%)
> 2018 unemployment: 2.7% (Maine: 3.4%)
> Households receiving SNAP benefits: 8.2% (Maine: 12.9%)
> Median household income: $69,980 (Maine: $55,602)
[in-text-ad-2]

23. Olympia-Tumwater, WA
> Poverty rate: 8.4% (Washington: 10.3%)
> 2018 unemployment: 4.8% (Washington: 4.5%)
> Households receiving SNAP benefits: 11.7% (Washington: 11.1%)
> Median household income: $72,703 (Washington: $74,073)

22. Green Bay, WI
> Poverty rate: 8.3% (Wisconsin: 11.0%)
> 2018 unemployment: 2.8% (Wisconsin: 3.0%)
> Households receiving SNAP benefits: 7.3% (Wisconsin: 10.0%)
> Median household income: $61,400 (Wisconsin: $60,773)
[in-text-ad]

21. San Francisco-Oakland-Hayward, CA
> Poverty rate: 8.3% (California: 12.8%)
> 2018 unemployment: 2.7% (California: 4.2%)
> Households receiving SNAP benefits: 5.1% (California: 8.5%)
> Median household income: $107,898 (California: $75,277)
[recirclink id=578319]
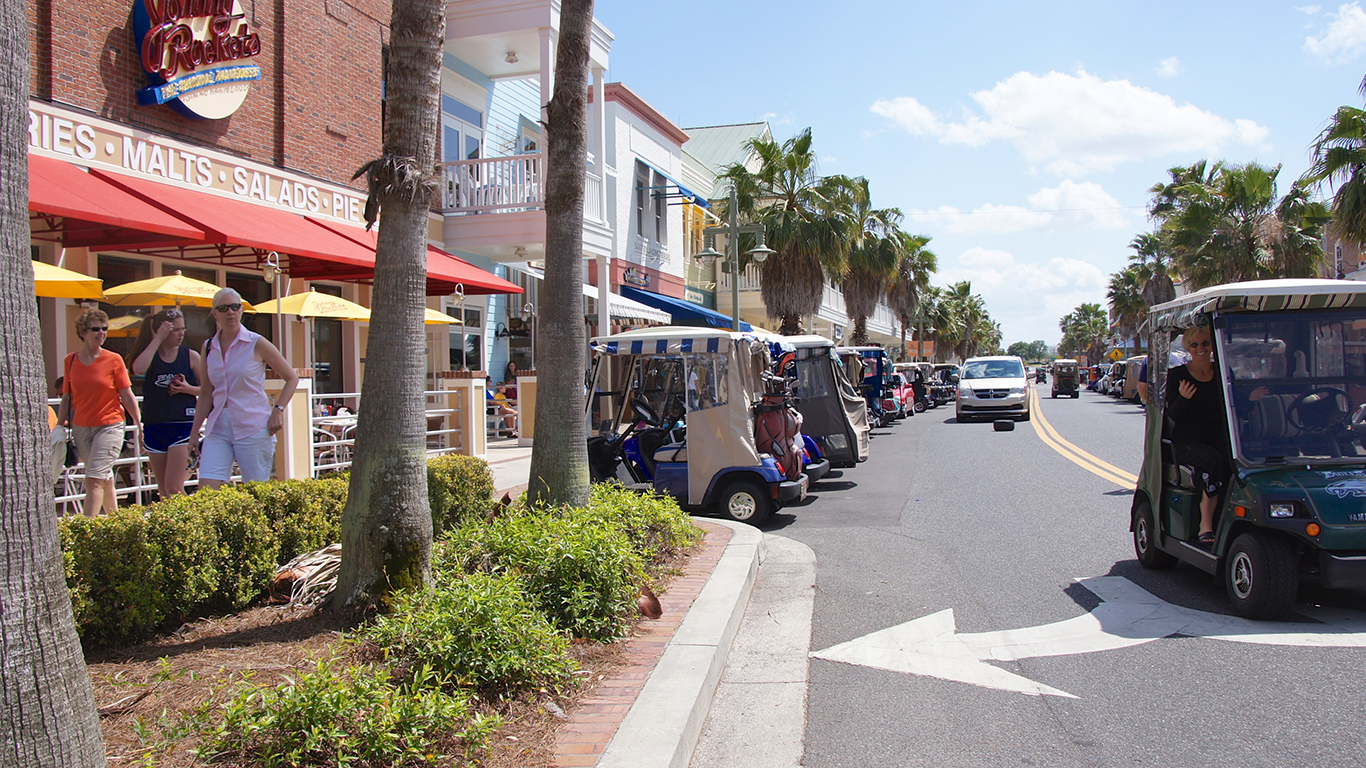
20. The Villages, FL
> Poverty rate: 8.2% (Florida: 13.6%)
> 2018 unemployment: 5.1% (Florida: 3.6%)
> Households receiving SNAP benefits: 4.7% (Florida: 13.8%)
> Median household income: $53,895 (Florida: $55,462)

19. California-Lexington Park, MD
> Poverty rate: 8.2% (Maryland: 9.0%)
> 2018 unemployment: 3.8% (Maryland: 3.9%)
> Households receiving SNAP benefits: 5.9% (Maryland: 9.4%)
> Median household income: $92,250 (Maryland: $83,242)
[in-text-ad-2]

18. Fairbanks, AK
> Poverty rate: 8.1% (Alaska: 10.9%)
> 2018 unemployment: 5.8% (Alaska: 6.6%)
> Households receiving SNAP benefits: 5.3% (Alaska: 10.9%)
> Median household income: $75,448 (Alaska: $74,346)

17. Denver-Aurora-Lakewood, CO
> Poverty rate: 8.0% (Colorado: 9.6%)
> 2018 unemployment: 3.2% (Colorado: 3.3%)
> Households receiving SNAP benefits: 5.9% (Colorado: 7.2%)
> Median household income: $79,478 (Colorado: $71,953)
[in-text-ad]
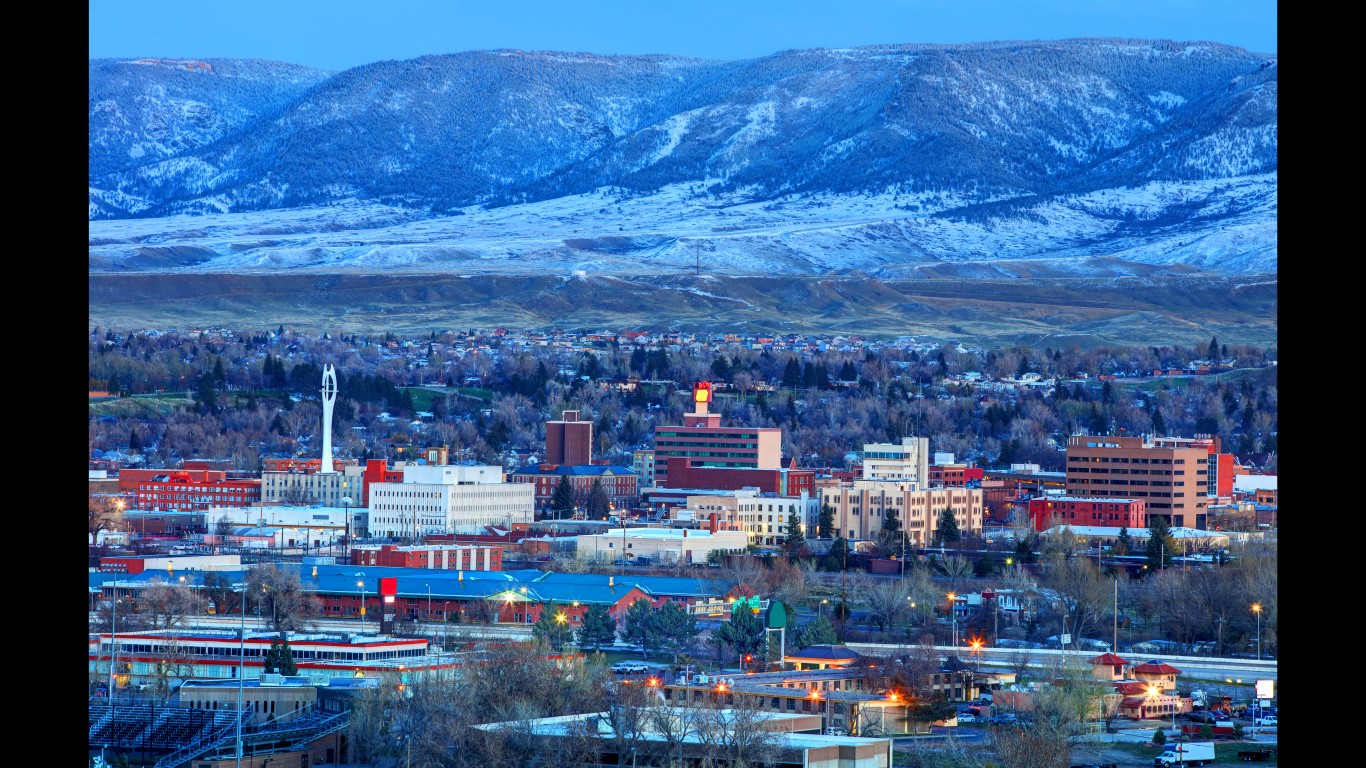
16. Casper, WY
> Poverty rate: 7.9% (Wyoming: 11.1%)
> 2018 unemployment: 4.6% (Wyoming: 4.1%)
> Households receiving SNAP benefits: 4.9% (Wyoming: 5.0%)
> Median household income: $64,833 (Wyoming: $61,584)
[recirclink id=575006]
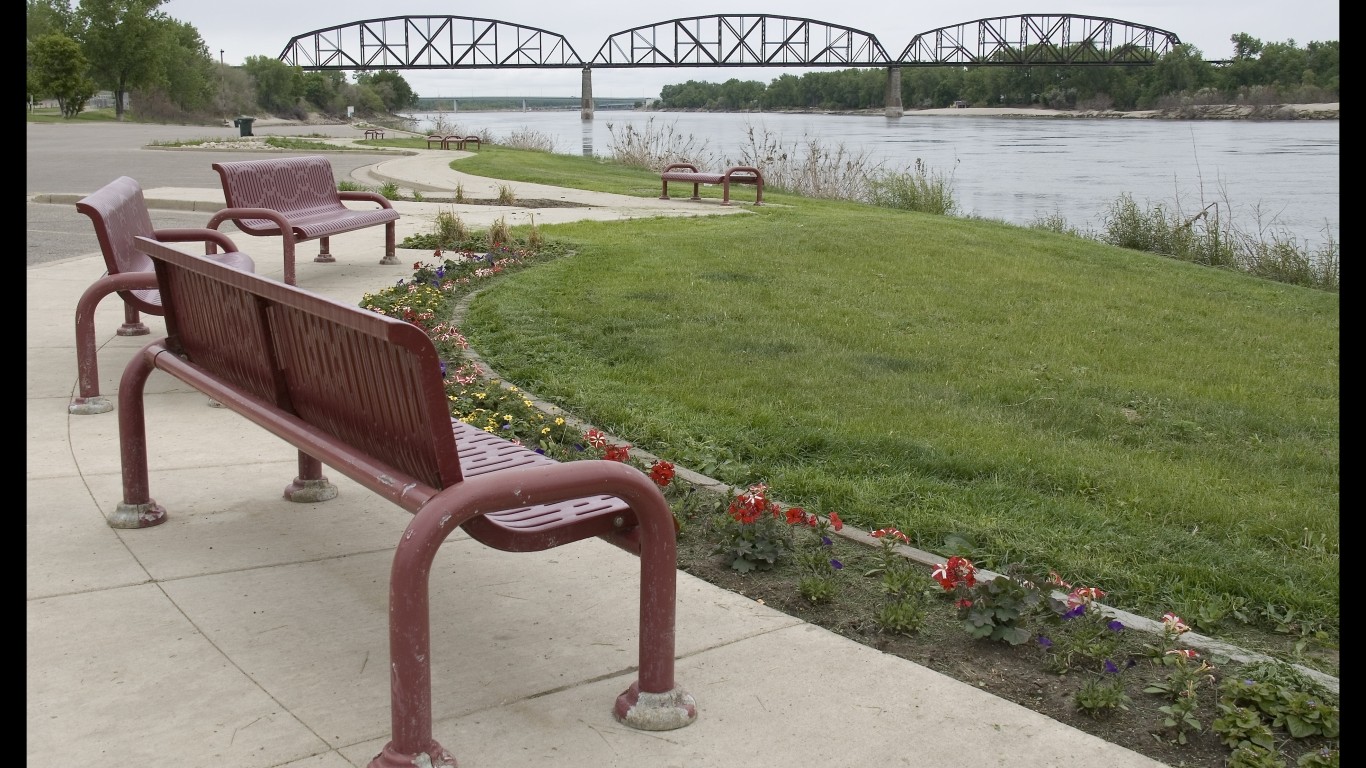
15. Bismarck, ND
> Poverty rate: 7.9% (North Dakota: 10.7%)
> 2018 unemployment: 2.8% (North Dakota: 2.6%)
> Households receiving SNAP benefits: 7.6% (North Dakota: 7.0%)
> Median household income: $70,550 (North Dakota: $63,837)

14. Urban Honolulu, HI
> Poverty rate: 7.8% (Hawaii: 8.8%)
> 2018 unemployment: 2.3% (Hawaii: 2.4%)
> Households receiving SNAP benefits: 8.3% (Hawaii: 10.0%)
> Median household income: $84,423 (Hawaii: $80,212)
[in-text-ad-2]
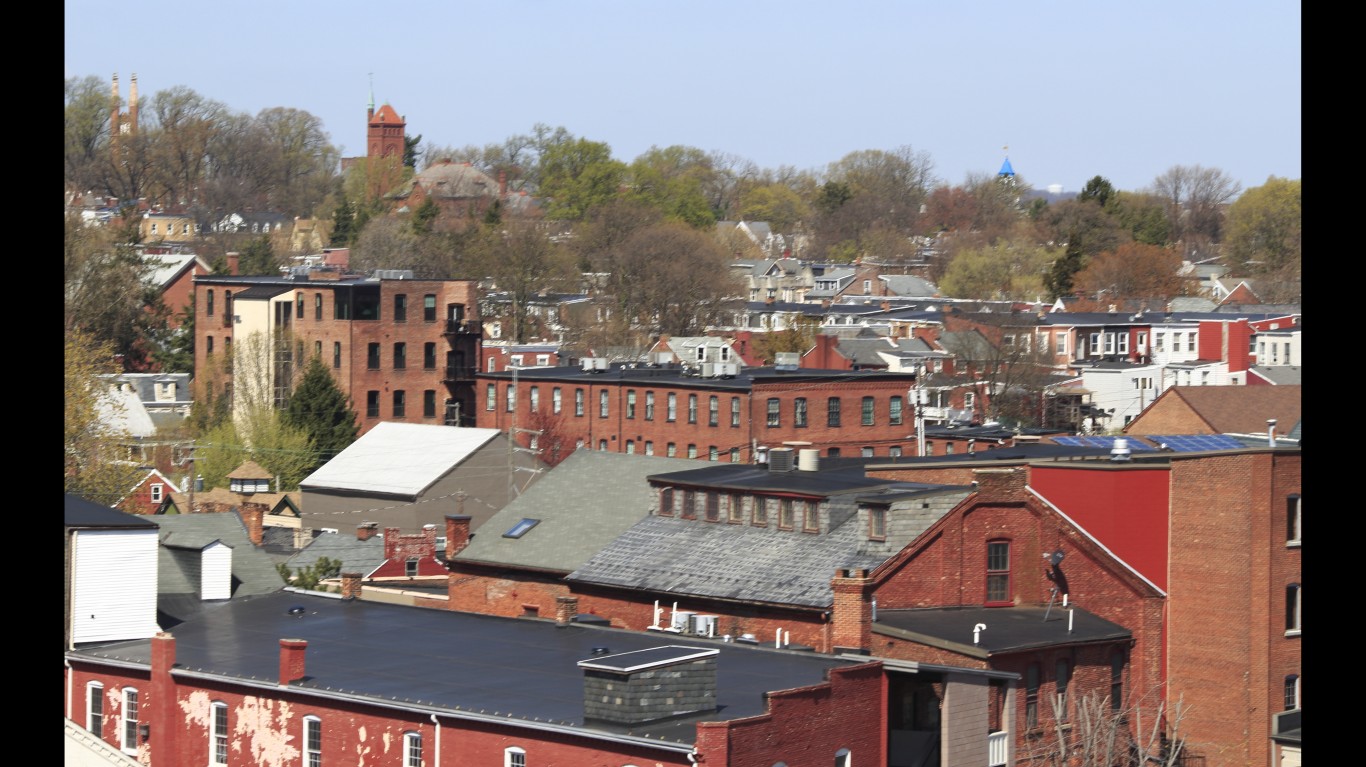
13. Lancaster, PA
> Poverty rate: 7.6% (Pennsylvania: 12.2%)
> 2018 unemployment: 3.4% (Pennsylvania: 4.3%)
> Households receiving SNAP benefits: 8.6% (Pennsylvania: 13.4%)
> Median household income: $66,277 (Pennsylvania: $60,905)

12. Barnstable Town, MA
> Poverty rate: 7.6% (Massachusetts: 10.0%)
> 2018 unemployment: 4.1% (Massachusetts: 3.3%)
> Households receiving SNAP benefits: 6.5% (Massachusetts: 11.5%)
> Median household income: $68,902 (Massachusetts: $79,835)
[in-text-ad]
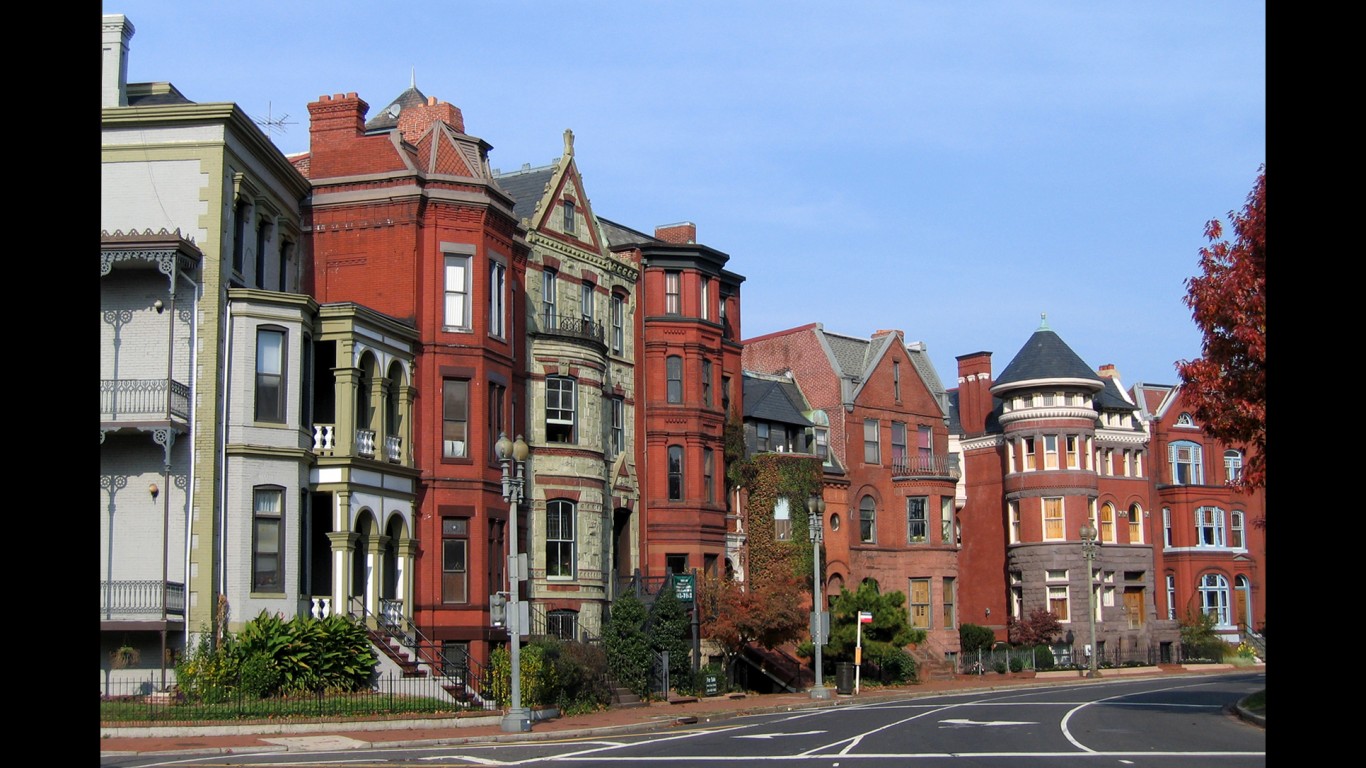
11. Washington-Arlington-Alexandria, DC-VA-MD-WV
> Poverty rate: 7.6%
> 2018 unemployment: 3.3%
> Households receiving SNAP benefits: 6.5%
> Median household income: $102,180
[recirclink id=562217]

10. Manchester-Nashua, NH
> Poverty rate: 7.5% (New Hampshire: 7.6%)
> 2018 unemployment: 2.4% (New Hampshire: 2.5%)
> Households receiving SNAP benefits: 7.4% (New Hampshire: 6.7%)
> Median household income: $78,978 (New Hampshire: $74,991)

9. Gettysburg, PA
> Poverty rate: 7.3% (Pennsylvania: 12.2%)
> 2018 unemployment: 3.3% (Pennsylvania: 4.3%)
> Households receiving SNAP benefits: 7.1% (Pennsylvania: 13.4%)
> Median household income: $62,284 (Pennsylvania: $60,905)
[in-text-ad-2]

8. Vallejo-Fairfield, CA
> Poverty rate: 7.3% (California: 12.8%)
> 2018 unemployment: 3.9% (California: 4.2%)
> Households receiving SNAP benefits: 7.2% (California: 8.5%)
> Median household income: $84,395 (California: $75,277)
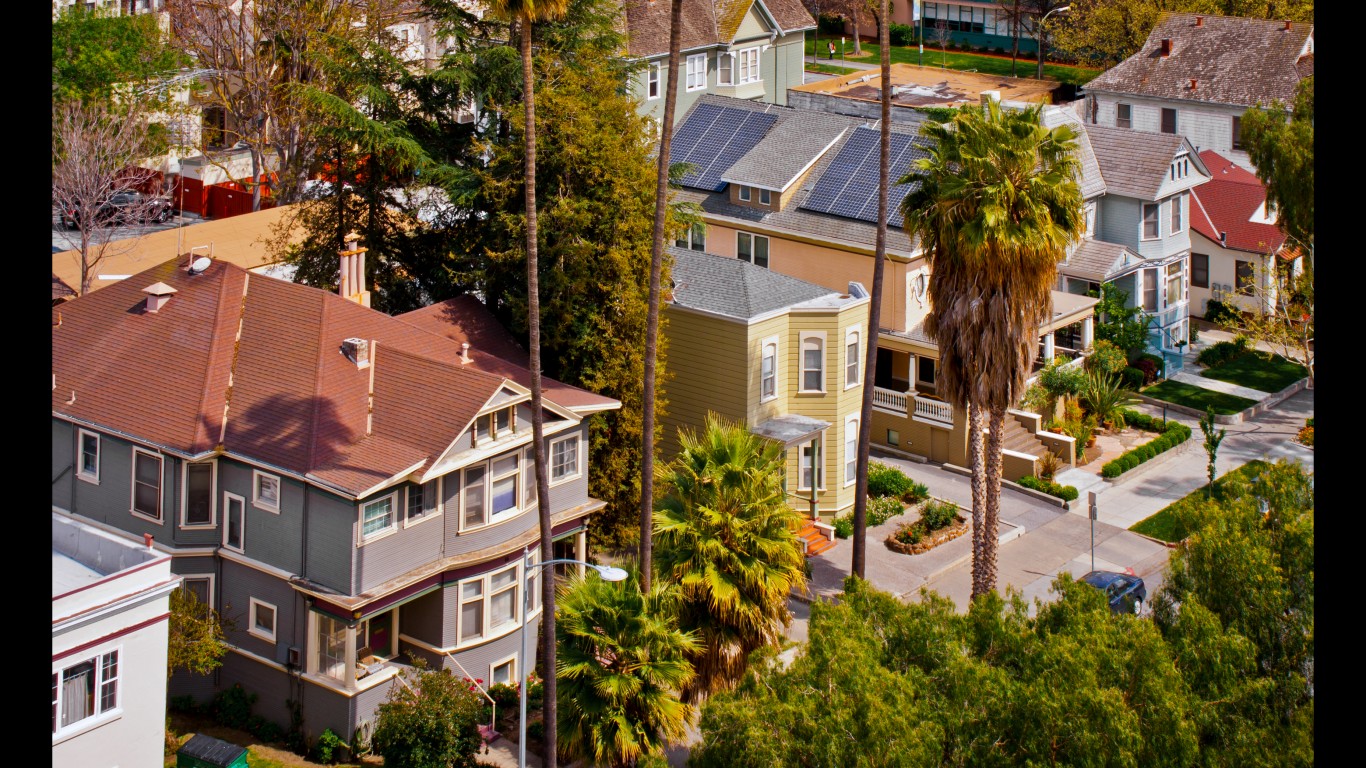
7. San Jose-Sunnyvale-Santa Clara, CA
> Poverty rate: 7.2% (California: 12.8%)
> 2018 unemployment: 2.7% (California: 4.2%)
> Households receiving SNAP benefits: 4.2% (California: 8.5%)
> Median household income: $124,696 (California: $75,277)
[in-text-ad]
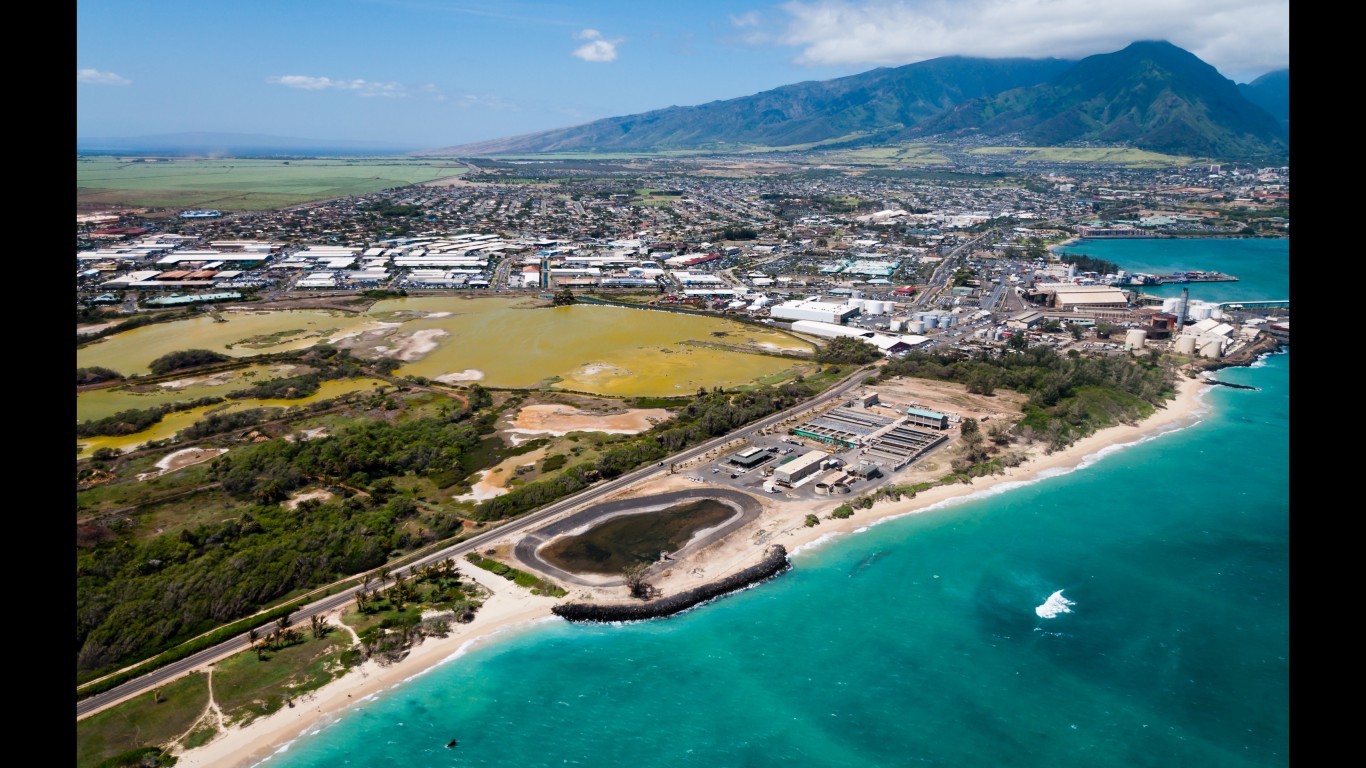
6. Kahului-Wailuku-Lahaina, HI
> Poverty rate: 7.1% (Hawaii: 8.8%)
> 2018 unemployment: 2.4% (Hawaii: 2.4%)
> Households receiving SNAP benefits: 8.4% (Hawaii: 10.0%)
> Median household income: $82,917 (Hawaii: $80,212)
[recirclink id=580545]

5. Wausau, WI
> Poverty rate: 7.0% (Wisconsin: 11.0%)
> 2018 unemployment: 2.7% (Wisconsin: 3.0%)
> Households receiving SNAP benefits: 7.5% (Wisconsin: 10.0%)
> Median household income: $62,890 (Wisconsin: $60,773)
4. Appleton, WI
> Poverty rate: 6.9% (Wisconsin: 11.0%)
> 2018 unemployment: 2.7% (Wisconsin: 3.0%)
> Households receiving SNAP benefits: 6.0% (Wisconsin: 10.0%)
> Median household income: $65,826 (Wisconsin: $60,773)
[in-text-ad-2]
3. Ogden-Clearfield, UT
> Poverty rate: 6.7% (Utah: 9.0%)
> 2018 unemployment: 3.2% (Utah: 3.1%)
> Households receiving SNAP benefits: 5.9% (Utah: 6.5%)
> Median household income: $76,653 (Utah: $71,414)

2. Sheboygan, WI
> Poverty rate: 6.6% (Wisconsin: 11.0%)
> 2018 unemployment: 2.5% (Wisconsin: 3.0%)
> Households receiving SNAP benefits: 7.7% (Wisconsin: 10.0%)
> Median household income: $60,896 (Wisconsin: $60,773)
[in-text-ad]

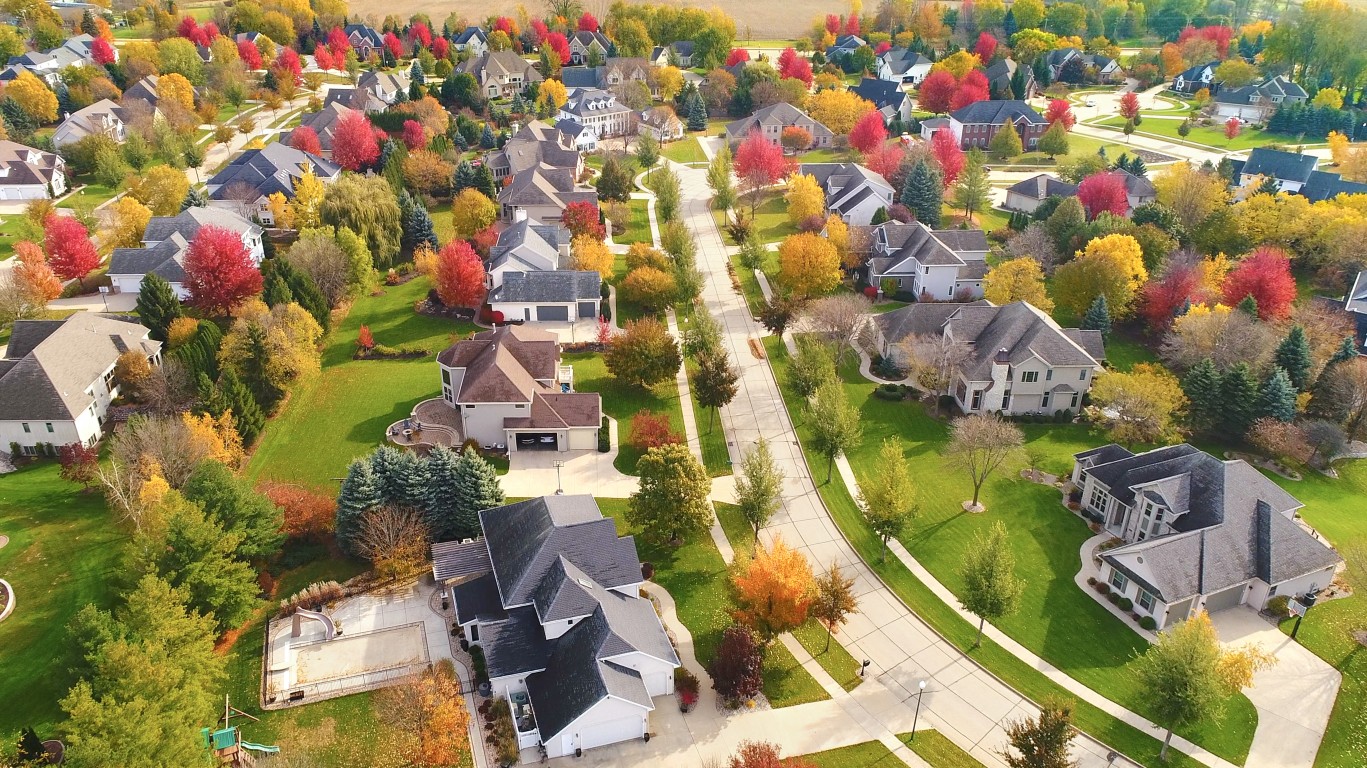
1. Rochester, MN
> Poverty rate: 6.6% (Minnesota: 9.6%)
> 2018 unemployment: 2.5% (Minnesota: 2.9%)
> Households receiving SNAP benefits: 6.4% (Minnesota: 7.3%)
> Median household income: $72,129 (Minnesota: $70,315)
Methodology
To identify the cities with the lowest poverty rates, 24/7 Wall St. reviewed the share of residents living in households with incomes below the poverty line in 382 U.S. metro areas with one-year data from the U.S. Census Bureau’s 2018 American Community Survey. In cases where two or more cities had the same poverty rate, median household income was used as a tiebreaker, favoring the city with a higher income. Data on the share of households receiving SNAP benefits, or food stamps, and median household income also came from the 2018 ACS. Data on annual unemployment for 2018 came from the Local Area Unemployment Statistics Program of the Bureau of Labor Statistics.