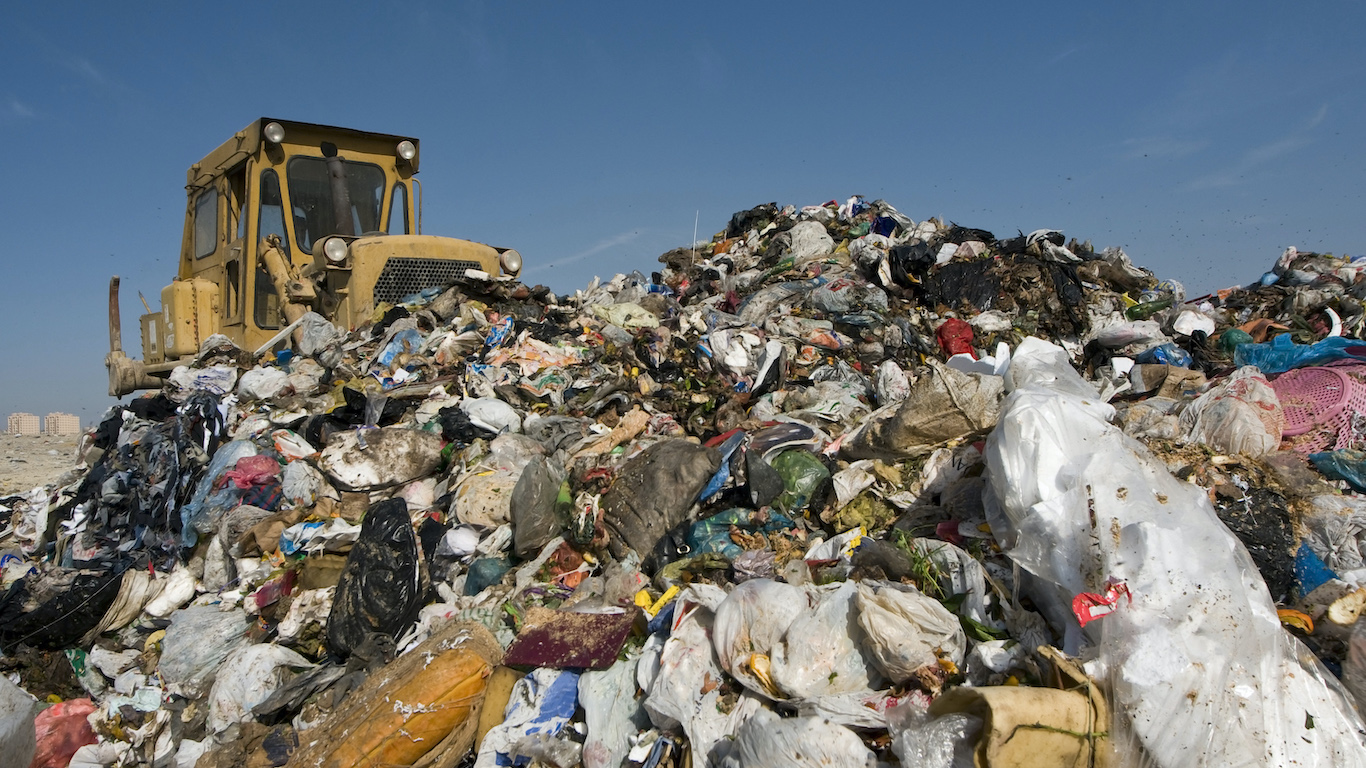
From the littered beaches of India to the vast waste dumps of the United States to the Great Pacific Garbage Patch, the world is drowning in trash. And the rate at which waste is being generated is only increasing, according to the World Bank. Because of population growth and the expansion of urban areas, the amount of municipal solid waste that people generate is only expected to rise.
To identify the countries that produce the most municipal solid waste (MSW), 24/7 Tempo reviewed MSW generated minus MSW recycled or composted, per person per day in 217 countries analyzed in the World Bank’s “What a Waste” global database, last updated in September 2018. MSW is waste generated from companies, buildings, institutions, small businesses, houses, and yards. It does not include industrial, medical, hazardous, electronic, construction, and demolition waste. It is also important to note that not all countries report both annual MSW composted and annual MSW recycled. We only considered for our ranking the 137 countries for which one or both of these statistics were available. GDP per capita figures included for each country came from the World Bank.
Click here to see the 31 countries that produce the most waste
Solid waste is a reality of urban development, and disposing of it is one of the most important responsibilities of municipalities. By 2025, an estimated 4.3 billion urban dwellers will likely generate about 3.13 pounds of municipal solid waste per person per day, or 2.2 billion tons a year, according to a World Bank report, “What a Waste : A Global Review of Solid Waste Management.” The projected increase in solid waste will challenge urban residents to conserve resources. Here are 30 ways to make your life more environmentally friendly.
Many countries have recognized the importance of properly and safely disposing of trash and have passed laws regulating how cities and corporations should dispose of the waste. Some developing countries are struggling because governments often lack the funding to address the challenges of waste management. Many countries are advocating recycling. In the United States, for example, some states will even pay you to recycle.

31. Russian Federation
> MSW minus recycled and composted per capita per day: 2.4 pounds
> Total annual MSW: 132.28 billion pounds
> Total annual recycled and/or composted MSW: 5.95 billion pounds recycled
> Population: 143,201,676 (9 out of 217)
> GDP per capita in 2017: $24,791 (58 out of 217)
[in-text-ad]
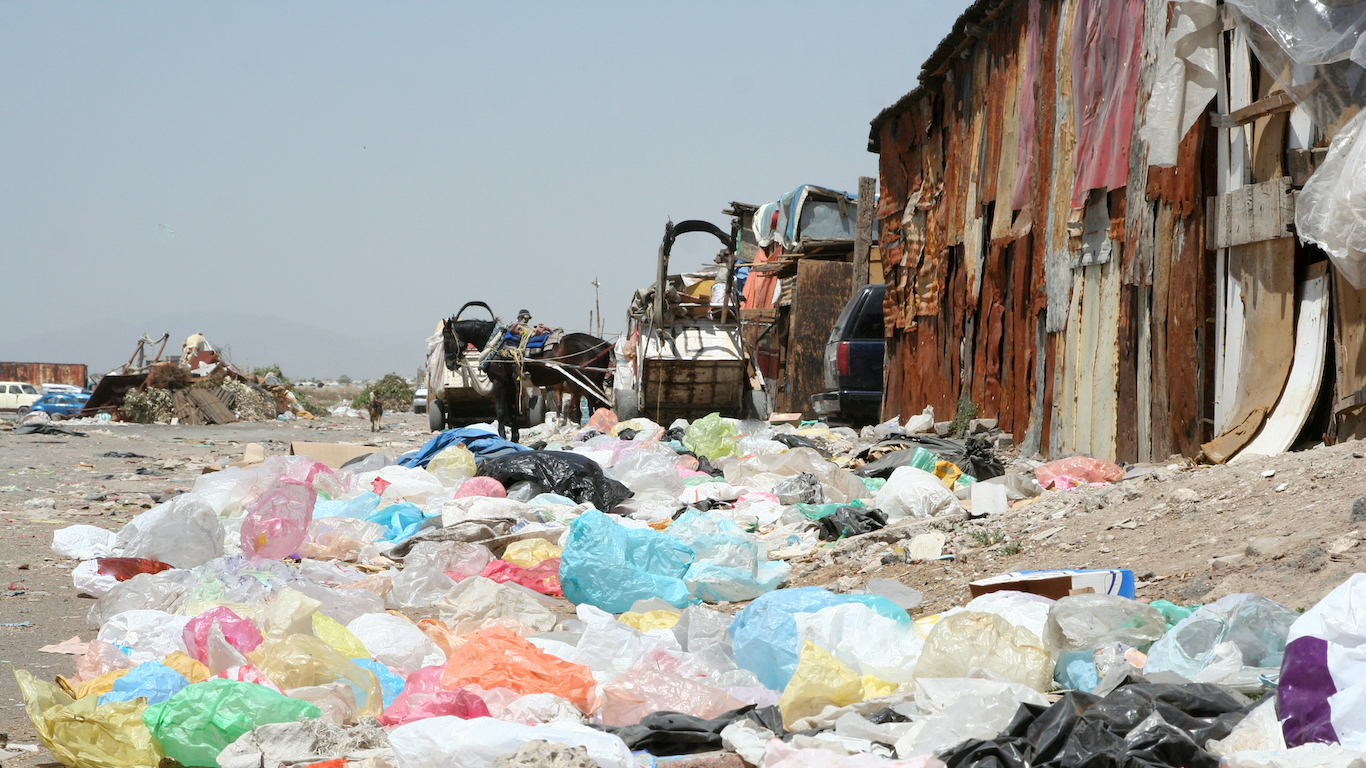
30. Mexico
> MSW minus recycled and composted per capita per day: 2.4 pounds
> Total annual MSW: 117.07 billion pounds
> Total annual recycled and/or composted MSW: 5.85 billion pounds recycled
> Population: 125,890,949 (11 out of 217)
> GDP per capita in 2018: $18,102 (73 out of 217)
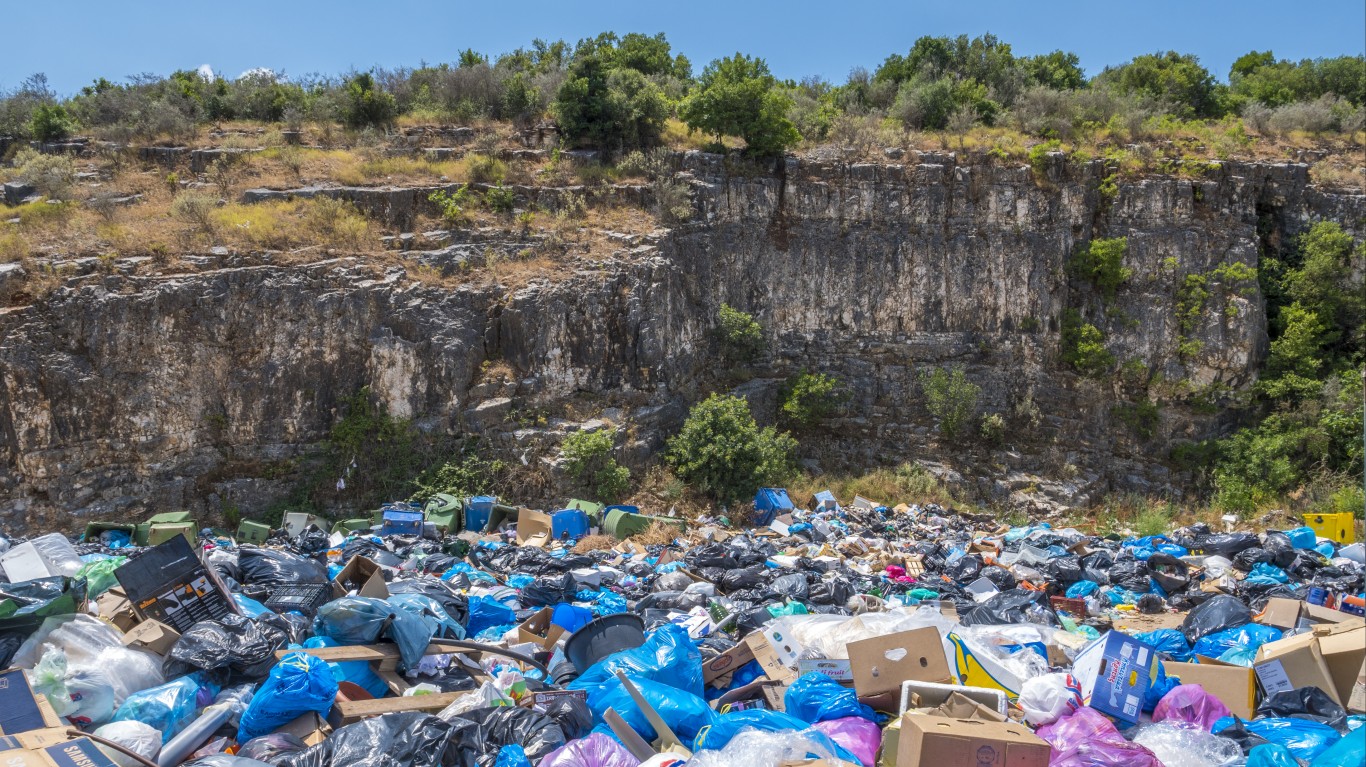
29. Greece
> MSW minus recycled and composted per capita per day: 2.5 pounds
> Total annual MSW: 12.08 billion pounds
> Total annual recycled and/or composted MSW: 2.29 billion pounds recycled
> Population: 10,892,413 (78 out of 217)
> GDP per capita in 2018: $25,141 (56 out of 217)
28. Faroe Islands
> MSW minus recycled and composted per capita per day: 2.5 pounds
> Total annual MSW: 134.48 million pounds
> Total annual recycled and/or composted MSW: 166.64 million pounds recycled
> Population: 48,842 (206 out of 217)
> GDP per capita in 2018: Not available
[in-text-ad-2]
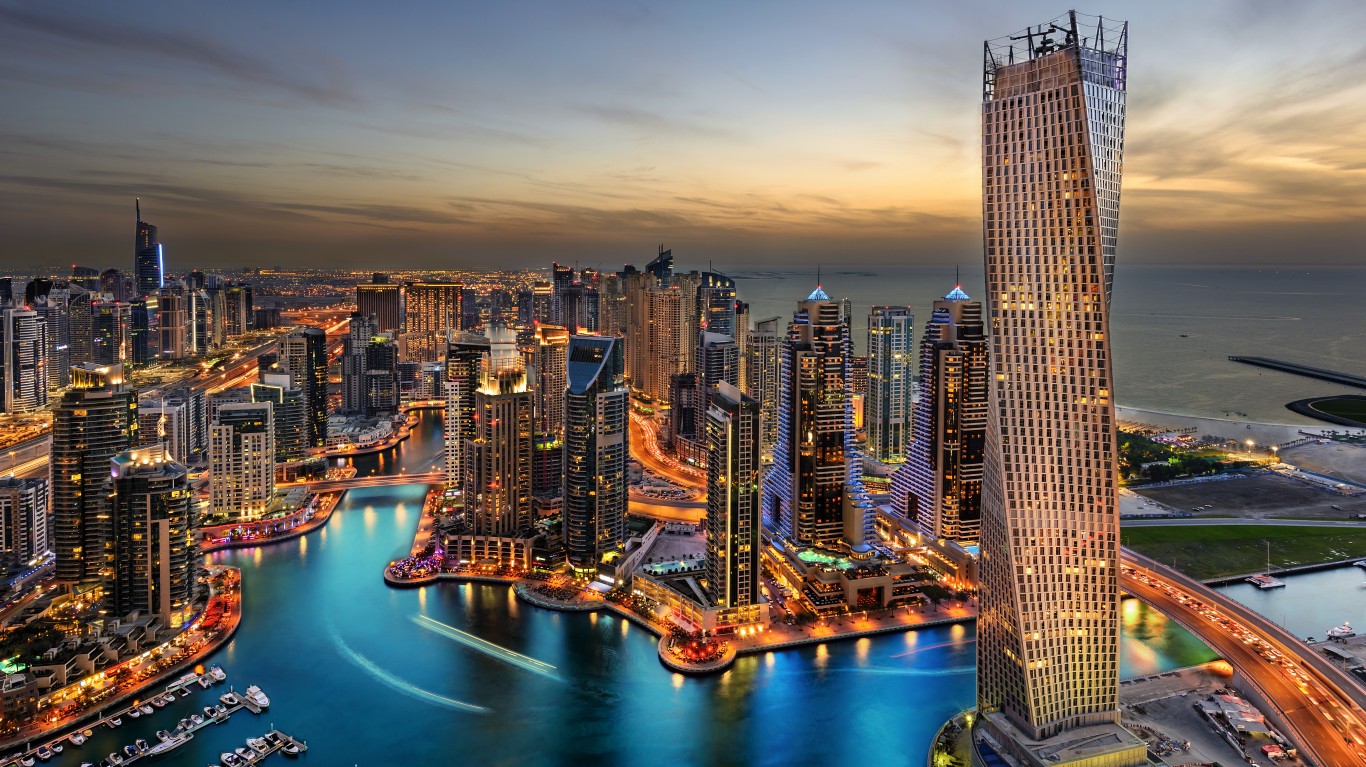
27. United Arab Emirates
> MSW minus recycled and composted per capita per day: 2.5 pounds
> Total annual MSW: 11.93 billion pounds
> Total annual recycled and/or composted MSW: 3.46 billion pounds recycled and composted
> Population: 9,269,612 (88 out of 217)
> GDP per capita in 2018: $66,616 (7 out of 217)
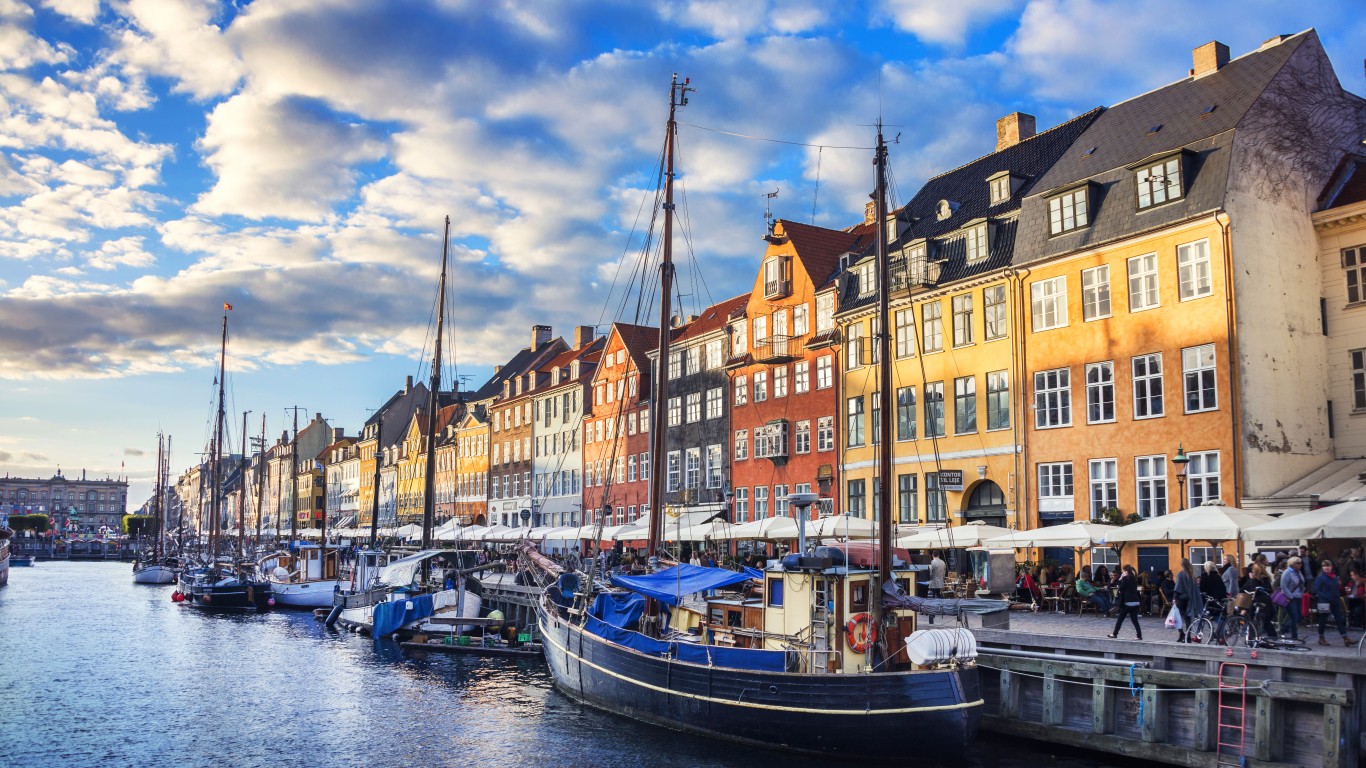
26. Denmark
> MSW minus recycled and composted per capita per day: 2.6 pounds
> Total annual MSW: 9.89 billion pounds
> Total annual recycled and/or composted MSW: 4.57 billion pounds recycled and composted
> Population: 5,683,483 (109 out of 217)
> GDP per capita in 2018: $47,705 (18 out of 217)
[in-text-ad]

25. Saudi Arabia
> MSW minus recycled and composted per capita per day: 2.6 pounds
> Total annual MSW: 35.55 billion pounds
> Total annual recycled and/or composted MSW: 5.33 billion pounds recycled
> Population: 31,557,144 (41 out of 217)
> GDP per capita in 2018: $48,996 (16 out of 217)

24. St. Lucia
> MSW minus recycled and composted per capita per day: 2.6 pounds
> Total annual MSW: 171.11 million pounds
> Total annual recycled and/or composted MSW: 171,115 pounds composted
> Population: 177,206 (183 out of 217)
> GDP per capita in 2018: $12,344 (99 out of 217)

23. Qatar
> MSW minus recycled and composted per capita per day: 2.8 pounds
> Total annual MSW: 2.21 billion pounds
> Total annual recycled and/or composted MSW: 90.10 million pounds recycled
> Population: 2,109,568 (141 out of 217)
> GDP per capita in 2018: $112,532 (1 out of 217)
[in-text-ad-2]
22. Maldives
> MSW minus recycled and composted per capita per day: 2.9 pounds
> Total annual MSW: 466.29 million pounds
> Total annual recycled and/or composted MSW: 34.69 million pounds composted
> Population: 409,163 (173 out of 217)
> GDP per capita in 2018: $13,611 (93 out of 217)

21. Israel
> MSW minus recycled and composted per capita per day: 2.9 pounds
> Total annual MSW: 11.90 billion pounds
> Total annual recycled and/or composted MSW: 2.98 billion pounds recycled
> Population: 8,380,100 (93 out of 217)
> GDP per capita in 2018: $33,661 (38 out of 217)
[in-text-ad]
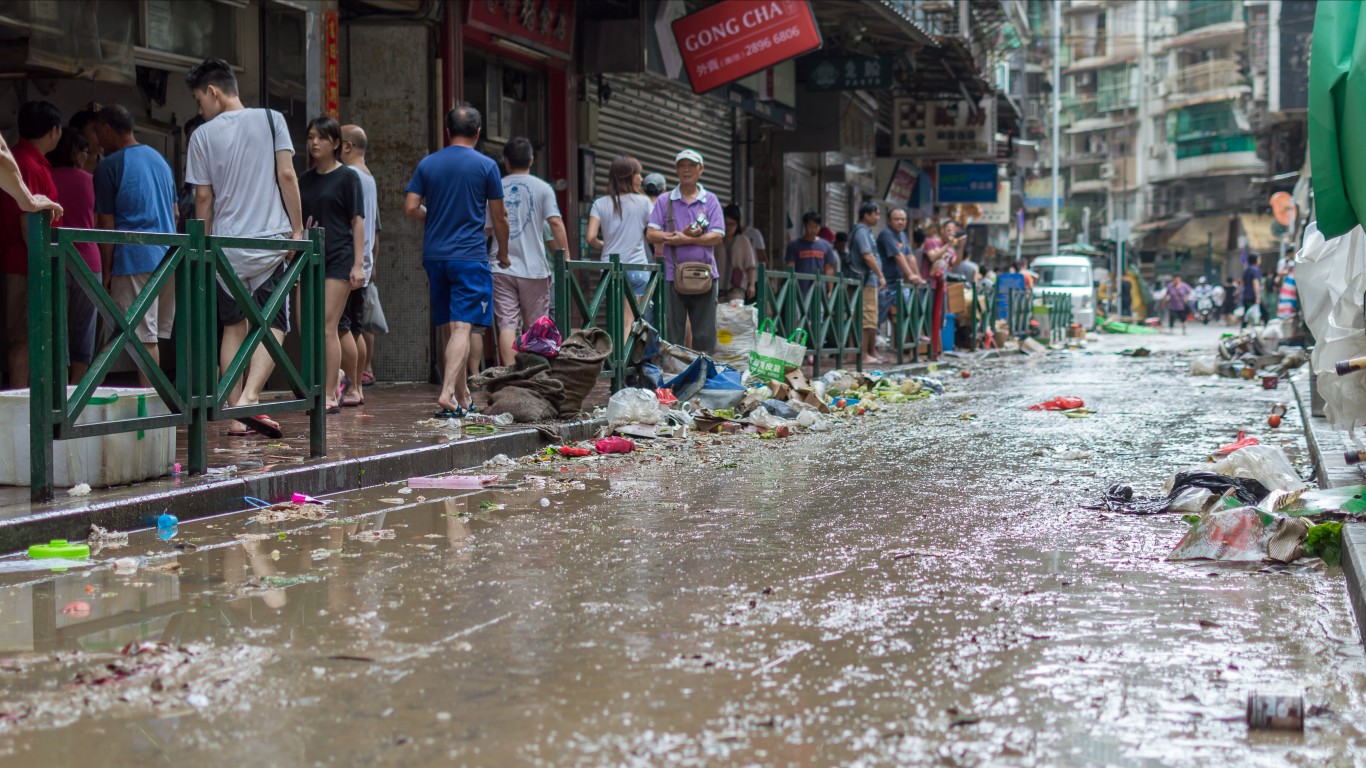
20. Macao SAR, China
> MSW minus recycled and composted per capita per day: 3.0 pounds
> Total annual MSW: 833.22 million pounds
> Total annual recycled and/or composted MSW: 167.89 million pounds recycled
> Population: 612,167 (166 out of 217)
> GDP per capita in 2018: $108,831 (2 out of 217)

19. Brunei Darussalam
> MSW minus recycled and composted per capita per day: 3.0 pounds
> Total annual MSW: 476.76 million pounds
> Total annual recycled and/or composted MSW: 9.54 million pounds composted
> Population: 423,196 (172 out of 217)
> GDP per capita in 2018: $71,802 (5 out of 217)
18. Montenegro
> MSW minus recycled and composted per capita per day: 3.0 pounds
> Total annual MSW: 731.93 million pounds
> Total annual recycled and/or composted MSW: 39.67 million pounds recycled
> Population: 622,159 (165 out of 217)
> GDP per capita in 2018: $17,278 (75 out of 217)
[in-text-ad-2]

17. Hong Kong SAR, China
> MSW minus recycled and composted per capita per day: 3.1 pounds
> Total annual MSW: 12.52 billion pounds
> Total annual recycled and/or composted MSW: 4.26 billion pounds recycled
> Population: 7,305,700 (98 out of 217)
> GDP per capita in 2018: $57,322 (12 out of 217)
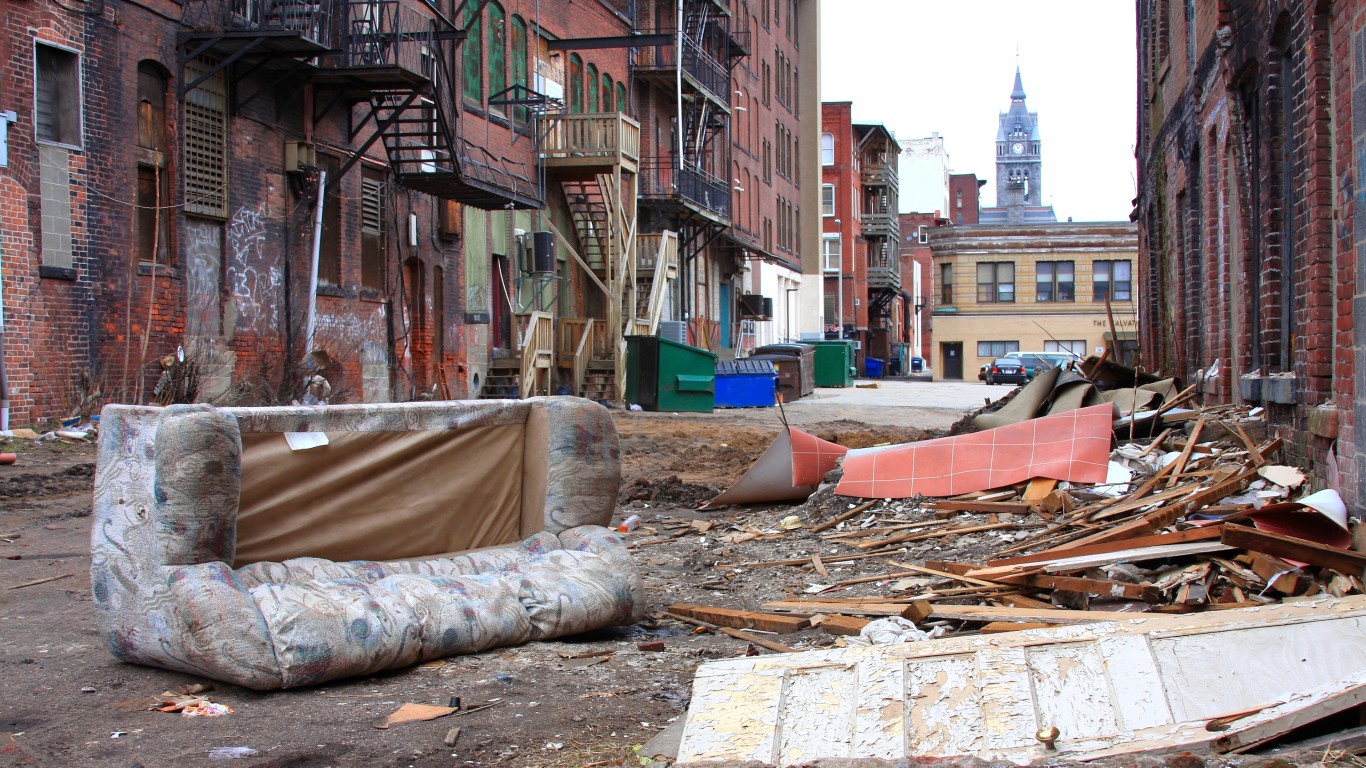
16. United States
> MSW minus recycled and composted per capita per day: 3.2 pounds
> Total annual MSW: 568.79 billion pounds
> Total annual recycled and/or composted MSW: 196.80 billion pounds recycled
> Population: 318,563,456 (3 out of 217)
> GDP per capita in 2018: $55,681 (14 out of 217)
[in-text-ad]

15. Canada
> MSW minus recycled and composted per capita per day: 3.2 pounds
> Total annual MSW: 55.34 billion pounds
> Total annual recycled and/or composted MSW: 13.65 billion pounds recycled and composted
> Population: 35,544,564 (37 out of 217)
> GDP per capita in 2018: $44,070 (23 out of 217)

14. Singapore
> MSW minus recycled and composted per capita per day: 3.2 pounds
> Total annual MSW: 16.99 billion pounds
> Total annual recycled and/or composted MSW: 10.36 billion pounds recycled
> Population: 5,607,283 (110 out of 217)
> GDP per capita in 2018: $90,091 (4 out of 217)

13. Trinidad and Tobago
> MSW minus recycled and composted per capita per day: 3.3 pounds
> Total annual MSW: 1.60 billion pounds
> Total annual recycled and/or composted MSW: 12.84 million pounds composted
> Population: 1,328,100 (152 out of 217)
> GDP per capita in 2018: $28,647 (49 out of 217)
[in-text-ad-2]
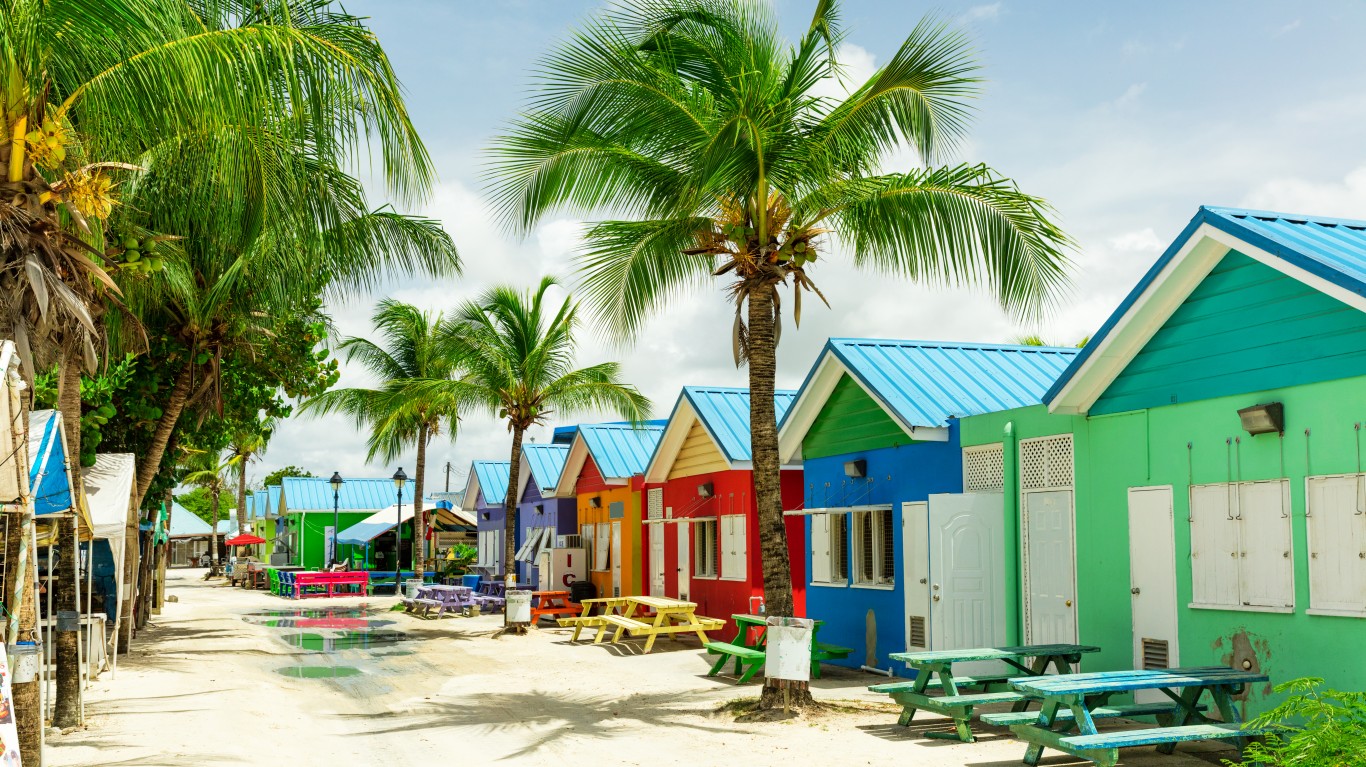
12. Barbados
> MSW minus recycled and composted per capita per day: 3.4 pounds
> Total annual MSW: 385.40 million pounds
> Total annual recycled and/or composted MSW: 3.62 million pounds recycled
> Population: 280,601 (177 out of 217)
> GDP per capita in 2017: $16,839 (80 out of 217)

11. Malta
> MSW minus recycled and composted per capita per day: 3.5 pounds
> Total annual MSW: 593.04 million pounds
> Total annual recycled and/or composted MSW: 55.68 million pounds recycled
> Population: 431,874 (171 out of 217)
> GDP per capita in 2018: $38,147 (30 out of 217)
[in-text-ad]

10. Channel Islands
> MSW minus recycled and composted per capita per day: 3.7 pounds
> Total annual MSW: 394.48 million pounds
> Total annual recycled and/or composted MSW: 645.96 million pounds recycled and composted
> Population: 164,541 (184 out of 217)
> GDP per capita in 2018: Not available
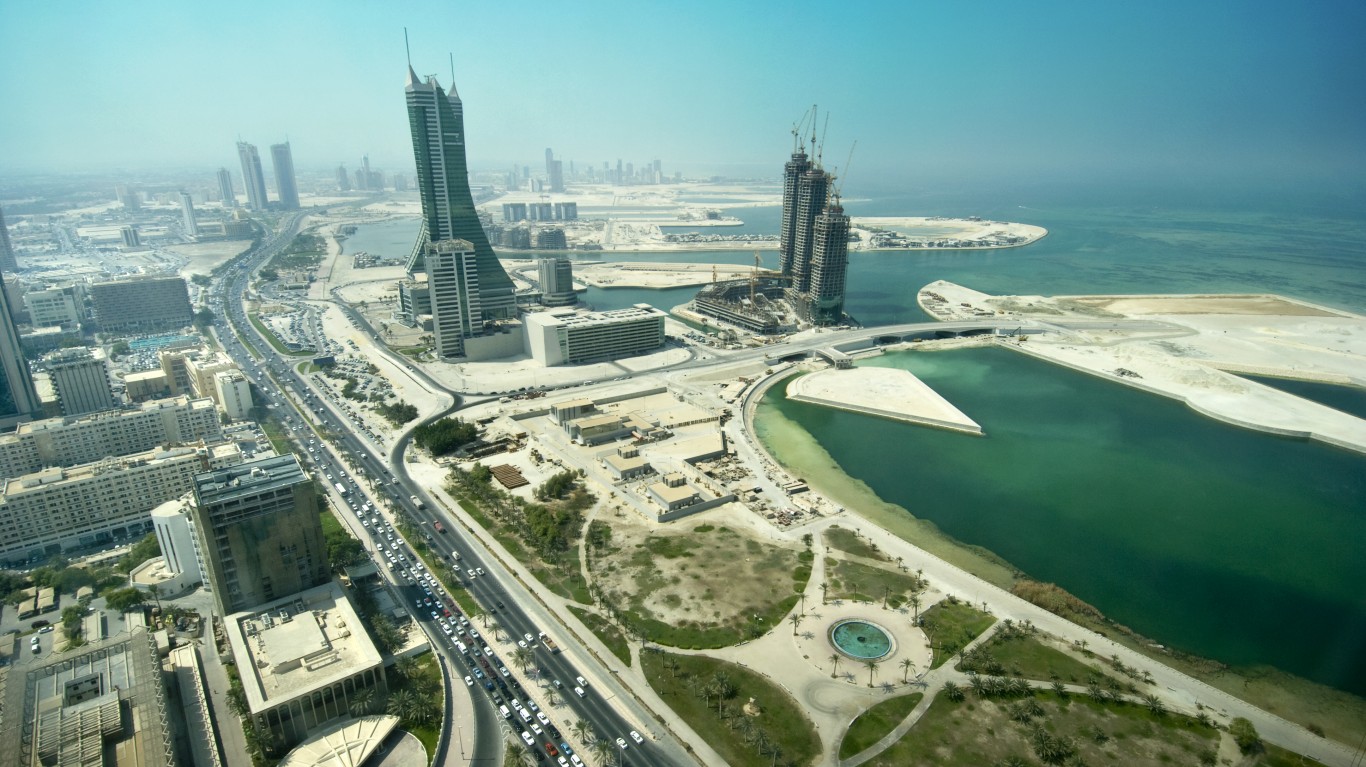
9. Bahrain
> MSW minus recycled and composted per capita per day: 3.7 pounds
> Total annual MSW: 2.10 billion pounds
> Total annual recycled and/or composted MSW: 112.15 million pounds recycled
> Population: 1,425,171 (150 out of 217)
> GDP per capita in 2018: $41,973 (25 out of 217)

8. Iceland
> MSW minus recycled and composted per capita per day: 4.0 pounds
> Total annual MSW: 1.16 billion pounds
> Total annual recycled and/or composted MSW: 679.06 million pounds recycled and composted
> Population: 330,815 (176 out of 217)
> GDP per capita in 2018: $48,606 (17 out of 217)
[in-text-ad-2]
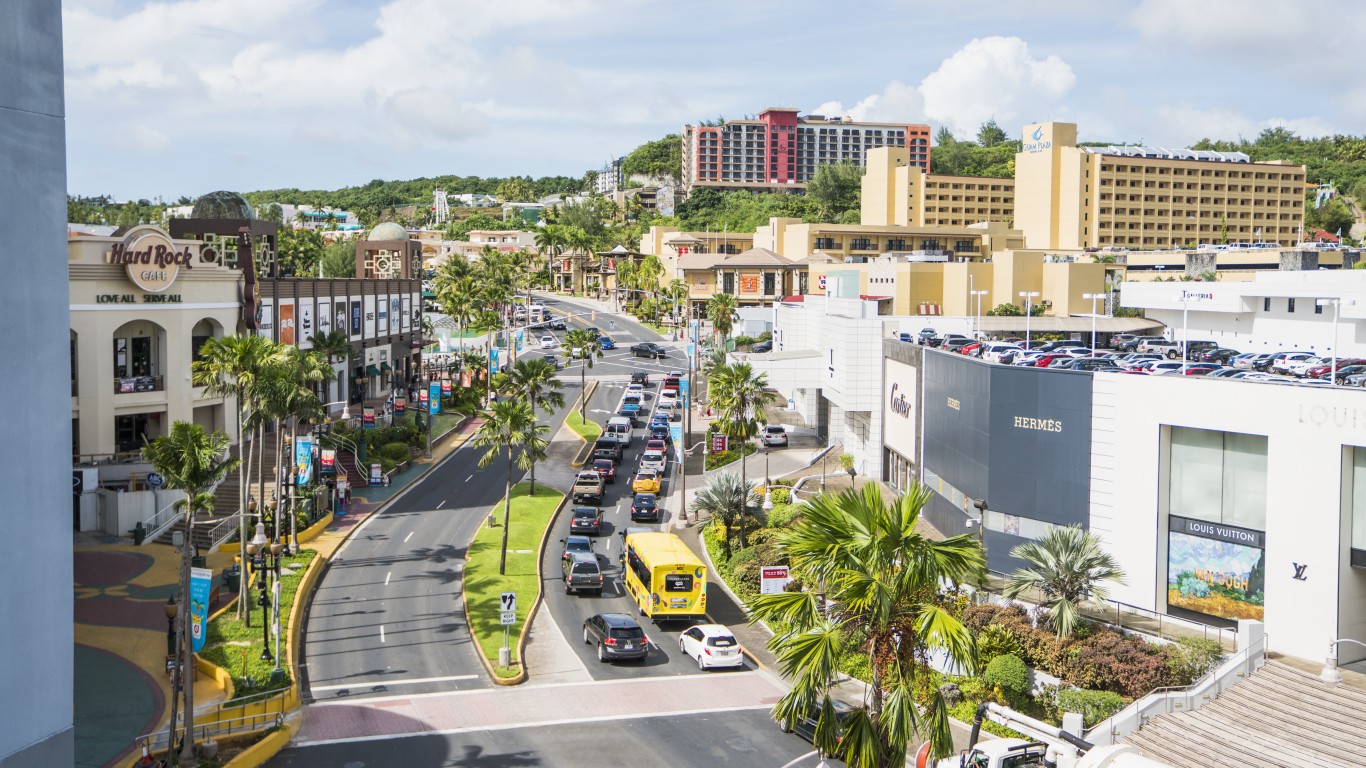
7. Guam
> MSW minus recycled and composted per capita per day: 4.4 pounds
> Total annual MSW: 311.95 million pounds
> Total annual recycled and/or composted MSW: 66.20 million pounds recycled
> Population: 159,973 (185 out of 217)
> GDP per capita in 2018: Not available
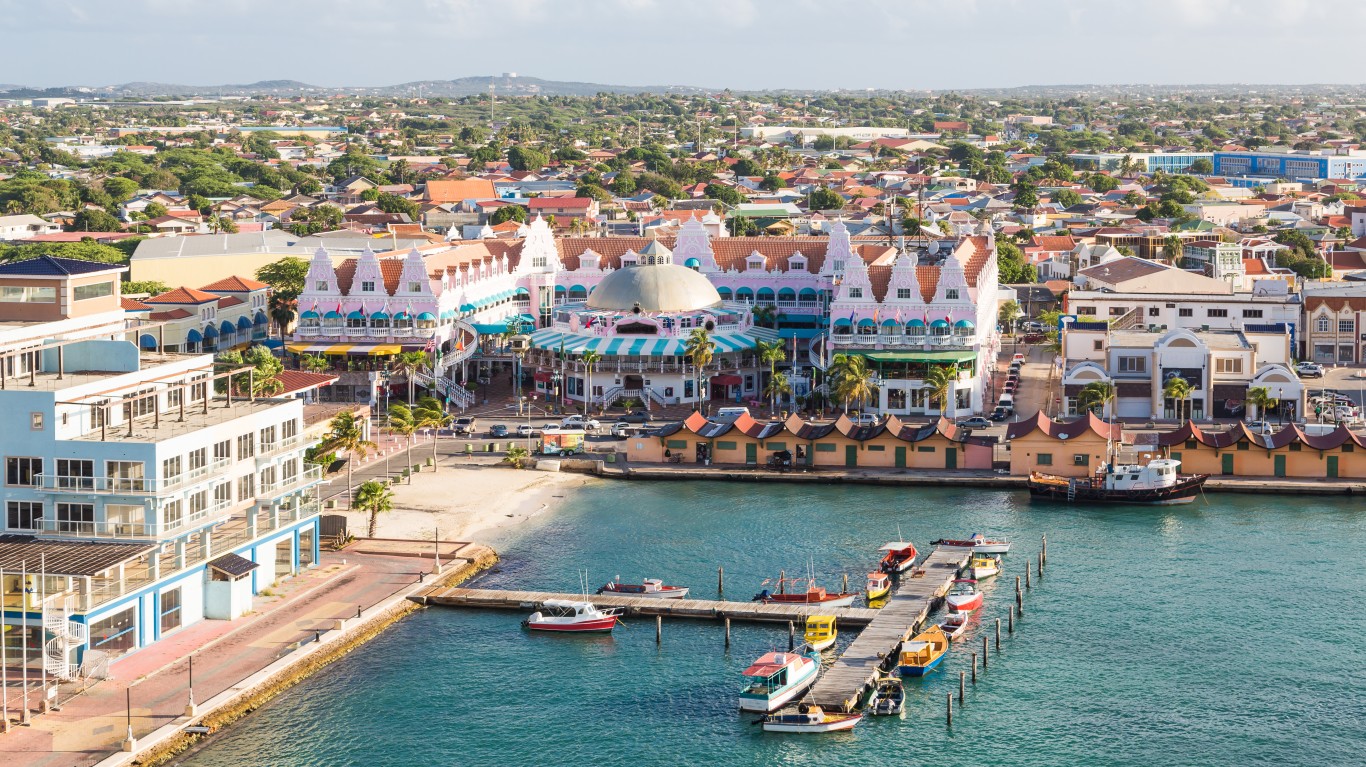
6. Aruba
> MSW minus recycled and composted per capita per day: 4.6 pounds
> Total annual MSW: 194.30 million pounds
> Total annual recycled and/or composted MSW: 21.37 million pounds recycled
> Population: 103,187 (193 out of 217)
> GDP per capita in 2017: $35,862 (34 out of 217)
[in-text-ad]

5. Cayman Islands
> MSW minus recycled and composted per capita per day: 4.8 pounds
> Total annual MSW: 132.28 million pounds
> Total annual recycled and/or composted MSW: 27.78 million pounds recycled
> Population: 59,172 (200 out of 217)
> GDP per capita in 2017: $65,996 (8 out of 217)

4. Moldova
> MSW minus recycled and composted per capita per day: 5.7 pounds
> Total annual MSW: 8.78 billion pounds
> Total annual recycled and/or composted MSW: 1.34 billion pounds recycled
> Population: 3,554,108 (128 out of 217)
> GDP per capita in 2018: $6,490 (134 out of 217)
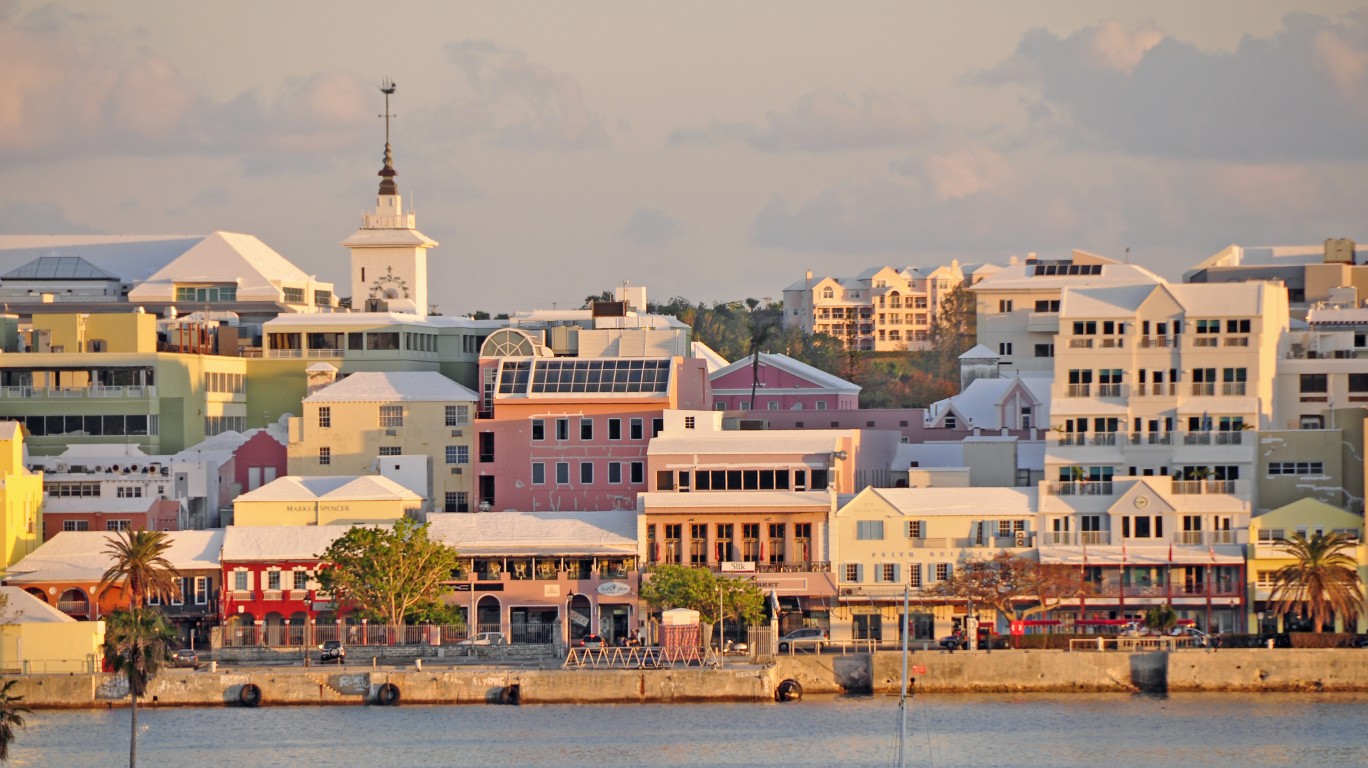
3. Bermuda
> MSW minus recycled and composted per capita per day: 6.1 pounds
> Total annual MSW: 180.78 million pounds
> Total annual recycled and/or composted MSW: 39.67 million pounds recycled and composted
> Population: 64,798 (199 out of 217)
> GDP per capita in 2018: Not available
[in-text-ad-2]
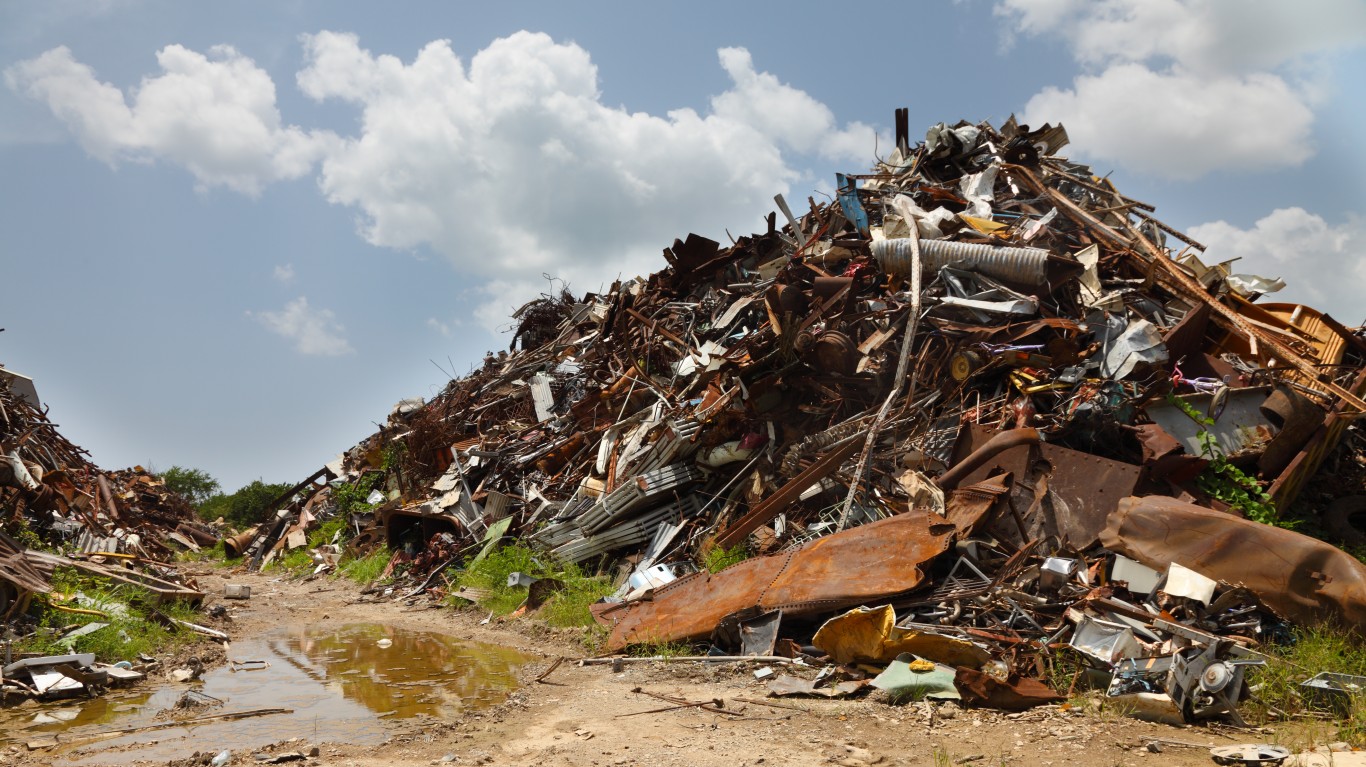
2. Puerto Rico
> MSW minus recycled and composted per capita per day: 6.2 pounds
> Total annual MSW: 9.20 billion pounds
> Total annual recycled and/or composted MSW: 1.29 billion pounds recycled
> Population: 3,473,181 (132 out of 217)
> GDP per capita in 2018: $35,085 (36 out of 217)

1. Monaco
> MSW minus recycled and composted per capita per day: 7.0 pounds
> Total annual MSW: 101.41 million pounds
> Total annual recycled and/or composted MSW: 5.48 million pounds recycled
> Population: 37,783 (207 out of 217)
> GDP per capita in 2018: Not available
Get Ready To Retire (Sponsored)
Start by taking a quick retirement quiz from SmartAsset that will match you with up to 3 financial advisors that serve your area and beyond in 5 minutes, or less.
Each advisor has been vetted by SmartAsset and is held to a fiduciary standard to act in your best interests.
Here’s how it works:
1. Answer SmartAsset advisor match quiz
2. Review your pre-screened matches at your leisure. Check out the advisors’ profiles.
3. Speak with advisors at no cost to you. Have an introductory call on the phone or introduction in person and choose whom to work with in the future
Get started right here.
Thank you for reading! Have some feedback for us?
Contact the 24/7 Wall St. editorial team.
 24/7 Wall St.
 24/7 Wall St.

