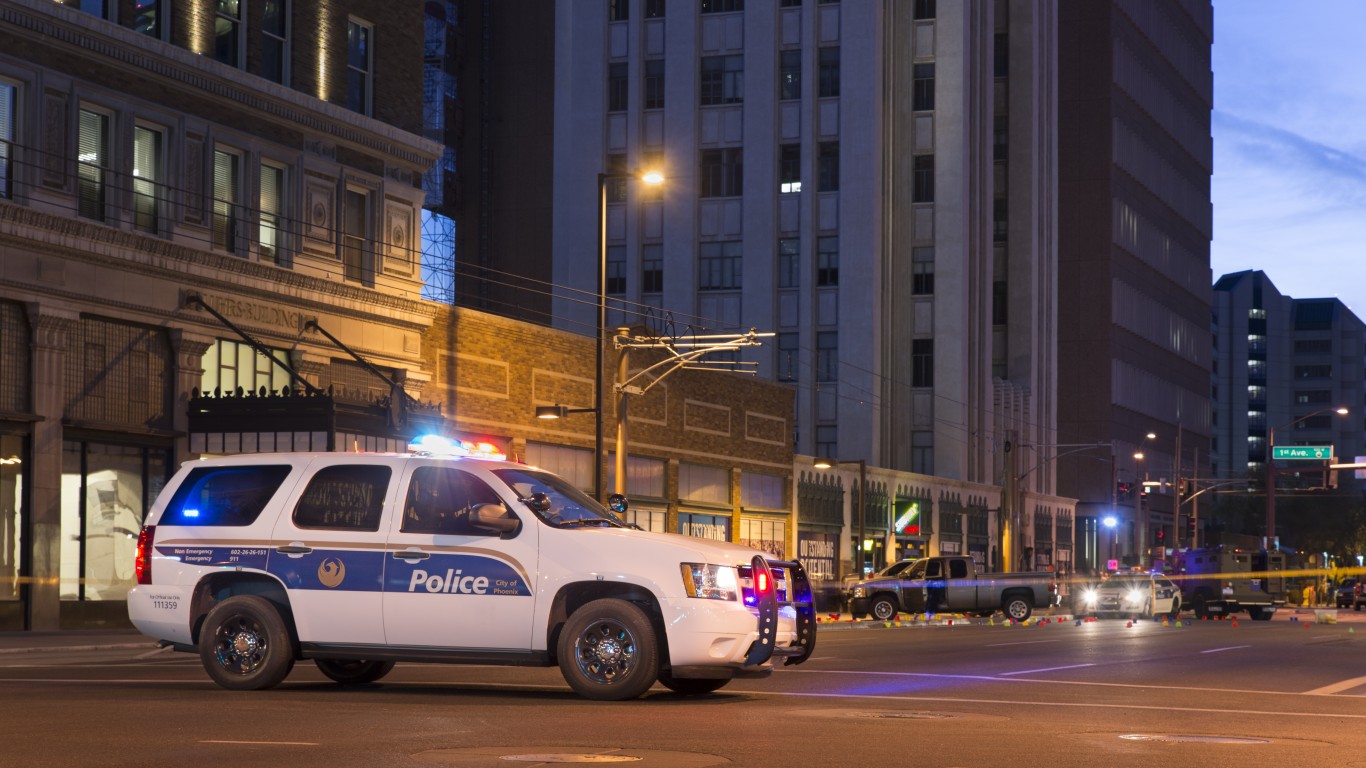
There were 369 violent crimes committed in 2018 for every 100,000 Americans, nearly the lowest violent crime rate in the United States in more than three decades. In an interview with 24/7 Wall St., John Roman, a senior fellow with NORC at the University of Chicago, an independent social research institution, explained that the latest crime statistics reflect an encouraging continuation of a long-term trend.
“If you are under the age of 40, you’ve never been safer than you are today,” Roman said.
Of course, crime is a local phenomenon. Despite the overall decline in violence nationwide, some U.S. cities have violent crime rates today that are well more than double the nationwide peak rate of 758 incidents per 100,000 people reported in 1991. Using data from the FBI, 24/7 Wall St. reviewed violent crimes rates — a population-adjusted measure of incidents of rape, robbery, homicide, and aggravated assault — to identify America’s most dangerous cities. Only the 294 midsize and large cities tracked by the FBI with populations of at least 100,000 were considered.
The cities with the highest violent crime rates tend to share other socioeconomic characteristics — notably, a lack of economic opportunity. In the vast majority of cities on this list, poverty and unemployment rates are higher than they are nationwide. Some of these cities even rank among the poorest in the country. Here is a look at the poorest city in each state.
Often, these cities are former manufacturing hubs clustered in the industrial Midwest. Cities in Indiana, Michigan, and Ohio have all been affected by the decline of American manufacturing and now have some of the highest crime rates in the country. Though manufacturing is making a comeback in a handful of cities across the country, it will likely never be the economic pillar it once was in cities like Detroit, Indianapolis, and Cleveland — each of which ranks on this list.
It is important to note that a high violent crime rate does not mean an entire city is unsafe. Even within a given city, violence is hyper-local. “It’s block by block,” Roman said. “You can be in a part of the city that has deep poverty and few jobs and most of the blocks are very safe.”
Click here to see America’s most dangerous cities
Click here to read our methodology

50. Shreveport, Louisiana
> 2018 violent crime rate: 832.3 per 100,000 people
> 2018 homicides: 49
> Poverty rate: 25.7%
> 2018 unemployment rate: 5.5%
Shreveport, a relatively small northern Louisiana city of fewer than 200,000 people, ranks among the most dangerous cities in the United States. There were 832 violent crimes — a broad category of criminal offenses that includes robbery, rape, aggravated assault, and homicide — for every 100,000 people in the city in 2018, the 50th highest violent crime rate of any U.S. city and more than double the national violent crime rate of 369 incidents per 100,000 people.
The murder rate in Shreveport is particularly high. There were 49 homicides reported in the city in 2018, or 26 for every 100,000 people, a higher murder rate than in all but 10 other cities nationwide.
[in-text-ad]

49. Springfield, Illinois
> 2018 violent crime rate: 833.2 per 100,000 people
> 2018 homicides: 9
> Poverty rate: 20.3%
> 2018 unemployment rate: 4.5%
Illinois’ capital is one of three cities in the state to rank among the most dangerous U.S. cities. There were 833 violent crimes in the city for every 100,000 people in 2018. As is typically the case, aggravated assaults accounted for the vast majority of violence in the city. Two-thirds of the 955 violent crimes reported in Springfield last year were cases of aggravated assault.
Crime rates tend to be higher in areas with limited economic opportunity, and in Springfield, 4.5% of the workers were unemployed in 2018. Nationwide, unemployment stood at 3.9% last year.

48. Cincinnati, Ohio
> 2018 violent crime rate: 839.5 per 100,000 people
> 2018 homicides: 57
> Poverty rate: 28.7%
> 2018 unemployment rate: 4.5%
Cincinnati is one of five Ohio cities to rank among the most dangerous cities nationwide. Aggravated assault was the most commonly reported violent crime in the city in 2018, with 1,288 incidents, followed by robbery, with 897 reported incidents.
As is often the case in cities on this list, shootings account for a considerable share of aggravated assault and homicide cases. Currently, shootings appear to be happening more frequently in the city, despite the best efforts of police. So far in 2019, 871 firearms have been taken off the streets in Cincinnati.

47. New Haven, Connecticut
> 2018 violent crime rate: 842.3 per 100,000 people
> 2018 homicides: 10
> Poverty rate: 25.6%
> 2018 unemployment rate: 5.1%
New Haven is one of only two Connecticut cities — and one of only three in the broader New England region — to rank among the most dangerous cities nationwide. There were 842 violent crimes reported for every 100,000 people in the city in 2018, more than double the national rate of 369 per 100,000.
The city’s near nation-leading violent crime rate may be attributable in part to an understaffed police department. Going into 2019, there were about 100 vacancies in the department, which is budgeted for about 500 positions.
[in-text-ad-2]

46. Toledo, Ohio
> 2018 violent crime rate: 848.3 per 100,000 people
> 2018 homicides: 37
> Poverty rate: 26.5%
> 2018 unemployment rate: 5.8%
With a violent crime rate of 848 incidents per 100,000 people, Toledo ranks as the 46th most dangerous city in the United States. The northern Ohio city’s rates of aggravated assault, rape, and homicide, each ranks among the 50 highest of all U.S. cities tracked by the FBI.
As is often the case in high-crime cities, economic opportunity is limited in Toledo. An average of 5.8% of workers in the city were unemployed in 2018, a far greater share than the 3.9% national unemployment rate.
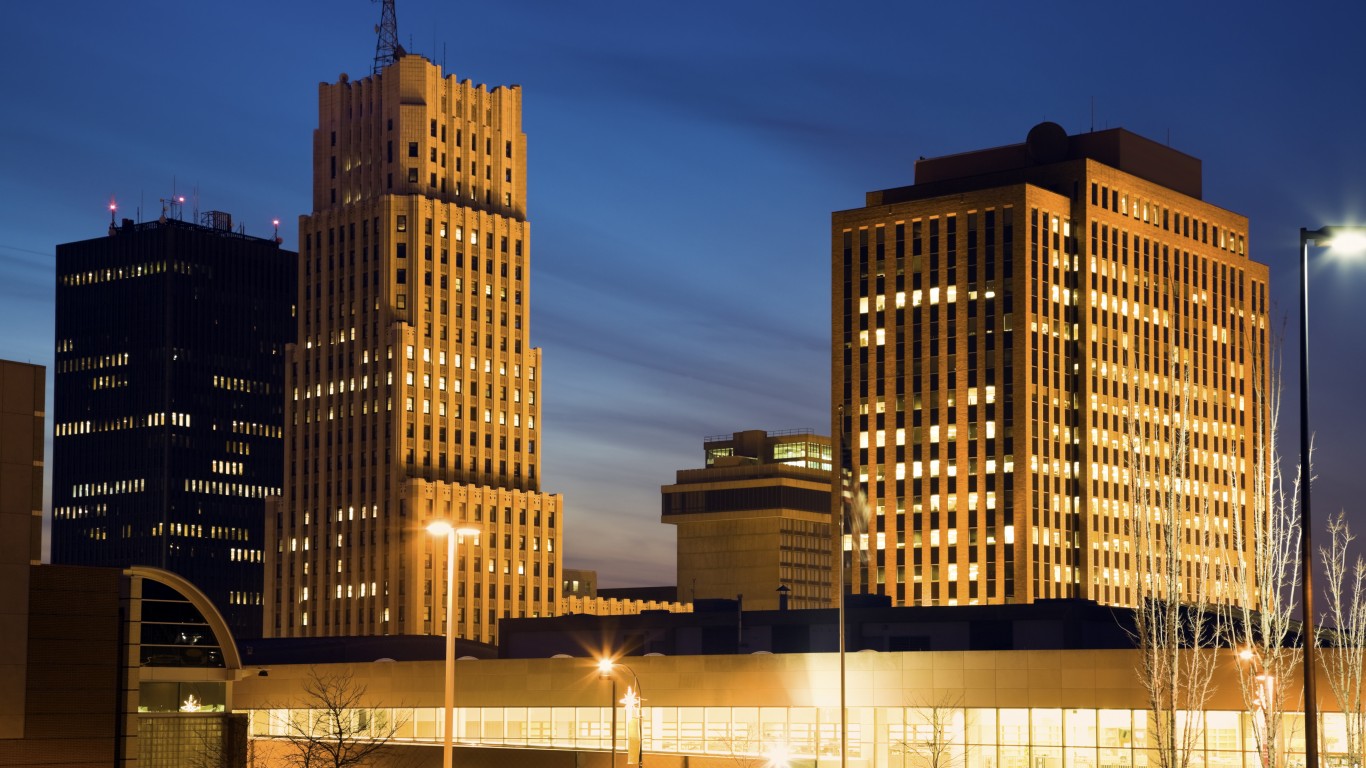
45. Akron, Ohio
> 2018 violent crime rate: 862.0 per 100,000 people
> 2018 homicides: 38
> Poverty rate: 24.1%
> 2018 unemployment rate: 5.3%
Akron is located about 30 miles south of downtown Cleveland, the most dangerous city in Ohio and seventh most dangerous nationwide. Violent crime is relatively common in Akron as well. There were 1,704 reported incidents of rape, robbery, aggravated assault, and homicide in the city in 2018, or 862 incidents for every 100,000 people.
Like many cities on this list, Akron is relatively poor. Most households in the city have an income below $36,000 or less per year, and nearly one in every four city residents live below the poverty line.
[in-text-ad]

44. Tacoma, Washington
> 2018 violent crime rate: 866.5 per 100,000 people
> 2018 homicides: 17
> Poverty rate: 17.0%
> 2018 unemployment rate: 5.5%
There were 867 violent crimes for every 100,000 people in Tacoma, Washington, in 2018, more than double the 369 per 100,000 national violent crime rate. High crime levels in Tacoma are not limited to violent offenses. There were also 5,268 property crimes — which include burglary, larceny, and motor vehicle theft — for every 100,000 people, more than in all but 17 other cities with at least 100,000 residents.
Like many cities on this list, joblessness is relatively common in Tacoma. The average annual unemployment rate in the city is 5.5%, well above the 3.9% national rate.

43. Oklahoma City, Oklahoma
> 2018 violent crime rate: 867.3 per 100,000 people
> 2018 homicides: 52
> Poverty rate: 17.1%
> 2018 unemployment rate: 3.2%
Oklahoma City is the second most dangerous city in Oklahoma and 43rd most dangerous in the United States. There were 867 violent crimes for every 100,000 people in the city in 2018, less than the 1,065 per 100,000 reported in Tulsa — but well more than double the nationwide rate of 369 per 100,000.
As is the case nationwide, aggravated assaults are the most common violent offense in Oklahoma City. Of the 5,663 violent crimes reported in the city last year, nearly 4,000 were classified as aggravated assaults.

42. Odessa, Texas
> 2018 violent crime rate: 877.5 per 100,000 people
> 2018 homicides: 8
> Poverty rate: 11.8%
> 2018 unemployment rate: 2.6%
Odessa, a small city of about 120,000 in west Texas, is one of four cities in the Lone Star State to rank on this list. There were 877 violent crimes reported in the city for every 100,000 people in 2018, more than double the 369 per 100,000 national rate. According to a spokesperson from the city police department, the vast majority of these crimes were either drug related or domestic incidents.
[in-text-ad-2]

41. Modesto, California
> 2018 violent crime rate: 882.2 per 100,000 people
> 2018 homicides: 16
> Poverty rate: 17.0%
> 2018 unemployment rate: 5.8%
Of the five California cities to rank on this list, Modesto is the safest. Still, the 882 violent crimes for every 100,000 people reported in the city in 2018 was more than double the national violent crime rate of 369 incidents 100,000 Americans.
While the rates of violent crimes like murder and rape are not especially high in Modesto compared to other cities on this list, the aggravated assault rate is. There were 632 cases of aggravated assault reported for every 100,000 people in Modesto, ranking the central California city among the 30 worst in the country for that crime.

40. Philadelphia, Pennsylvania
> 2018 violent crime rate: 908.7 per 100,000 people
> 2018 homicides: 351
> Poverty rate: 25.8%
> 2018 unemployment rate: 5.5%
Philadelphia is one of only 40 American cities with a violent crime rate of over 900 incidents per 100,000 people. Nationwide, the 2018 violent crime rate was 369 per 100,000. Homicide is especially common in Philadelphia. According to the FBI, there were 351 murders in the city last year, the second most in the country, trailing only Chicago, and far more than the 295 homicides reported in New York, a city less than 100 miles away with a population more than five times that of Philadelphia.
In June 2019, the City of Philadelphia awarded $700,000 in grants to community groups that provide services like employment connection and education support throughout the city in an effort to reduce violence.
[in-text-ad]
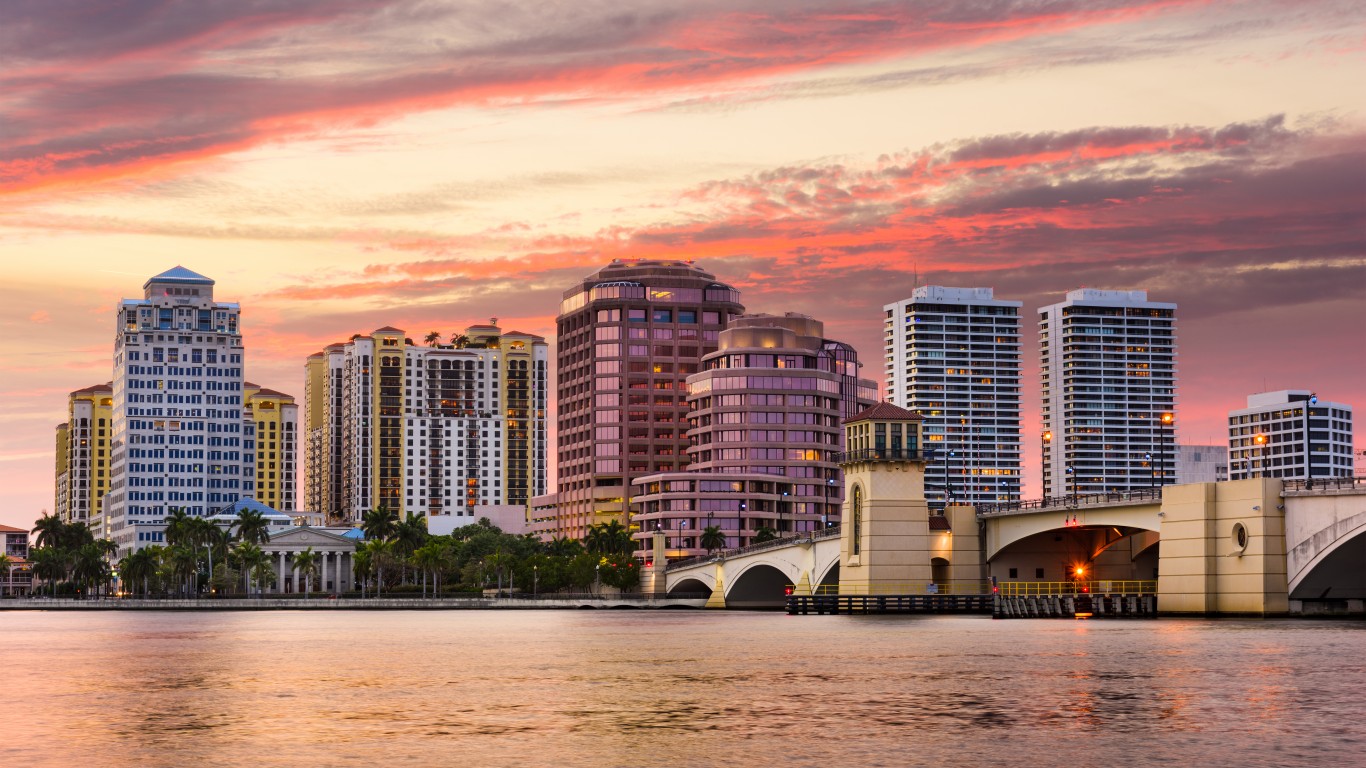
39. West Palm Beach, Florida
> 2018 violent crime rate: 918.9 per 100,000 people
> 2018 homicides: 27
> Poverty rate: 18.9%
> 2018 unemployment rate: 3.5%
West Palm Beach is the only city in the Sunshine State to rank among the most dangerous in the country. There were 1,026 violent crimes in the city in 2018, or about 919 for every 100,000 residents. The city, separated from the Atlantic Ocean by the barrier island of Palm Beach, has a particularly high murder rate. There were 24 homicides for every 100,000 people in the city in 2018, 12th highest among U.S. cities and nearly five times the national murder rate.
Much of the violence in the city is gang related. In response, city officials earlier this year announced the creation of a multi-agency task force to crack down on gang activity. In June 2019 the Palm Beach County Sheriff’s Office arrested 14 members of the Firehouse Clique gang on multiple charges, including drug trafficking, aggravated assault, and homicide.

38. Baton Rouge, Louisiana
> 2018 violent crime rate: 919.5 per 100,000 people
> 2018 homicides: 79
> Poverty rate: 26.0%
> 2018 unemployment rate: 4.8%
The Louisiana state capital is one of the most dangerous cities in both the state and the country. There were about 920 violent crimes — which include offenses like murder, rape, robbery, and aggravated assault — for every 100,000 people in the city in 2018. Even more staggering, however, is the city’s murder rate. There were 79 homicides reported in the city in 2019, or 35 for every 100,000 people, the sixth highest murder rate of any city tracked by the FBI and about seven times higher than the national violent crime rate.
As violence remains high in the city, the local police department is grappling with staffing shortages. In an effort to use police resources more efficiently, police officials have begun to utilize new software that identifies hot spots in the city where crime is most likely to occur.
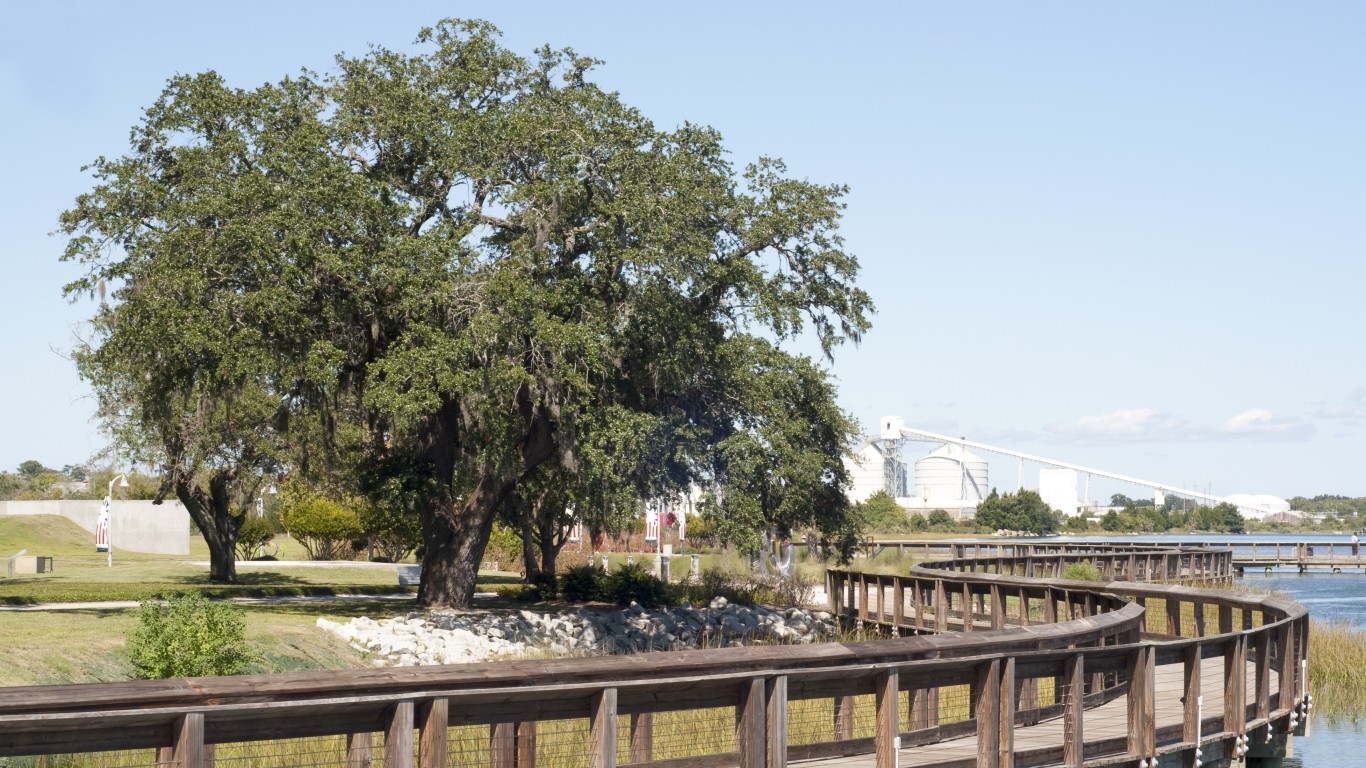
37. North Charleston, South Carolina
> 2018 violent crime rate: 920.8 per 100,000 people
> 2018 homicides: 25
> Poverty rate: 22.8%
> 2018 unemployment rate: 3.2%
With a violent crime rate of 921 incidents per 100,000 people, North Charleston is the only city in the Carolinas to rank among the most dangerous in the United States. Violent crimes like aggravated assault and robbery are not the only violations common in the city. North Charleston’s property crime rate — which includes offenses like burglary and motor vehicle theft — of 5,820 per 100,000 people ranks higher than all but nine other cities tracked by the FBI.
In early 2018, Reggie Burgess was sworn in as the new police chief of North Charleston. Burgess’s answer to the city’s crime problem has been increased emphasis on community policing, a strategy that proactively addresses the root causes of crime by building a relationship of trust between law enforcement and local residents.
[in-text-ad-2]
36. Dayton, Ohio
> 2018 violent crime rate: 921.5 per 100,000 people
> 2018 homicides: 37
> Poverty rate: 32.7%
> 2018 unemployment rate: 5.4%
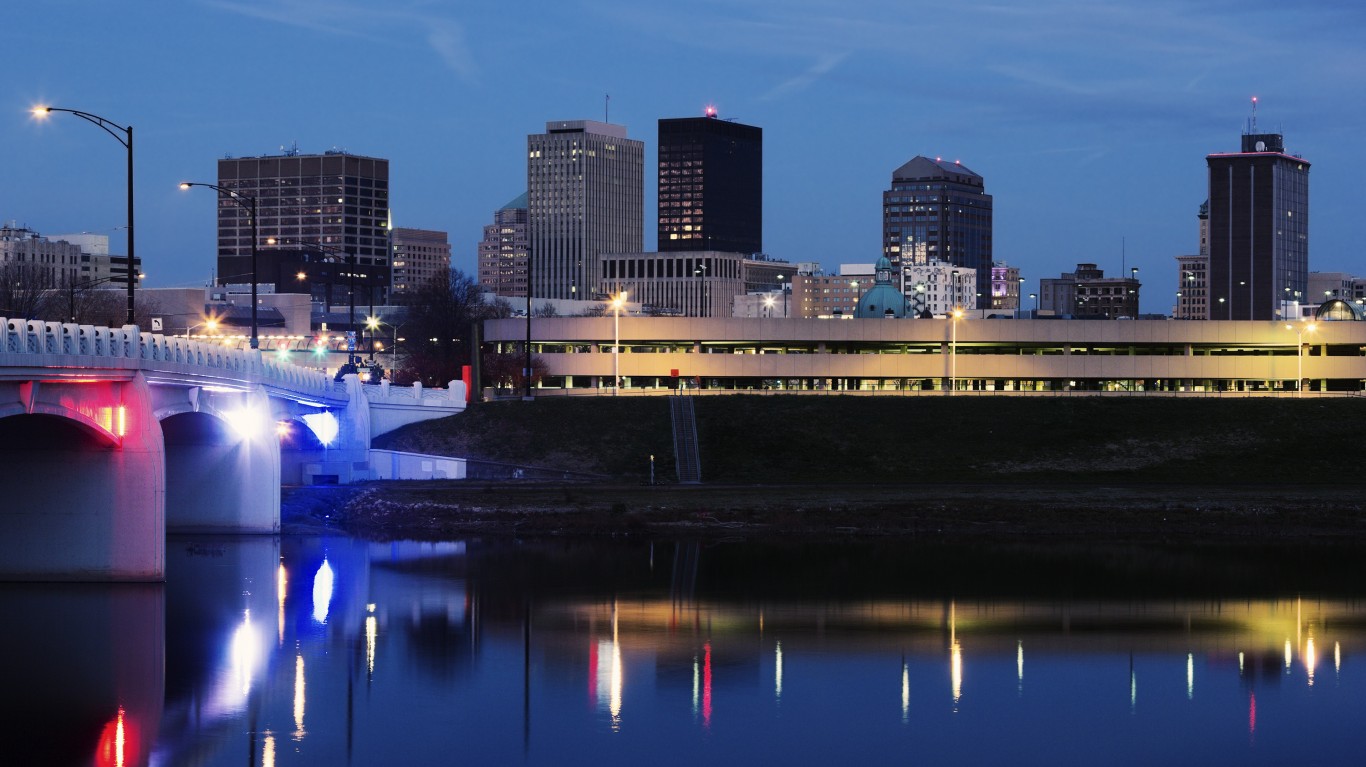
There were about 922 violent crimes for every 100,000 people in Dayton, Ohio, in 2018, well more than double the national violent crime rate of 369 per 100,000. Crime is often higher in areas with limited economic opportunity. In Dayton, 32.7% of the population lives below the poverty line, more than double the national poverty rate of 14.6%.
Including Dayton, five of the 50 cities on this list are located in Ohio. The only other state with as many cities with violent crime rates high enough to rank on this list is California, the most populous state in the country.

35. Washington, District Of Columbia
> 2018 violent crime rate: 941.4 per 100,000 people
> 2018 homicides: 160
> Poverty rate: 17.4%
> 2018 unemployment rate: 5.6%
There were 941 violent crimes for every 100,000 people in Washington, D.C. in 2018. Though in every city on this list, homicide accounts for a relatively small share of violence overall, Washington has one of the highest murder rates in the country. There were 160 reported homicides in the nation’s capital in 2018, or 23 for every 100,000 people — more than four times the murder rate nationwide.
While overall crime is down in the city this year, a series of fatal shootings in October 2019 has given new urgency to the city’s Fall Crime Prevention Initiative. The program aims to reduce crime through community outreach and increased patrolling in historically violent areas.
[in-text-ad]

34. Richmond, California
> 2018 violent crime rate: 942.5 per 100,000 people
> 2018 homicides: 17
> Poverty rate: 15.7%
> 2018 unemployment rate: 3.6%
Richmond, a small city just north of Berkeley on the San Francisco Bay, has one of the highest violent crime rates in the United States. There were 943 reported incidents of rape, robbery, aggravated assault, and homicide for every 100,000 residents in 2018 — well more than double the national violent crime rate of 369 per 100,000. The city’s robbery rate of 338 robberies per 100,000 residents is particularly high as the national robbery rate is just 86 per 100,000.
In the last decade, Richmond has made significant strides in reducing violence through its program known as Operation Peacemaker, which paid potential criminals for avoiding trouble.

33. North Las Vegas, Nevada
> 2018 violent crime rate: 966.2 per 100,000 people
> 2018 homicides: 33
> Poverty rate: 15.1%
> 2018 unemployment rate: 5.3%
The violent crime rate of 966 incidents per 100,000 people in North Las Vegas is driven primarily by aggravated assaults. Of the 2,386 total violent crimes reported in the city in 2018, 1,760 were aggravated assaults. Unlike most cities on this list, property crime is not especially common in North Las Vegas. There were just 2,106 incidents of crimes like motor vehicle theft and larceny for every 100,000 people in the city in 2018, below the national property crime rate of 2,200 per 100,000.

32. Springfield, Massachusetts
> 2018 violent crime rate: 988.5 per 100,000 people
> 2018 homicides: 19
> Poverty rate: 28.7%
> 2018 unemployment rate: 6.2%
Springfield — the only Massachusetts city to rank on this list — has the second highest violent crime rate of any city in the New England region and the 32nd highest among midsize or large cities nationwide. The city’s violent crime rate of 986 incidents per 100,000 people is driven largely by robberies and incidents of aggravated assault — together, those two classifications accounted for 92% of all violent crime in the city last year.
As is often the case in cities with high rates of violent crime, economic opportunity appears to be relatively limited in Springfield. The city’s 28.7% poverty rate is nearly double the 14.6% national rate.
[in-text-ad-2]

31. Pueblo, Colorado
> 2018 violent crime rate: 993.2 per 100,000 people
> 2018 homicides: 9
> Poverty rate: 24.4%
> 2018 unemployment rate: 5.3%
Pueblo is the only city in Colorado to rank on this list. Pueblo’s violent crime rate of 993 incidents per 100,000 people is higher than the rate in all but 30 other midsize or large U.S. cities that are tracked by the FBI. The city has a particularly high rape rate, with 166 incidents for every 100,000 people in 2018, higher than in all but three other U.S. cities with at least 100,000 people and nearly four times the comparable national rate.
As is often the case in cities with high rates of violence, property crimes are also relatively common in Pueblo. There were 5,576 property crimes — which include burglary, larceny, and motor vehicle theft — for every 100,000 people, more than in all but 11 other cities of comparable size tracked by the FBI.

30. Lubbock, Texas
> 2018 violent crime rate: 996.6 per 100,000 people
> 2018 homicides: 13
> Poverty rate: 19.8%
> 2018 unemployment rate: 3.1%
Lubbock, a city of about a quarter of a million people in northwest Texas, is the third most dangerous city in the state and the 30th most dangerous nationwide. There were 2,565 violent crimes in the city in 2018 — or about 997 for every 100,000 people. For context, the national violent crime rate is 369 per 100,000.
Recently, dozens of community leaders in the city met at the Crimes Victims Coalition’s Hope, Health, and Healing Conference to learn to identify signs of domestic crimes that are going unaddressed.
[in-text-ad]

29. Chicago, Illinois
> 2018 violent crime rate: 1,006.1 per 100,000 people
> 2018 homicides: 563
> Poverty rate: 20.6%
> 2018 unemployment rate: 4.2%
Chicago is one of 29 midsize to large U.S. cities tracked by the FBI with a violent crime rate of over 1,000 incidents per 100,000 people. There were 563 homicides reported in Chicago in 2018, by far the most of any U.S. city. For context, there were 295 murders the same year in New York, a city with a population more than triple that of Chicago. Robberies are also especially common in Chicago, with 356 incidents per 100,000 people — more than four times the comparable robbery rate nationwide.
Gun violence in Chicago is typically connected to gang activity and drug trafficking. Aside from those two hallmarks, there are few other patterns city officials can identify to help stem epidemic.

28. Houston, Texas
> 2018 violent crime rate: 1,026.1 per 100,000 people
> 2018 homicides: 276
> Poverty rate: 21.2%
> 2018 unemployment rate: 4.2%
Home to over 2.3 million people, and with a violent crime rate of 1,026 incidents for every 100,000 people, Houston is the most dangerous very large city in the United States. The robbery rate is especially high in Houston. There were 374 robberies reported for every 100,000 city residents in 2018, more than in all but nine other cities tracked by the FBI and more than quadruple the national robbery rate. Additionally, Houston’s murder rate of 11.8 per 100,000 is more than double the comparable national rate.

27. South Bend, Indiana
> 2018 violent crime rate: 1,039.1 per 100,000 people
> 2018 homicides: 9
> Poverty rate: 25.4%
> 2018 unemployment rate: 4.0%
South Bend is one of the most dangerous cities in the United States. There were 1,064 violent crimes committed in the city in 2018 — or 1,039 for every 100,000 people, nearly triple the national violent crime rate of 369 per 100,000. Crime tends to be more common in areas with limited economic opportunity, and in South Bend, more than one in every four residents live below the poverty line.
Since Decomocratic presidential candidate Pete Buttigieg took office as mayor of the city, crime rates have actually fallen. During Buttigieg’s tenure, the city police department enacted South Bend Group Violence Intervention — a program designed to reduce gun violence by focusing on gangs and other groups most likely to commit violence.
[in-text-ad-2]

26. Buffalo, New York
> 2018 violent crime rate: 1,042.5 per 100,000 people
> 2018 homicides: 57
> Poverty rate: 30.9%
> 2018 unemployment rate: 5.7%
Buffalo is the only city in New York state to rank on this list. There were 2,692 violent crimes committed in the city in 2018, or about 1,043 for every 100,000 residents, well above the 369 per 100,000 national crime rate. As is often the case in cities with higher than average crime rates, many of Buffalo’s residents are struggling economically. The city’s average annual unemployment of 5.7% is far higher than the 3.9% national rate in 2018. Additionally, 30.9% of people in Buffalo live below the poverty line, more than double the comparable national poverty rate of 14.9%.
The city has adopted a holistic approach to crime reduction through the Community Crime Prevention Initiative. The program brings community members, faith-based leaders, and law enforcement together to identify and plan solutions.

25. Chattanooga, Tennessee
> 2018 violent crime rate: 1,048.2 per 100,000 people
> 2018 homicides: 19
> Poverty rate: 20.7%
> 2018 unemployment rate: 3.7%
In Chattanooga, Tennessee, the violent crime rate is driven primarily by aggravated assaults. There were 783 cases of aggravated assault for every 100,000 people in the city in 2018, more than triple the national rate of 247 aggravated assault per 100,000 people.
Police in Chattanooga are stepping up surveillance capabilities in an attempt to bring the crime rate down. In November, 2019, the city will add eight more public safety cameras to the 29 already installed throughout the city.
[in-text-ad]

24. Beaumont, Texas
> 2018 violent crime rate: 1,059.7 per 100,000 people
> 2018 homicides: 13
> Poverty rate: 19.7%
> 2018 unemployment rate: 5.6%
Of the four Texas cities on this list, Beaumont is the most dangerous. There were 1,060 violent crimes for every 100,000 city residents in 2018, slightly more than the violent crime rate of 1,026 per 100,000 in Houston, the second most dangerous city in the Lone Star State.
The Beaumont Police Department recently became the latest recipients of a high-tech tool from the ATF that could lead to a reduction in gun violence the city. The tool, known as the National Integrated Ballistic Information Network, creates a database of 3D images of shell casings from crime scenes, allowing law enforcement to determine whether the same firearm was used in different crimes — information that could prove valuable in catching perpetrators.

23. Tulsa, Oklahoma
> 2018 violent crime rate: 1,065.1 per 100,000 people
> 2018 homicides: 60
> Poverty rate: 20.0%
> 2018 unemployment rate: 3.6%
Tulsa is the most dangerous mid- to large-size city in Oklahoma and 23rd most dangerous nationwide. There were 1,065 violent crimes in the city for every 100,000 residents in 2018, higher than the violent crime rate of 867 per 100,000 in Oklahoma City, the second most dangerous city in the state, and well above the national violent crime rate of 369 per 100,000.
Recently, Tulsa police have reported a considerable increase in the number of firearms — legally owned and otherwise — removed from the streets. Some 1,543 guns were seized in the city in 2018, and 1,070 were confiscated between Jan. 1 and Oct. 10, 2019. Officials attribute the climbing gun seizures to increased anti-gang enforcement.

22. Hartford, Connecticut
> 2018 violent crime rate: 1,066.5 per 100,000 people
> 2018 homicides: 21
> Poverty rate: 30.5%
> 2018 unemployment rate: 7.0%
Hartford is the most dangerous major city in both Connecticut and the broader New England region. There were 1,067 violent crimes for every 100,000 people in Connecticut’s capital city in 2018, nearly triple the national violent crime rate of 369 per 100,000.
Crime rates are often higher in areas with limited economic opportunity — and in Hartford, unemployment is high. An average of 7.0% of the city’s labor force were unemployed in 2018, well above the comparable 3.9% national unemployment rate. The lack of jobs is contributing to serious financial hardship for many in the city. Some 30.5% of Hartford residents live below the poverty line, more than double the 14.9% national poverty rate.
[in-text-ad-2]

21. Lansing, Michigan
> 2018 violent crime rate: 1,108.4 per 100,000 people
> 2018 homicides: 8
> Poverty rate: 27.1%
> 2018 unemployment rate: 5.2%
Trailing only Detroit, Lansing is the second most dangerous city in Michigan. The city’s violent crime rate of 1,108 incidents per 100,000 people is driven primarily by cases of aggravated assault. Of the 1,301 violent crimes reported in the city in 2018, 962 were aggravated assaults.
Earlier this year, the Department of Justice awarded the state of Michigan to $122 million to fight violent gang, drug, and firearm-related crimes. Specifically, the money will be used to hire and train law enforcement officials and process DNA evidence to help solve crimes.

20. Nashville, Tennessee
> 2018 violent crime rate: 1,113.1 per 100,000 people
> 2018 homicides: 91
> Poverty rate: 17.2%
> 2018 unemployment rate: N/A
The Nashville metro area is one of only 20 midsize or large cities nationwide with a violent crime rate that is more than triple the national rate of 369 per 100,000.
Aggravated assaults are the most common form of violence in the city, accounting for nearly two-thirds of the 7,641 violent offenses reported in 2018 — and the problem only appears to be getting worse. Cases of aggravated assault are up a staggering 23% in the city so far in 2019. According to Nashville police, the most dangerous parts of the city this year include Opry Mills, East Thompson Lane, and Murfreesboro Pike. It should be noted that the reporting agency is the Metropolitan Nashville Police Department, but these rates and figures apply to the city of Nashville.
[in-text-ad]
19. New Orleans, Louisiana
> 2018 violent crime rate: 1,163.3 per 100,000 people
> 2018 homicides: 147
> Poverty rate: 25.4%
> 2018 unemployment rate: 5.0%
Of the three Louisiana cities to rank on this list, New Orleans is the most dangerous. There were 1,163 violent crimes for every 100,000 people in the city in 2018, well above the violent crime rate of 920 per 100,000 in Baton Rouge, the state’s second most dangerous city.
New Orleans’ homicide rate of 37 murders per 100,000 people is the fifth highest among mid- to large-size American cities. There were 147 murders total in the city of about 400,000 last year, more than the 132 committed in Phoenix, a city four times the size of New Orleans.

18. Wichita, Kansas
> 2018 violent crime rate: 1,179.9 per 100,000 people
> 2018 homicides: 38
> Poverty rate: 16.9%
> 2018 unemployment rate: 3.9%
Wichita’s violent crime rate, the 18th highest of all cities in the country, is driven largely by cases of aggravated assault. About 75% of the 4,622 violent crimes reported in the city last year were classified as aggravated assault.
Police officials in Wichita are concerned that gang activity may lead to increased violence. The city’s police chief is urging lawmakers to fund prevention programs that will reduce gang activity and ultimately, violent crime.
17. Indianapolis, Indiana
> 2018 violent crime rate: 1,272.8 per 100,000 people
> 2018 homicides: 162
> Poverty rate: 20.1%
> 2018 unemployment rate: 3.5%
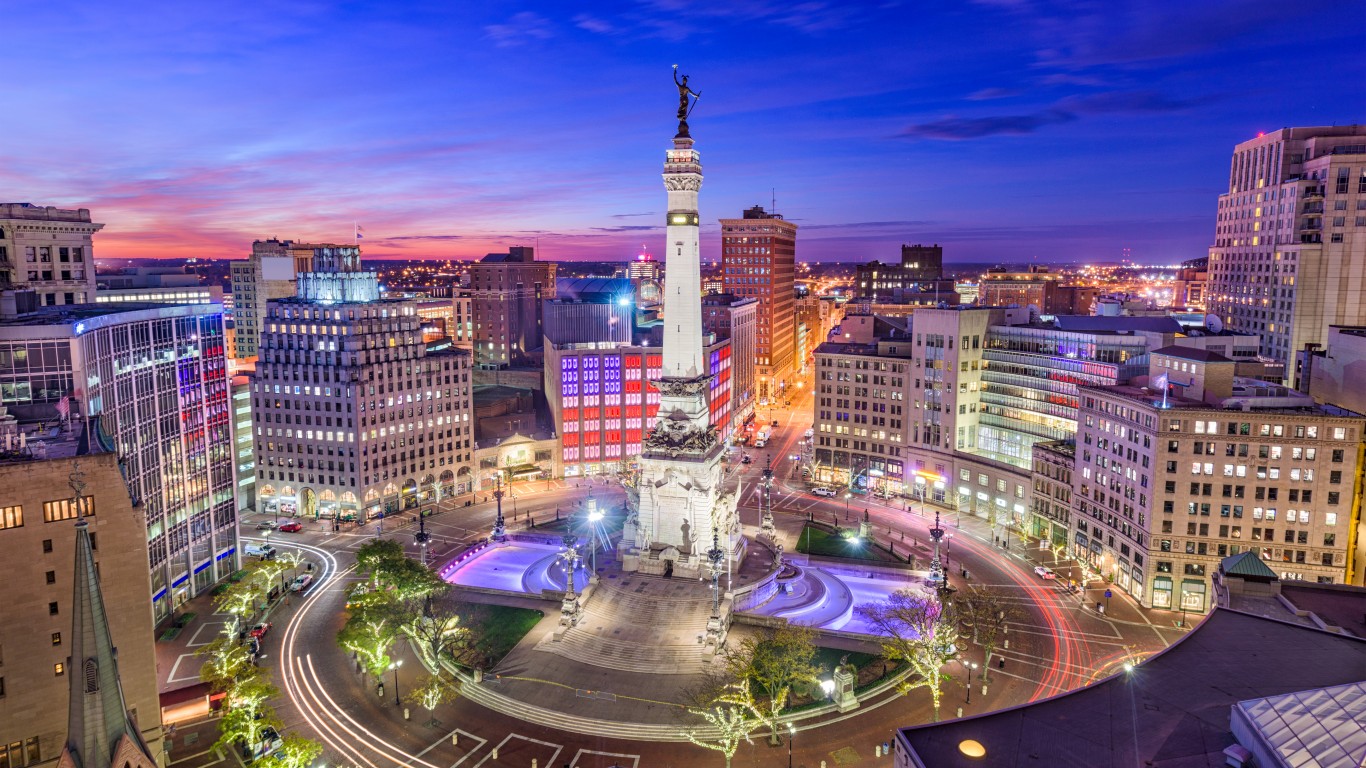
Indianapolis is the most dangerous mid- to large-size city in Indiana and the 17th most dangerous nationwide. There were 1,273 violent crimes in the city for every 100,000 people in 2018, higher than the rate of 1,039 per 100,000 in South Bend, the second most dangerous city in the state, and more than triple the 369 per 100,000 national violent crime rate.
As is often the case, firearms are frequently used in violent crimes carried out in Indianapolis. In an attempt to stem the tide of gun violence, community leaders and police are holding gun buyback events in the city with thousands of dollars available for those who participate.
[in-text-ad-2]

16. Oakland, California
> 2018 violent crime rate: 1,273.7 per 100,000 people
> 2018 homicides: 70
> Poverty rate: 18.7%
> 2018 unemployment rate: 3.4%
There were nearly 5,500 violent crimes committed in Oakland, California, in 2018, or 1,274 for every 100,000 city residents, a higher violent crime rate than in all but 15 other large cities nationwide. Robbery, in particular, is a major problem in Oakland. The city’s robbery rate of 610 incidents per 100,000 people is the second highest in the country, trailing only Baltimore’s. For context, the robbery rate nationwide is 86 per 100,000.
In recent years, the Oakland Police Department has gotten a better handle on gun violence with the aid of a computer program called Law Enforcement Analysis Portal developed by a group of tech entrepreneurs in nearby Silicon Valley. The program can collate and analyze troves of crime data, including arrest notes, license plate numbers, and gun trace reports.

15. Anchorage, Alaska
> 2018 violent crime rate: 1,309.6 per 100,000 people
> 2018 homicides: 26
> Poverty rate: 8.1%
> 2018 unemployment rate: 5.5%
Rape is one of four violent crime classifications as defined by the FBI, and in Anchorage, there were 210 rapes reported for every 100,000 people, the highest rate of any U.S. city with a population of at least 100,000. For context, the national rape rate is 43 per 100,000. As is the case in most cities, however, aggravated assault is the most commonly reported crime in anchorage. About 65% of the 3,824 violent offenses committed in the city in 2018 were aggravated assaults.
[in-text-ad]

14. Springfield, Missouri
> 2018 violent crime rate: 1,316.0 per 100,000 people
> 2018 homicides: 16
> Poverty rate: 25.7%
> 2018 unemployment rate: 2.7%
Driven disproportionately by incidents of rape and aggravated assault, the violent crime rate in Springfield, Missouri, of 1,316 incidents per 100,000 people is among the highest among midsize or large cities in the United States. As is often the case in dangerous cities, other, non-violent crimes are also common in Springfield. There were 7,019 property crimes — a category that includes motor vehicle theft and burglary — for every 100,000 people in the city in 2018, the second highest of any major U.S. city. Nationwide, there were 2,200 property crimes for every 100,000 people in 2018.

13. San Bernardino, California
> 2018 violent crime rate: 1,333.1 per 100,000 people
> 2018 homicides: 49
> Poverty rate: 30.6%
> 2018 unemployment rate: 5.2%
Only 12 U.S. cities home to 100,000 people or more have a higher violent crime rate than San Bernardino, California. There were nearly 3,000 incidents of rape, robbery, aggravated assault, and homicide in the city in 2018 — or 1,333 violent crimes for every 100,000 people. For reference, the national violent crime rate was 369 per 100,000 last year.
High crime areas often have limited economic opportunities — and San Bernardino is a case in point. The annual unemployment in the city is 5.2%, and 30.6% of the population lives below the poverty line. Nationwide, the annual unemployment rate is just 3.9%, and the poverty rate of 14.6% is less than half that of San Bernardino.

12. Albuquerque, New Mexico
> 2018 violent crime rate: 1,364.8 per 100,000 people
> 2018 homicides: 69
> Poverty rate: 18.2%
> 2018 unemployment rate: 4.5%
In Albuquerque, New Mexico, the rates of murder and rape are more than double the corresponding rates nationwide. The aggravated assault rate, meanwhile, is more than three times as high as it is across the country as a whole, and the city’s robbery rate of 353 incidents per 100,000 people is more than quadruple the national robbery rate.
Non-violent crimes like burglary and motor vehicle theft are also relatively common in Albuquerque. There were 6,179 property crimes for every 100,000 people in the city in 2018, more than in all but five other U.S. cities. For context, the national property crime rate is 2,200 per 100,000.
[in-text-ad-2]

11. Rockford, Illinois
> 2018 violent crime rate: 1,386.5 per 100,000 people
> 2018 homicides: 23
> Poverty rate: 22.2%
> 2018 unemployment rate: 6.8%
Of the three cities in Illinois to rank on this list, Rockford is the most dangerous. While the city of Chicago regularly makes national news for its staggering rates of gun violence, the Windy City’s violent crime rate of 1,006 incidents per 100,000 people is considerably lower than the violent crime rate of 1,386 per 100,000 people in Rockford. As is often the case, Rockford’s violent crime rate is driven largely by cases of aggravated assaults. About three out of every four violent crimes reported in the city are aggravated assaults.
Cities with high crime rates often have struggling economies, and in Rockford, joblessness is a major problem. The city’s annual unemployment rate of 6.8% is well above the unemployment rate nationwide of 3.9%.

10. Stockton, California
> 2018 violent crime rate: 1,399.6 per 100,000 people
> 2018 homicides: 33
> Poverty rate: 22.4%
> 2018 unemployment rate: 6.9%
Of the five California cities to rank on this list, Stockton is the most dangerous. There were 4,383 violent crimes reported in the city in 2018 — or about 1,400 for every 100,000 people. The city’s robbery rate of 385 incidents per 100,000 people and aggravated assault rate of 943 per 100,000 each ranks as the eighth highest among U.S. cities.
Like most cities on this list, economic opportunities are relatively limited in Stockton. An average of 6.9% of the labor force in the city were out of a job in 2018, well above the 3.9% national unemployment rate.
[in-text-ad]

9. Milwaukee, Wisconsin
> 2018 violent crime rate: 1,413.0 per 100,000 people
> 2018 homicides: 99
> Poverty rate: 27.4%
> 2018 unemployment rate: 4.0%
Milwaukee is by far the most dangerous mid- to large-size city in Wisconsin and one of the most dangerous in the Midwest. There were 1,413 violent crimes for every 100,000 people in the city in 2018. In Green Bay, the second most violent city in the state tracked by the FBI, there were 459 violent crimes for every 100,000, nearly one-third the rate in Milwaukee.
The city is seeking to reduce violence through a program known as Cure Violence, which is based on a model that has been shown to be effective in other urban areas like Brooklyn and Chicago. The model involves paying and training community insiders to anticipate violence in a community and intervene before it breaks out.

8. Little Rock, Arkansas
> 2018 violent crime rate: 1,446.1 per 100,000 people
> 2018 homicides: 40
> Poverty rate: 17.8%
> 2018 unemployment rate: 3.5%
The capital of Arkansas ranks among the most dangerous large cities in the United States. There were 1,446 violent crimes for every 100,000 people in the city in 2018, nearly quadruple the 369 per 100,000 national violent crime rate.
Non-violent crimes like burglary and larceny are also relatively common in Little Rock. There were 6,548 property crimes for every 100,000 people in the city in 2018, the third most among U.S. cities. For context, the national property crime rate is 2,200 per 100,000.
7. Cleveland, Ohio
> 2018 violent crime rate: 1,449.6 per 100,000 people
> 2018 homicides: 86
> Poverty rate: 35.2%
> 2018 unemployment rate: 6.5%
Of the six Ohio cities home to at least 100,000 people that are tracked by the FBI, Columbus is the only one that does not rank on the 50 most dangerous cities nationwide, while Cleveland is the most dangerous. There were 1,450 violent crimes reported for every 100,000 people in Cleveland in 2018, compared to 495 per 100,000 in Columbus and 369 per 100,000 nationwide.
Violent crime rates are typically driven primarily by cases of aggravated assault, and in Cleveland, there were 3,257 aggravated assaults reported in 2018, more than double the 1,575 reported in Columbus, a city with a population more than twice the size of Cleveland’s.
[in-text-ad-2]

6. Kansas City, Missouri
> 2018 violent crime rate: 1,590.3 per 100,000 people
> 2018 homicides: 137
> Poverty rate: 17.3%
> 2018 unemployment rate: 3.5%
Kansas City ranks as the second most dangerous midsize to large city in Missouri and the sixth most dangerous nationwide. There were 7,842 violent crimes reported in the city of fewer than half a million people in 2018. For reference, there were 5,360 violent crimes reported in San Diego — a city with a population of about three times that of Kansas City — the same year. The most dangerous parts of Kansas City include Downtown, Lykins, and Shoal Creek.
Recently, Missouri Gov. Mike Parson met with Kansas City Mayor Quinton Lucas as well as the mayors of Columbia, Springfield, and St. Louis to discuss crime reduction strategies.

5. St. Louis, Missouri
> 2018 violent crime rate: 1,800.4 per 100,000 people
> 2018 homicides: 187
> Poverty rate: 25.0%
> 2018 unemployment rate: 3.8%
There were 187 murders committed in St. Louis in 2018. While several other much larger cities had more murders that year, adjusted for population, St. Louis’s homicide rate of 61 incidents per 100,000 people is the highest of any U.S. city. For reference, the murder rate in Baltimore of 51 per 100,000 is the second highest among U.S. cities. Nationwide, there were 5 murders for every 100,000 people.
In an effort to reduce violence in St. Louis and bring perpetrators to justice, city officials may implement an aerial surveillance system initially developed by Ohio-based company Persistent Surveillance Systems for the U.S. military to use in Fallujah, Iraq.
[in-text-ad]
4. Baltimore, Maryland
> 2018 violent crime rate: 1,833.4 per 100,000 people
> 2018 homicides: 309
> Poverty rate: 22.4%
> 2018 unemployment rate: 5.7%
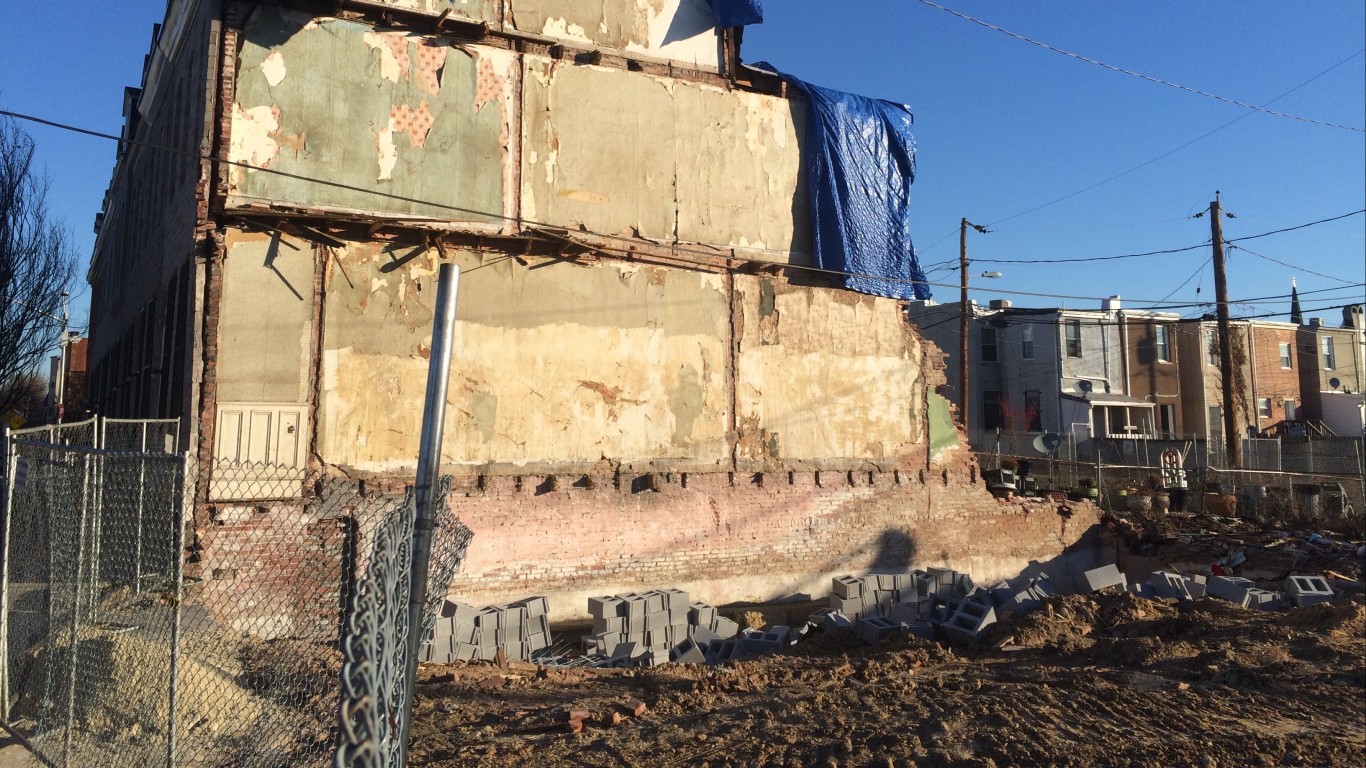
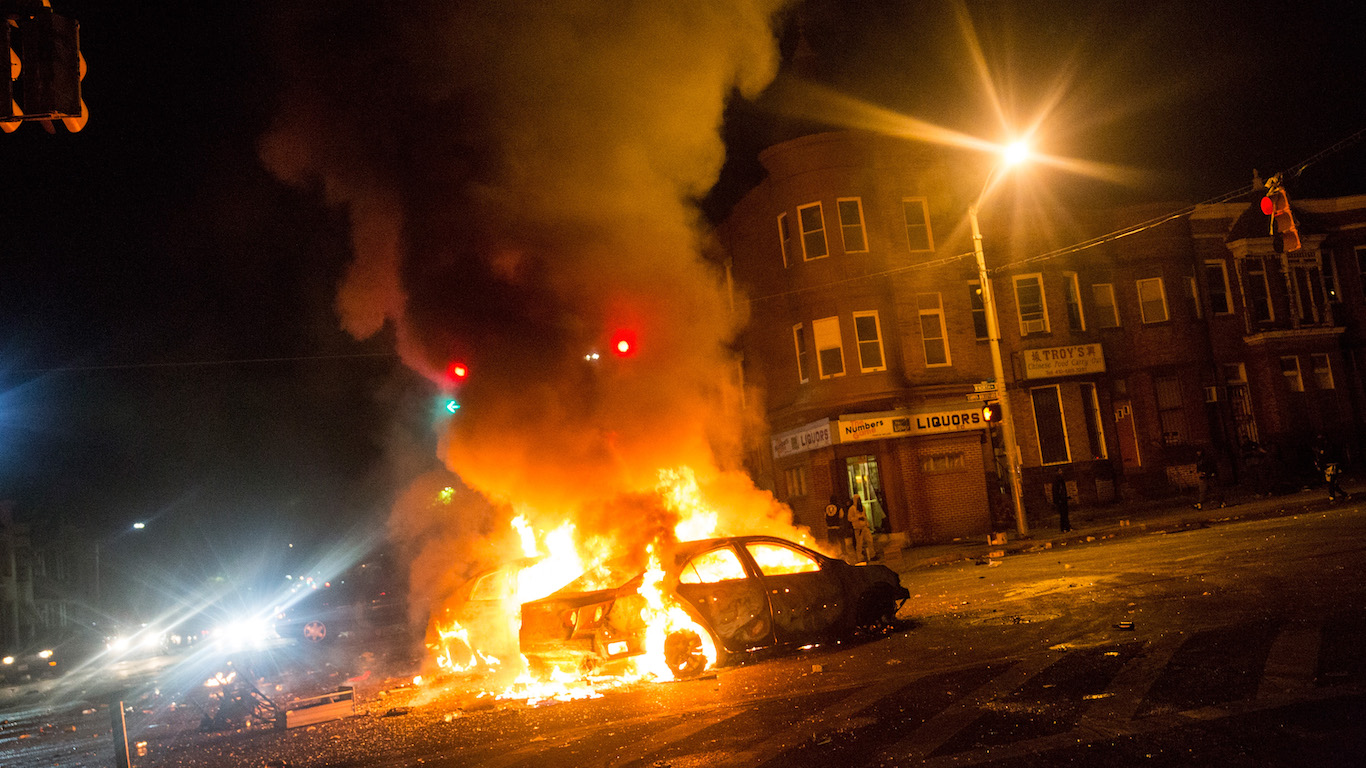
Baltimore’s violent crime rate of 1,833 incidents per 100,000 people is nearly five times higher than the national violent crime rate. The city’s robbery rate of 837 incidents per 100,000 people is the highest in the country, and the murder rate of 51 per 100,000 is second highest, trailing only St. Louis.
In one Baltimore neighborhood, local residents have taken it upon themselves to install a network of about 500 surveillance cameras — the footage from which has been instrumental in solving dozens of criminal cases. The neighborhood has seen a decrease in crime in recent years, and other Baltimore neighborhoods are beginning to adopt similar initiatives.

3. Birmingham, Alabama
> 2018 violent crime rate: 1,911.5 per 100,000 people
> 2018 homicides: 88
> Poverty rate: 28.1%
> 2018 unemployment rate: 4.6%
Birmingham is one of only three U.S. cities with a violent crime rate more than five times higher than the national rate of 369 violent crimes per 100,000 people. Nearly 70% of the violent crimes reported in Birmingham in 2018 were aggravated assaults, and the vast majority of the rest were robberies. Still, the city’s murder rate of 42 homicides per 100,000 people is the third highest in the nation, trailing only St. Louis and Baltimore.
As is often the case among cities on this list, economic opportunities appear limited in Birmingham. More than one in every four city residents live below the poverty line, nearly double the 14.9% national poverty rate.

2. Memphis, Tennessee
> 2018 violent crime rate: 1,943.2 per 100,000 people
> 2018 homicides: 186
> Poverty rate: 26.9%
> 2018 unemployment rate: 4.6%
The violent crime rate in Memphis of 1,943 incidents per 100,000 people is the highest in the South and the second highest among major cities nationwide. The city also has a far higher than typical property crime rate. There were 6,406 property crimes like motor vehicle theft and larceny for every 100,000 people in Memphis in 2018, fourth highest among U.S. cities and nearly triple the comparable national rate.
The Memphis Police Department recently held its annual Youth Crime Watch Conference, and this year, mother’s who have lost children to violence told their stories in the hopes of giving attendees a broader perspective on the impact of gun violence.
[in-text-ad-2]

1. Detroit, Michigan
> 2018 violent crime rate: 2,007.8 per 100,000 people
> 2018 homicides: 261
> Poverty rate: 37.9%
> 2018 unemployment rate: 9.0%
Detroit is the only midsize or large city in the United States with a violent crime rate of more than 2,000 incidents per 100,000 people. There were about 13,500 total violent crimes — most of them cases of aggravated assault — reported in the city in 2018, several hundred more than there were in Phoenix, a city with a population more than double that of Detroit.
Long suffering from the decline of American manufacturing, Detroit’s population fell from a peak of over 1.8 million in 1950 to fewer than 700,000 today. Since the city’s industrial core has been gutted over the decades, economic opportunities remain scarce in the city. The annual unemployment rate in Detroit is a staggering 9.0%, more than double the 3.9% national rate. Also, 37.9% of Detroit residents live below the poverty line, also more than double the comparable 14.9% poverty rate.
Methodology
To identify the 50 most dangerous U.S. cities, 24/7 Wall St. reviewed violent crime rates in cities with at least 100,000 people from the FBI’s 2018 Uniform Crime Report. The total number and the rates of murder, non-negligent manslaughter, rape, robbery, and aggravated assault, which are included in the violent crime rate, as well as burglaries, larceny, and motor vehicle theft, which are classified as property crime, also came from the FBI’s report.
We considered ten year population change using data from the FBI.
Annual unemployment rates for 2018 came from the Bureau of Labor Statistics. Median household income and poverty rates came from the U.S. Census Bureau’s 2017 American Community Survey and are five-year averages.
Get Ready To Retire (Sponsored)
Start by taking a quick retirement quiz from SmartAsset that will match you with up to 3 financial advisors that serve your area and beyond in 5 minutes, or less.
Each advisor has been vetted by SmartAsset and is held to a fiduciary standard to act in your best interests.
Here’s how it works:
1. Answer SmartAsset advisor match quiz
2. Review your pre-screened matches at your leisure. Check out the advisors’ profiles.
3. Speak with advisors at no cost to you. Have an introductory call on the phone or introduction in person and choose whom to work with in the future
Get started right here.
Thank you for reading! Have some feedback for us?
Contact the 24/7 Wall St. editorial team.
 24/7 Wall St.
 24/7 Wall St.
 24/7 Wall St.
 24/7 Wall St.

 24/7 Wall St.
 24/7 Wall St.
 24/7 Wall St.

