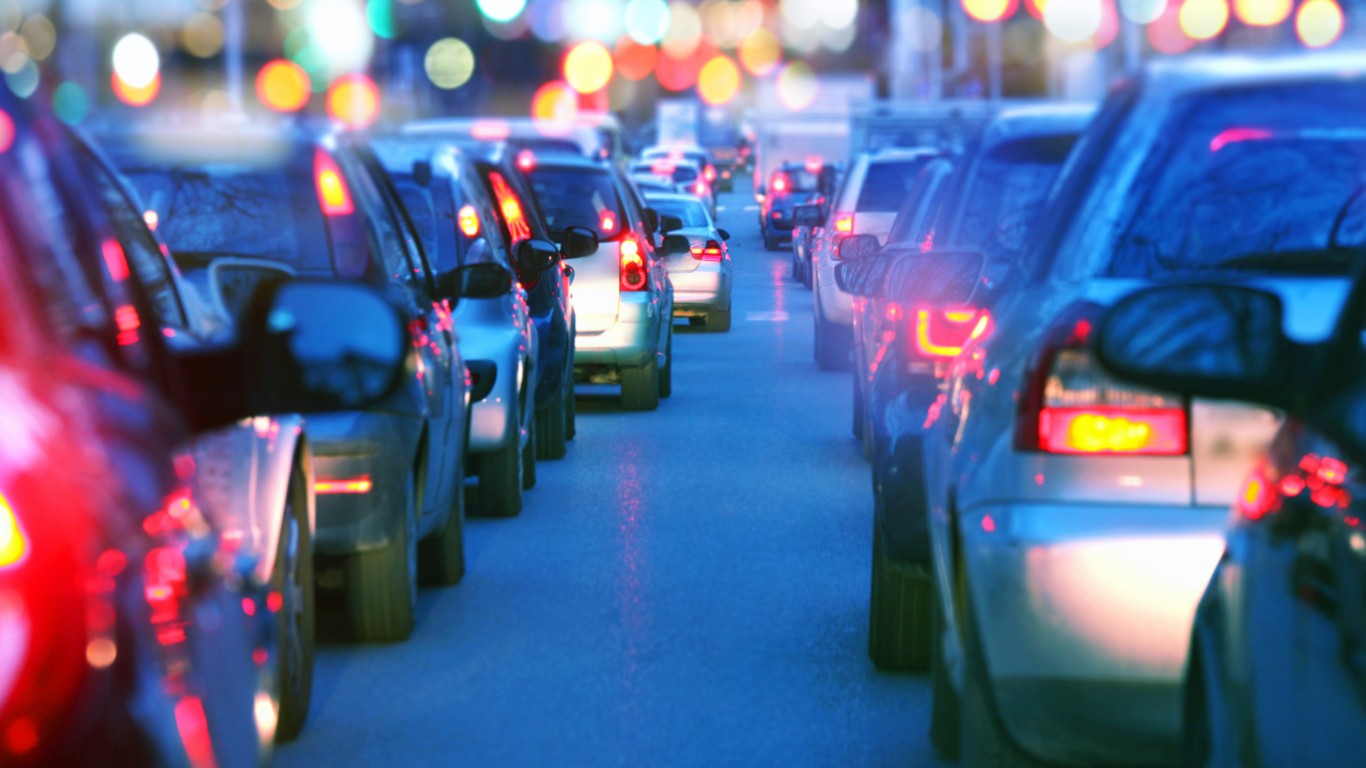
The vast majority of American households own a car, and over 85% of American workers use a car to commute to work. While it is a practical necessity for millions of Americans, driving can also be a financial burden and a major cause of stress — as well as a dangerous activity.
On every road in the country, driving comes with a set of inherent risks and costs. Congested roads, high gas prices, and fatal collisions are but a few. In major cities, some of the risks are lessened, as slower speeds mean fewer fatalities, but the tradeoff may be more traffic congestion and higher vehicle theft rates. These are the cities where your car is most likely to be stolen.
While drivers accept these conditions, potential hazards, and costs when they get behind the wheel, not all cities are equally safe or congested, and some are certainly more expensive for drivers than others.
24/7 Wall St. created an index composed of several driving-related measures from the U.S. Census Bureau, the National Insurance Crime Bureau, Texas A&M’s Transportation Institute, and more, to identify the worst metropolitan statistical areas for drivers. The components of the index — which include average commute time, regional gas prices, drunk driving death rates, overall fatality rates, time and money lost due to congestion, and auto theft rates — were selected to capture an area’s safety, convenience, and cost of driving.
Many of the worst metropolitan areas to drive can be found in just a few states, notably California, where high gas prices and congestion make driving worse in many cities. In some other states, the metropolitan area that ranks the worst in our index compares favorably to the majority of cities in California. These are the worst cities to drive in every state.
Click here to see the 40 worst cities to drive
Click here to see our methodology
40. Tucson, AZ
> 2018 traffic fatalities per 100,000 people: 12.4 (state: 14.1)
> Avg. commute time: 25.3 min.
> 2017 hours lost due to congestion per car: 52.0
> Most dangerous road: I-10
[in-text-ad]
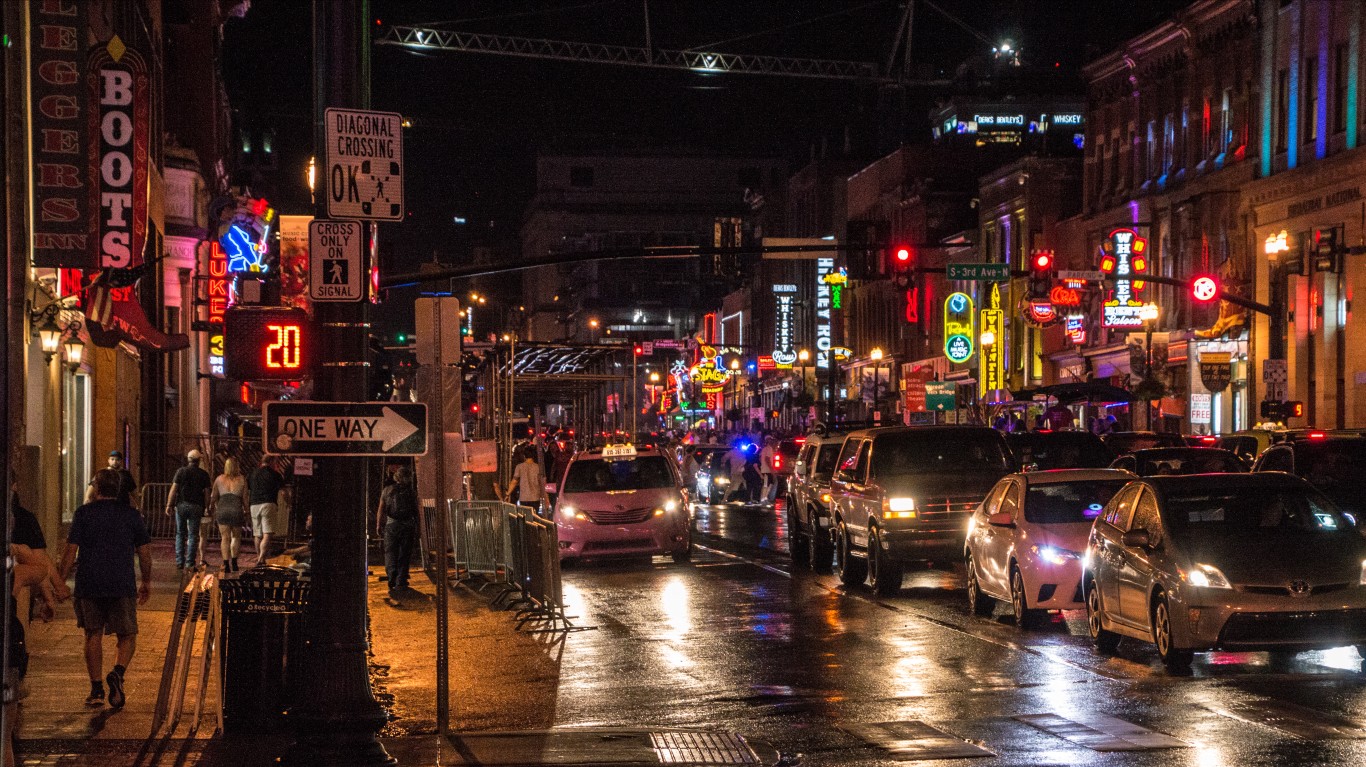
39. Nashville-Davidson–Murfreesboro–Franklin, TN
> 2018 traffic fatalities per 100,000 people: 12.3 (state: 15.4)
> Avg. commute time: 28.1 min.
> 2017 hours lost due to congestion per car: 58.0
> Most dangerous road: I-24

38. Visalia-Porterville, CA
> 2018 traffic fatalities per 100,000 people: 15.5 (state: 9.0)
> Avg. commute time: 23.4 min.
> 2017 hours lost due to congestion per car: 14.6
> Most dangerous road: SR-65
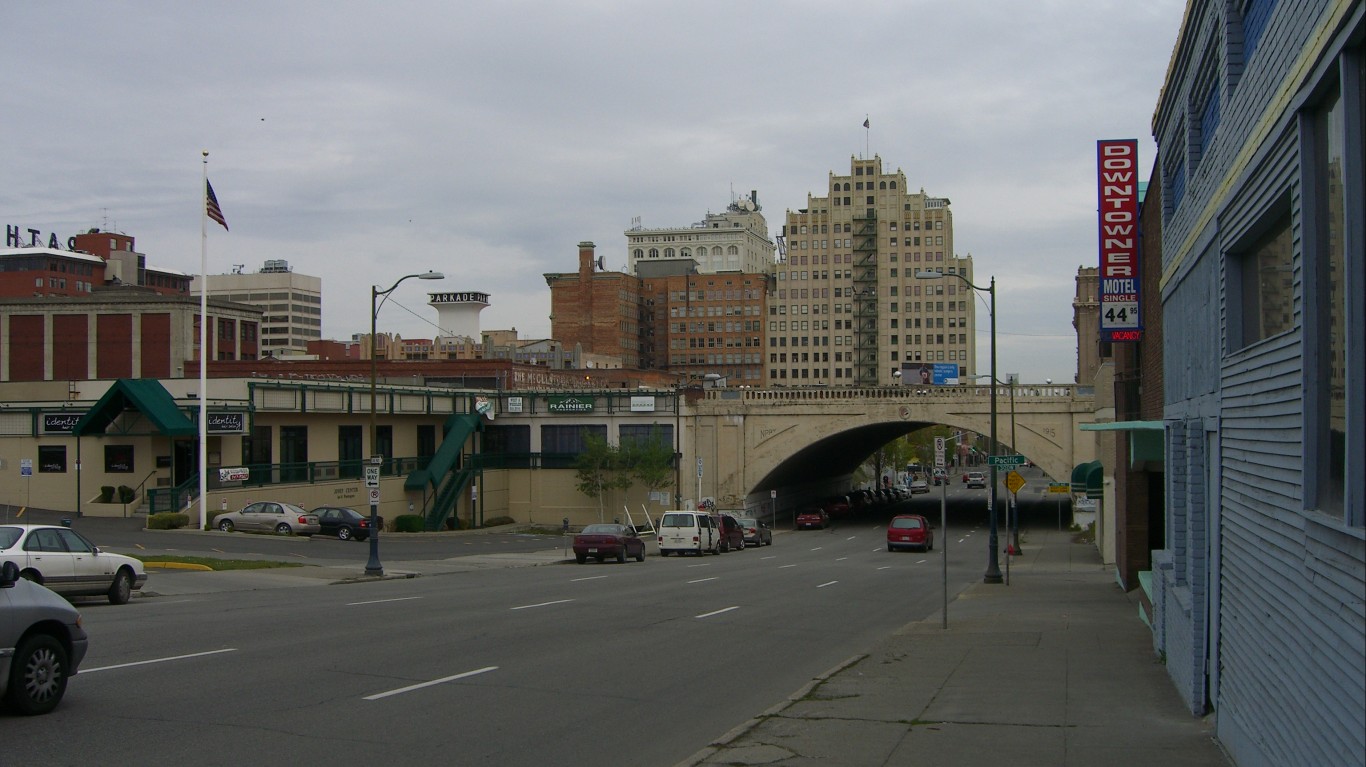
37. Spokane-Spokane Valley, WA
> 2018 traffic fatalities per 100,000 people: 8.2 (state: 7.2)
> Avg. commute time: 22.1 min.
> 2017 hours lost due to congestion per car: 45.0
> Most dangerous road: US-2
[in-text-ad-2]
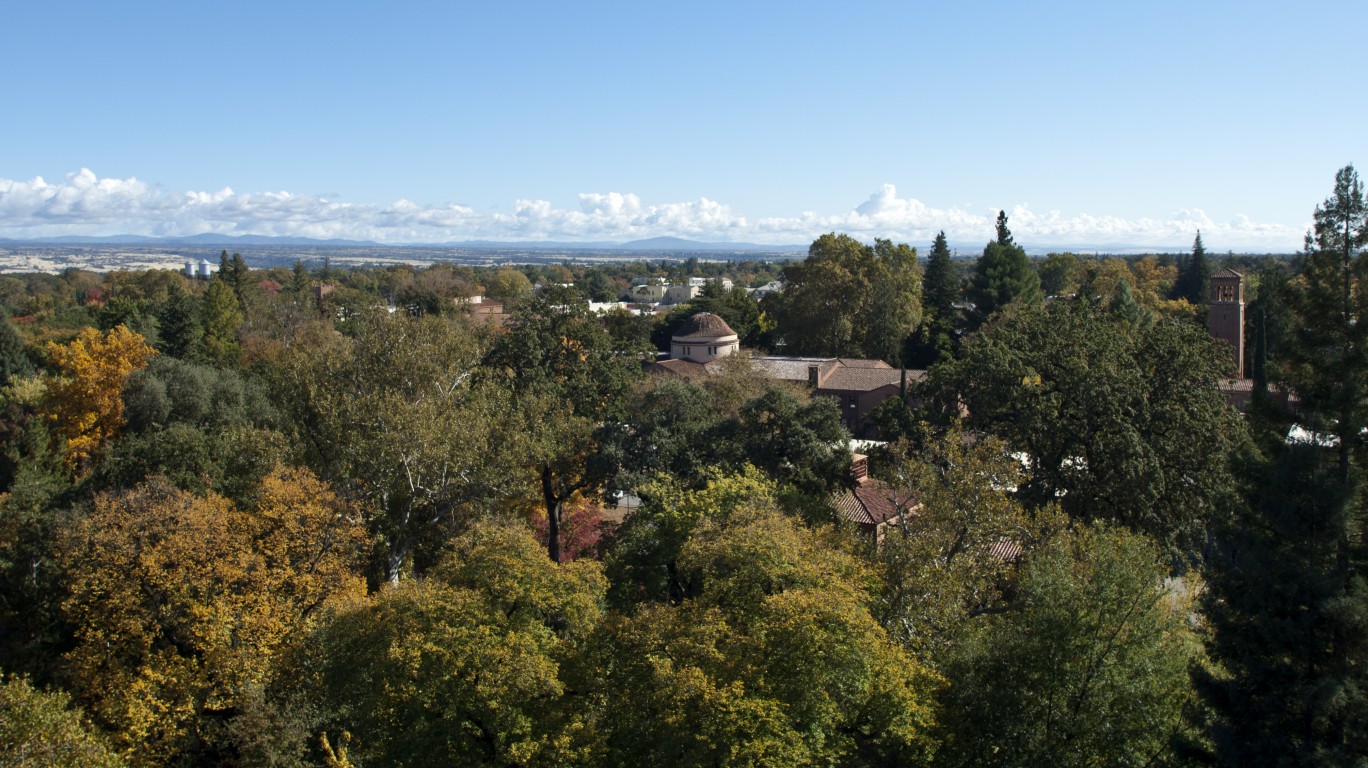
36. Chico, CA
> 2018 traffic fatalities per 100,000 people: 15.5 (state: 9.0)
> Avg. commute time: 22.8 min.
> 2017 hours lost due to congestion per car: 18.0
> Most dangerous road: SR-99
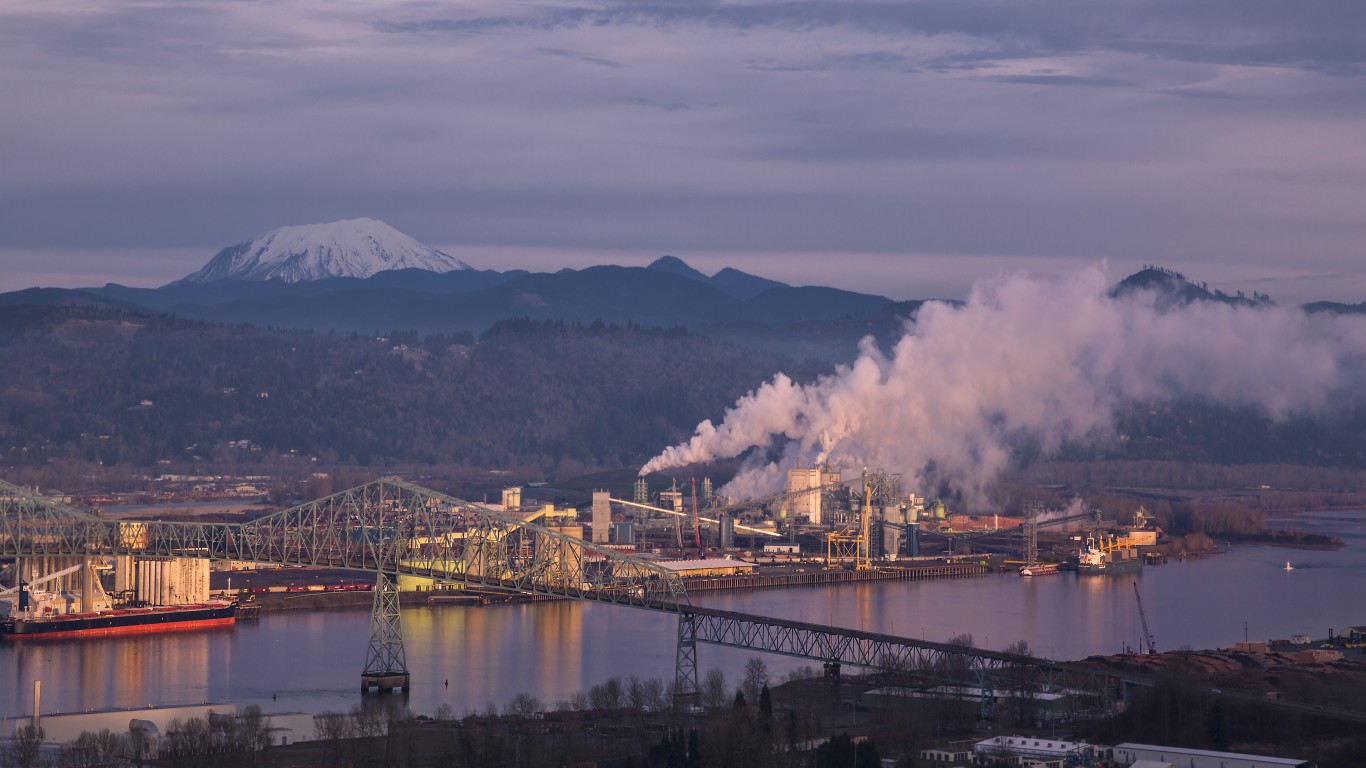
35. Longview, WA
> 2018 traffic fatalities per 100,000 people: 10.6 (state: 7.2)
> Avg. commute time: 27.5 min.
> 2017 hours lost due to congestion per car: N/A
> Most dangerous road: I-5
[in-text-ad]
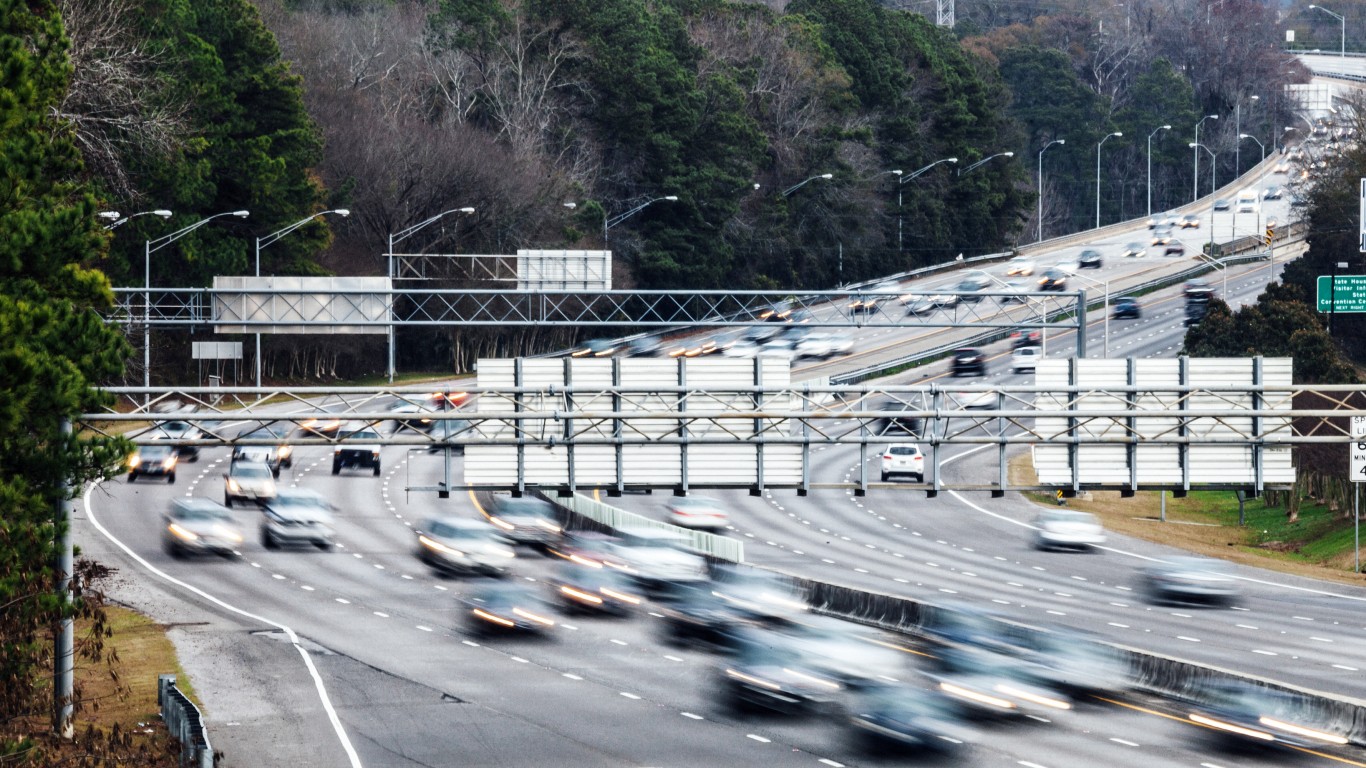
34. Columbia, SC
> 2018 traffic fatalities per 100,000 people: 19.5 (state: 20.4)
> Avg. commute time: 25.1 min.
> 2017 hours lost due to congestion per car: 44.0
> Most dangerous road: I-20
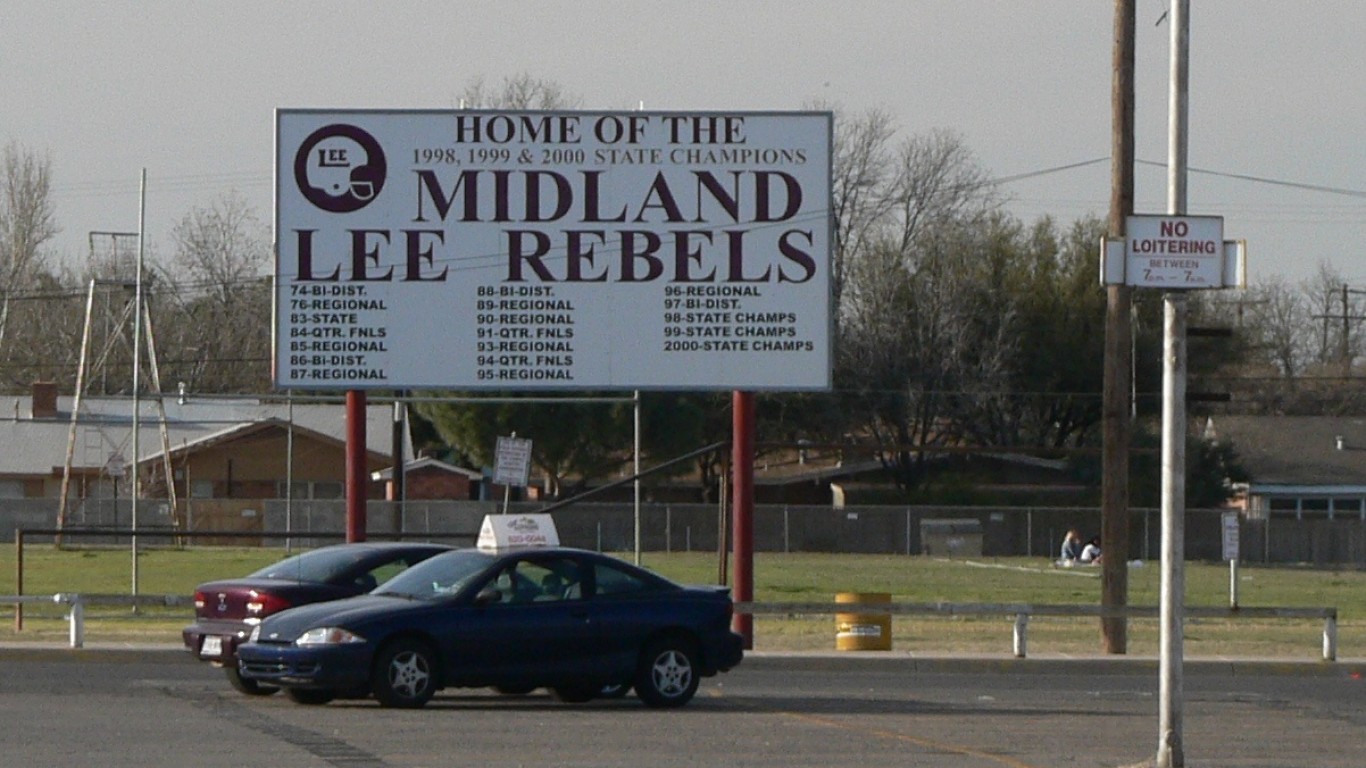
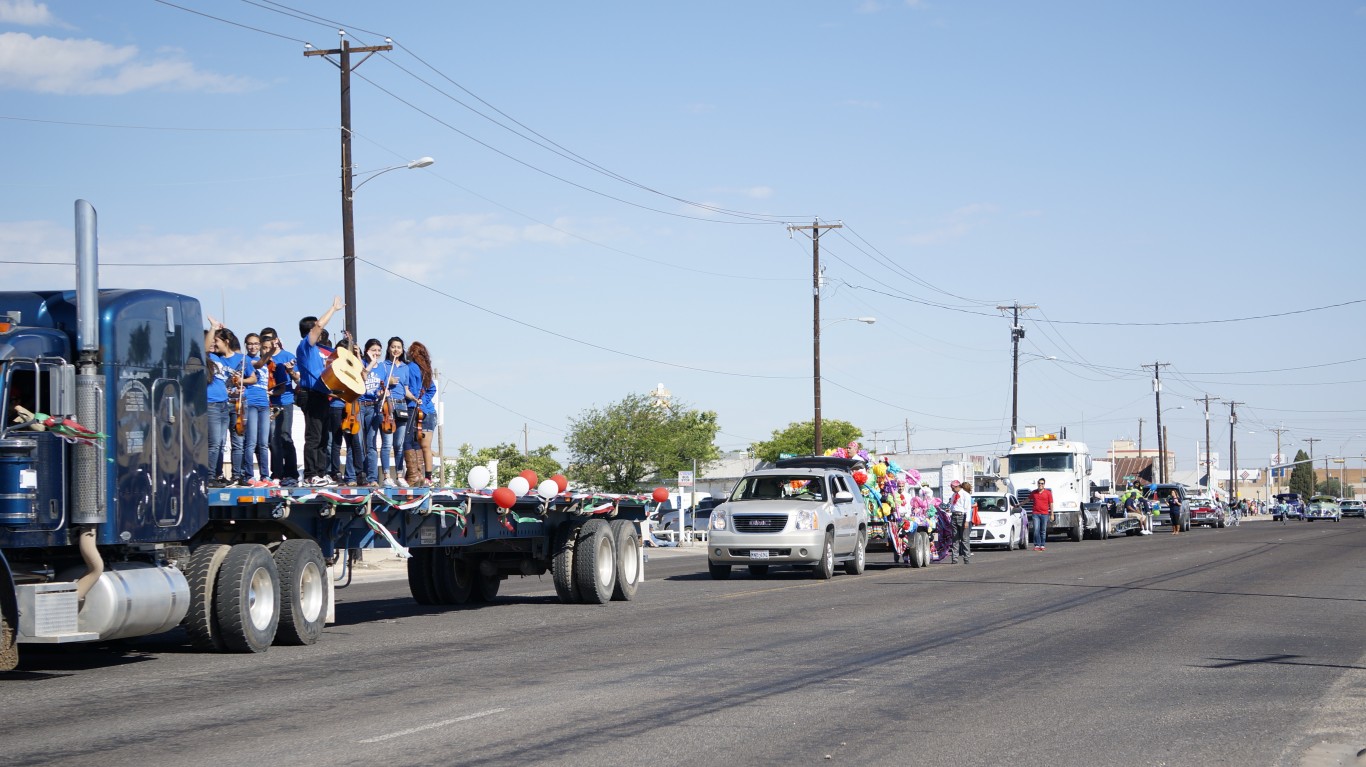
33. Midland, TX
> 2018 traffic fatalities per 100,000 people: 35.7 (state: 12.7)
> Avg. commute time: 20.4 min.
> 2017 hours lost due to congestion per car: 22.0
> Most dangerous road: SR-191
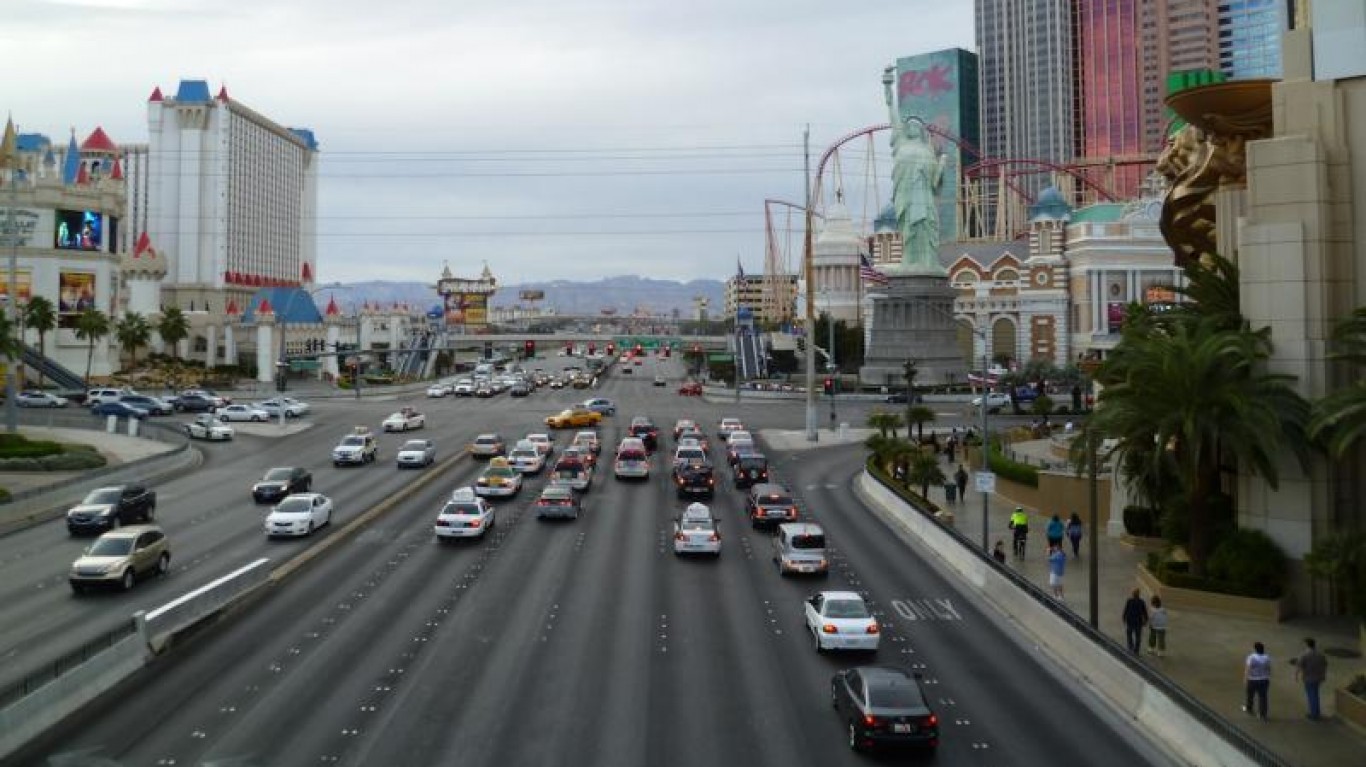
32. Las Vegas-Henderson-Paradise, NV
> 2018 traffic fatalities per 100,000 people: 10.4 (state: 10.9)
> Avg. commute time: 25.4 min.
> 2017 hours lost due to congestion per car: N/A
> Most dangerous road: US-95
[in-text-ad-2]
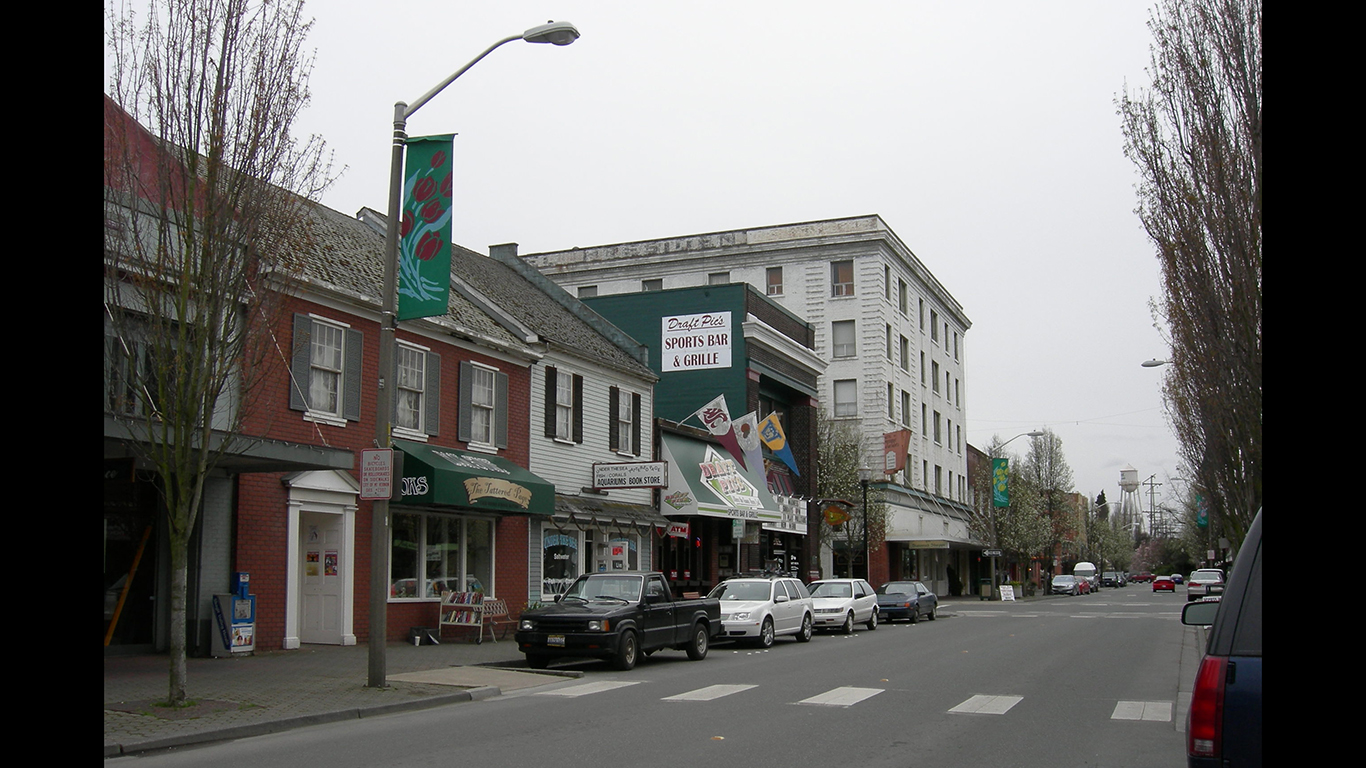
31. Mount Vernon-Anacortes, WA
> 2018 traffic fatalities per 100,000 people: 16.4 (state: 7.2)
> Avg. commute time: 28.5 min.
> 2017 hours lost due to congestion per car: 25.0
> Most dangerous road: SR-20

30. Florence, SC
> 2018 traffic fatalities per 100,000 people: 30.6 (state: 20.4)
> Avg. commute time: 22.1 min.
> 2017 hours lost due to congestion per car: 27.0
> Most dangerous road: US-52
[in-text-ad]
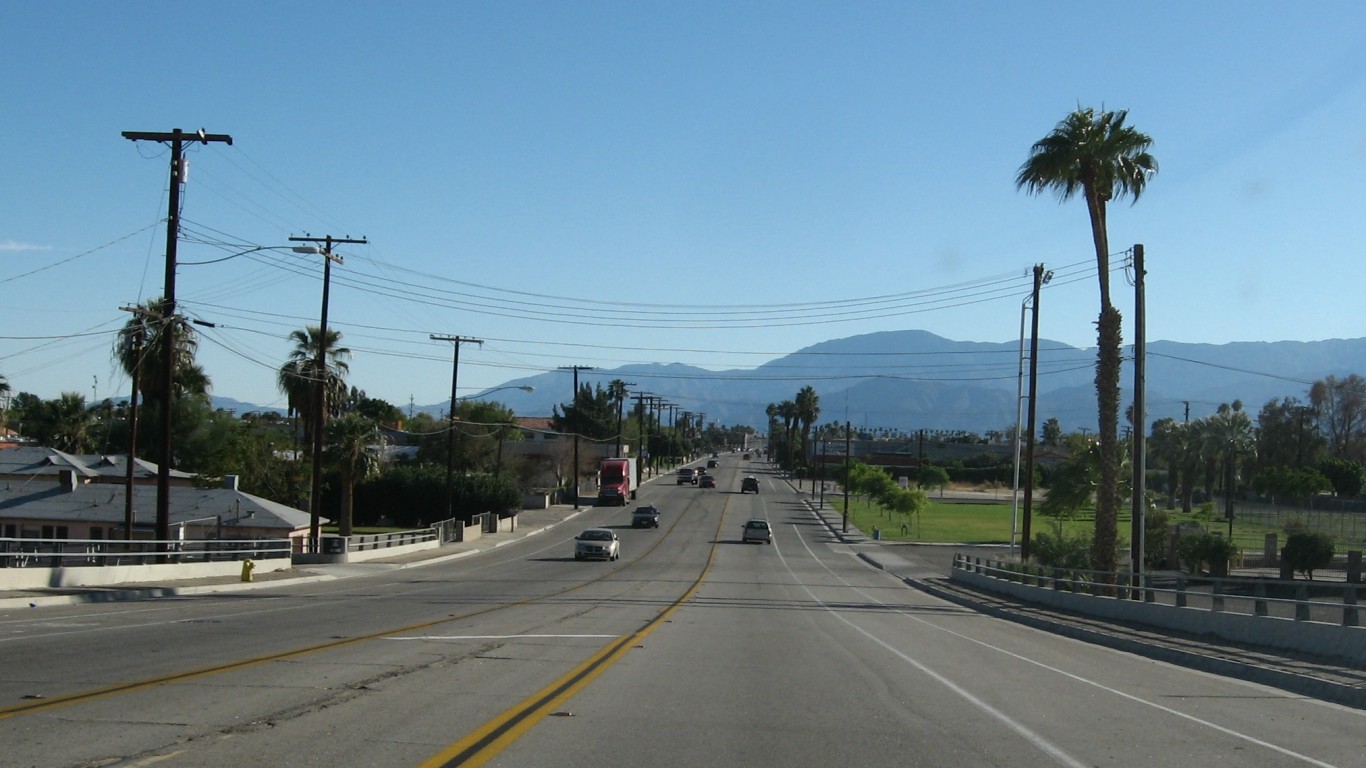
29. Riverside-San Bernardino-Ontario, CA
> 2018 traffic fatalities per 100,000 people: 13.2 (state: 9.0)
> Avg. commute time: 32.7 min.
> 2017 hours lost due to congestion per car: 10.0
> Most dangerous road: I-10
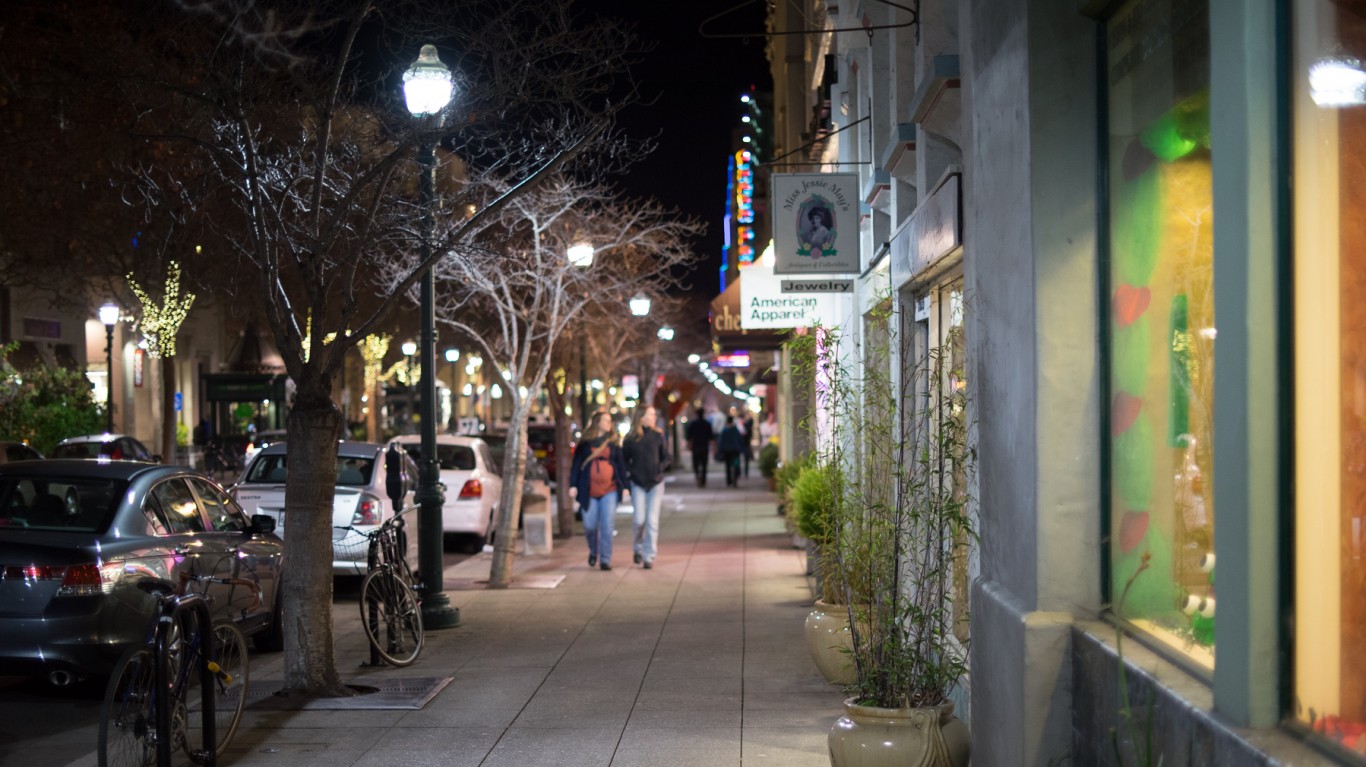
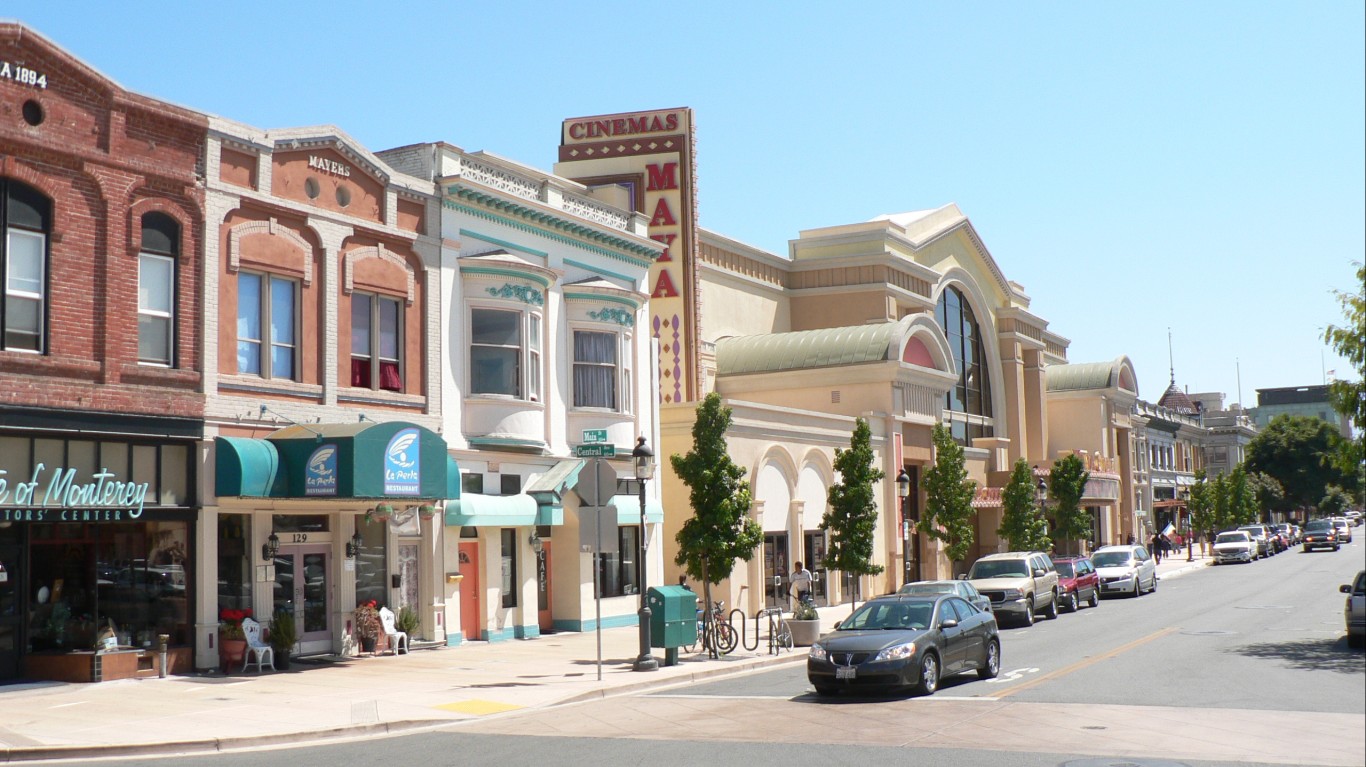
28. Santa Cruz-Watsonville, CA
> 2018 traffic fatalities per 100,000 people: 7.3 (state: 9.0)
> Avg. commute time: 27.4 min.
> 2017 hours lost due to congestion per car: 35.6
> Most dangerous road: SR-1
27. Salinas, CA
> 2018 traffic fatalities per 100,000 people: 10.6 (state: 9.0)
> Avg. commute time: 23.9 min.
> 2017 hours lost due to congestion per car: 27.0
> Most dangerous road: US-101
[in-text-ad-2]
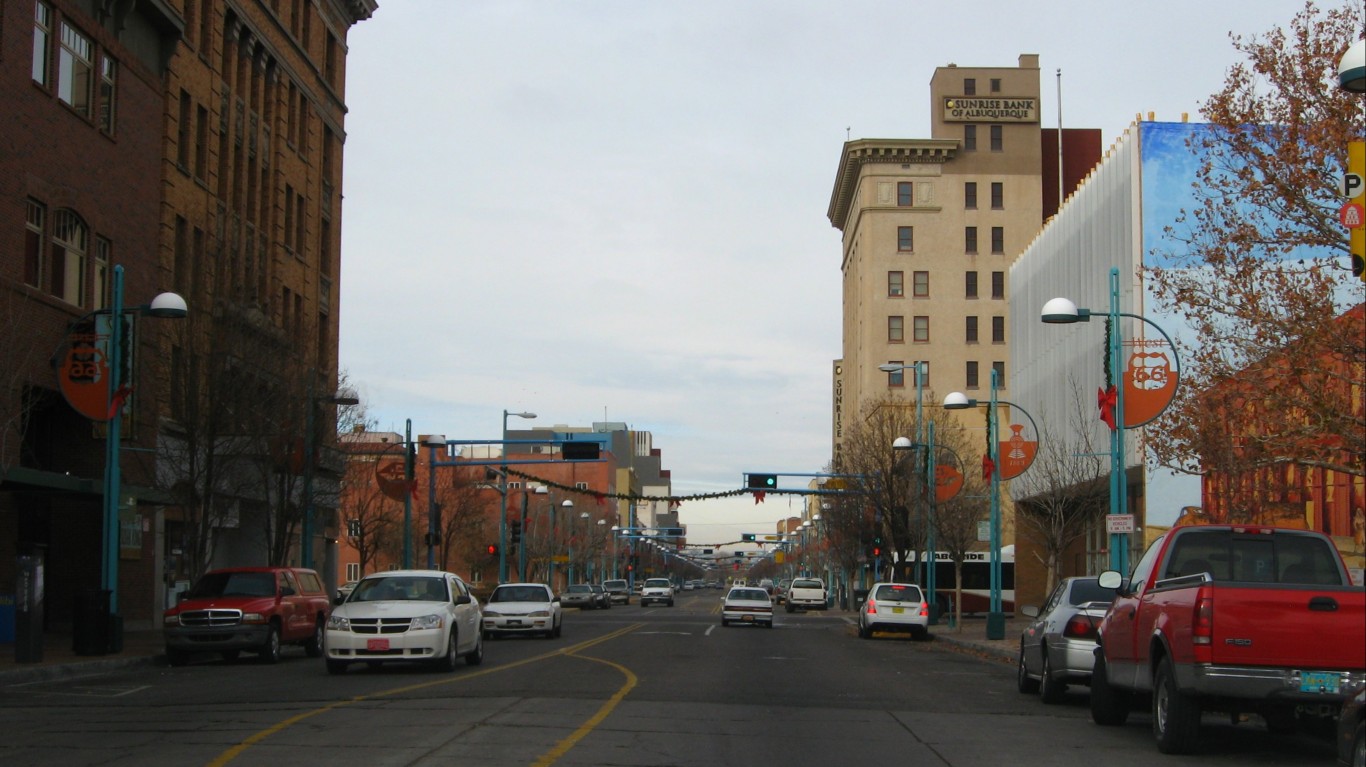
26. Albuquerque, NM
> 2018 traffic fatalities per 100,000 people: 15.1 (state: 18.7)
> Avg. commute time: 24.2 min.
> 2017 hours lost due to congestion per car: 41.1
> Most dangerous road: I-25
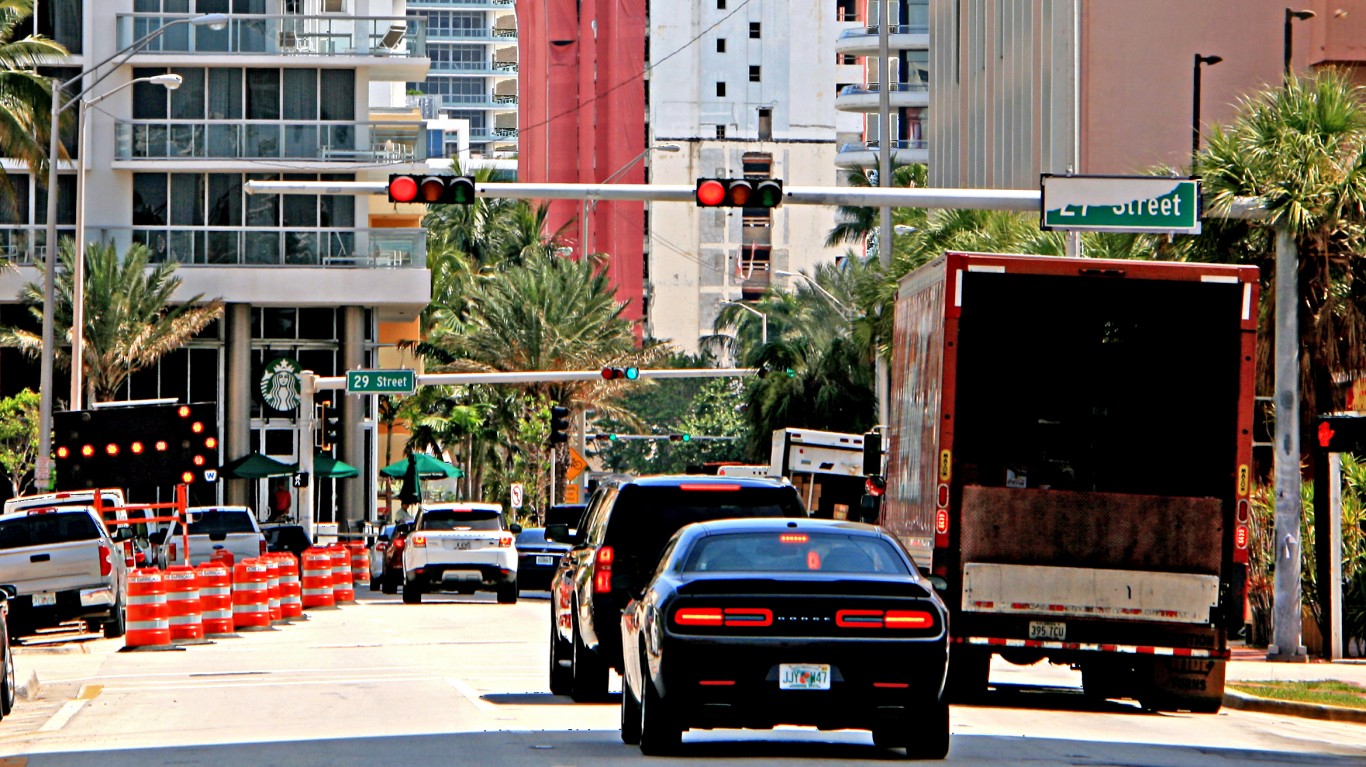
25. Miami-Fort Lauderdale-West Palm Beach, FL
> 2018 traffic fatalities per 100,000 people: 11.8 (state: 14.7)
> Avg. commute time: 30.5 min.
> 2017 hours lost due to congestion per car: 69.0
> Most dangerous road: I-95
[in-text-ad]
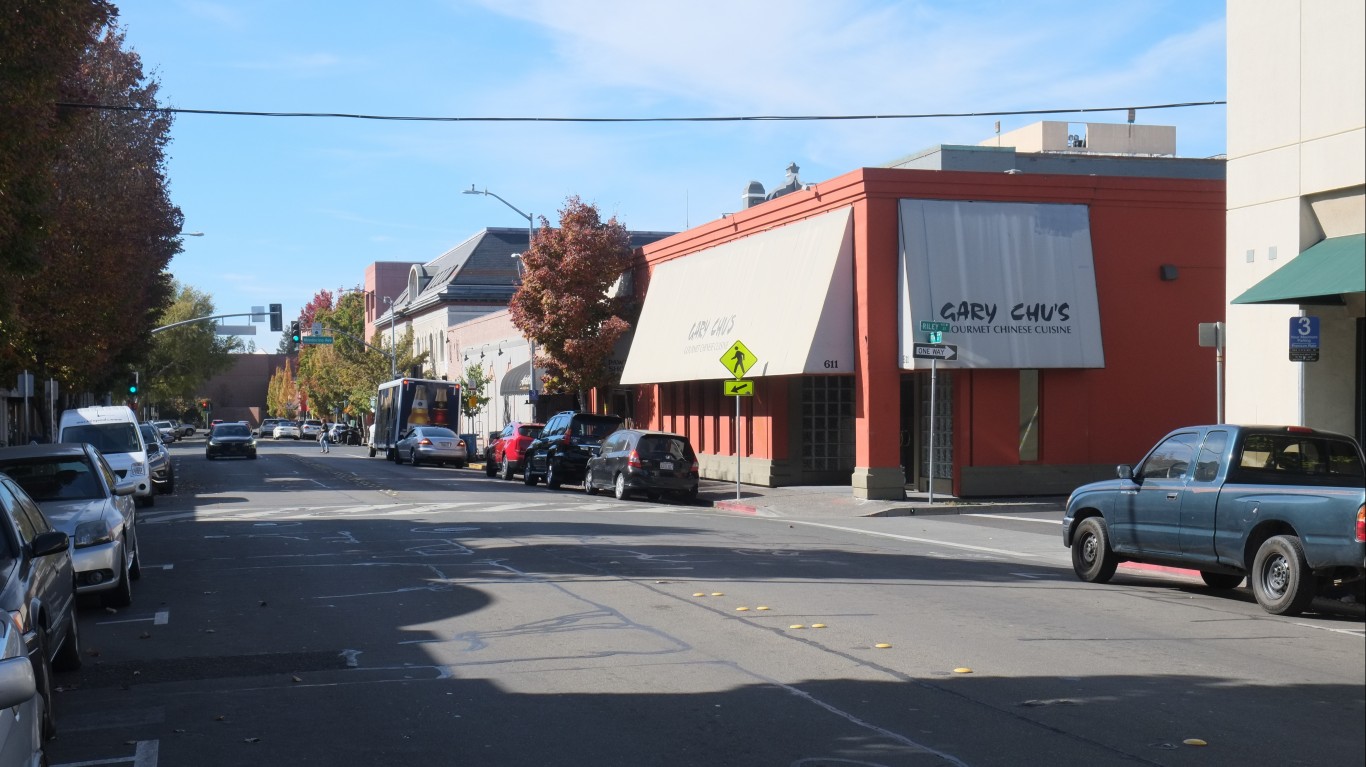
24. Santa Rosa, CA
> 2018 traffic fatalities per 100,000 people: 7.8 (state: 9.0)
> Avg. commute time: 25.4 min.
> 2017 hours lost due to congestion per car: 50.4
> Most dangerous road: US-101
23. Madera, CA
> 2018 traffic fatalities per 100,000 people: 23.3 (state: 9.0)
> Avg. commute time: 31.8 min.
> 2017 hours lost due to congestion per car: 14.0
> Most dangerous road: AVENUE 9

22. Houston-The Woodlands-Sugar Land, TX
> 2018 traffic fatalities per 100,000 people: 9.0 (state: 12.7)
> Avg. commute time: 30.0 min.
> 2017 hours lost due to congestion per car: 73.3
> Most dangerous road: I-45
[in-text-ad-2]

21. Fresno, CA
> 2018 traffic fatalities per 100,000 people: 11.6 (state: 9.0)
> Avg. commute time: 23.1 min.
> 2017 hours lost due to congestion per car: 40.0
> Most dangerous road: I-5
20. Baton Rouge, LA
> 2018 traffic fatalities per 100,000 people: 20.8 (state: 16.5)
> Avg. commute time: 27.2 min.
> 2017 hours lost due to congestion per car: 58.0
> Most dangerous road: US-61
[in-text-ad]
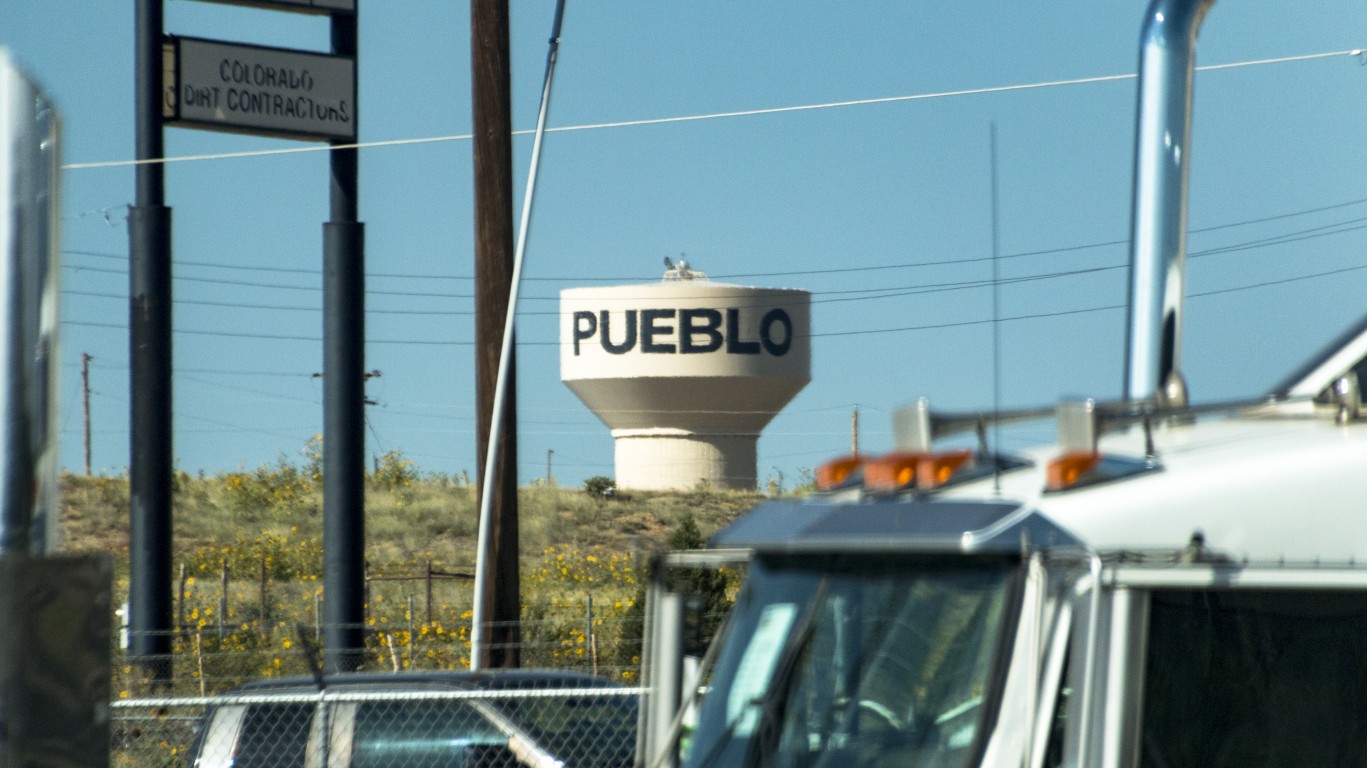
19. Pueblo, CO
> 2018 traffic fatalities per 100,000 people: 22.0 (state: 11.1)
> Avg. commute time: 22.6 min.
> 2017 hours lost due to congestion per car: 20.0
> Most dangerous road: I-25
18. Los Angeles-Long Beach-Anaheim, CA
> 2018 traffic fatalities per 100,000 people: 6.4 (state: 9.0)
> Avg. commute time: 31.3 min.
> 2017 hours lost due to congestion per car: N/A
> Most dangerous road: I-5
17. Napa, CA
> 2018 traffic fatalities per 100,000 people: 9.9 (state: 9.0)
> Avg. commute time: 27.8 min.
> 2017 hours lost due to congestion per car: 46.0
> Most dangerous road: SR-29
[in-text-ad-2]
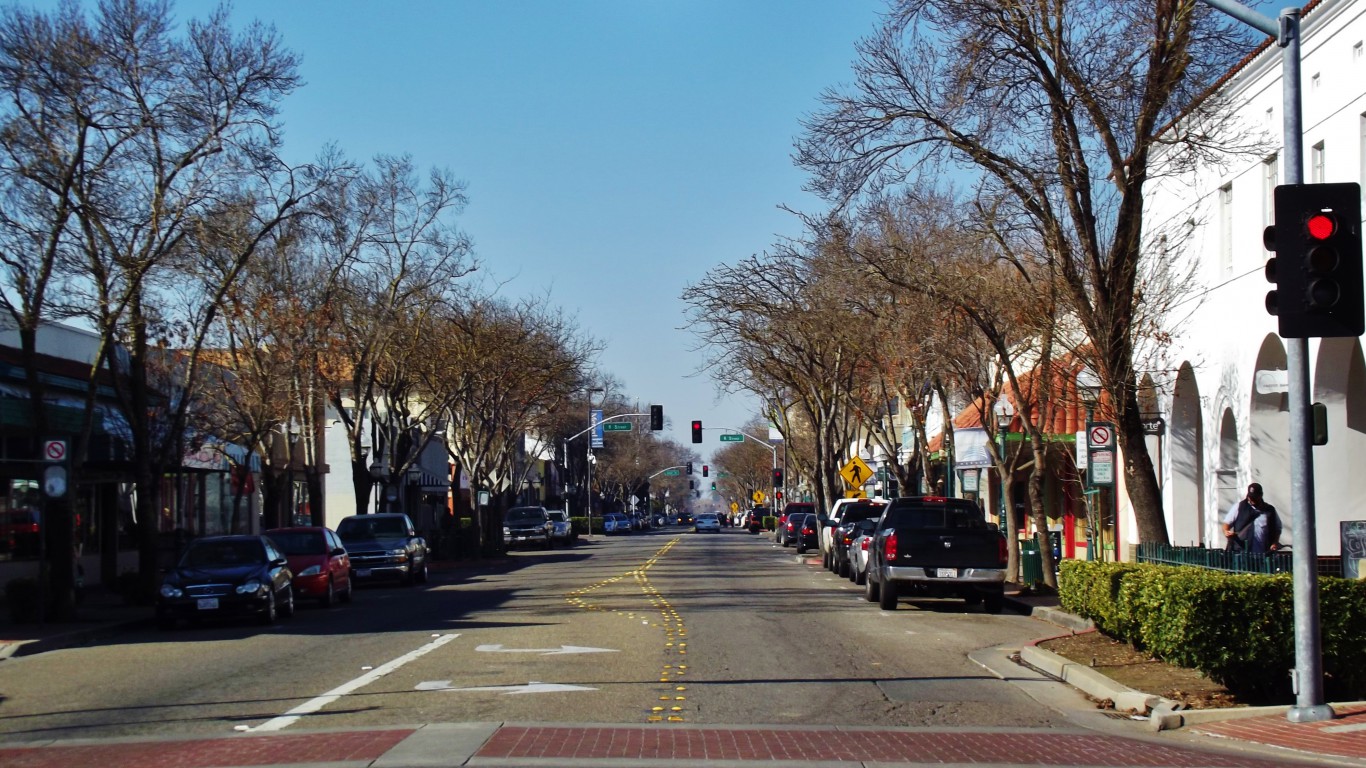
16. Merced, CA
> 2018 traffic fatalities per 100,000 people: 20.6 (state: 9.0)
> Avg. commute time: 29.1 min.
> 2017 hours lost due to congestion per car: 14.0
> Most dangerous road: I-5

15. Redding, CA
> 2018 traffic fatalities per 100,000 people: 16.8 (state: 9.0)
> Avg. commute time: 22.3 min.
> 2017 hours lost due to congestion per car: 23.0
> Most dangerous road: SR-299
[in-text-ad]
14. Odessa, TX
> 2018 traffic fatalities per 100,000 people: 36.0 (state: 12.7)
> Avg. commute time: 26.1 min.
> 2017 hours lost due to congestion per car: 31.0
> Most dangerous road: I-20
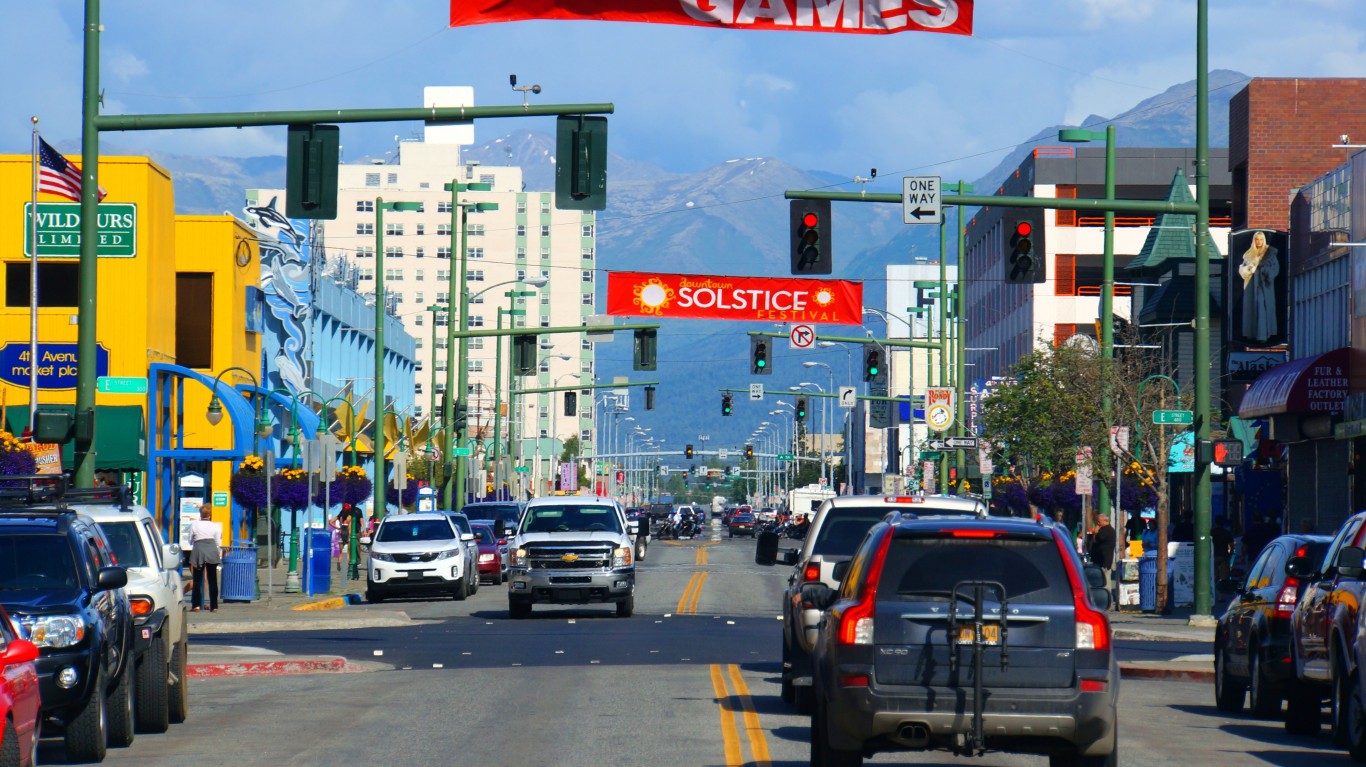
13. Anchorage, AK
> 2018 traffic fatalities per 100,000 people: 12.0 (state: 10.8)
> Avg. commute time: 23.0 min.
> 2017 hours lost due to congestion per car: 42.0
> Most dangerous road: SR-3 PARKS HWY
12. Bakersfield, CA
> 2018 traffic fatalities per 100,000 people: 16.4 (state: 9.0)
> Avg. commute time: 23.5 min.
> 2017 hours lost due to congestion per car: 23.6
> Most dangerous road: I-5
[in-text-ad-2]
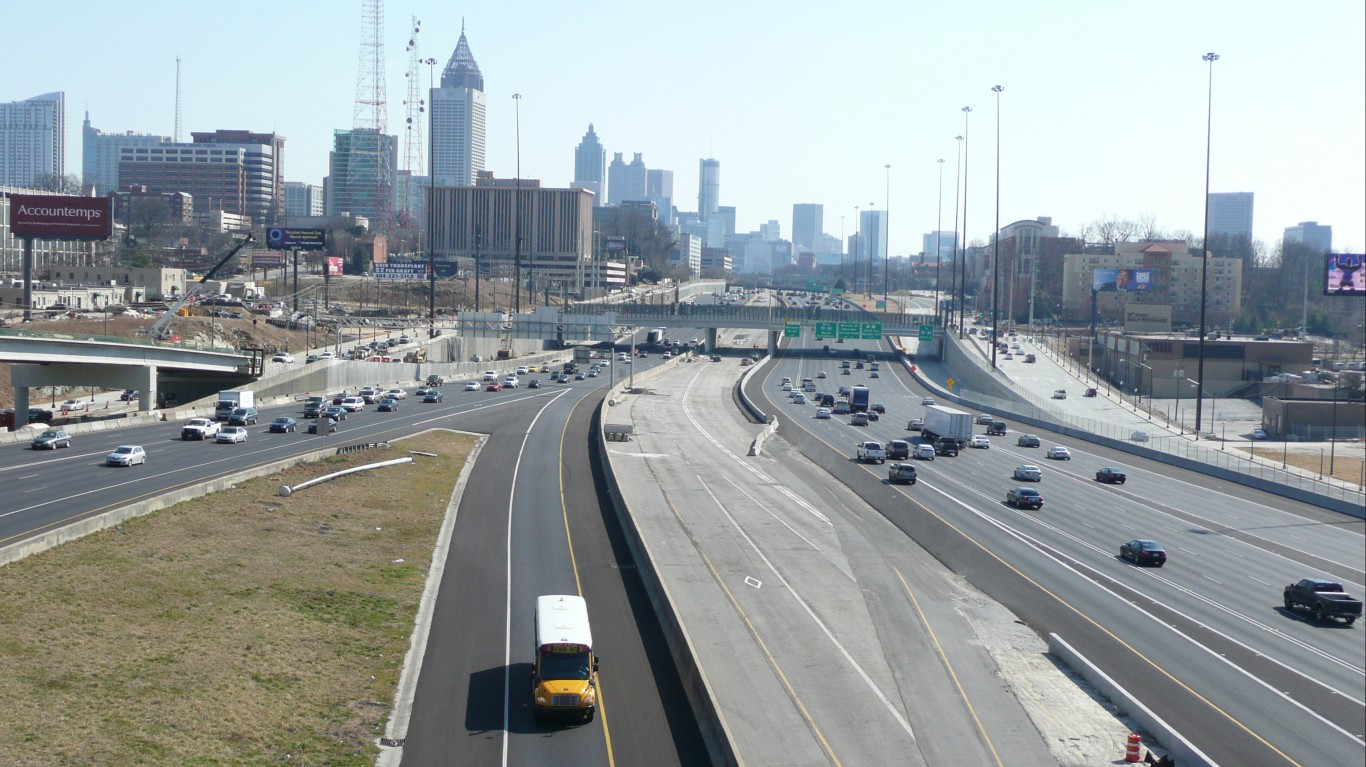
11. Atlanta-Sandy Springs-Roswell, GA
> 2018 traffic fatalities per 100,000 people: 12.4 (state: 14.3)
> Avg. commute time: 32.5 min.
> 2017 hours lost due to congestion per car: 76.3
> Most dangerous road: I-75
10. San Francisco-Oakland-Hayward, CA
> 2018 traffic fatalities per 100,000 people: 4.6 (state: 9.0)
> Avg. commute time: 34.7 min.
> 2017 hours lost due to congestion per car: 44.8
> Most dangerous road: US-101
[in-text-ad]
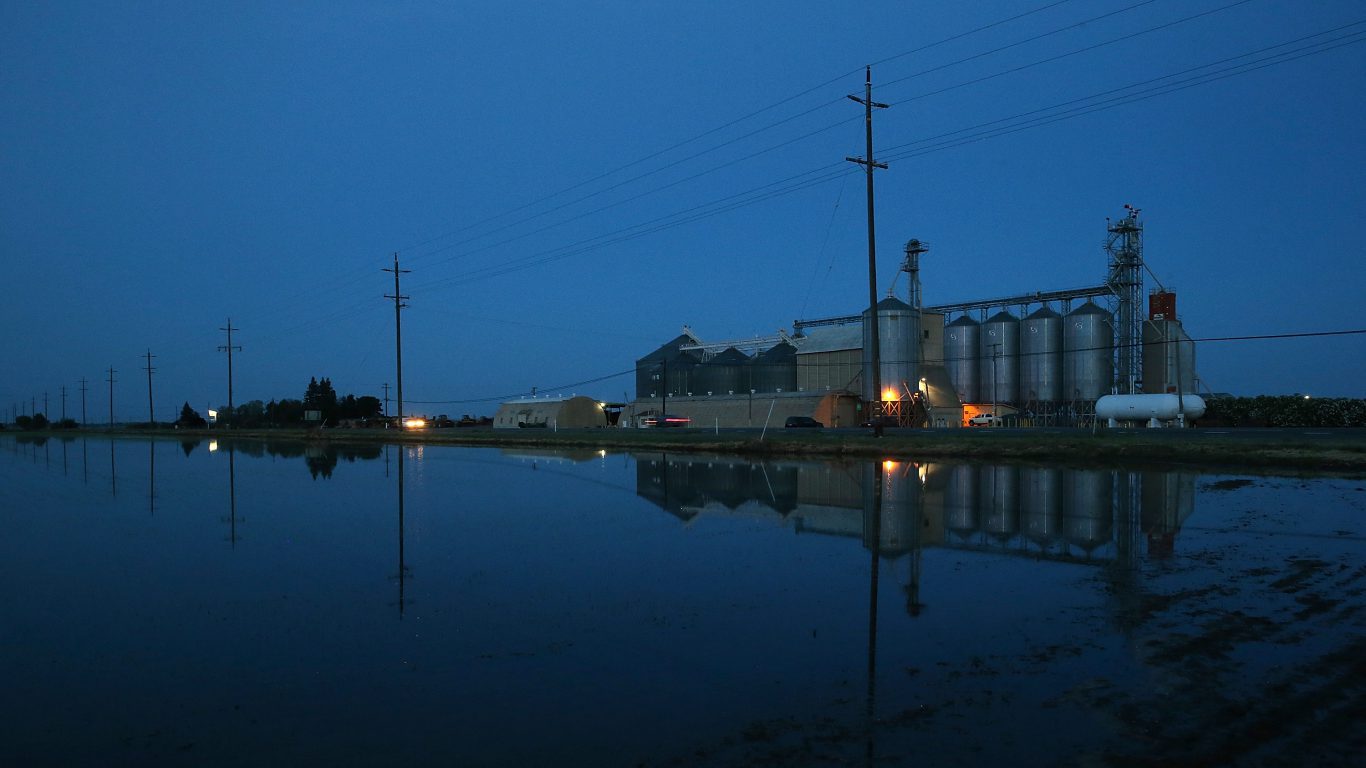
9. Yuba City, CA
> 2018 traffic fatalities per 100,000 people: 27.0 (state: 9.0)
> Avg. commute time: 29.2 min.
> 2017 hours lost due to congestion per car: 20.0
> Most dangerous road: SR-99
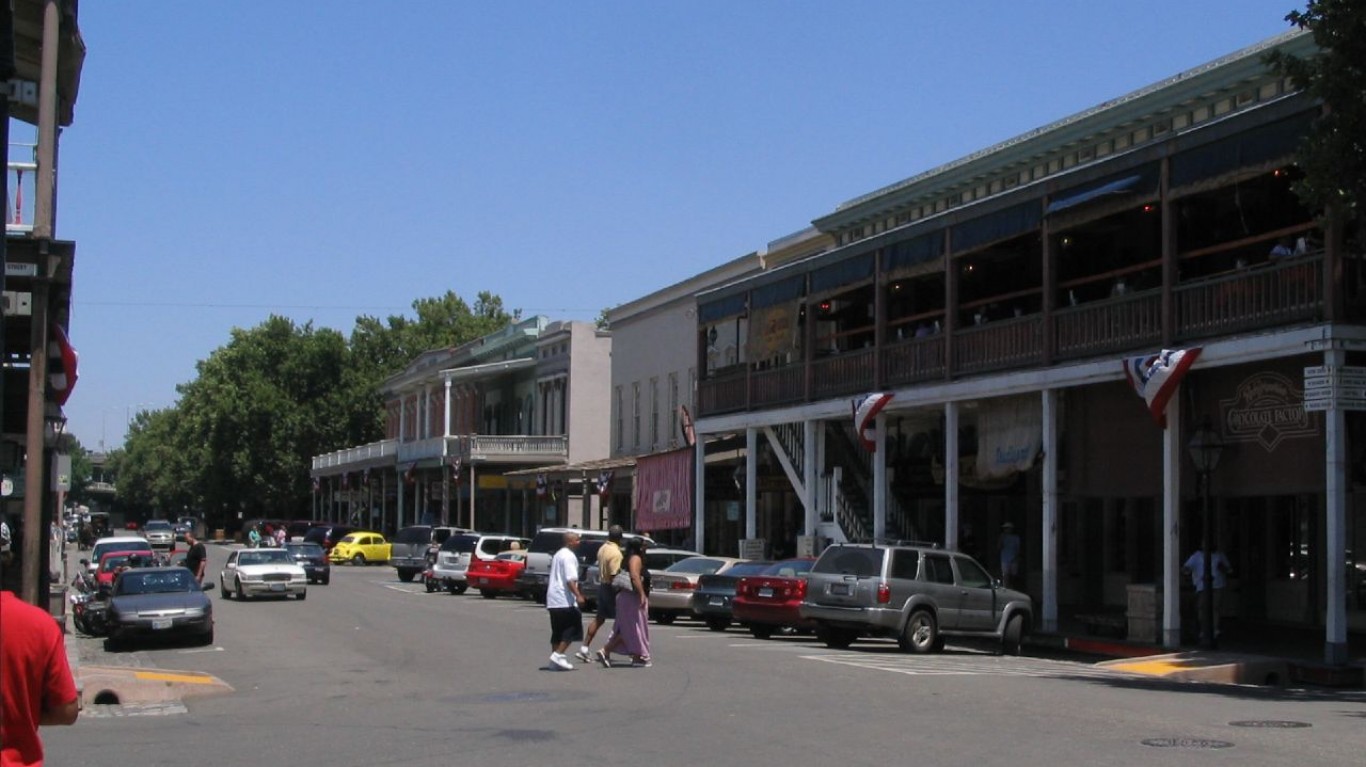
8. Sacramento–Roseville–Arden-Arcade, CA
> 2018 traffic fatalities per 100,000 people: 9.8 (state: 9.0)
> Avg. commute time: 28.0 min.
> 2017 hours lost due to congestion per car: 56.9
> Most dangerous road: I-5
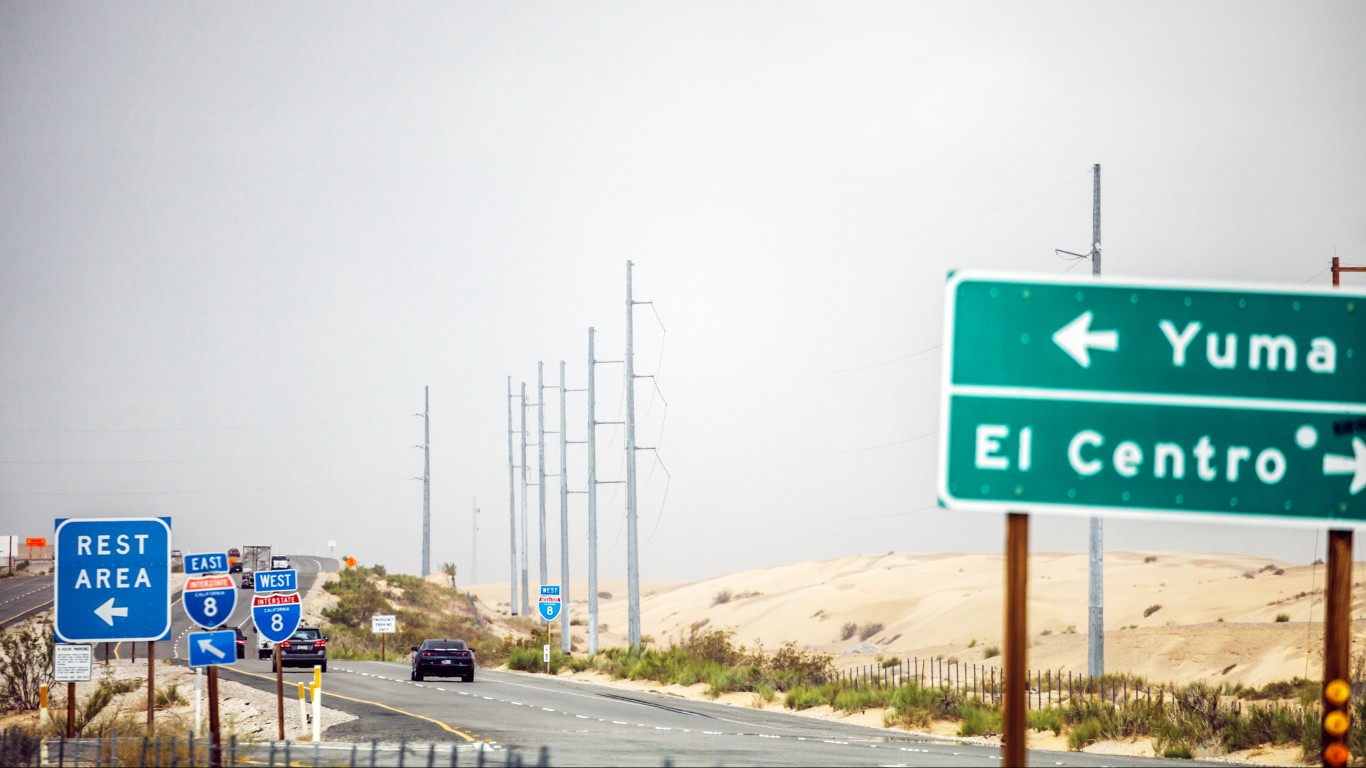
7. El Centro, CA
> 2018 traffic fatalities per 100,000 people: 20.6 (state: 9.0)
> Avg. commute time: 24.5 min.
> 2017 hours lost due to congestion per car: N/A
> Most dangerous road: I-8
[in-text-ad-2]
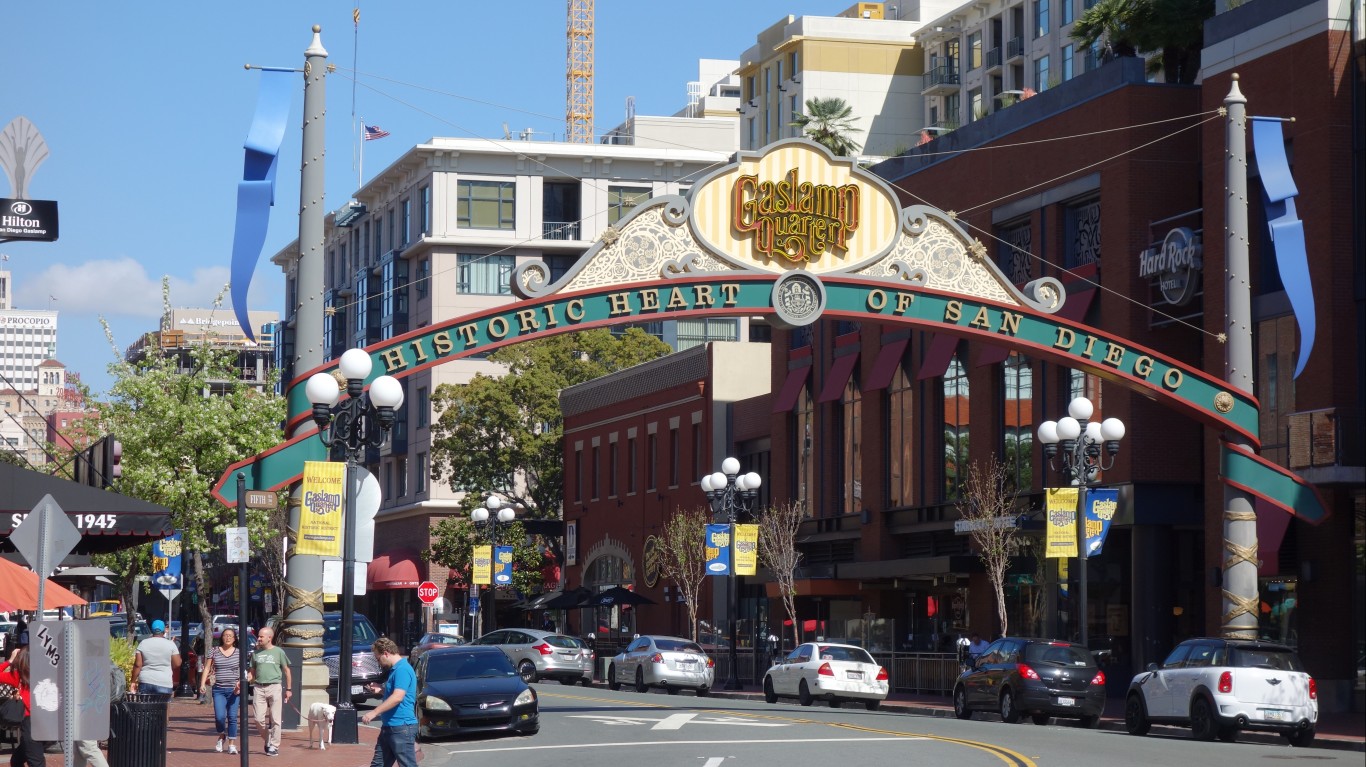
6. San Diego-Carlsbad, CA
> 2018 traffic fatalities per 100,000 people: 7.8 (state: 9.0)
> Avg. commute time: 26.6 min.
> 2017 hours lost due to congestion per car: 64.0
> Most dangerous road: I-8
5. Modesto, CA
> 2018 traffic fatalities per 100,000 people: 15.5 (state: 9.0)
> Avg. commute time: 31.1 min.
> 2017 hours lost due to congestion per car: 29.8
> Most dangerous road: SR-99
[in-text-ad]
4. Seattle-Tacoma-Bellevue, WA
> 2018 traffic fatalities per 100,000 people: 5.9 (state: 7.2)
> Avg. commute time: 31.6 min.
> 2017 hours lost due to congestion per car: 75.5
> Most dangerous road: I-5
3. Vallejo-Fairfield, CA
> 2018 traffic fatalities per 100,000 people: 12.9 (state: 9.0)
> Avg. commute time: 35.1 min.
> 2017 hours lost due to congestion per car: 37.6
> Most dangerous road: I-80

2. Stockton-Lodi, CA
> 2018 traffic fatalities per 100,000 people: 14.8 (state: 9.0)
> Avg. commute time: 37.2 min.
> 2017 hours lost due to congestion per car: 33.7
> Most dangerous road: I-5
[in-text-ad-2]

1. San Jose-Sunnyvale-Santa Clara, CA
> 2018 traffic fatalities per 100,000 people: 6.2 (state: 9.0)
> Avg. commute time: 29.8 min.
> 2017 hours lost due to congestion per car: 81.0
> Most dangerous road: US-101
Methodology
To determine the worst cities to drive in, 24/7 Wall St. created an index assessing the safety, cost, and convenience of driving in America’s metropolitan statistical areas. Data on the number of traffic fatalities in 2018 from the Fatality Analysis Reporting System were adjusted for population using data from the U.S. Census Bureau’s 2018 American Community Survey and included in the index. Data on the number of traffic fatalities involving drunk drivers, also from FARS, were adjusted for population using 2018 ACS data and included in the index. Data on the mean travel time to work for the population 16 years and over came from the 2018 ACS and was included in the index.
Data on the number of car thefts per 100,000 people came from the National Insurance Crime Bureau’s 2018 “Hot Spots” report and was included in the index.
Data on the average cost of fuel per auto commuter accrued while sitting in traffic in 2017, as well as the average number of hours of delay spent in traffic per auto commuter in 2017, came from the Texas A&M Transportation Institute’s 2019 Urban Mobility Report and were aggregated from the urban area level to the metropolitan statistical area level using geographic definitions from the Census Bureau and were included in the index.
Finally, data on the average retail price of a regular gallon of gas as of November 18, 2019 in the state in which a metropolitan area’s principal city is located came from AAA Gas Prices and was included in the index. All data are for the most recent period available.
100 Million Americans Are Missing This Crucial Retirement Tool
The thought of burdening your family with a financial disaster is most Americans’ nightmare. However, recent studies show that over 100 million Americans still don’t have proper life insurance in the event they pass away.
Life insurance can bring peace of mind – ensuring your loved ones are safeguarded against unforeseen expenses and debts. With premiums often lower than expected and a variety of plans tailored to different life stages and health conditions, securing a policy is more accessible than ever.
A quick, no-obligation quote can provide valuable insight into what’s available and what might best suit your family’s needs. Life insurance is a simple step you can take today to help secure peace of mind for your loved ones tomorrow.
Click here to learn how to get a quote in just a few minutes.
Thank you for reading! Have some feedback for us?
Contact the 24/7 Wall St. editorial team.

 24/7 Wall St.
 24/7 Wall St.
 24/7 Wall St.
 24/7 Wall St.