Special Report
Income It Takes to Be Considered Middle Class in Every State
Published:
Last Updated:

The strength of the American middle class is a common point of discussion among politicians of all parties. For many, this group is important for cultural reasons, representing “everyday America.” For others, it represents the consumer class that drives the American economy.
But who actually makes up the middle class in the United States? For such a commonly-discussed group, there is surprisingly little consensus on how to define the group. One Pew Research Center study defines it as households earning between two-thirds and twice the median household income. Other varying definitions include a range of household incomes as low as $13,000 and as high as $230,000.
To determine the income it takes for a family to be considered middle class in every state, 24/7 Wall St. reviewed data on the upper and lower bounds of U.S. household income quintiles from the U.S. Census Bureau’s 2018 American Community Survey. The boundaries of the three middle income quintiles for the U.S. as a whole were adjusted for state-level cost of living using regional price parity data for 2017 from the Bureau of Economic Analysis. The RPP-adjusted boundaries were defined as the range of income that could be considered middle class in a given state.
From state to state, the cost of living varies significantly. Adjusting for the cost of living, the bottom threshold of the middle class in one state is as low as $21,797 and as high as $148,507 in another.
Because this income distribution is so wide, it is likely that many households, even after adjusting for cost of living, can technically fall into the middle class in their state but are unable to meet the basic comfortable standard of living many associate with a middle class lifestyle. This is the income a family actually needs to avoid poverty in every state.
And for the richest one-fifth of Americans, earnings vary widely as well. Within this quintile, the richest 5% in many states make at least $100,000 more than other people in the top 20%. This is the income it takes to be considered rich in every state.
Click here to see the income it takes to be considered middle class in every state
Click here to read our methodology

Alabama
> Household income range for middle class: $22,051 – $108,654
> Median family income: $63,837 (7th lowest)
> Middle class share of Alabama income: 45.7% (14th smallest)
> Richest 20% share of Alabama income: 51.4% (14th largest)
> Cost of living in Alabama: 13.3% less expensive than than U.S. avg.
[in-text-ad]

Alaska
> Household income range for middle class: $26,553 – $130,836
> Median family income: $89,847 (7th highest)
> Middle class share of Alaska income: 49.2% (the largest)
> Richest 20% share of Alaska income: 47.1% (2nd smallest)
> Cost of living in Alaska: 4.4% more expensive than than U.S. avg.

Arizona
> Household income range for middle class: $24,518 – $120,810
> Median family income: $69,981 (16th lowest)
> Middle class share of Arizona income: 46.6% (24th largest)
> Richest 20% share of Arizona income: 49.9% (23rd smallest)
> Cost of living in Arizona: 3.6% less expensive than than U.S. avg.
Arkansas
> Household income range for middle class: $22,000 – $108,404
> Median family income: $58,080 (3rd lowest)
> Middle class share of Arkansas income: 44.8% (5th smallest)
> Richest 20% share of Arkansas income: 52.0% (6th largest)
> Cost of living in Arkansas: 13.5% less expensive than than U.S. avg.
[in-text-ad-2]

California
> Household income range for middle class: $29,198 – $143,870
> Median family income: $86,165 (13th highest)
> Middle class share of California income: 44.8% (4th smallest)
> Richest 20% share of California income: 52.3% (4th largest)
> Cost of living in California: 14.8% more expensive than than U.S. avg.

Colorado
> Household income range for middle class: $26,248 – $129,332
> Median family income: $88,955 (9th highest)
> Middle class share of Colorado income: 47.2% (20th largest)
> Richest 20% share of Colorado income: 49.3% (18th smallest)
> Cost of living in Colorado: 3.2% more expensive than than U.S. avg.
[in-text-ad]

Connecticut
> Household income range for middle class: $27,469 – $135,348
> Median family income: $98,100 (4th highest)
> Middle class share of Connecticut income: 43.9% (2nd smallest)
> Richest 20% share of Connecticut income: 53.3% (2nd largest)
> Cost of living in Connecticut: 8.0% more expensive than than U.S. avg.

Delaware
> Household income range for middle class: $25,459 – $125,447
> Median family income: $79,386 (19th highest)
> Middle class share of Delaware income: 47.3% (17th largest)
> Richest 20% share of Delaware income: 49.3% (19th smallest)
> Cost of living in Delaware: 0.1% more expensive than than U.S. avg.

Florida
> Household income range for middle class: $25,409 – $125,197
> Median family income: $66,995 (12th lowest)
> Middle class share of Florida income: 44.3% (3rd smallest)
> Richest 20% share of Florida income: 52.5% (3rd largest)
> Cost of living in Florida: 0.1% less expensive than than U.S. avg.
[in-text-ad-2]

Georgia
> Household income range for middle class: $23,526 – $115,923
> Median family income: $71,457 (18th lowest)
> Middle class share of Georgia income: 45.4% (11th smallest)
> Richest 20% share of Georgia income: 51.5% (11th largest)
> Cost of living in Georgia: 7.5% less expensive than than U.S. avg.

Hawaii
> Household income range for middle class: $30,139 – $148,507
> Median family income: $95,448 (5th highest)
> Middle class share of Hawaii income: 48.5% (4th largest)
> Richest 20% share of Hawaii income: 48.0% (5th smallest)
> Cost of living in Hawaii: 18.5% more expensive than than U.S. avg.
[in-text-ad]

Idaho
> Household income range for middle class: $23,654 – $116,549
> Median family income: $65,987 (11th lowest)
> Middle class share of Idaho income: 47.5% (14th largest)
> Richest 20% share of Idaho income: 48.7% (11th smallest)
> Cost of living in Idaho: 7.0% less expensive than than U.S. avg.
Illinois
> Household income range for middle class: $25,052 – $123,442
> Median family income: $81,313 (17th highest)
> Middle class share of Illinois income: 45.2% (9th smallest)
> Richest 20% share of Illinois income: 51.8% (8th largest)
> Cost of living in Illinois: 1.5% less expensive than than U.S. avg.

Indiana
> Household income range for middle class: $22,840 – $112,539
> Median family income: $70,150 (17th lowest)
> Middle class share of Indiana income: 47.6% (11th largest)
> Richest 20% share of Indiana income: 48.7% (12th smallest)
> Cost of living in Indiana: 10.2% less expensive than than U.S. avg.
[in-text-ad-2]

Iowa
> Household income range for middle class: $22,840 – $112,539
> Median family income: $76,068 (24th highest)
> Middle class share of Iowa income: 48.3% (6th largest)
> Richest 20% share of Iowa income: 47.9% (4th smallest)
> Cost of living in Iowa: 10.2% less expensive than than U.S. avg.
Kansas
> Household income range for middle class: $22,891 – $112,790
> Median family income: $74,042 (25th lowest)
> Middle class share of Kansas income: 46.4% (25th smallest)
> Richest 20% share of Kansas income: 50.0% (25th smallest)
> Cost of living in Kansas: 10.0% less expensive than than U.S. avg.
[in-text-ad]
Kentucky
> Household income range for middle class: $22,356 – $110,158
> Median family income: $62,228 (6th lowest)
> Middle class share of Kentucky income: 45.8% (17th smallest)
> Richest 20% share of Kentucky income: 51.1% (16th largest)
> Cost of living in Kentucky: 12.1% less expensive than than U.S. avg.

Louisiana
> Household income range for middle class: $22,916 – $112,915
> Median family income: $61,847 (5th lowest)
> Middle class share of Louisiana income: 44.9% (6th smallest)
> Richest 20% share of Louisiana income: 52.2% (5th largest)
> Cost of living in Louisiana: 9.9% less expensive than than U.S. avg.

Maine
> Household income range for middle class: $25,027 – $123,317
> Median family income: $72,390 (24th lowest)
> Middle class share of Maine income: 47.9% (7th largest)
> Richest 20% share of Maine income: 48.6% (10th smallest)
> Cost of living in Maine: 1.6% less expensive than than U.S. avg.
[in-text-ad-2]

Maryland
> Household income range for middle class: $27,825 – $137,102
> Median family income: $101,437 (2nd highest)
> Middle class share of Maryland income: 47.7% (9th largest)
> Richest 20% share of Maryland income: 48.9% (14th smallest)
> Cost of living in Maryland: 9.4% more expensive than than U.S. avg.

Massachusetts
> Household income range for middle class: $27,443 – $135,222
> Median family income: $101,548 (the highest)
> Middle class share of Massachusetts income: 45.7% (15th smallest)
> Richest 20% share of Massachusetts income: 51.6% (10th largest)
> Cost of living in Massachusetts: 7.9% more expensive than than U.S. avg.
[in-text-ad]
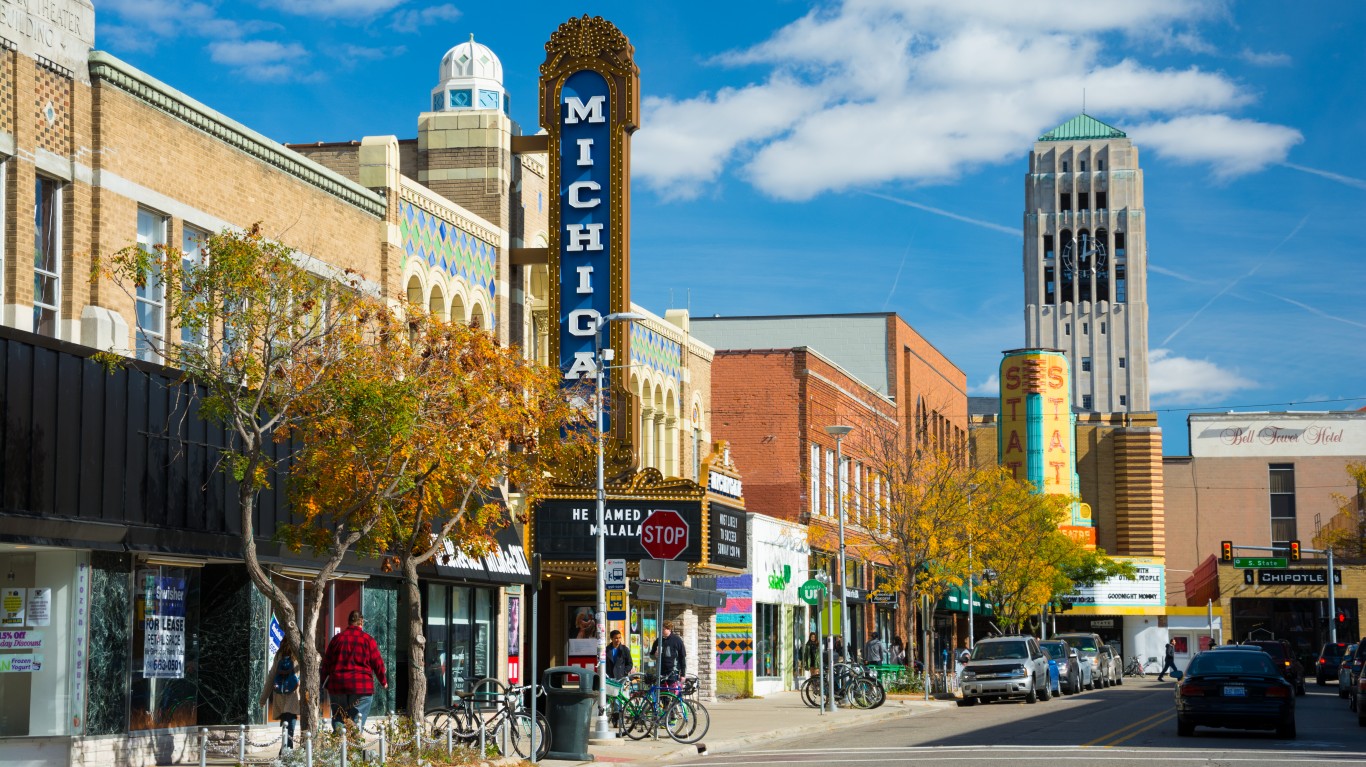
Michigan
> Household income range for middle class: $23,654 – $116,549
> Median family income: $72,036 (22nd lowest)
> Middle class share of Michigan income: 46.4% (25th largest)
> Richest 20% share of Michigan income: 50.3% (25th largest)
> Cost of living in Michigan: 7.0% less expensive than than U.S. avg.

Minnesota
> Household income range for middle class: $24,798 – $122,189
> Median family income: $89,039 (8th highest)
> Middle class share of Minnesota income: 47.4% (15th largest)
> Richest 20% share of Minnesota income: 49.0% (15th smallest)
> Cost of living in Minnesota: 2.5% less expensive than than U.S. avg.

Mississippi
> Household income range for middle class: $21,797 – $107,401
> Median family income: $57,380 (the lowest)
> Middle class share of Mississippi income: 46.1% (21st smallest)
> Richest 20% share of Mississippi income: 51.1% (17th largest)
> Cost of living in Mississippi: 14.3% less expensive than than U.S. avg.
[in-text-ad-2]

Missouri
> Household income range for middle class: $22,763 – $112,163
> Median family income: $69,188 (15th lowest)
> Middle class share of Missouri income: 46.3% (24th smallest)
> Richest 20% share of Missouri income: 50.3% (24th largest)
> Cost of living in Missouri: 10.5% less expensive than than U.S. avg.

Montana
> Household income range for middle class: $24,061 – $118,555
> Median family income: $68,940 (14th lowest)
> Middle class share of Montana income: 47.4% (16th largest)
> Richest 20% share of Montana income: 49.1% (16th smallest)
> Cost of living in Montana: 5.4% less expensive than than U.S. avg.
[in-text-ad]

Nebraska
> Household income range for middle class: $22,789 – $112,289
> Median family income: $75,990 (25th highest)
> Middle class share of Nebraska income: 47.6% (12th largest)
> Richest 20% share of Nebraska income: 48.6% (10th smallest)
> Cost of living in Nebraska: 10.4% less expensive than than U.S. avg.

Nevada
> Household income range for middle class: $24,824 – $122,314
> Median family income: $71,864 (19th lowest)
> Middle class share of Nevada income: 46.2% (22nd smallest)
> Richest 20% share of Nevada income: 50.5% (22nd largest)
> Cost of living in Nevada: 2.4% less expensive than than U.S. avg.

New Hampshire
> Household income range for middle class: $26,909 – $132,591
> Median family income: $93,930 (6th highest)
> Middle class share of New Hampshire income: 47.6% (13th largest)
> Richest 20% share of New Hampshire income: 48.8% (13th smallest)
> Cost of living in New Hampshire: 5.8% more expensive than than U.S. avg.
[in-text-ad-2]
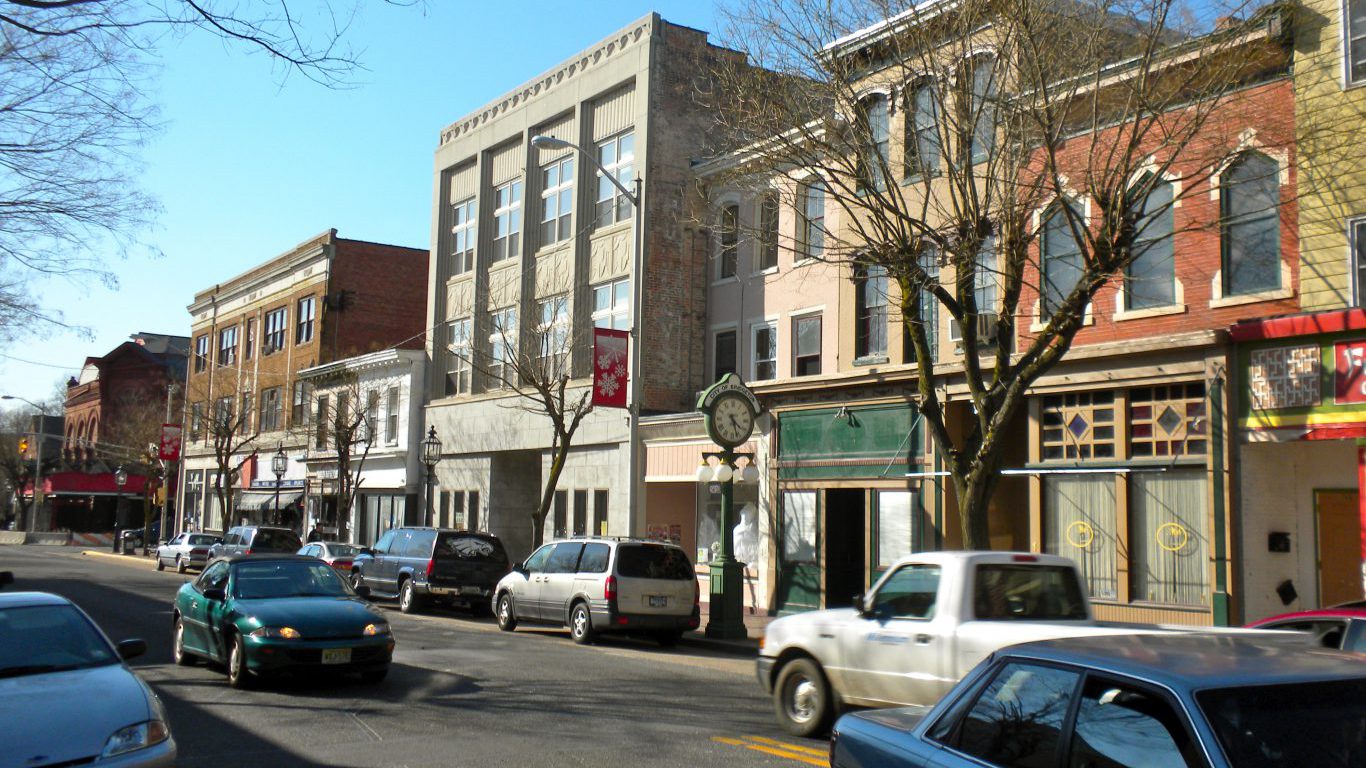
New Jersey
> Household income range for middle class: $28,715 – $141,489
> Median family income: $101,404 (3rd highest)
> Middle class share of New Jersey income: 45.5% (12th smallest)
> Richest 20% share of New Jersey income: 51.5% (12th largest)
> Cost of living in New Jersey: 12.9% more expensive than than U.S. avg.

New Mexico
> Household income range for middle class: $23,730 – $116,925
> Median family income: $58,760 (4th lowest)
> Middle class share of New Mexico income: 45.2% (8th smallest)
> Richest 20% share of New Mexico income: 52.0% (7th largest)
> Cost of living in New Mexico: 6.7% less expensive than than U.S. avg.
[in-text-ad]

New York
> Household income range for middle class: $29,453 – $145,123
> Median family income: $83,311 (15th highest)
> Middle class share of New York income: 43.3% (the smallest)
> Richest 20% share of New York income: 54.1% (the largest)
> Cost of living in New York: 15.8% more expensive than than U.S. avg.

North Carolina
> Household income range for middle class: $23,221 – $114,419
> Median family income: $67,816 (13th lowest)
> Middle class share of North Carolina income: 45.2% (7th smallest)
> Richest 20% share of North Carolina income: 51.5% (13th largest)
> Cost of living in North Carolina: 8.7% less expensive than than U.S. avg.
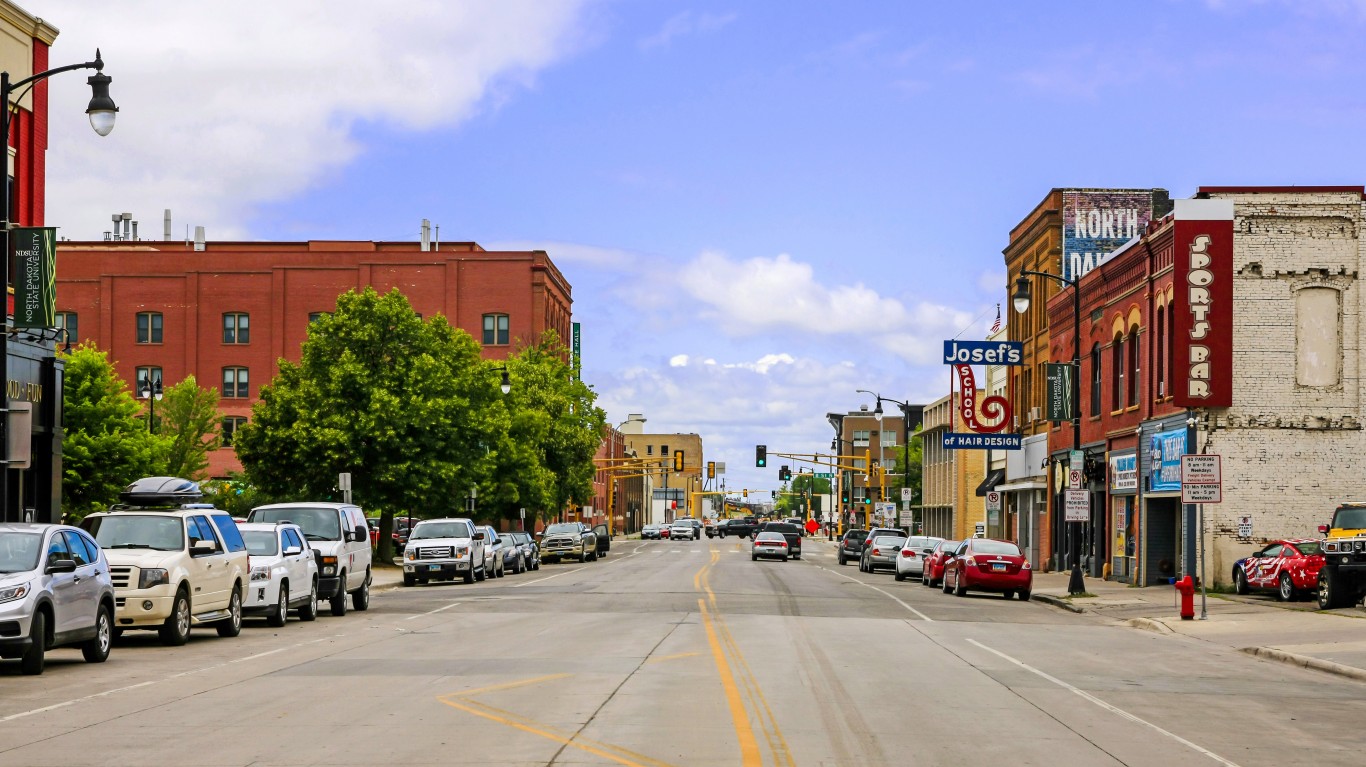
North Dakota
> Household income range for middle class: $22,916 – $112,915
> Median family income: $86,205 (12th highest)
> Middle class share of North Dakota income: 48.8% (2nd largest)
> Richest 20% share of North Dakota income: 47.7% (3rd smallest)
> Cost of living in North Dakota: 9.9% less expensive than than U.S. avg.
[in-text-ad-2]
Ohio
> Household income range for middle class: $22,611 – $111,411
> Median family income: $72,028 (21st lowest)
> Middle class share of Ohio income: 46.7% (23rd largest)
> Richest 20% share of Ohio income: 50.0% (24th smallest)
> Cost of living in Ohio: 11.1% less expensive than than U.S. avg.

Oklahoma
> Household income range for middle class: $22,636 – $111,537
> Median family income: $64,082 (8th lowest)
> Middle class share of Oklahoma income: 46.2% (23rd smallest)
> Richest 20% share of Oklahoma income: 50.4% (23rd largest)
> Cost of living in Oklahoma: 11.0% less expensive than than U.S. avg.
[in-text-ad]

Oregon
> Household income range for middle class: $25,307 – $124,695
> Median family income: $77,655 (21st highest)
> Middle class share of Oregon income: 46.9% (22nd largest)
> Richest 20% share of Oregon income: 49.5% (21st smallest)
> Cost of living in Oregon: 0.5% less expensive than than U.S. avg.

Pennsylvania
> Household income range for middle class: $24,900 – $122,690
> Median family income: $77,491 (22nd highest)
> Middle class share of Pennsylvania income: 46.0% (20th smallest)
> Richest 20% share of Pennsylvania income: 50.8% (20th largest)
> Cost of living in Pennsylvania: 2.1% less expensive than than U.S. avg.

Rhode Island
> Household income range for middle class: $25,078 – $123,567
> Median family income: $84,212 (14th highest)
> Middle class share of Rhode Island income: 47.2% (18th largest)
> Richest 20% share of Rhode Island income: 49.8% (22nd smallest)
> Cost of living in Rhode Island: 1.4% less expensive than than U.S. avg.
[in-text-ad-2]

South Carolina
> Household income range for middle class: $22,992 – $113,291
> Median family income: $65,742 (10th lowest)
> Middle class share of South Carolina income: 45.8% (16th smallest)
> Richest 20% share of South Carolina income: 51.0% (18th largest)
> Cost of living in South Carolina: 9.6% less expensive than than U.S. avg.
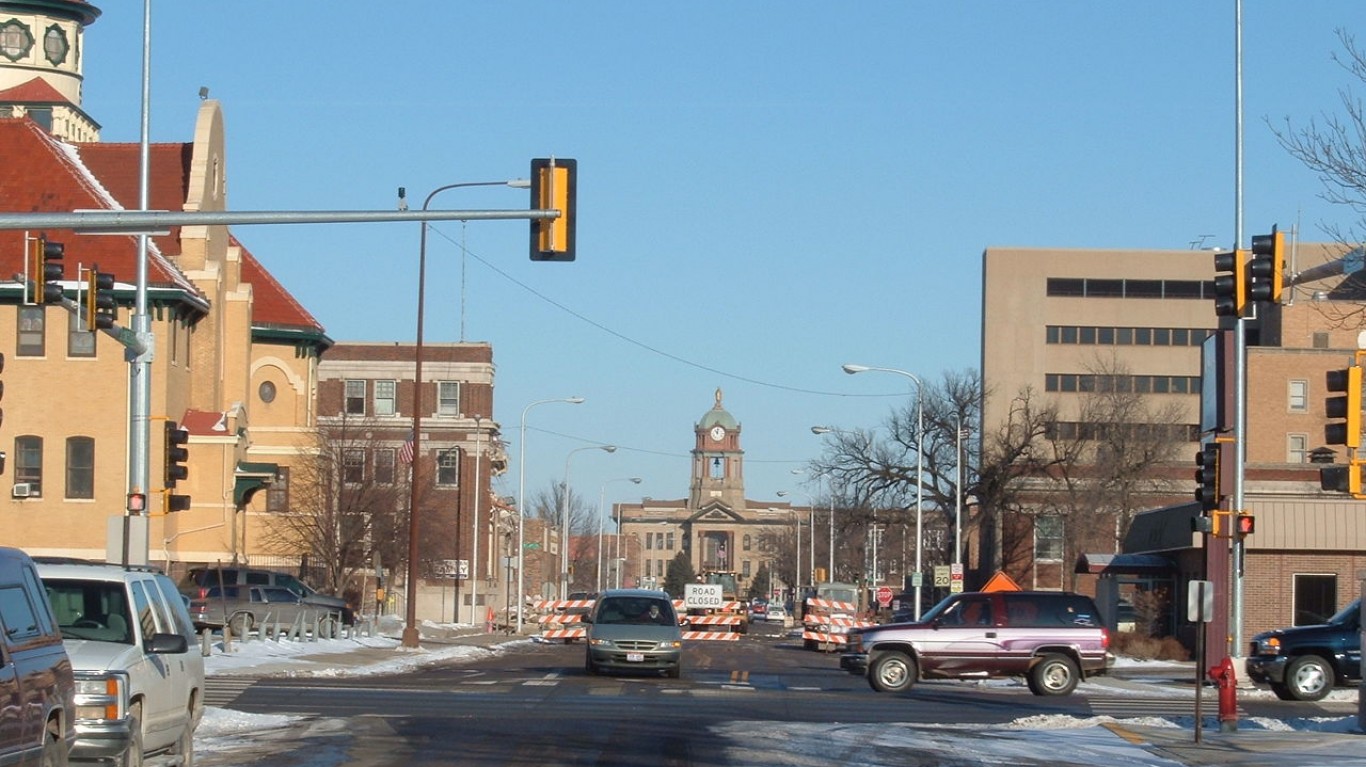
South Dakota
> Household income range for middle class: $22,433 – $110,534
> Median family income: $72,183 (23rd lowest)
> Middle class share of South Dakota income: 47.9% (8th largest)
> Richest 20% share of South Dakota income: 48.3% (7th smallest)
> Cost of living in South Dakota: 11.8% less expensive than than U.S. avg.
[in-text-ad]

Tennessee
> Household income range for middle class: $22,992 – $113,291
> Median family income: $65,656 (9th lowest)
> Middle class share of Tennessee income: 45.6% (13th smallest)
> Richest 20% share of Tennessee income: 51.2% (15th largest)
> Cost of living in Tennessee: 9.6% less expensive than than U.S. avg.

Texas
> Household income range for middle class: $24,671 – $121,562
> Median family income: $71,868 (20th lowest)
> Middle class share of Texas income: 45.3% (10th smallest)
> Richest 20% share of Texas income: 51.6% (9th largest)
> Cost of living in Texas: 3.0% less expensive than than U.S. avg.

Utah
> Household income range for middle class: $24,671 – $121,562
> Median family income: $81,599 (16th highest)
> Middle class share of Utah income: 48.8% (3rd largest)
> Richest 20% share of Utah income: 47.0% (the smallest)
> Cost of living in Utah: 3.0% less expensive than than U.S. avg.
[in-text-ad-2]

Vermont
> Household income range for middle class: $26,070 – $128,455
> Median family income: $80,452 (18th highest)
> Middle class share of Vermont income: 48.4% (5th largest)
> Richest 20% share of Vermont income: 48.1% (6th smallest)
> Cost of living in Vermont: 2.5% more expensive than than U.S. avg.

Virginia
> Household income range for middle class: $25,968 – $127,954
> Median family income: $88,929 (10th highest)
> Middle class share of Virginia income: 45.9% (18th smallest)
> Richest 20% share of Virginia income: 50.9% (19th largest)
> Cost of living in Virginia: 2.1% more expensive than than U.S. avg.
[in-text-ad]

Washington
> Household income range for middle class: $27,062 – $133,343
> Median family income: $87,652 (11th highest)
> Middle class share of Washington income: 46.9% (21st largest)
> Richest 20% share of Washington income: 49.5% (20th smallest)
> Cost of living in Washington: 6.4% more expensive than than U.S. avg.

West Virginia
> Household income range for middle class: $22,128 – $109,030
> Median family income: $57,718 (2nd lowest)
> Middle class share of West Virginia income: 46.0% (20th smallest)
> Richest 20% share of West Virginia income: 50.8% (21st largest)
> Cost of living in West Virginia: 13.0% less expensive than than U.S. avg.

Wisconsin
> Household income range for middle class: $23,501 – $115,798
> Median family income: $76,814 (23rd highest)
> Middle class share of Wisconsin income: 47.7% (10th largest)
> Richest 20% share of Wisconsin income: 48.6% (8th smallest)
> Cost of living in Wisconsin: 7.6% less expensive than than U.S. avg.
[in-text-ad-2]

Wyoming
> Household income range for middle class: $24,213 – $119,307
> Median family income: $78,352 (20th highest)
> Middle class share of Wyoming income: 47.2% (19th largest)
> Richest 20% share of Wyoming income: 49.1% (17th smallest)
> Cost of living in Wyoming: 4.8% less expensive than than U.S. avg.
Methodology
To determine the income it takes for a family to be considered middle class in every state, 24/7 Wall St. reviewed data on the upper and lower bounds of U.S. household income quintiles from the U.S. Census Bureau’s 2018 American Community Survey. The boundaries of the three middle income quintiles for the U.S. as a whole were adjusted for state-level cost of living using regional price parity (RPP) data for 2017 from the Bureau of Economic Analysis. The RPP-adjusted boundaries were defined as the range of income that could be considered middle class in a given state. Data on median household income, the percentage of households earning $10,000 or less, the percentage of households earning $200,000 or more, median home value, and the Gini index of income inequality came from the U.S. Census Bureau’s 2018 American Community Survey.
Start by taking a quick retirement quiz from SmartAsset that will match you with up to 3 financial advisors that serve your area and beyond in 5 minutes, or less.
Each advisor has been vetted by SmartAsset and is held to a fiduciary standard to act in your best interests.
Here’s how it works:
1. Answer SmartAsset advisor match quiz
2. Review your pre-screened matches at your leisure. Check out the advisors’ profiles.
3. Speak with advisors at no cost to you. Have an introductory call on the phone or introduction in person and choose whom to work with in the future
Thank you for reading! Have some feedback for us?
Contact the 24/7 Wall St. editorial team.