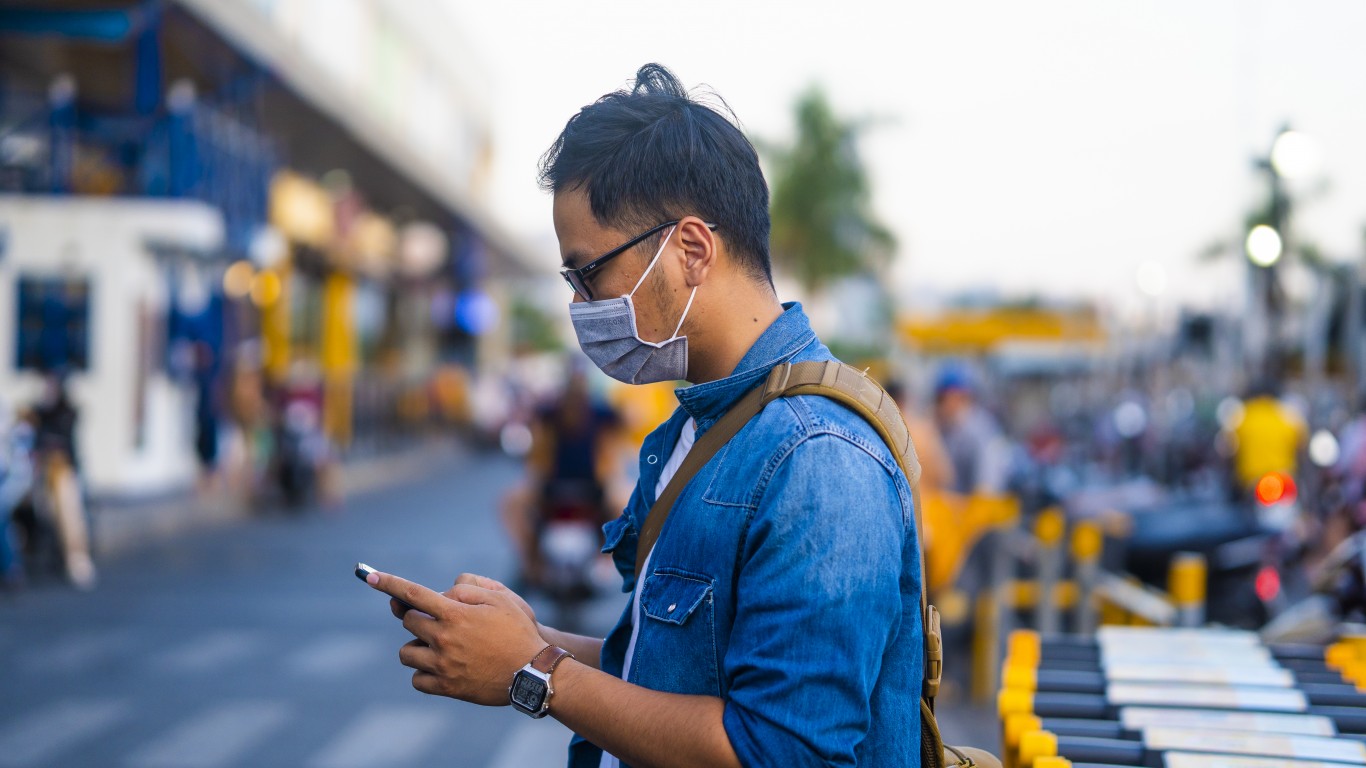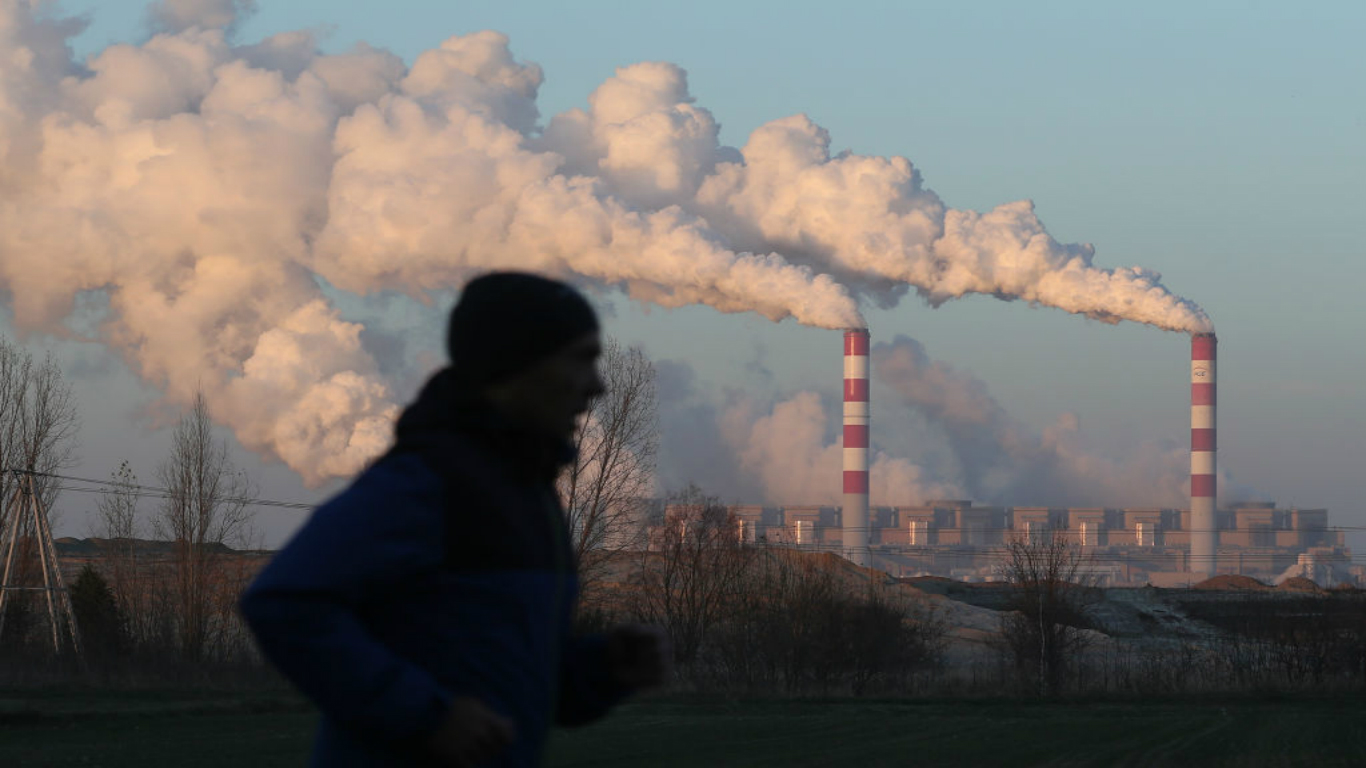
When Americans picture the steel mills of Pittsburgh or industrial parts of New Jersey, images of white and grey plumes of smoke come to mind. But no matter how bad the smog can get in a U.S. city, it’s still far better than the most polluted cities in the world.
About 7 million people worldwide die from causes that can be attributed to air pollution, according to the World Health Organization. The most harmful air pollutant is PM2.5 — shorthand for particulate matter that is 2.5 micrometers in diameter or smaller. (For perspective, the diameter of a human hair is 50 to 70 micrometers, so particles that are 2.5 micrometers or smaller are very fine and inhalable.) These tiny particles make it into the bloodstream through the lungs.
To identify the world’s most polluted cities, 24/7 Tempo reviewed the average annual concentration of PM2.5 particles in more than 2,600 cities around the globe from the World Health Organization’s 2018 update to its Global Ambient Air Quality Database. The 30 cities on this list all have a PM2.5 concentration of at least 84 micrograms per cubic meter or more.
We also included PM10 pollution, or concentration levels of larger inhalable particles that are 10 micrometer in diameter or smaller. While the finer PM2.5 particles can get deep into the lungs and even the bloodstream, the coarser PM10 particles are less harmful, although they can irritate a person’s eyes, nose, and throat.
Click here to see the 30 most polluted cities in the world.
Click here for our detailed findings and methodology.
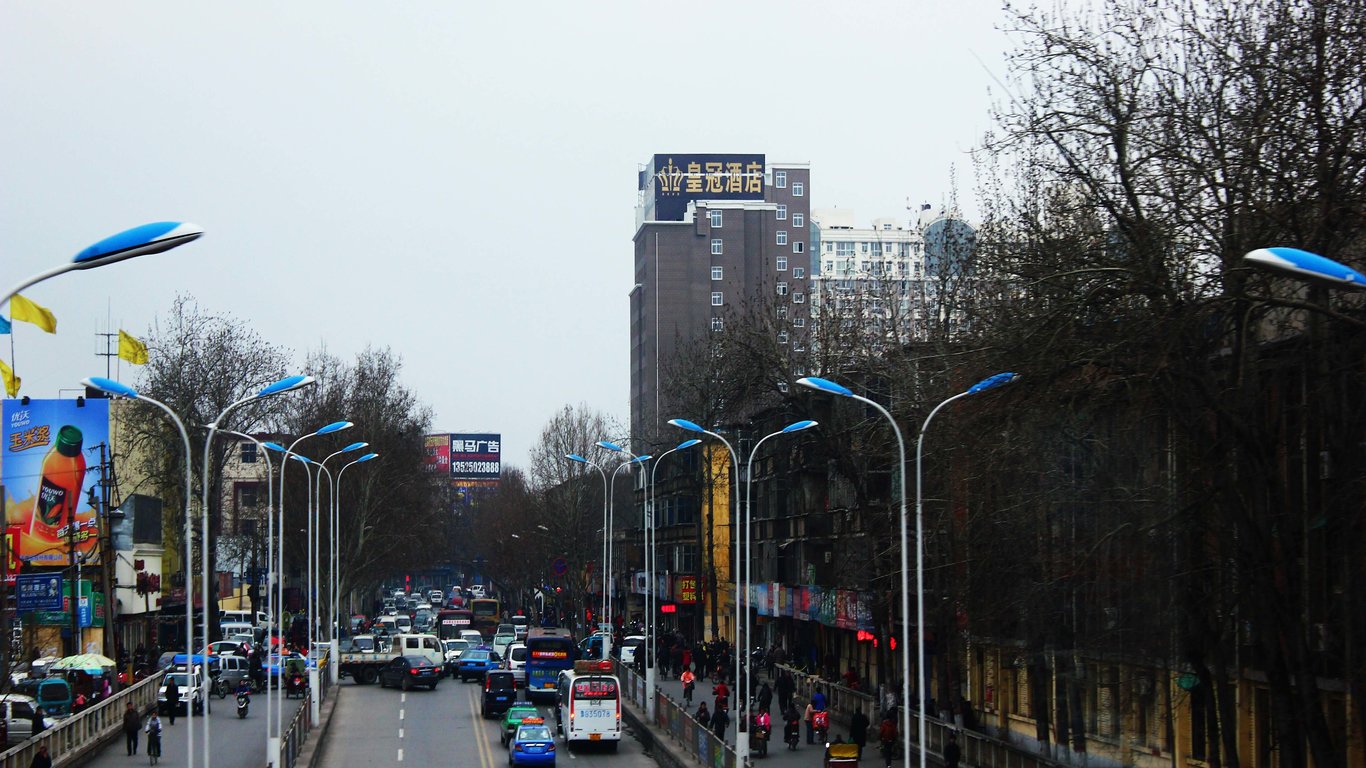
30. Xinxiang, Northeast China
> Population: 5.7 million
> Average annual PM2.5 pollution per cubic meter: 84.0 micrograms
> Average annual PM10 pollution per cubic meter: 144.0 micrograms
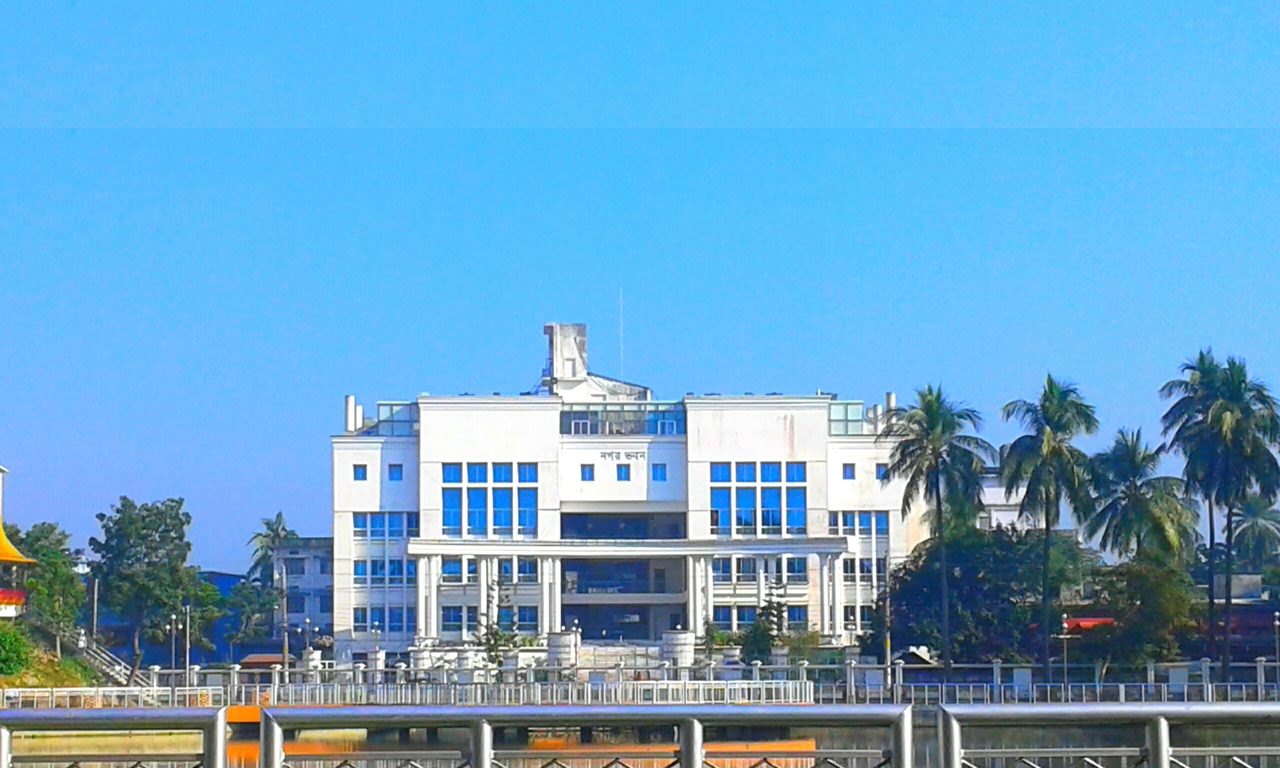
29. Khulna, Bangladesh
> Population: 665,000
> Average annual PM2.5 pollution per cubic meter: 84.0 micrograms
> Average annual PM10 pollution per cubic meter: 94.0 micrograms

28. Jiaozuo, Central China
> Population: 732,000
> Average annual PM2.5 pollution per cubic meter: 85.0 micrograms
> Average annual PM10 pollution per cubic meter: 142.0 micrograms
[in-text-ad]
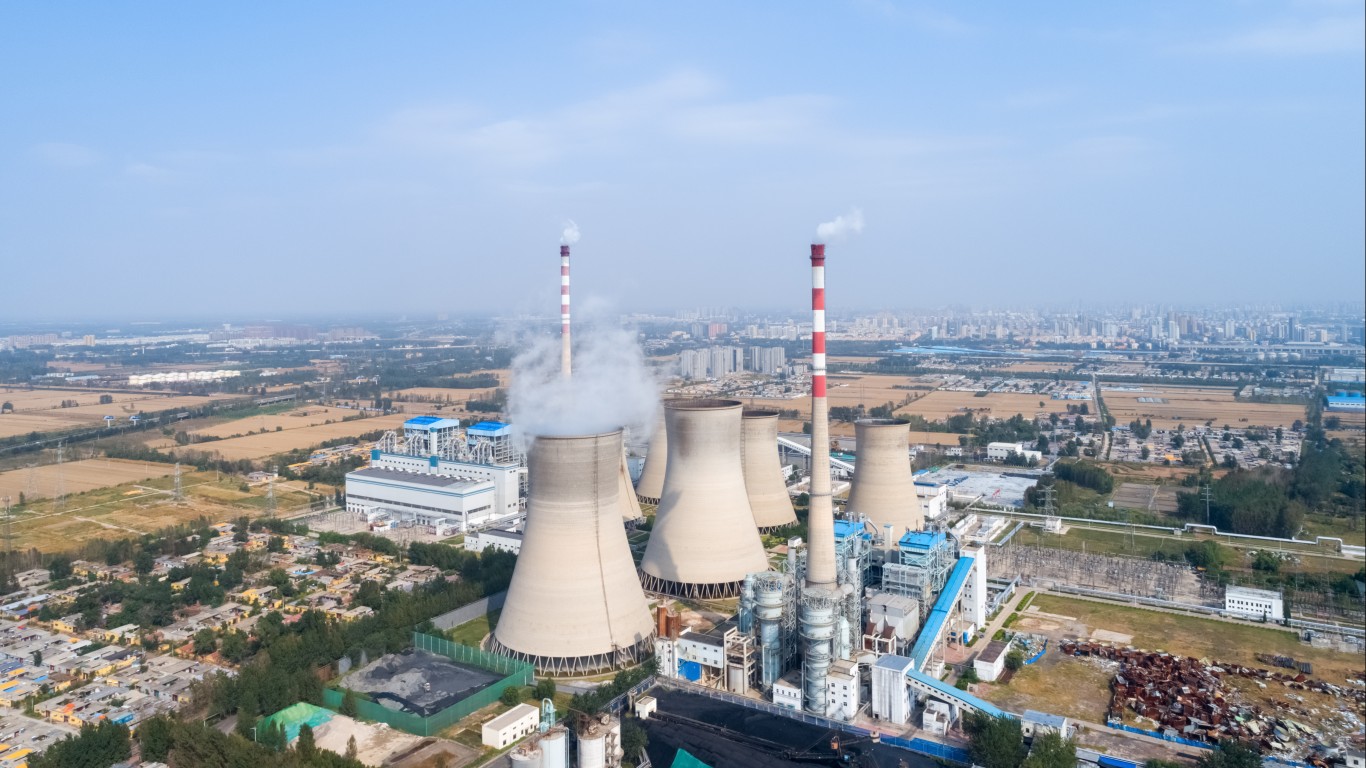
27. Liaocheng, East China
> Population: 677,000
> Average annual PM2.5 pollution per cubic meter: 86.0 micrograms
> Average annual PM10 pollution per cubic meter: 151.0 micrograms
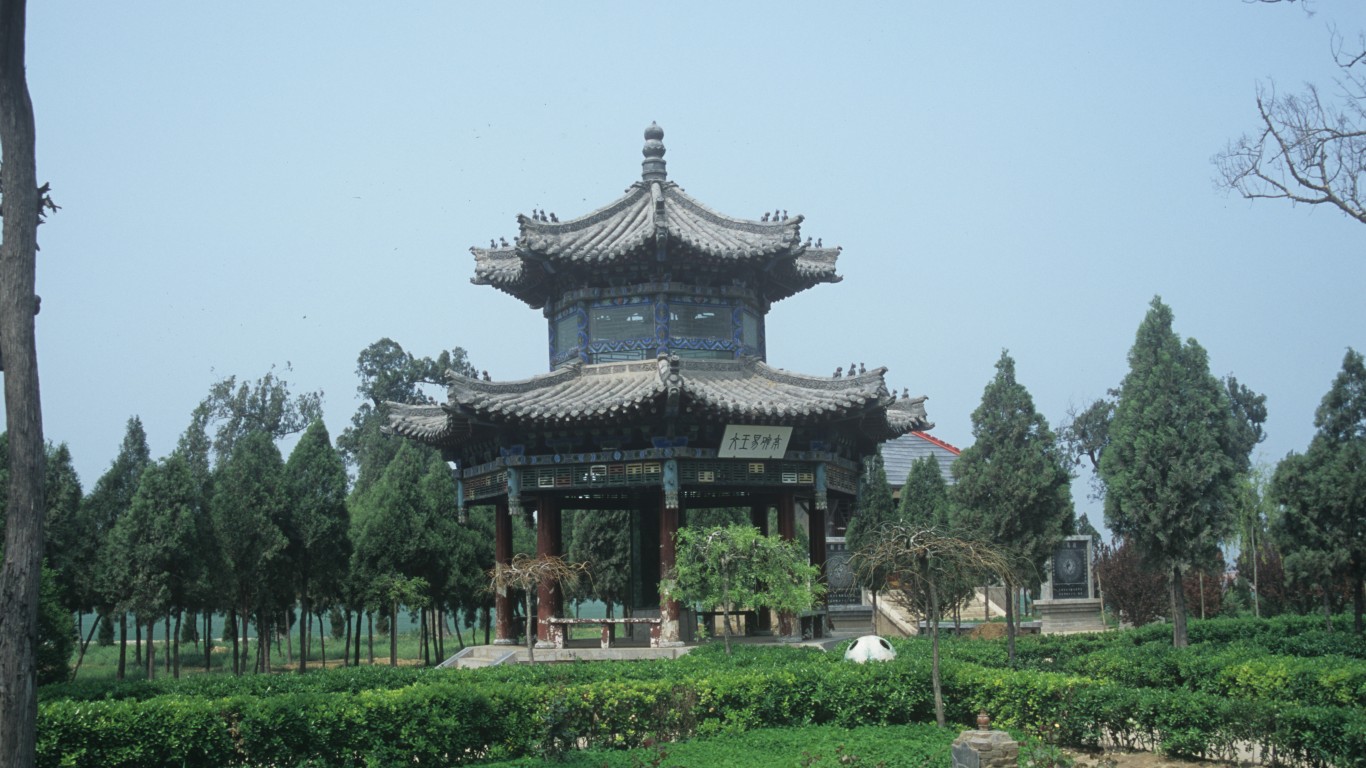
26. Anyang, Central China
> Population: 1.1 million
> Average annual PM2.5 pollution per cubic meter: 86.0 micrograms
> Average annual PM10 pollution per cubic meter: 155.0 micrograms
[in-text-ad-2]
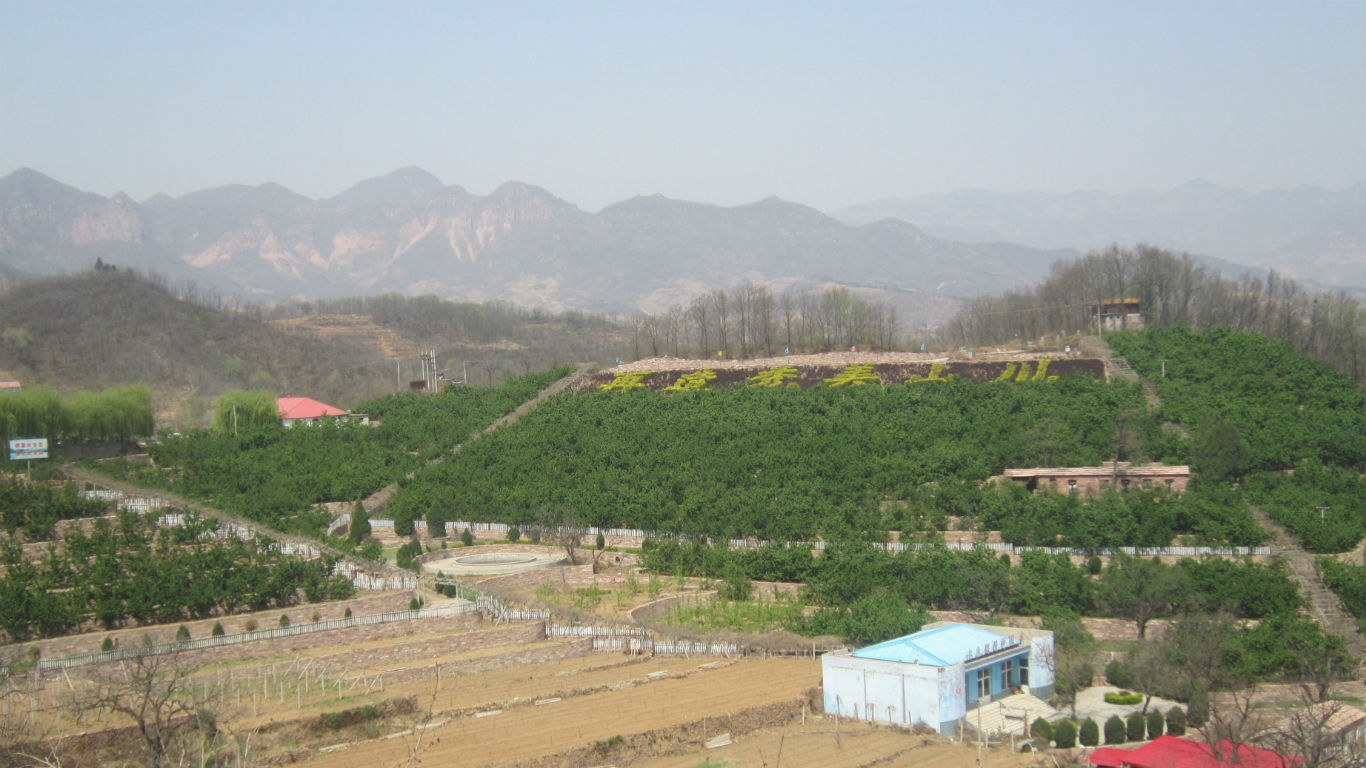
25. Xingtai, North China
> Population: 742,000
> Average annual PM2.5 pollution per cubic meter: 87.0 micrograms
> Average annual PM10 pollution per cubic meter: 185.9 micrograms
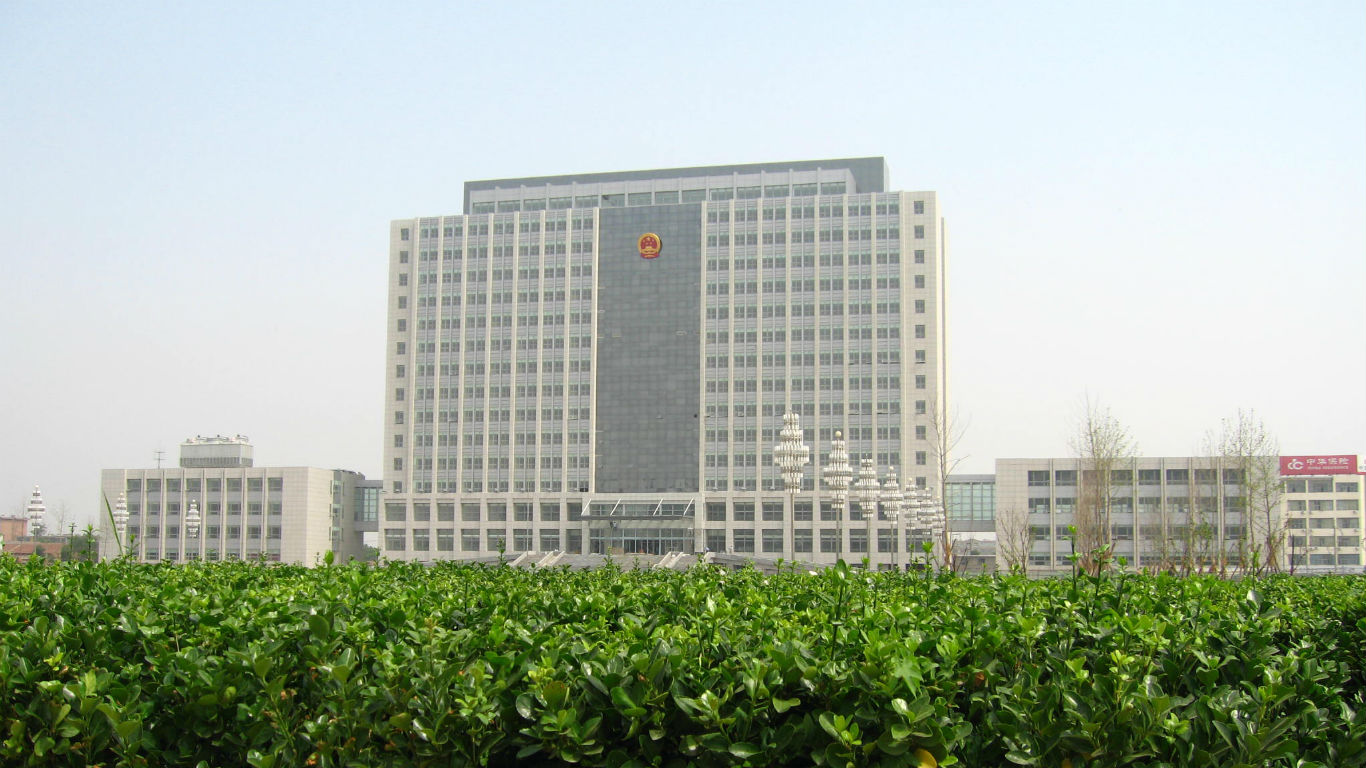
24. Hengshui, North China
> Population: 478,000
> Average annual PM2.5 pollution per cubic meter: 87.0 micrograms
> Average annual PM10 pollution per cubic meter: 143.0 micrograms
[in-text-ad]
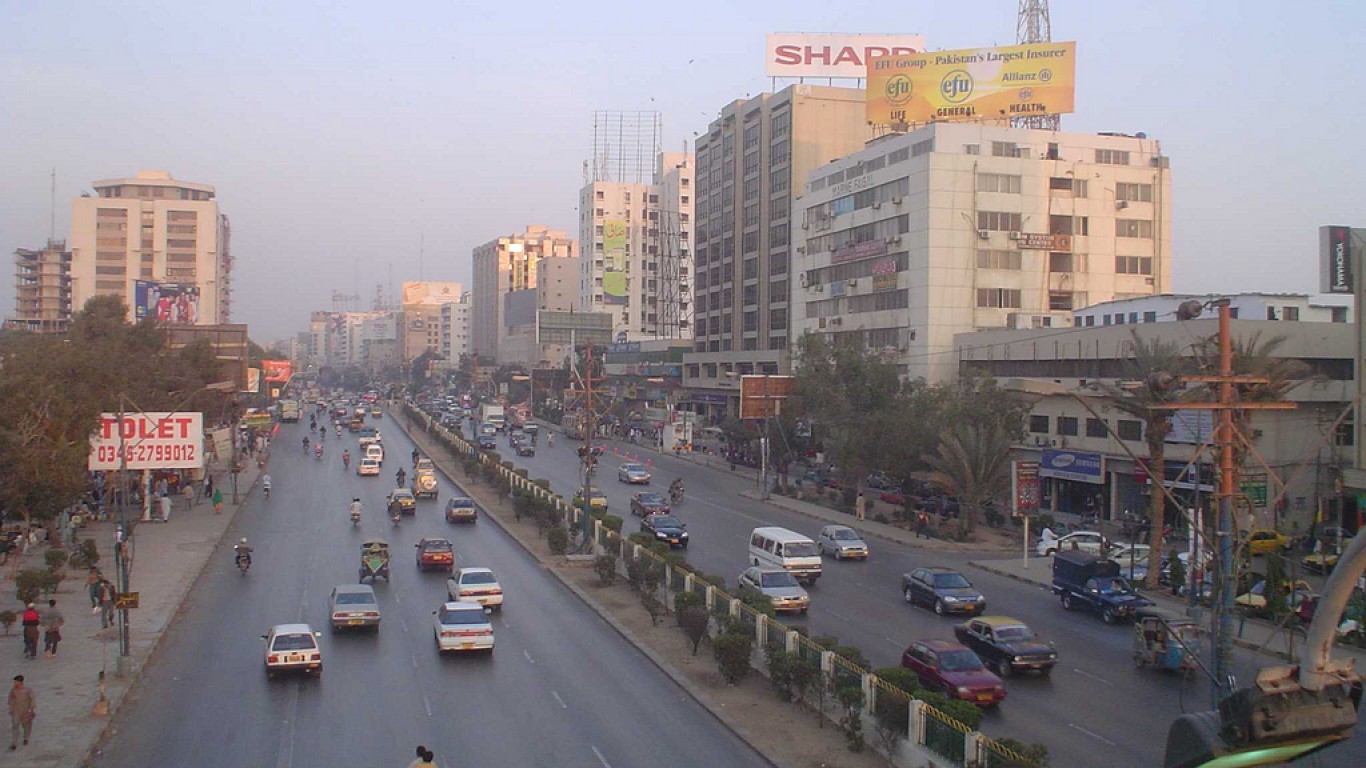
23. Karachi, Pakistan
> Population: 14.9 million
> Average annual PM2.5 pollution per cubic meter: 8.0 micrograms
> Average annual PM10 pollution per cubic meter: 290.0 micrograms
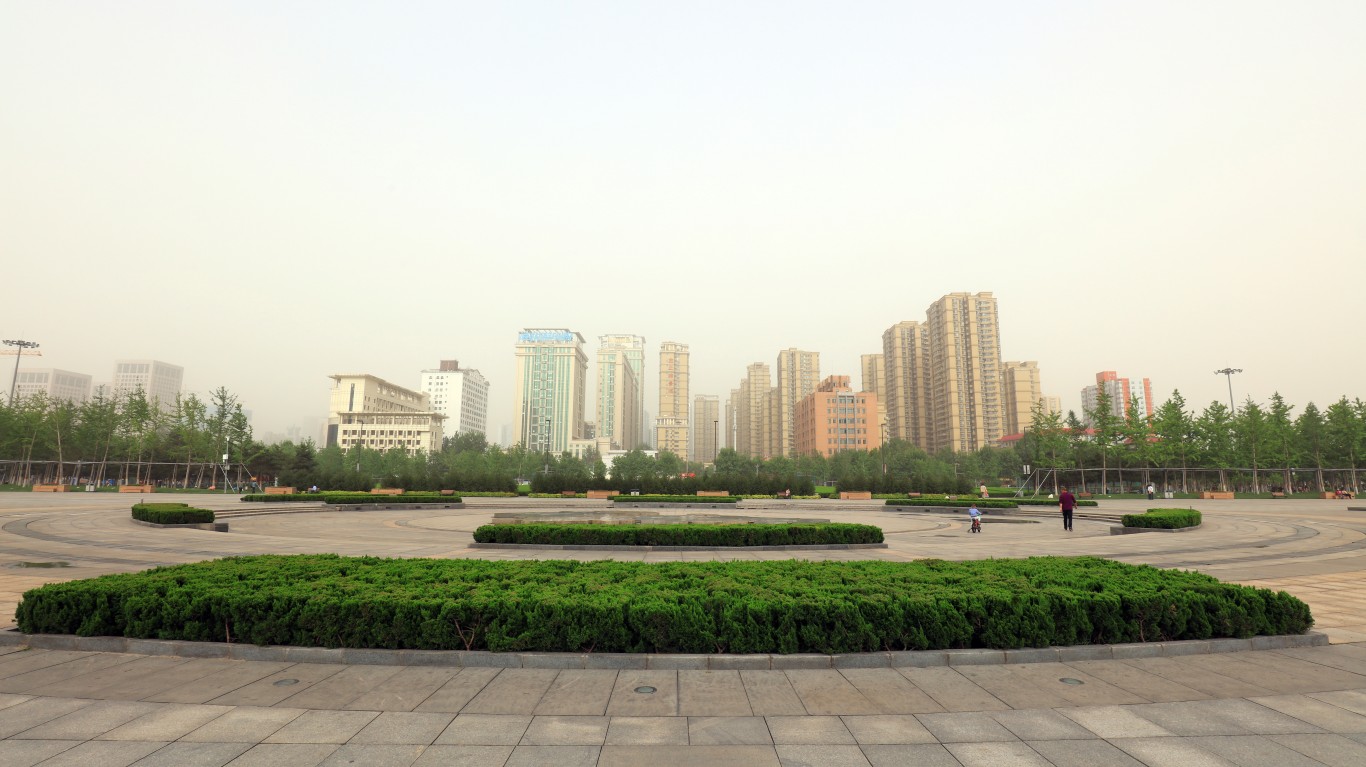
22. Shijiazhuang, North China
> Population: 3.3 million
> Average annual PM2.5 pollution per cubic meter: 89.0 micrograms
> Average annual PM10 pollution per cubic meter: 147.0 micrograms

21. Ji’nan, East China
> Population: 4.0 million
> Average annual PM2.5 pollution per cubic meter: 90.0 micrograms
> Average annual PM10 pollution per cubic meter: 192.3 micrograms
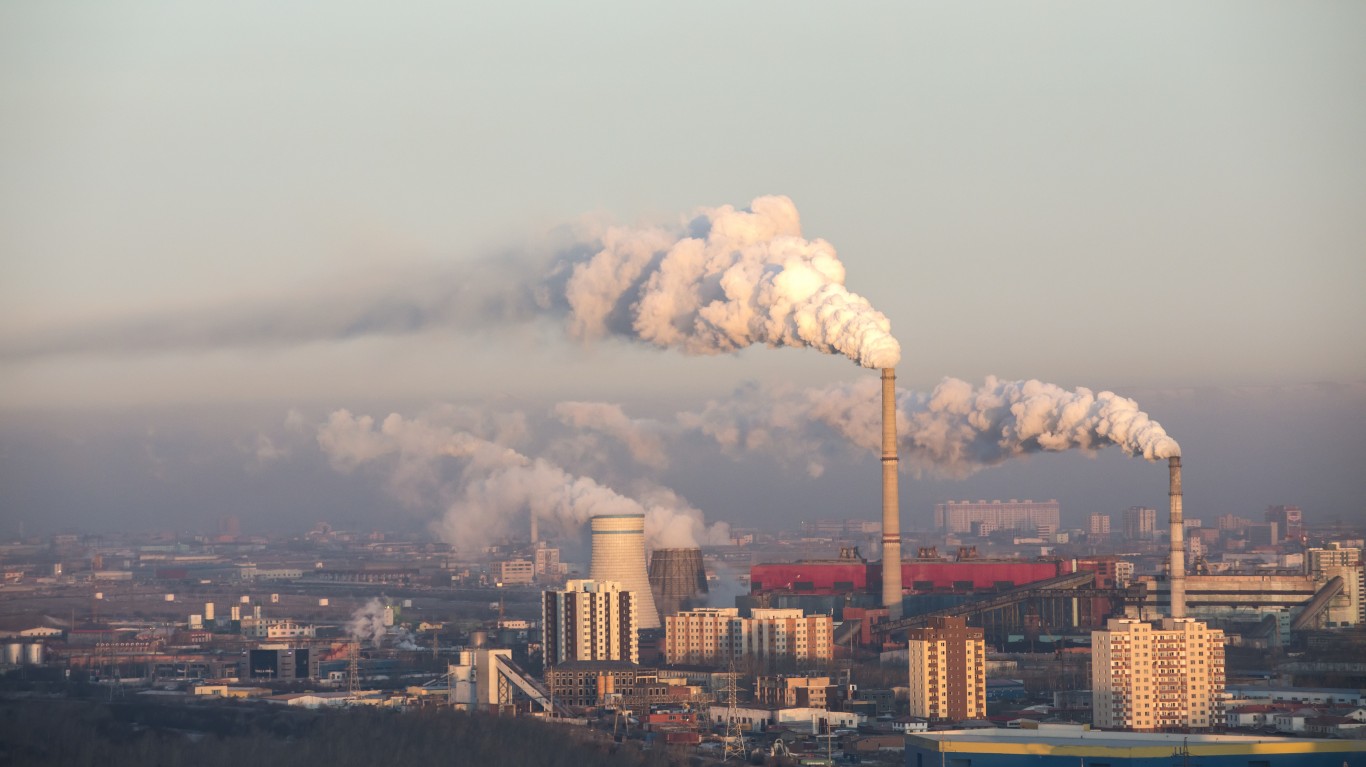
20. Ulaanbaatar, Mongolia
> Population: 1.4 million
> Average annual PM2.5 pollution per cubic meter: 92.2 micrograms
> Average annual PM10 pollution per cubic meter: 196.9 micrograms
[in-text-ad-2]
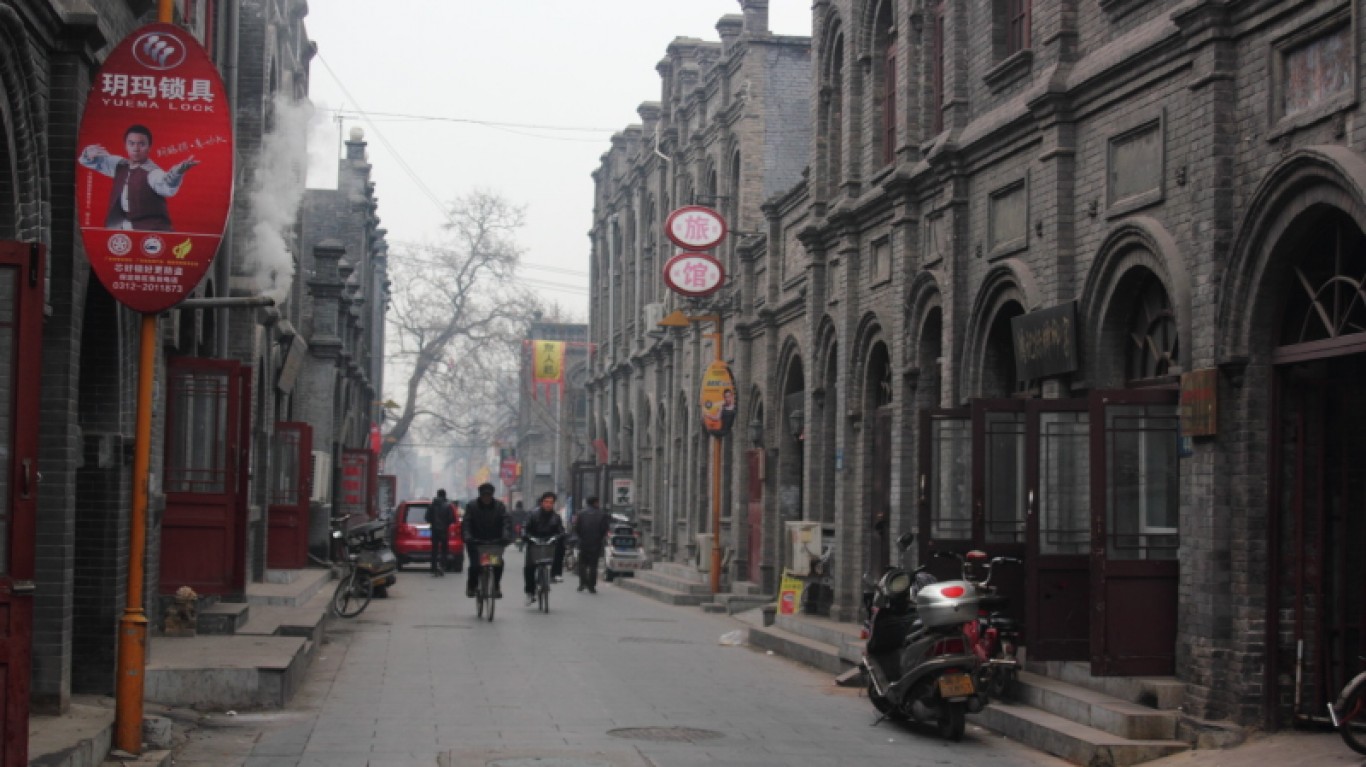
19. Baoding, North China
> Population: 1.1 million
> Average annual PM2.5 pollution per cubic meter: 93.0 micrograms
> Average annual PM10 pollution per cubic meter: 147.0 micrograms
[in-text-ad]
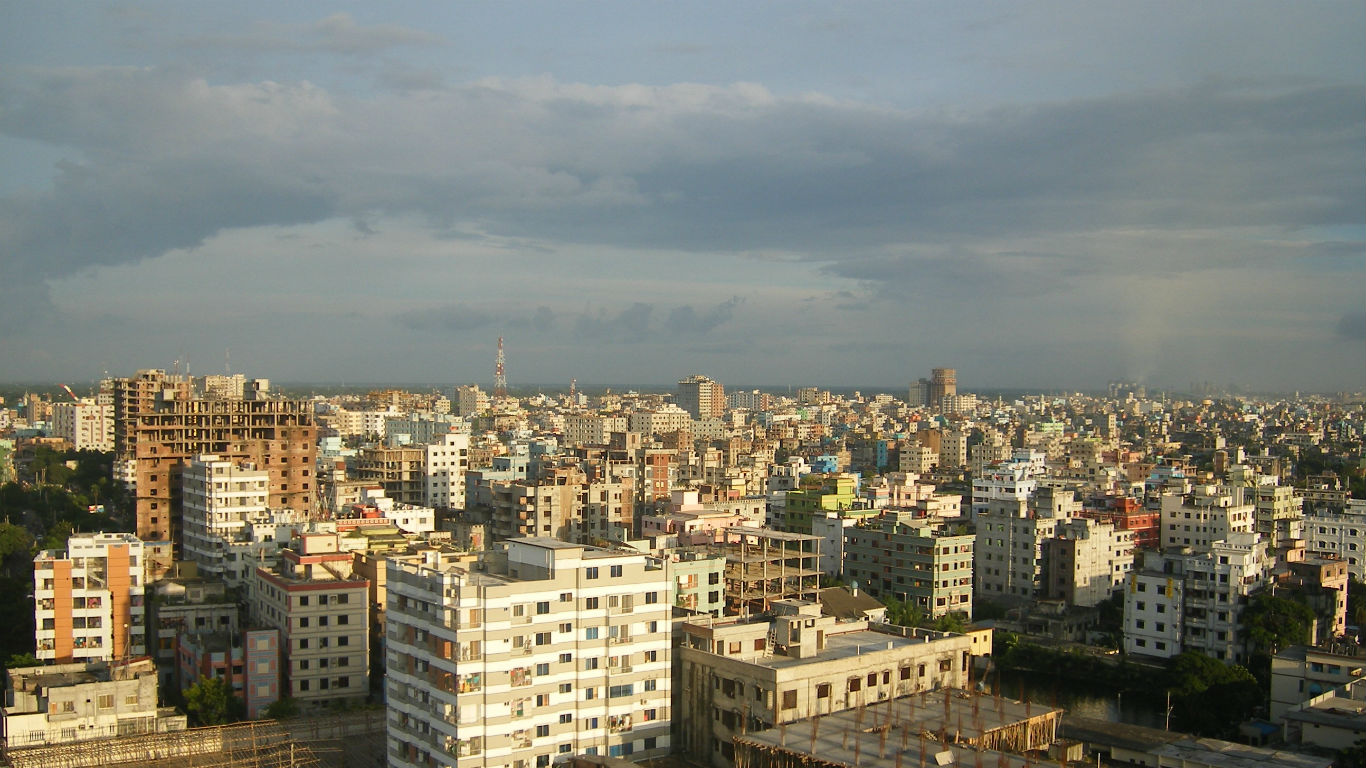
18. Narayangonj, Bangladesh
> Population: 543,000
> Average annual PM2.5 pollution per cubic meter: 94.2 micrograms
> Average annual PM10 pollution per cubic meter: 205.0 micrograms
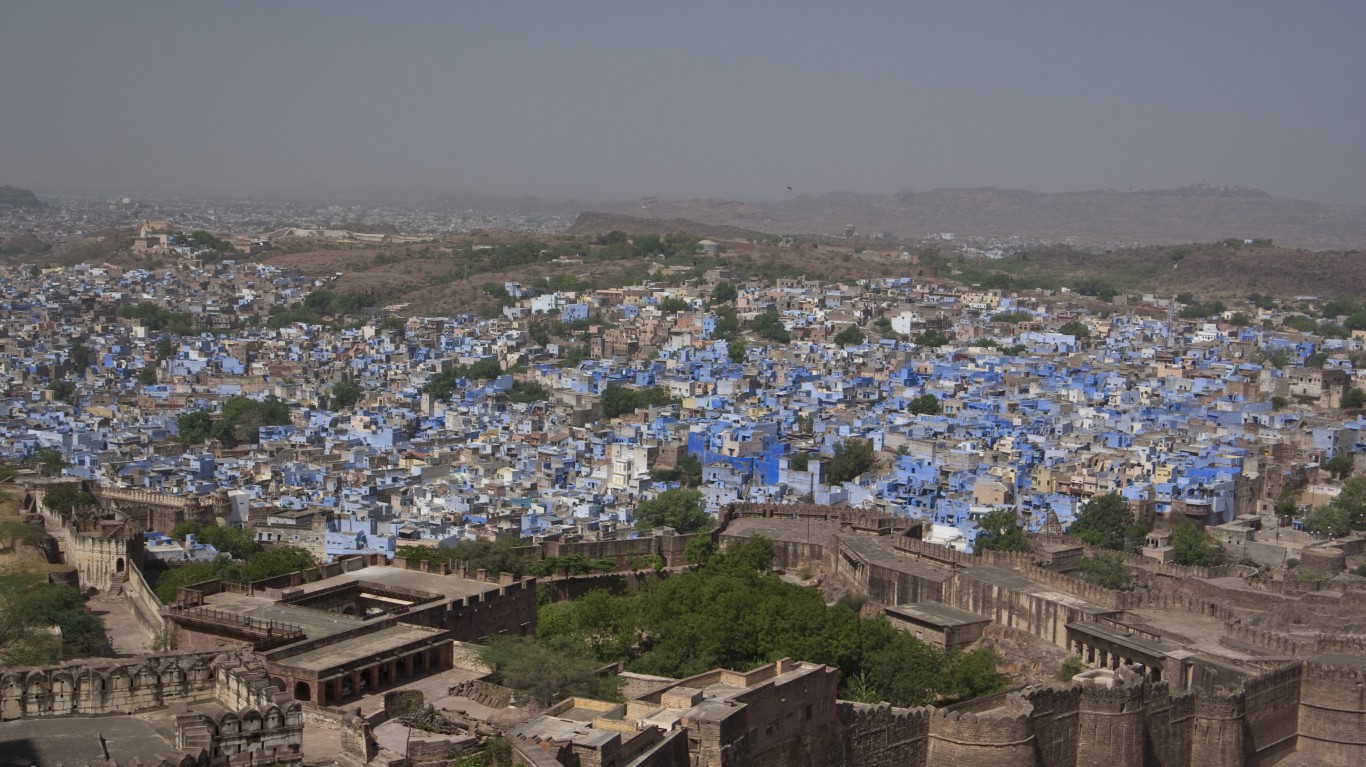
17. Jodhpur, West India
> Population: 1.3 million
> Average annual PM2.5 pollution per cubic meter: 97.8 micrograms
> Average annual PM10 pollution per cubic meter: 180.2 micrograms
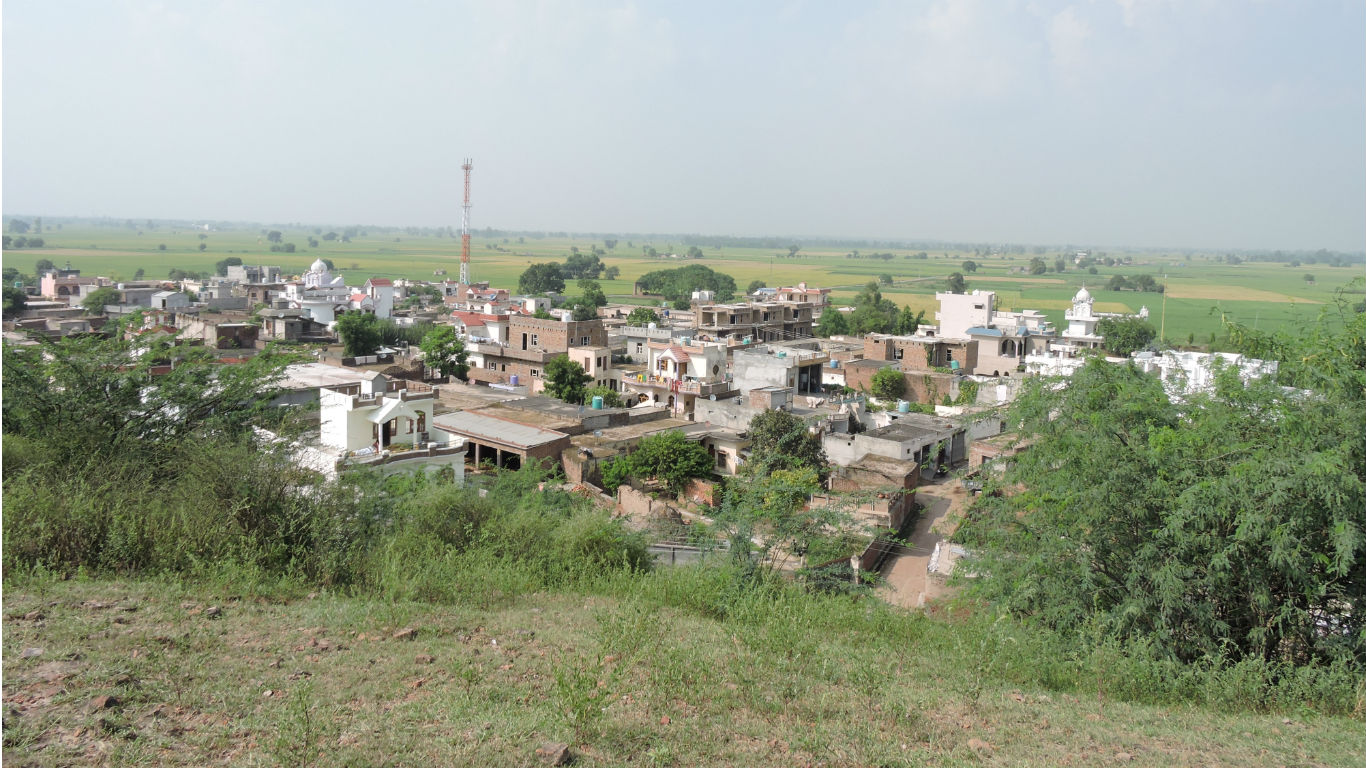
16. Patiala, North India
> Population: 510,000
> Average annual PM2.5 pollution per cubic meter: 101.2 micrograms
> Average annual PM10 pollution per cubic meter: 183.7 micrograms
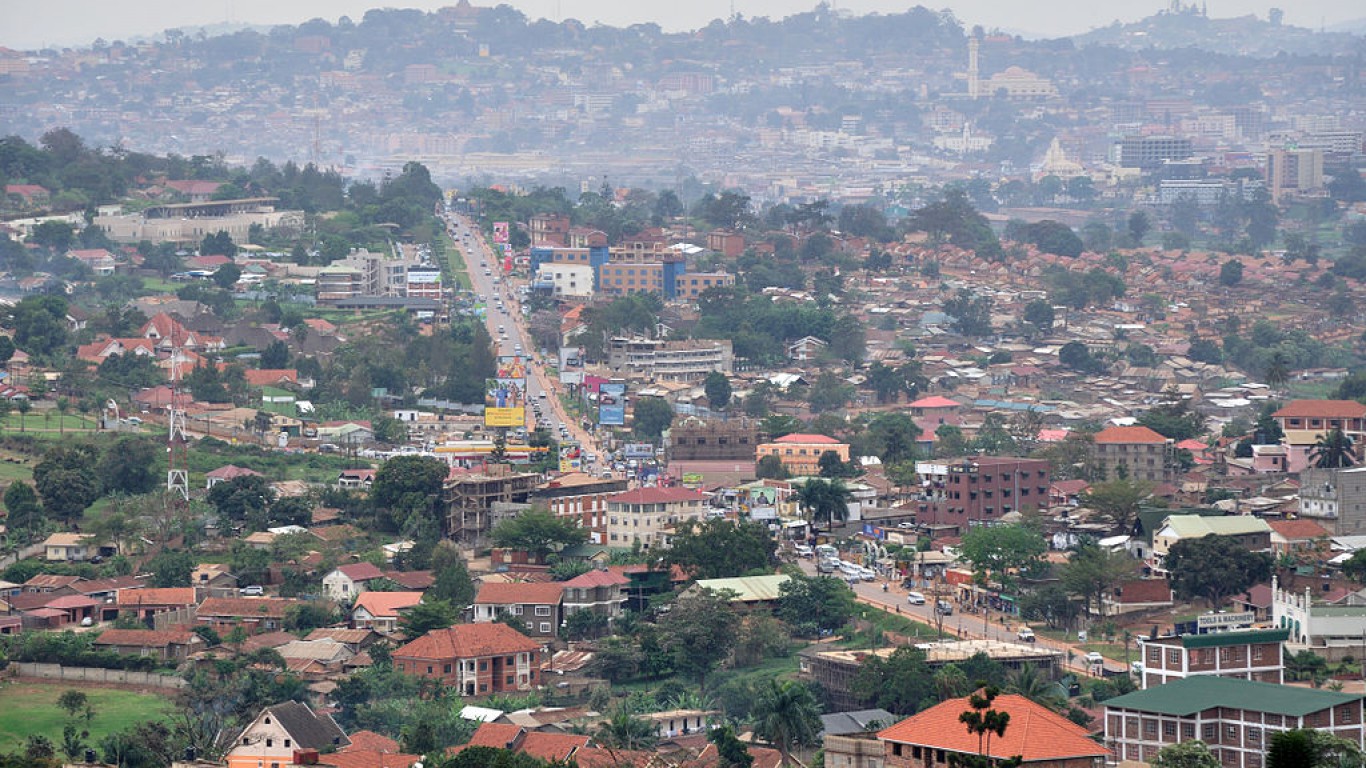
15. Kampala, Uganda
> Population: 1.5 million
> Average annual PM2.5 pollution per cubic meter: 104.0 micrograms
> Average annual PM10 pollution per cubic meter: 170.0 micrograms
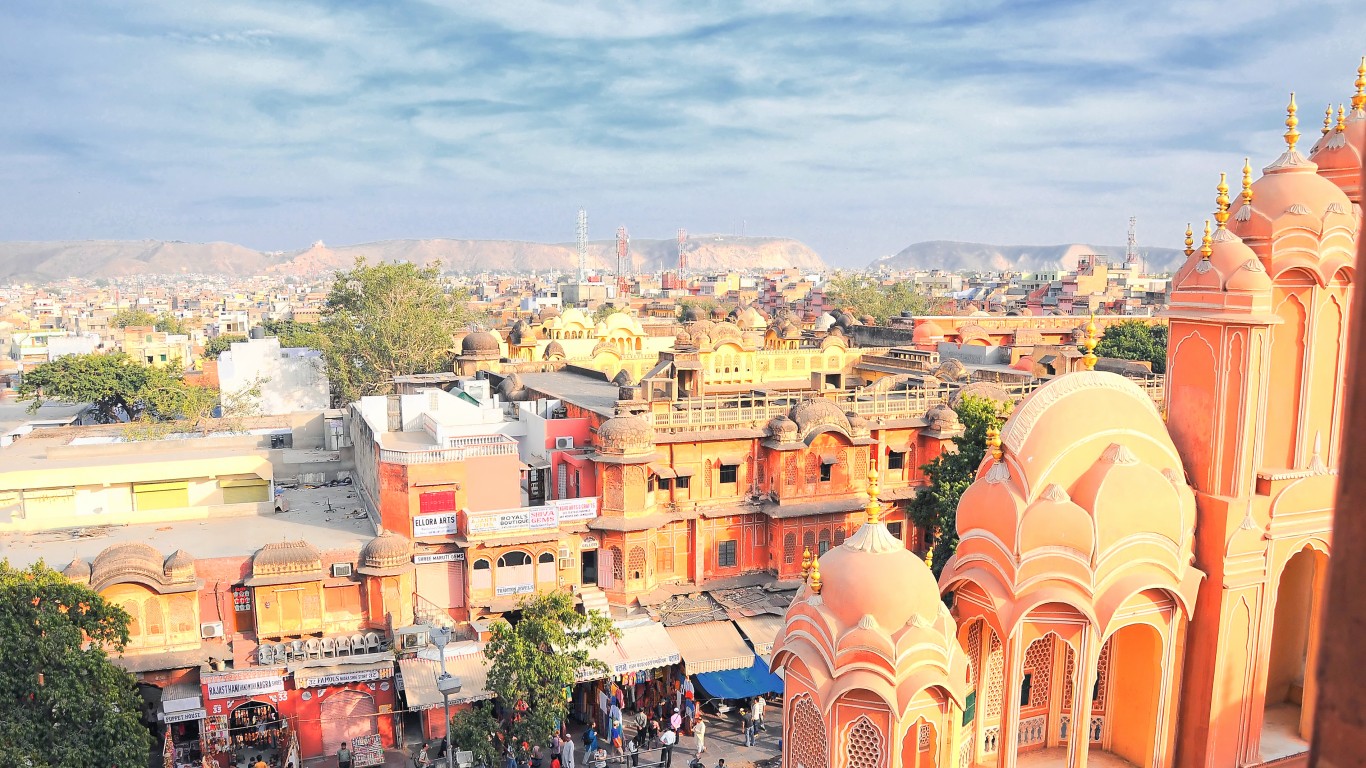
14. Jaipur, West India
> Population: 3.5 million
> Average annual PM2.5 pollution per cubic meter: 104.6 micrograms
> Average annual PM10 pollution per cubic meter: 192.6 micrograms
[in-text-ad]
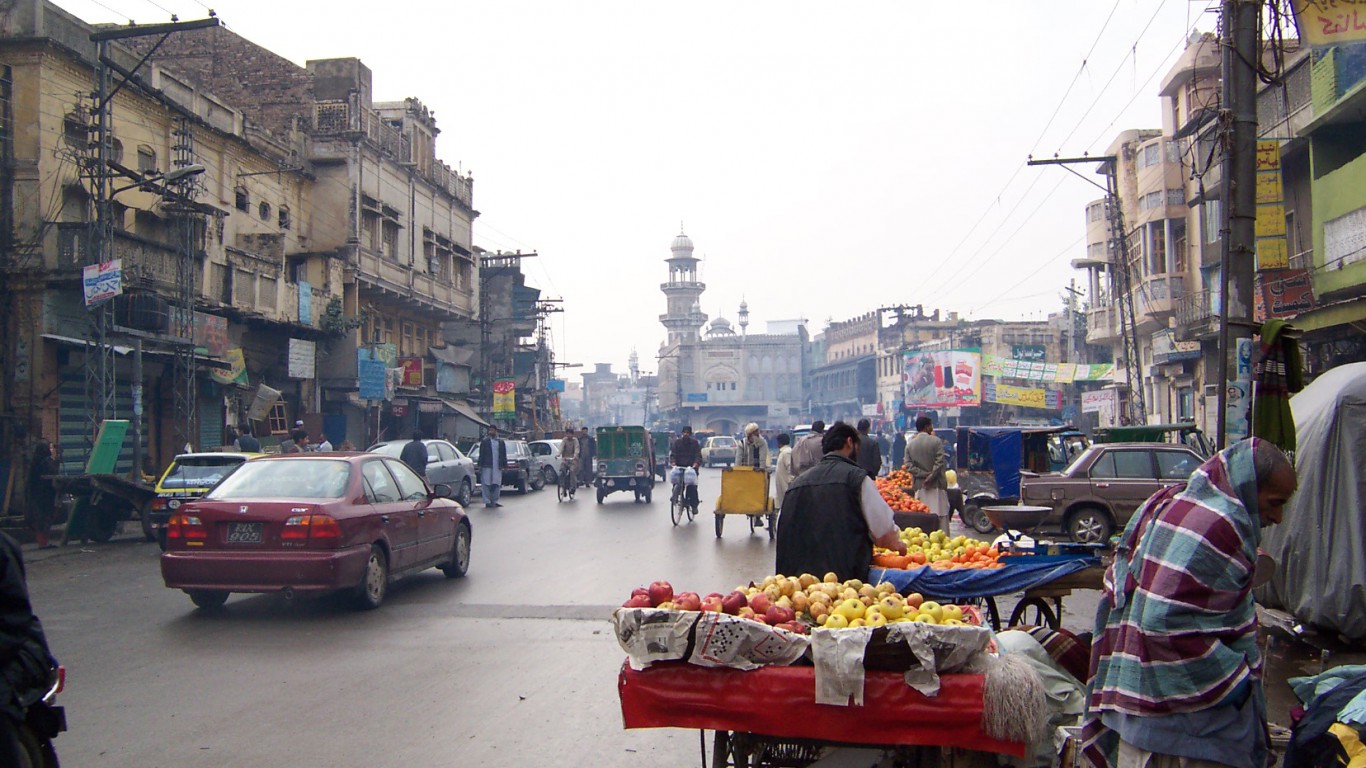
13. Rawalpindi, Pakistan
> Population: 2.1 million
> Average annual PM2.5 pollution per cubic meter: 107.0 micrograms
> Average annual PM10 pollution per cubic meter: 448.0 micrograms

12. Peshawar, Pakistan
> Population: 2.0 million
> Average annual PM2.5 pollution per cubic meter: 111.0 micrograms
> Average annual PM10 pollution per cubic meter: 540.0 micrograms
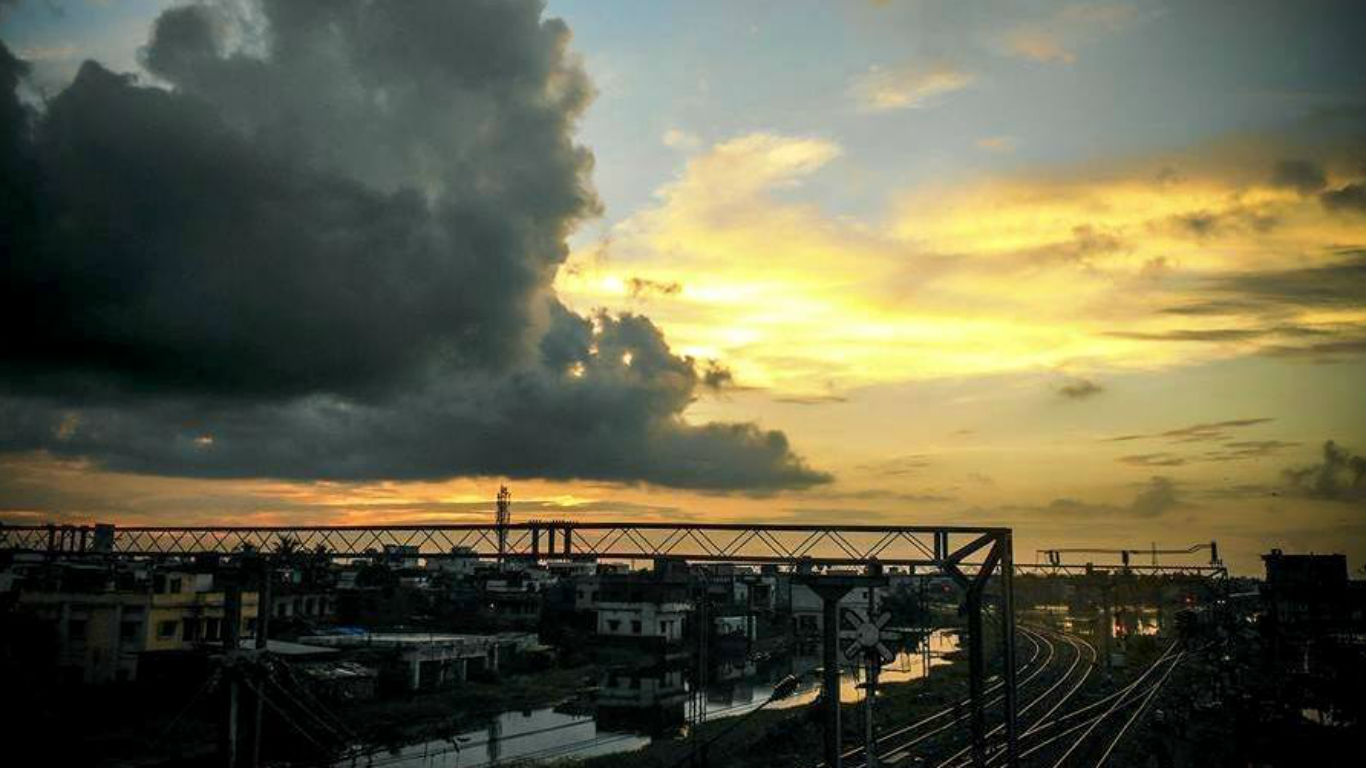
11. Muzaffarpur, East India
> Population: 439,000
> Average annual PM2.5 pollution per cubic meter: 120.0 micrograms
> Average annual PM10 pollution per cubic meter: 220.9 micrograms
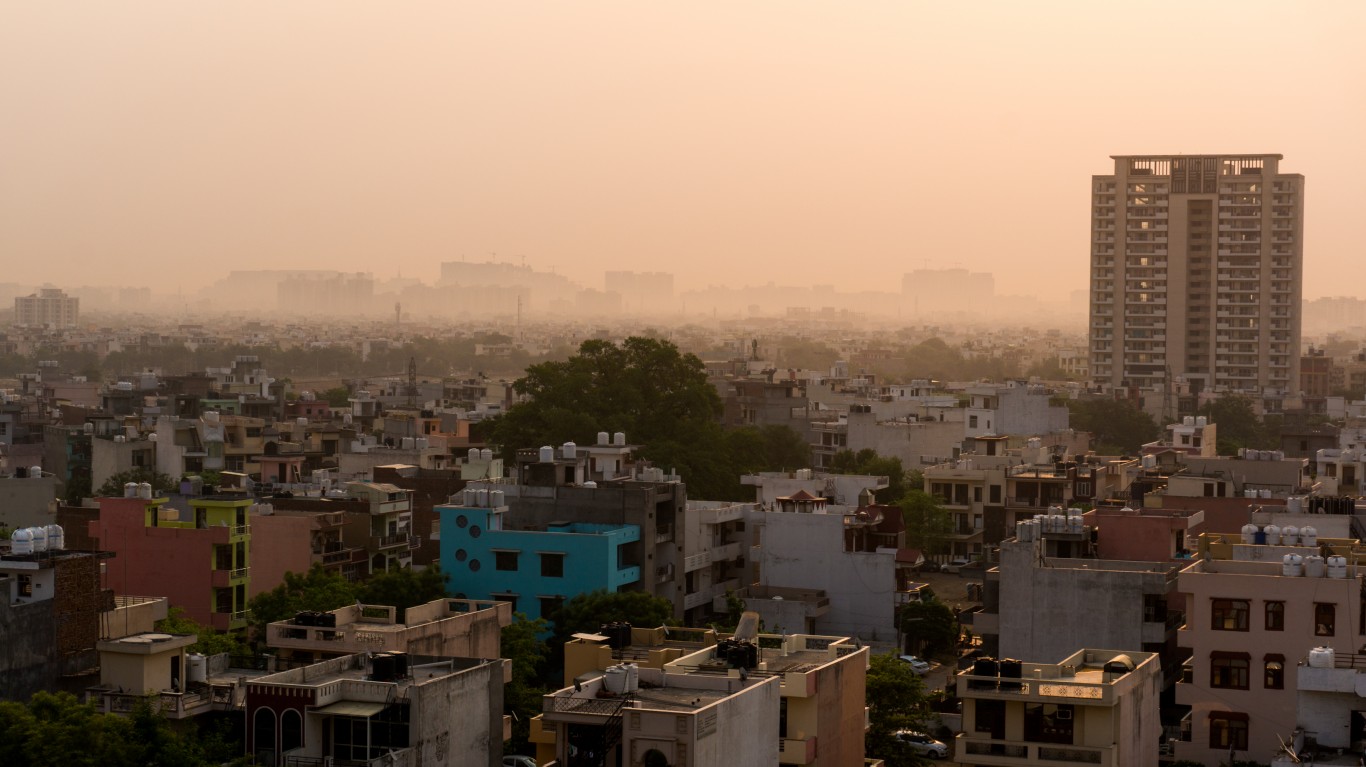
10. Gurgaon, North India
> Population: 902,000
> Average annual PM2.5 pollution per cubic meter: 119.6 micrograms
> Average annual PM10 pollution per cubic meter: 124.3 microgram
[in-text-ad-2]
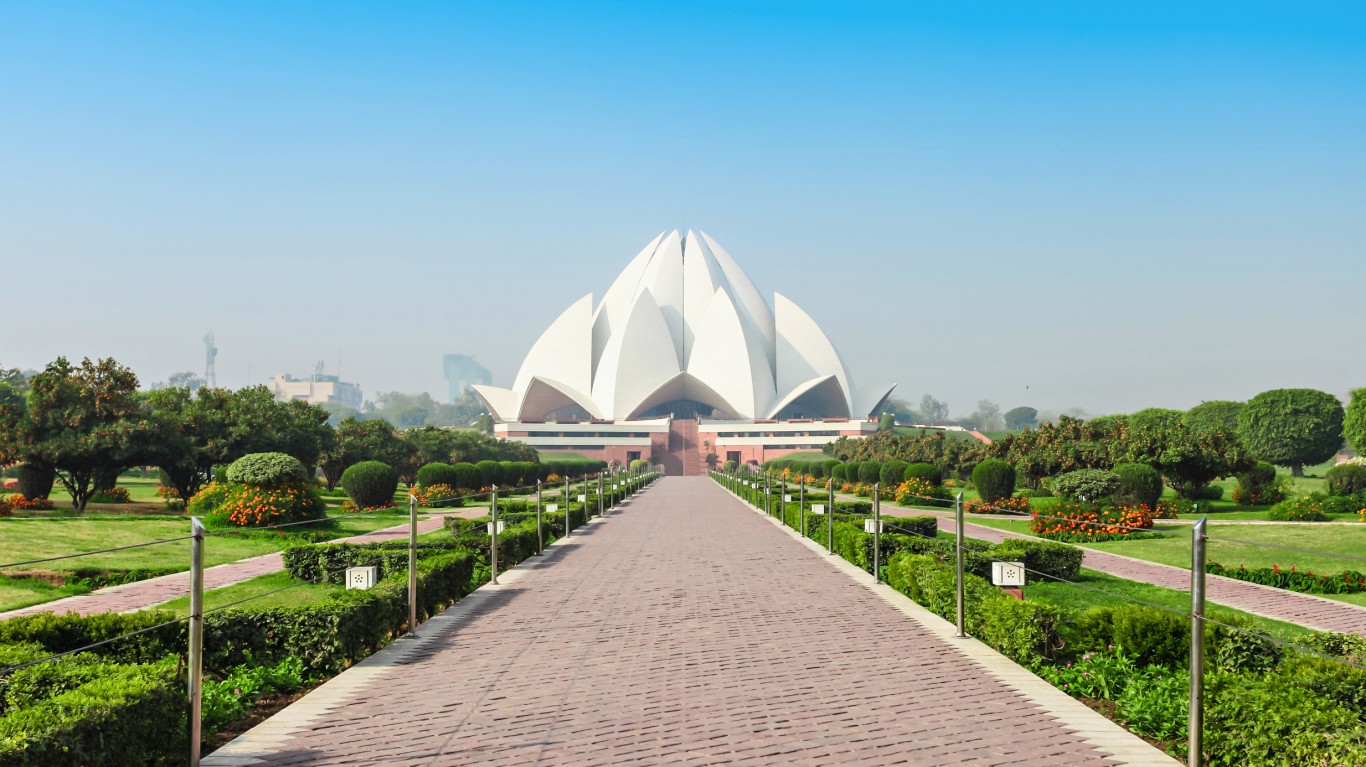
9. Agra, North India
> Population: 2.0 million
> Average annual PM2.5 pollution per cubic meter: 131.4 micrograms
> Average annual PM10 pollution per cubic meter: 194.5 micrograms
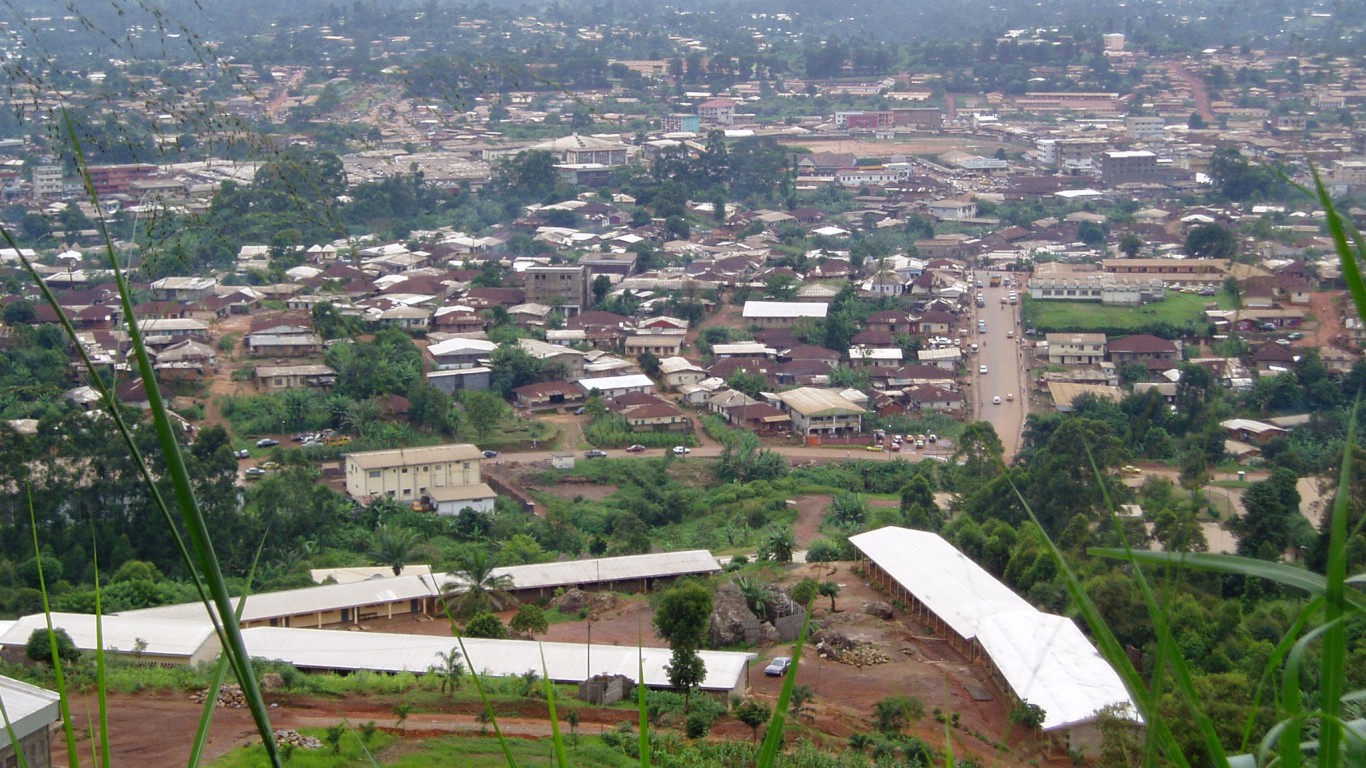
8. Bamenda, Cameroon
> Population: 349,000
> Average annual PM2.5 pollution per cubic meter: 132.0 micrograms
> Average annual PM10 pollution per cubic meter: 141.0 micrograms
> Population: 349,000
> Average annual PM2.5 pollution per cubic meter: 132.0 micrograms
> Average annual PM10 pollution per cubic meter: 141.0 micrograms
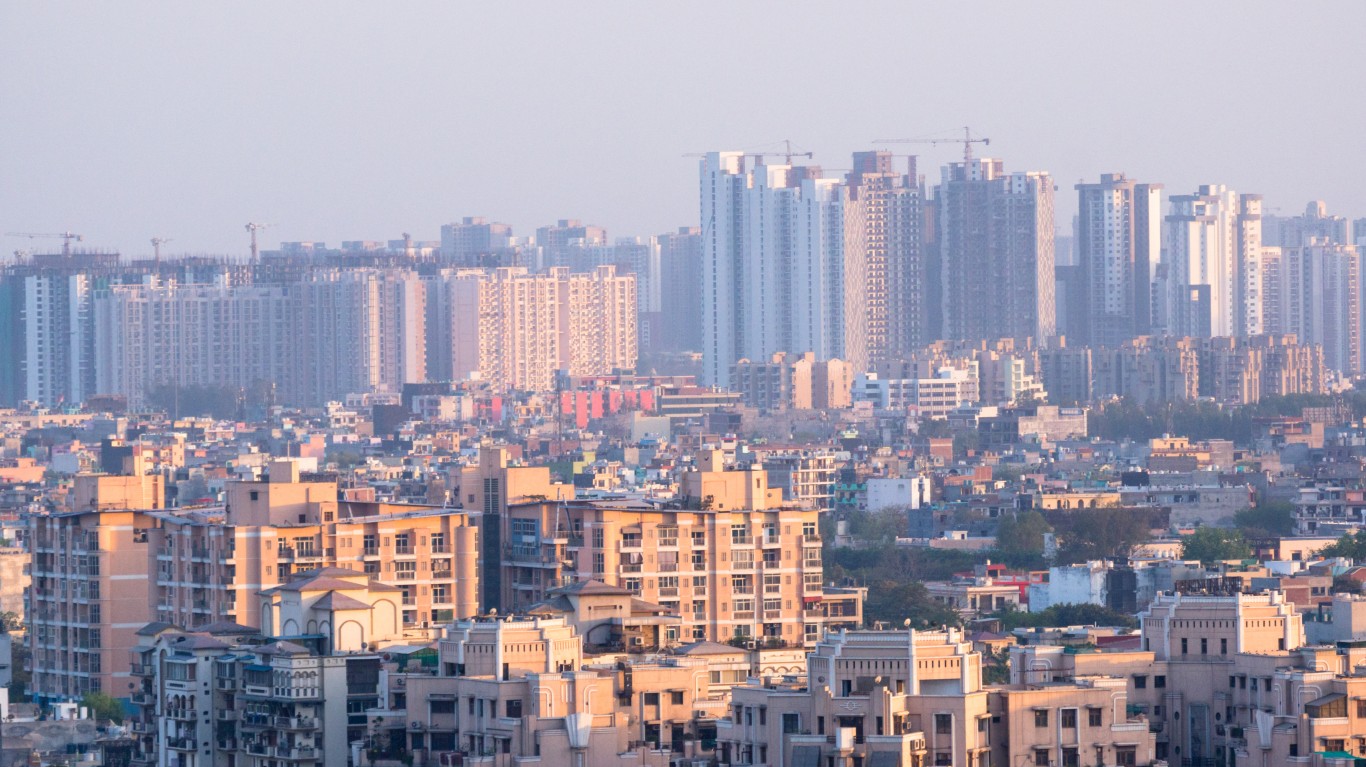
7. Lucknow, North India
> Population: 3.2 million
> Average annual PM2.5 pollution per cubic meter: 138.4 micrograms
> Average annual PM10 pollution per cubic meter: 254.9 micrograms
[in-text-ad]
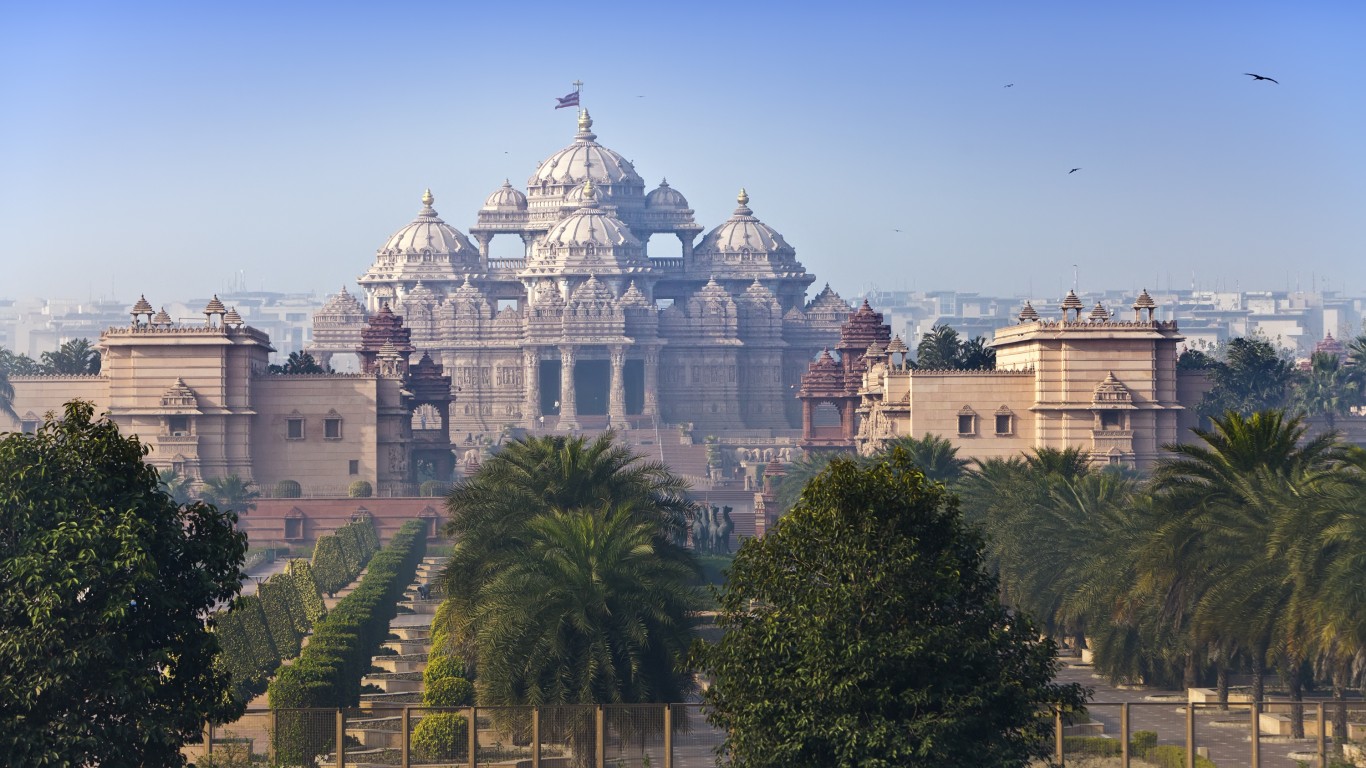
6. Delhi, North India
> Population: 25.7 million
> Average annual PM2.5 pollution per cubic meter: 143.1 micrograms
> Average annual PM10 pollution per cubic meter: 292.3 micrograms
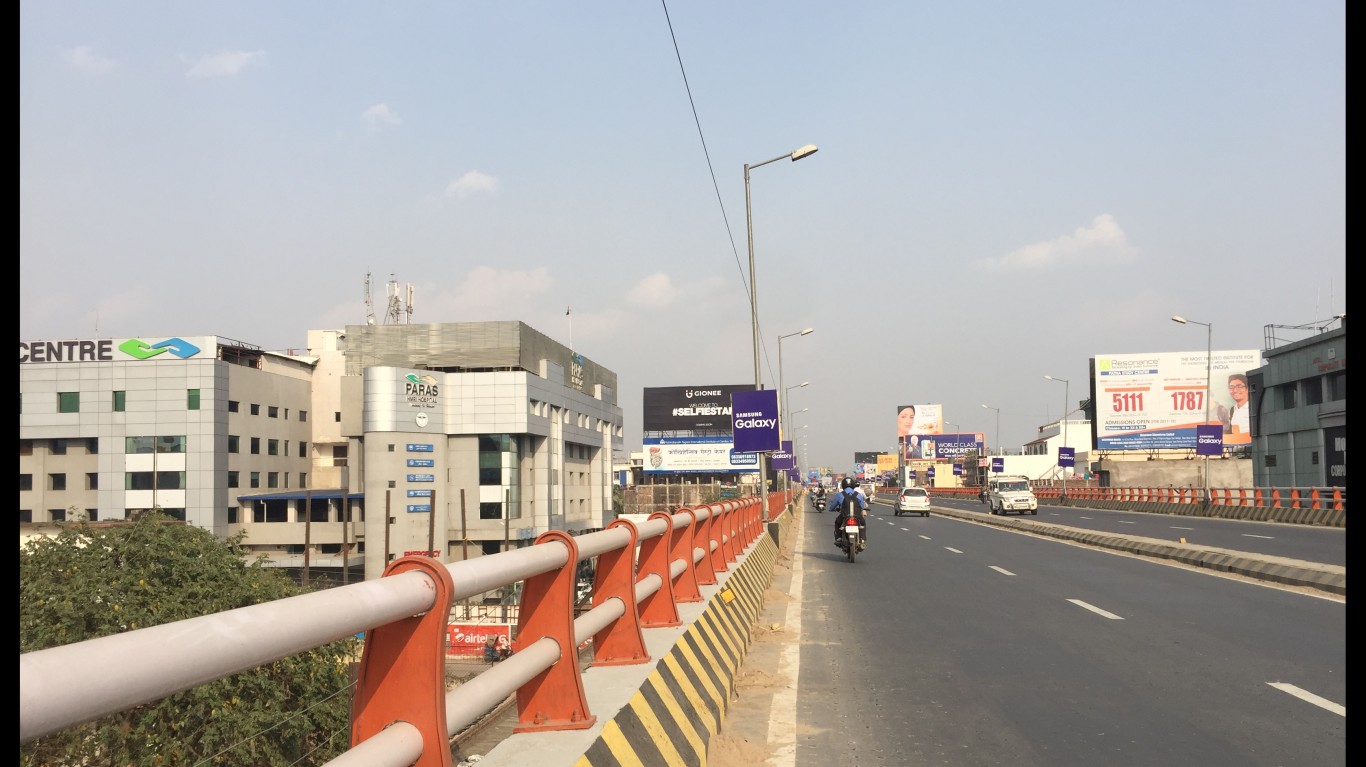
5. Patna, East India
> Population: 2.2 million
> Average annual PM2.5 pollution per cubic meter: 144.3 micrograms
> Average annual PM10 pollution per cubic meter: 265.7 micrograms
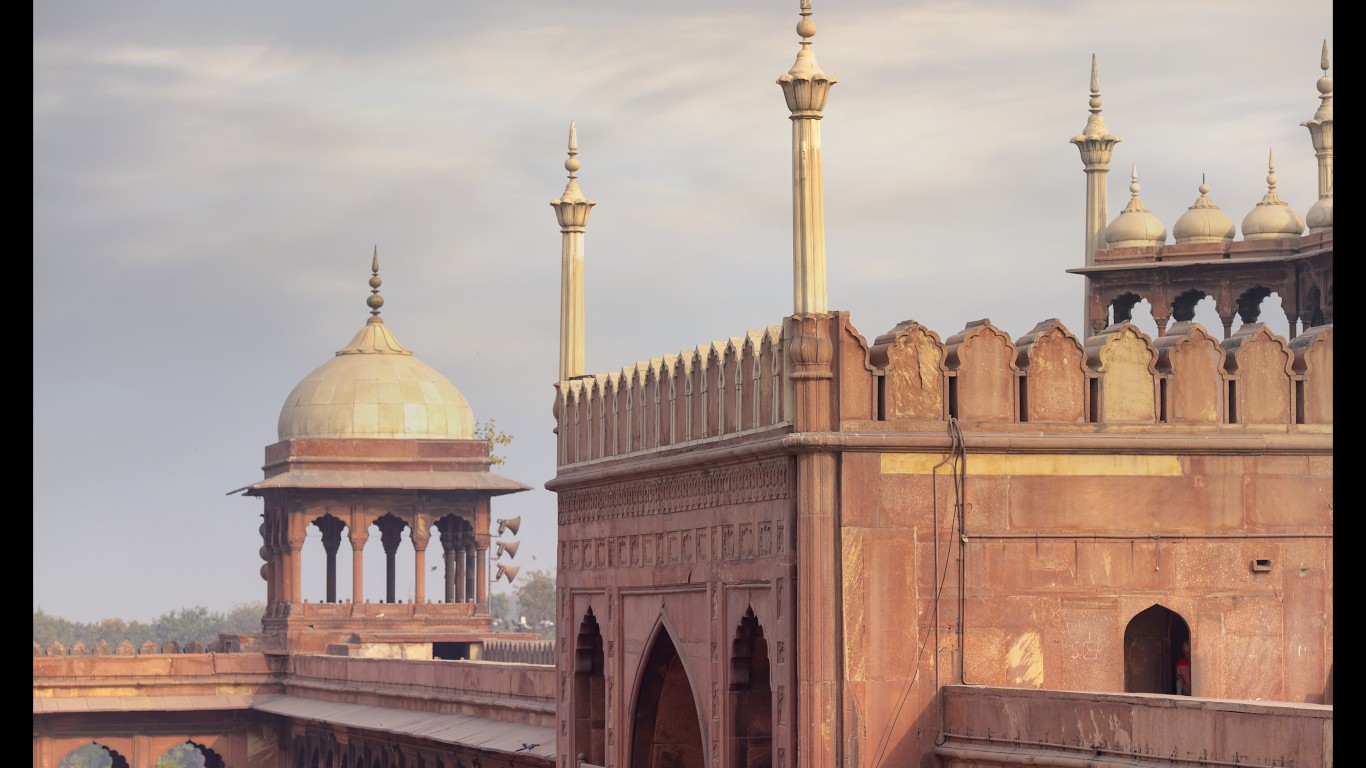
4. Varanasi, North India
> Population: 1.5 million
> Average annual PM2.5 pollution per cubic meter: 146.3 micrograms
> Average annual PM10 pollution per cubic meter: 260.1 micrograms
[in-text-ad-2]
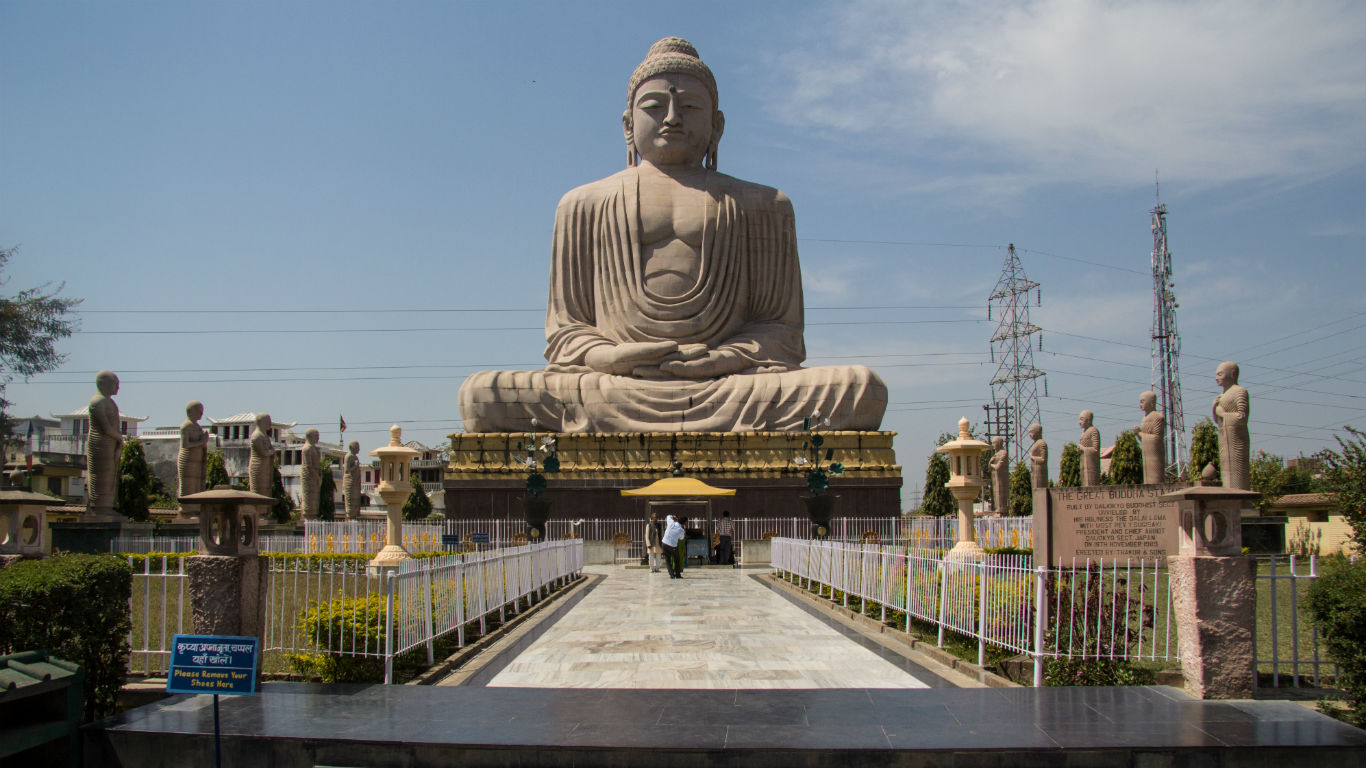
3. Gaya, East India
> Population: 508,000
> Average annual PM2.5 pollution per cubic meter: 149.1 micrograms
> Average annual PM10 pollution per cubic meter: 274.6 micrograms
[in-text-ad]
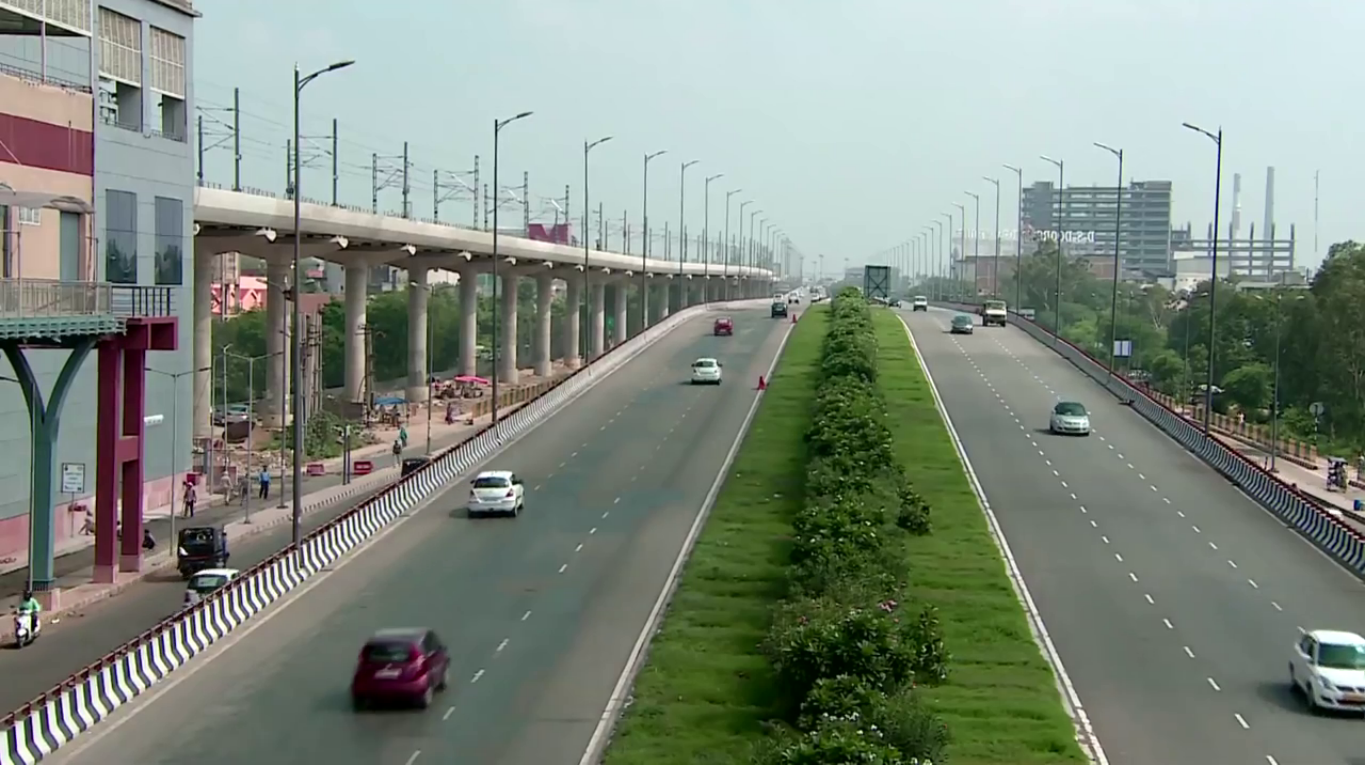
2. Faridabad, North India
> Population: 1.8 million
> Average annual PM2.5 pollution per cubic meter: 171.5 micrograms
> Average annual PM10 pollution per cubic meter: 315.9 micrograms

1. Kanpur, North India
> Population: 3.0 million
> Average annual PM2.5 pollution per cubic meter: 173.0 micrograms
> Average annual PM10 pollution per cubic meter: 318.5 micrograms
The source of PM2.5 pollution is typically combustion, including car engines, power plants, construction projects, fires, and wood burning. Long-term exposure to PM2.5 air pollution has been linked to premature death as well as a number of chronic conditions such as lung disease, reduced lung function, asthma, and heart problems.
Heavy industrialization and rapid growth of developing cities are among the most common causes of high concentrations of air pollution. In some cases, high concentrations of fine particulates in the air are the result of lacking or non-existent public works infrastructure, such as sewage systems.
The vast majority of the cities on this list can be found in either China or India. The high number of cities from the two countries might seem to suggest these nations have especially poor regulations, infrastructure, or industries that tend to pollute — or a combination of these factors.
Addressing environmental issues costs money, and many countries lack the resources necessary to tackle even the most pressing environmental problems. In some nations, the government is simply not making it a priority — these are countries doing the most and least to protect the environment.
Methodology
To identify the most polluted places on Earth, 24/7 Tempo reviewed the most recent measured annual average of PM2.5 for 2,602 cities across the globe. Most recent measure of PM2.5 and PM10 (also whether the figure for PM10 is measured or converted), and the number and type of weather station reporting pollution for each city are from the World Health Organization (WHO) Global Ambient Air Quality Database for 2018. All other data for each country came from the World Bank for the most recent year of data available.
Get Ready To Retire (Sponsored)
Start by taking a quick retirement quiz from SmartAsset that will match you with up to 3 financial advisors that serve your area and beyond in 5 minutes, or less.
Each advisor has been vetted by SmartAsset and is held to a fiduciary standard to act in your best interests.
Here’s how it works:
1. Answer SmartAsset advisor match quiz
2. Review your pre-screened matches at your leisure. Check out the advisors’ profiles.
3. Speak with advisors at no cost to you. Have an introductory call on the phone or introduction in person and choose whom to work with in the future
Thank you for reading! Have some feedback for us?
Contact the 24/7 Wall St. editorial team.
 24/7 Wall St.
 24/7 Wall St.

