Special Report
The Metro Areas With Bigger Economies Than Some Countries

Published:
Last Updated:

As an economic power, the United States is a country without equal. It is home to just 4.3% of the global population, yet it accounts for 23.9% of global economic output, according to data from the World Bank.
Within the United States, economic power tends to be concentrated in major urban areas. For example, just 15 metropolitan areas account for over one-fifth of all economic activity in the country. The economies of these cities are so large that they rival the GDPs of most countries in the world.
Using GDP data from the Bureau of Economic Analysis, 24/7 Wall St. identified the 15 metro areas with economies bigger than some countries’ economies. After selecting the 15 metropolitan areas with the largest economies, we matched each with a country with a similar GDP based on purchasing power parity — a measure which accounts for living expenses — using data from the World Bank. It is important to note that the GDP of the country listed is a close match with the corresponding city but is not always smaller. However, every metro area on this list has a larger economy than most countries in the world.
Every city on this list has a relatively diverse and complex economy and is home to a range of industries. Still, these metro area economies are also often dominated by a single sector. In most of these metropolitan areas, finance, insurance, real estate, rental, and leasing is the largest industry. In other cases, manufacturing, or information, or professional business services ranks as the top industry. Often, the economic output of the largest industry in these places is greater than the GDP of many countries. These are America’s 25 thriving industries.
The economic strength of the metro areas on this list is partially attributable to the presence of major companies. Many of these metro areas are home to the headquarters of Fortune 500 companies that are critical to the economic vitality of their home city and surrounding areas. Here is a state by state look at the largest company by total employment.
Click here to see the metro areas with bigger economies than some countries
Click here to read our methodology

15. Minneapolis-St. Paul-Bloomington, MN-WI
> GDP: $237.1 billion
> Population: 3.6 million
> Largest industry: Finance, insurance, real estate, rental, and leasing
> Median household income: $79,578
> Country with similar size economy: Finland
The Twin Cities metro area, which spans parts of Minnesota and Wisconsin, has a $237.1 billion economy. The finance and insurance sector accounts for the largest share of the metro area’s economic output, followed by professional and business services and manufacturing.
Though the metro area is home to only about 3.6 million people, its economy is larger than that of Finland, which is home to 5.5 million people. Finland’s 2018 GDP in purchasing power parity, or PPP, was $232.0 billion.
[in-text-ad]

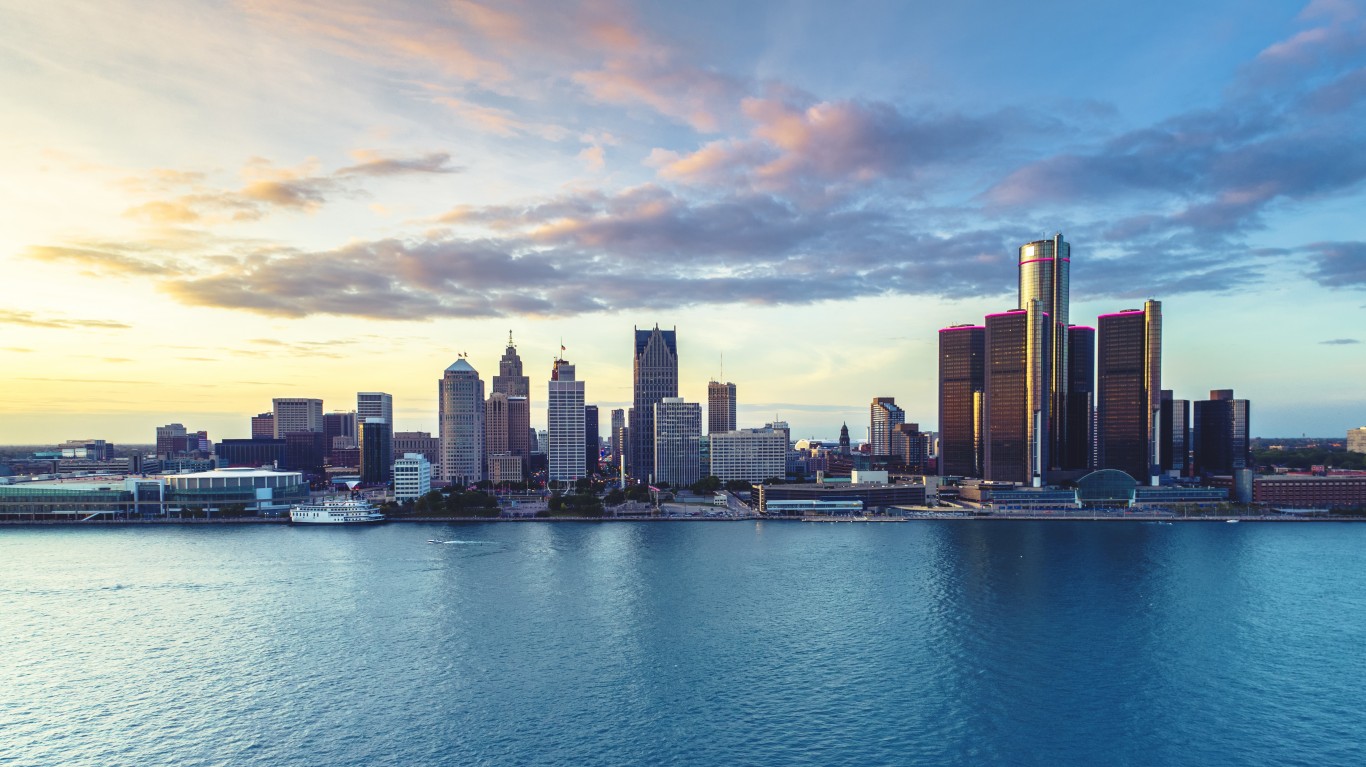
14. Detroit-Warren-Dearborn, MI
> GDP: $238.7 billion
> Population: 4.3 million
> Largest industry: Manufacturing
> Median household income: $60,513
> Country with similar size economy: Uzbekistan
Though the Detroit metro area is a shadow of the economic powerhouse it once was during the height of the U.S. auto industry, it still has one of the largest economies of any U.S. metro area and one that rivals that of many countries worldwide. Still driven primarily by the manufacturing industry, Detroit’s 2018 GDP was $238.7 billion, larger than the majority of countries world wide.
For reference, Uzbekistan’s $250.2 GDP, adjusted for cost of living, is slightly larger than Detroit’s GDP. However, with a population of nearly 33 million, Uzbekistan is more than seven times larger than the Detroit metro area and its 4.3 million residents.

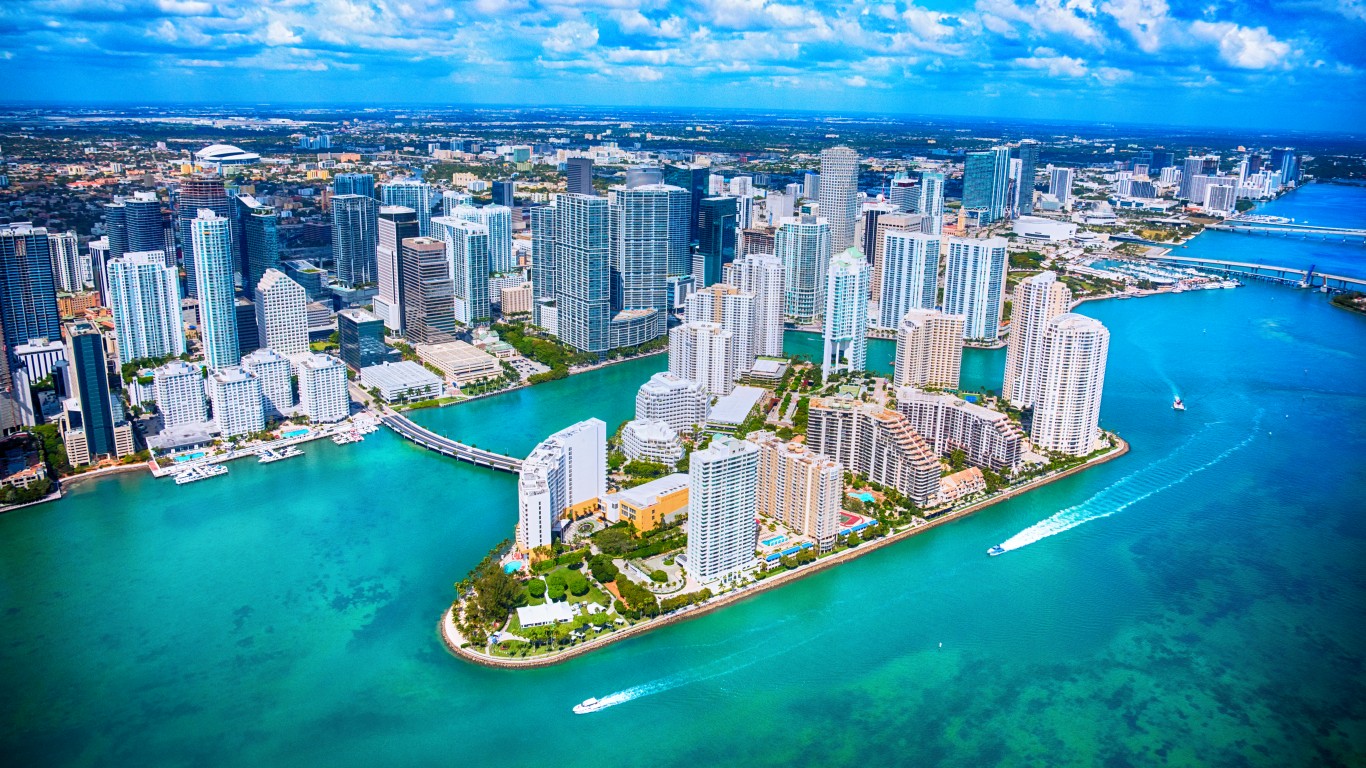
13. Miami-Fort Lauderdale-Pompano Beach, FL
> GDP: $315.0 billion
> Population: 6.2 million
> Largest industry: Finance, insurance, real estate, rental, and leasing
> Median household income: $56,328
> Country with similar size economy: Qatar
Miami has a $315 billion economy — the largest of any Florida metro area and larger than that of most countries in the world. For example, Qatar, a resource-rich country that controls about 1.5% of the world’s proved oil reserves, has a GDP PPP of $313.2 billion.
Like most of the metro areas on this list, Miami’s economy is driven by the finance, insurance, real estate, rental, and leasing sector. Professional and business services as well as wholesale trade are also major economic drivers in Miami.

12. San Jose-Sunnyvale-Santa Clara, CA
> GDP: $319.0 billion
> Population: 2.0 million
> Largest industry: Information
> Median household income: $124,696
> Country with similar size economy: Myanmar
Home to Silicon Valley, San Jose-Sunnyvale-Santa Clara has one of the largest economies in both the United States and the world. The area, a global technology hub, has a GDP of $319 billion, roughly in line with the GDP PPP of Myanmar, a country with a population nearly 27 times larger.
With a far larger economy than the economies of other cities and countries home to many more millions of people, the San Jose metro area is a relatively wealthy place. The income of the typical household in the area is $124,696 a year, the highest of any U.S. metro area and more than double the national median household income of $61,937.
[in-text-ad-2]

11. Seattle-Tacoma-Bellevue, WA
> GDP: $355.7 billion
> Population: 3.9 million
> Largest industry: Information
> Median household income: $87,910
> Country with similar size economy: Norway
Home to technology giant Microsoft, the Seattle-Tacoma-Bellevue metro area has an economy driven primarily by the information sector. Seattle’s economic output of $355.7 billion in 2018 is about $8 billion more than the purchase power parity GDP of Norway, a country home to nearly 1.5 million more people.
With an economy far larger than other cities and countries that are far more populous, the Seattle metro area is relatively wealthy. The income of the typical household in the area is $87,910 a year, well above the national median household income of $61,937.

10. Atlanta-Sandy Springs-Alpharetta, GA
> GDP: $357.3 billion
> Population: 6.0 million
> Largest industry: Finance, insurance, real estate, rental, and leasing
> Median household income: $69,464
> Country with similar size economy: Czech Republic
Atlanta had a GDP of $357.3 billion in 2018, in line with the cost of living adjusted GDP of the Czech Republic — a country home to nearly twice as many people. Like most metro areas on this list, Atlanta’s largest sector by economic output is finance, insurance, real estate, rental, and leasing. The professional and business services and information sectors are also substantial economic drivers in the metro area.
[in-text-ad]

9. Philadelphia-Camden-Wilmington, PA-NJ-DE-MD
> GDP: $398.7 billion
> Population: 6.1 million
> Largest industry: Finance, insurance, real estate, rental, and leasing
> Median household income: $70,747
> Country with similar size economy: Peru
Philadelphia generated $398.7 billion in economic output in 2018, nearly in line with the cost of living adjusted GDP of Peru, a country of over 30 million people. The largest sector by contribution to GDP in the Philadelphia metro area is finance, insurance, real estate, rental, and leasing. This sector alone accounted for $85.3 billion in economic activity — about as much as the entire economy of Lithuania.

8. Boston-Cambridge-Newton, MA-NH
> GDP: $412.9 billion
> Population: 4.9 million
> Largest industry: Professional and business services
> Median household income: $88,711
> Country with similar size economy: Austria
The Boston metro area’s $412.9 billion economy is driven primarily by the professional and business services sector. The metro area, which is home to fewer than 5 million people, has an economy slightly larger than that of Austria, a country of 8.8 million people. Boston’s professional and business services sector alone generated $88.5 billion in 2018, more than the entire national economies of Estonia and Georgia combined.

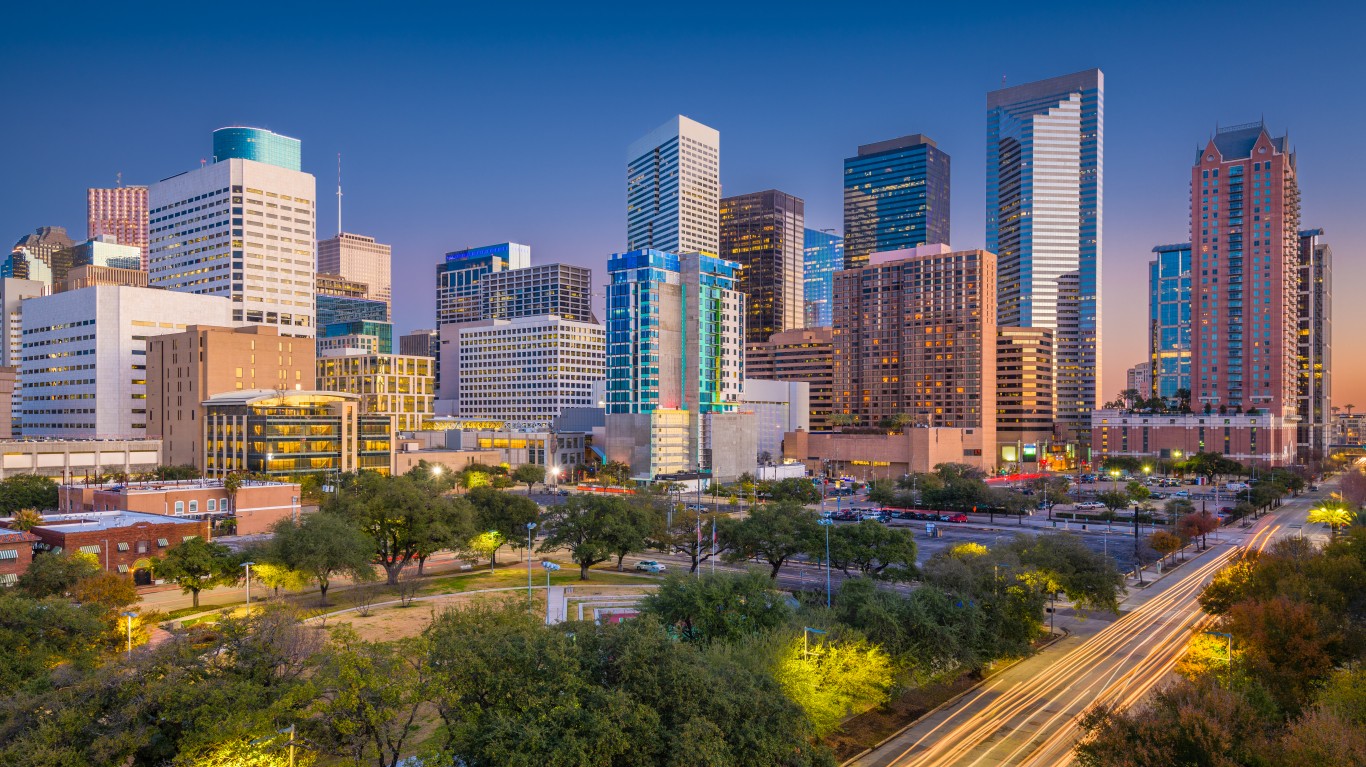
7. Houston-The Woodlands-Sugar Land, TX
> GDP: $445.3 billion
> Population: 7.0 million
> Largest industry: Manufacturing
> Median household income: $65,394
> Country with similar size economy: Kazakhstan
With a population of about 7 million, Houston is one of the largest metro areas in the United States. Houston’s $445.3 billion economy is also larger than that of most countries. Along with Detroit, Houston is one of only two metro areas on this list where manufacturing is the largest sector. Manufacturing alone generated $82.2 billion in Houston in 2018. Professional and business services and finance, insurance, real estate, rental, and leasing are also major economic drivers in the Texas metro area.
[in-text-ad-2]

6. Dallas-Fort Worth-Arlington, TX
> GDP: $468.9 billion
> Population: 7.5 million
> Largest industry: Finance, insurance, real estate, rental, and leasing
> Median household income: $69,445
> Country with similar size economy: Chile
Dallas-Fort Worth has the largest economy of any metro area in Texas. The area is home to two dozen Fortune 500 companies, including the headquarters of Exxon Mobil, AT&T, and American Airlines. The metro area’s $468.9 billion economy exceeds the GDP PPP of Chile — a country with a population 2.5 times larger — by over $40 billion.
The largest industry in Dallas is finance, insurance, real estate, rental, and leasing, followed by manufacturing.
5. Washington-Arlington-Alexandria, DC-VA-MD-WV
> GDP: $484.8 billion
> Population: 6.3 million
> Largest industry: Finance, insurance, real estate, rental, and leasing
> Median household income: $102,180
> Country with similar size economy: Sweden
The metro area around the nation’s capital generated $484.8 billion in economic output in 2018, nearly in line with the GDP of Sweden. Washington D.C.’s finance, insurance, real estate, rental, and leasing sector alone generated $83.3 billion, more than the entire economy of the Middle Eastern country of Lebanon. Major employers in the area include government contractors such as Lockheed Martin, Northrop Grumman, and General Dynamics.
Washington D.C. is also one of the wealthiest cities in the United States. The income of the typical metro area household is $102,180 a year, well above the national median household income of $61,937.
[in-text-ad]
4. San Francisco-Oakland-Berkeley, CA
> GDP: $497.2 billion
> Population: 4.7 million
> Largest industry: Professional and business services
> Median household income: $107,898
> Country with similar size economy: Belgium
San Francisco has a nearly half a trillion dollar economy — fourth largest among U.S. metro areas and more than most countries in the world. Though it is home to fewer than 5 million people, the metro area’s economy is similar in size to the economy of Belgium, a country with a population more than double that of San Francisco.
The San Francisco metro area is home to the headquarters of several Fortune 500 companies, including financial giants Visa and Wells Fargo. Like nearly every other city on this list, San Francisco is a wealthy place. The median household income in the metro area of $107,898 is far higher than the national median income of $61,937.

3. Chicago-Naperville-Elgin, IL-IN-WI
> GDP: $611.6 billion
> Population: 9.5 million
> Largest industry: Finance, insurance, real estate, rental, and leasing
> Median household income: $70,760
> Country with similar size economy: Bangladesh
Chicago is one of only three U.S. metro areas with a GDP of over half a trillion dollars. The metro area of 9.5 million has a $611.6 billion economy, only about $14 billion smaller than the cost of living adjusted GDP of Bangladesh — a country with a population of 161.4 million.
As is often the case among the metro areas on this list, Chicago’s largest sector by economic output is finance, insurance, real estate, rental, and leasing. This industry alone generated $127.1 billion in 2018, about $15 billion more than the entire economy of Puerto Rico.

2. Los Angeles-Long Beach-Anaheim, CA
> GDP: $941.1 billion
> Population: 13.3 million
> Largest industry: Finance, insurance, real estate, rental, and leasing
> Median household income: $72,563
> Country with similar size economy: Malaysia
Los Angeles has the second largest population and second largest economy of any U.S. metro area. Home to 13.3 million, LA’s economic output topped $941 billion in 2018. For reference, the southeast Asian country of Malaysia, home to 31.5 million people, has a cost of living adjusted $889.1 billion GDP.
LA’s economy is driven in large part by the finance, insurance, real estate, rental, and leasing sector in addition to professional and business services and manufacturing.
[in-text-ad-2]

1. New York-Newark-Jersey City, NY-NJ-PA
> GDP: $1.5 trillion
> Population: 20.0 million
> Largest industry: Finance, insurance, real estate, rental, and leasing
> Median household income: $78,478
> Country with similar size economy: Iran
Home to about 20 million people, New York is the largest metro area in the United States. And with a GDP of $1.5 trillion, it also has the largest economy of any metro area in the country. New York’s economy is roughly the same size as Iran’s economy and nearly as large as the economy of Spain. In New York, the finance, insurance, real estate, rental, and leasing sector generated $444.0 billion in economic output in 2018 alone, more than the entire economy of Hong Kong or Chile.
Methodology:
To determine the U.S. metro areas with bigger economies than some countries, 24/7 Wall St. reviewed real GDP data for 384 metropolitan statistical areas and 194 countries. Data on real GDP for metropolitan areas in 2018 came from the Bureau of Economic Analysis and is in 2012 chained dollars. Data on real GDP by country in 2018 came from the World Bank is based on purchasing power parity and is in constant 2011 international dollars.
Nominal GDP uses market exchange rates to set the nation’s GDP — the value of all goods and services produced in a country. GDP on a PPP basis takes into account cost of living differences, and is favored by many economists for more accurately capturing quality of life. For developed countries, the differences between the two measures tend to be smaller. For developing economies, the differences tend to be larger, and most often, PPP is higher than nominal GDP.
We also reviewed economic output by industry in each metro area to identify the largest industry. GDP by industry at the metro area level came from the BEA and is for 2018.
Data on MSA population and median household income for 2018 came from the U.S. Census Bureau’s American Community Survey. Country population came from the World Bank. All data are for the most recent period available.
Start by taking a quick retirement quiz from SmartAsset that will match you with up to 3 financial advisors that serve your area and beyond in 5 minutes, or less.
Each advisor has been vetted by SmartAsset and is held to a fiduciary standard to act in your best interests.
Here’s how it works:
1. Answer SmartAsset advisor match quiz
2. Review your pre-screened matches at your leisure. Check out the advisors’ profiles.
3. Speak with advisors at no cost to you. Have an introductory call on the phone or introduction in person and choose whom to work with in the future
Get started right here.
Thank you for reading! Have some feedback for us?
Contact the 24/7 Wall St. editorial team.