Special Report
Most Affordable Colleges With Best Outcomes in Every State

Published:
Last Updated:

Student loan debt, the second largest consumer debt category in the United States after home mortgages, hit an all time high of $1.4 trillion in 2019. The financial burden posed by outstanding student loans is largely due to climbing tuition costs.
In the 1999-2000 academic year, the average annual cost of attending a four-year institution was $33,060 at private schools and $12,440 at public schools. As of 2019, average costs hit $49,870 at private schools and $21,950 at public schools, a 51% and 76% increase, respectively.
While the growing student debt crisis is contributing to annual declines in college enrollment, a four-year college education does not have to mean a lifetime of paying off student loans. Across the country, there are schools with relatively low tuition costs, where graduates typically go on to secure well-paying jobs upon graduation.
Using data from the from the U.S. Department of Education, 24/7 Wall St. reviewed a range of data at over 6,000 colleges and universities, including tuition costs, graduate employment rates, student debt repayment, and median salaries after enrollment, to identify the most affordable colleges with the best outcomes in every state.
Public schools tend to have lower tuition and therefore more affordable to a broader range of prospective students than private schools, and not surprisingly, the majority of institutions on this list are public. Additionally, most of the schools on this list are not especially selective. Of the 50 schools on this list, only a handful admit fewer than half of all applicants. Here is a look at the hardest colleges to get into.
Of course, while deciding on which school to attend can have an impact on employment and salary prospects in future years, choosing a school may not be as impactful as choosing a field of study. The median salary for majors in some fields is as much as four times higher as the median salary for those who major in other subjects. Here is a list of the highest — and lowest — paying college majors in America.
Click here to see the most affordable colleges with the best outcomes in every state
Click here to read our methodology
Editor’s note: In a previous version of this article, the images used for Ohio, Tennessee, and Washington did not depict the school listed for that state. The error has been corrected.
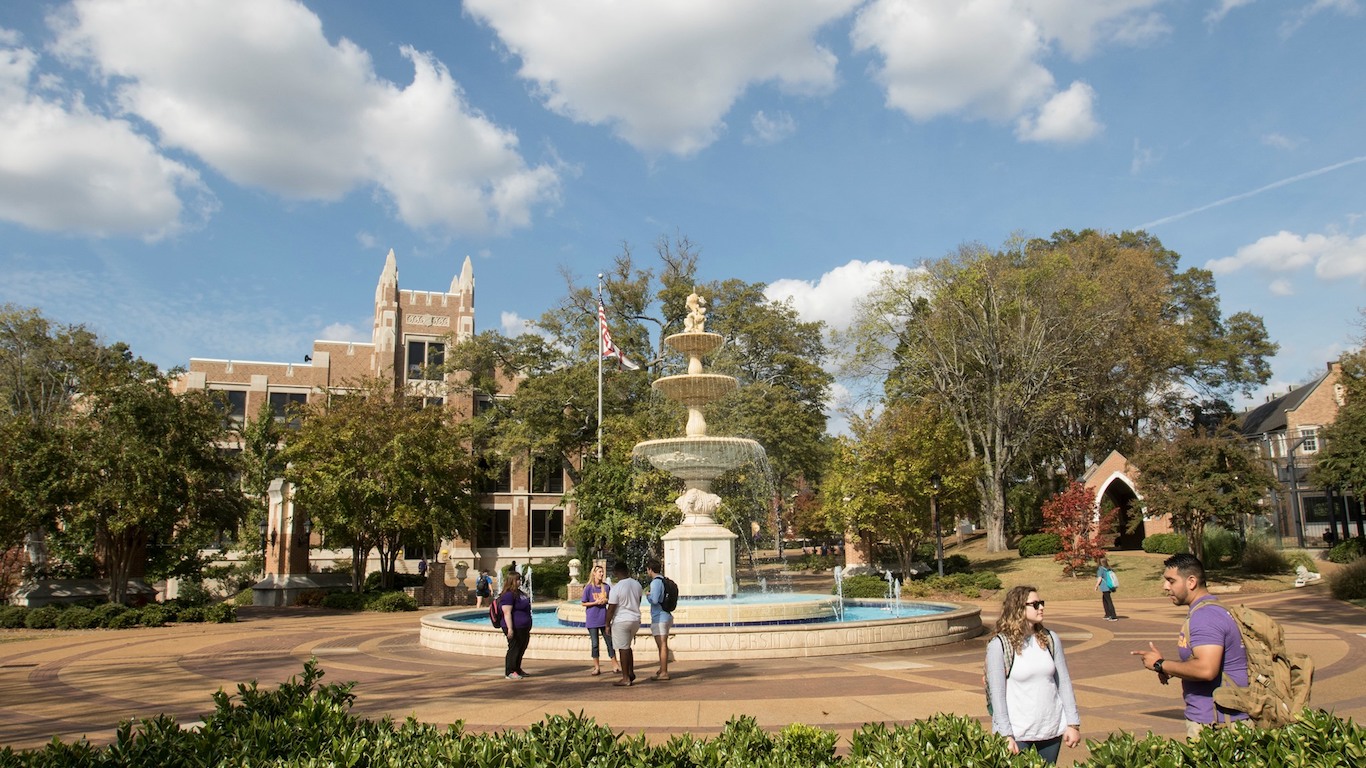
1. Alabama: University of North Alabama
> City: Florence
> Acceptance rate: 70.2%
> Undergraduate enrollment: 5,771
> Avg. annual cost of attendance: $18,223
> Employment rate 10 yrs. after enrollment: 86.0%
> Typical earnings 10 yrs. after enrollment: $37,800
[in-text-ad]
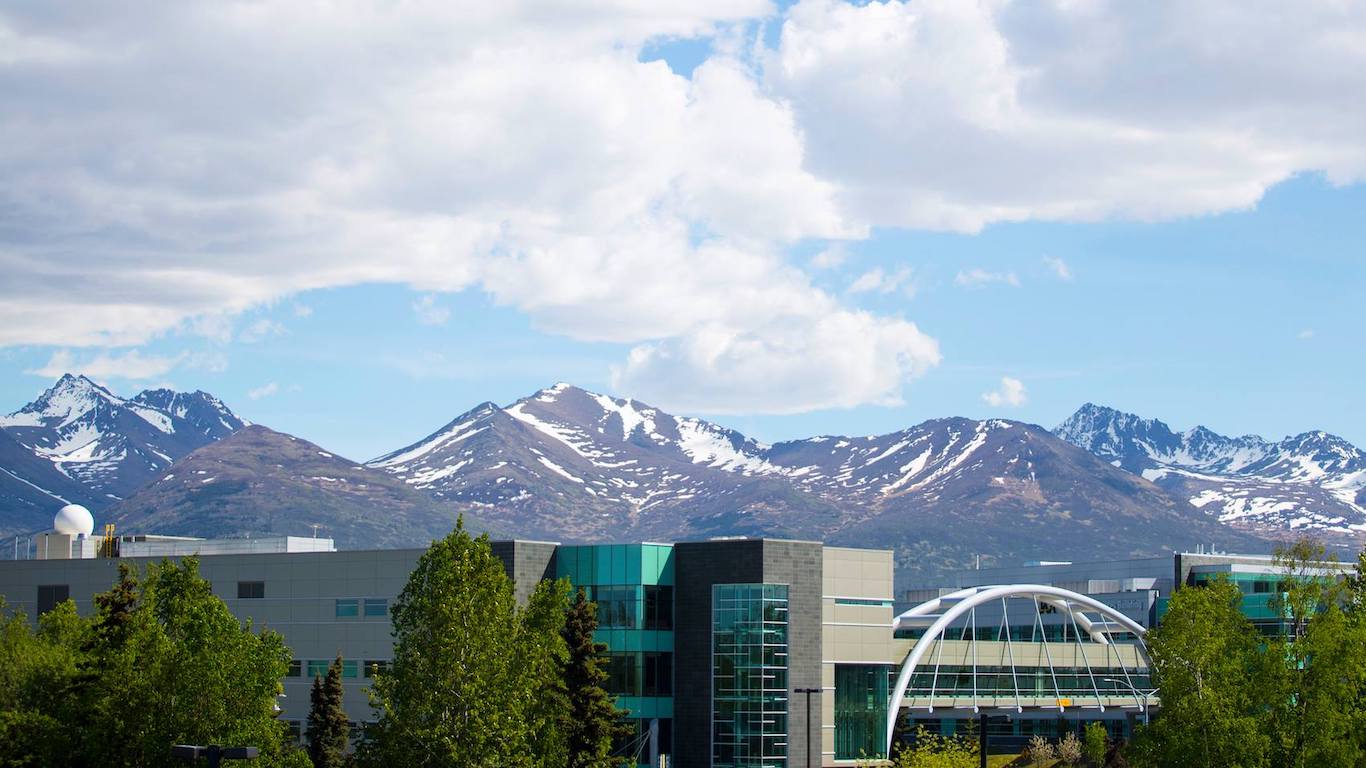
2. Alaska: University of Alaska Anchorage
> City: Anchorage
> Acceptance rate: 82.8%
> Undergraduate enrollment: 11,332
> Avg. annual cost of attendance: $19,126
> Employment rate 10 yrs. after enrollment: 83.4%
> Typical earnings 10 yrs. after enrollment: $45,400
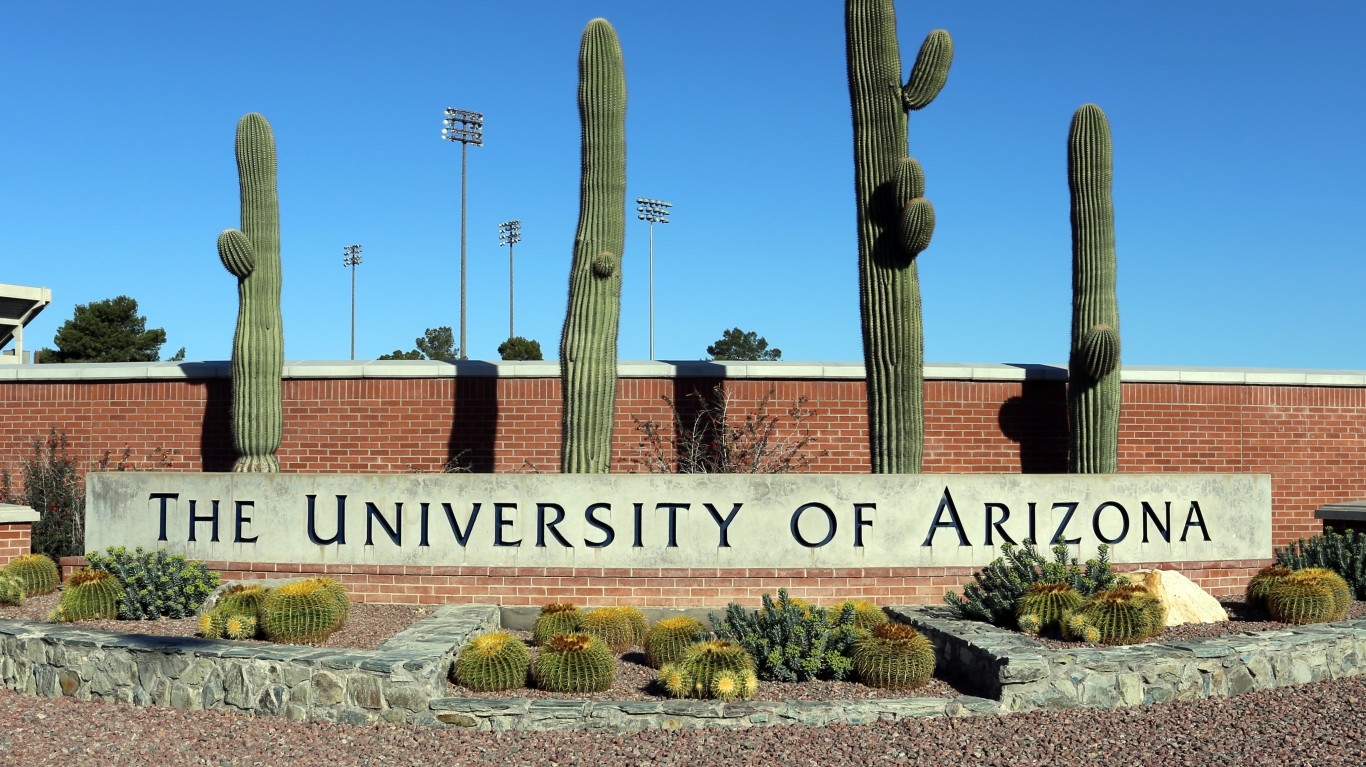
3. Arizona: University of Arizona
> City: Tucson
> Acceptance rate: 83.6%
> Undergraduate enrollment: 33,428
> Avg. annual cost of attendance: $26,157
> Employment rate 10 yrs. after enrollment: 88.9%
> Typical earnings 10 yrs. after enrollment: $47,300
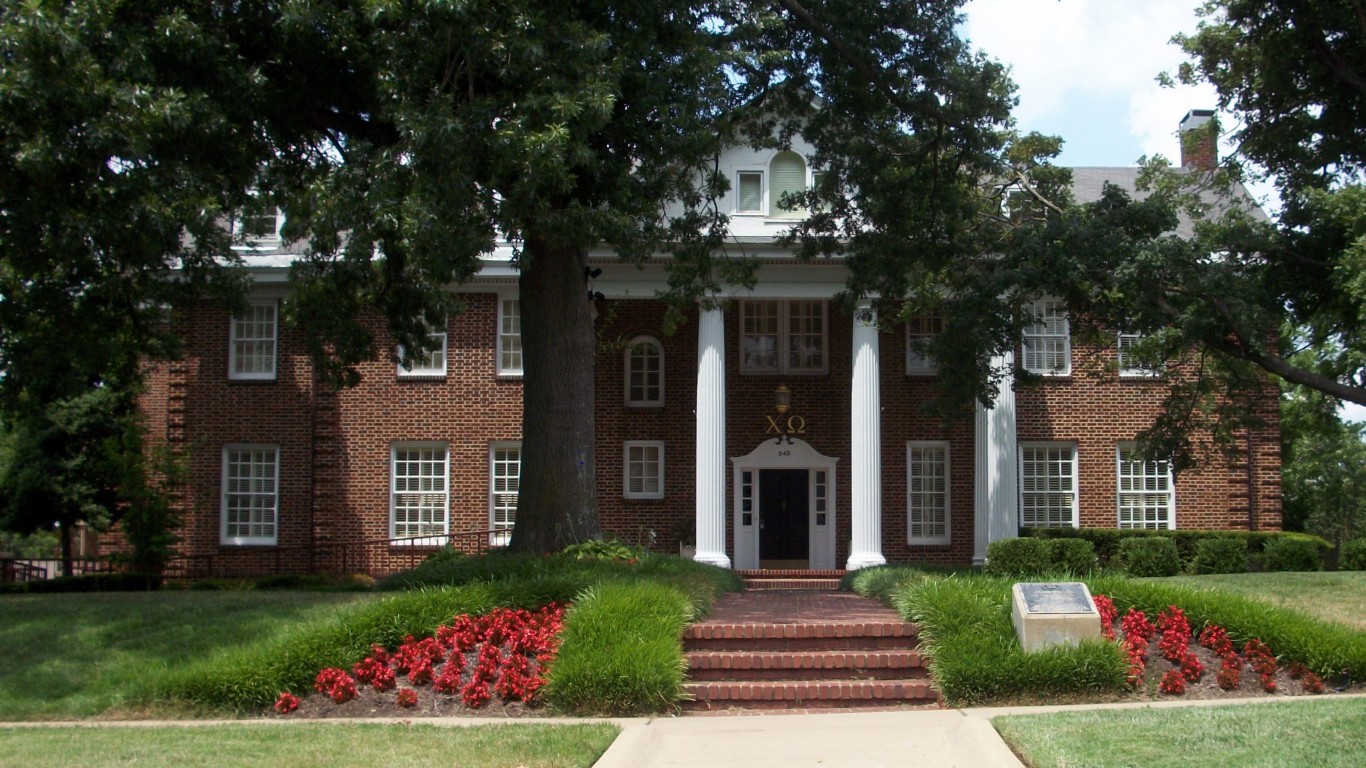
4. Arkansas: University of Arkansas
> City: Fayetteville
> Acceptance rate: 66.0%
> Undergraduate enrollment: 22,763
> Avg. annual cost of attendance: $22,122
> Employment rate 10 yrs. after enrollment: 87.9%
> Typical earnings 10 yrs. after enrollment: $44,900
[in-text-ad-2]
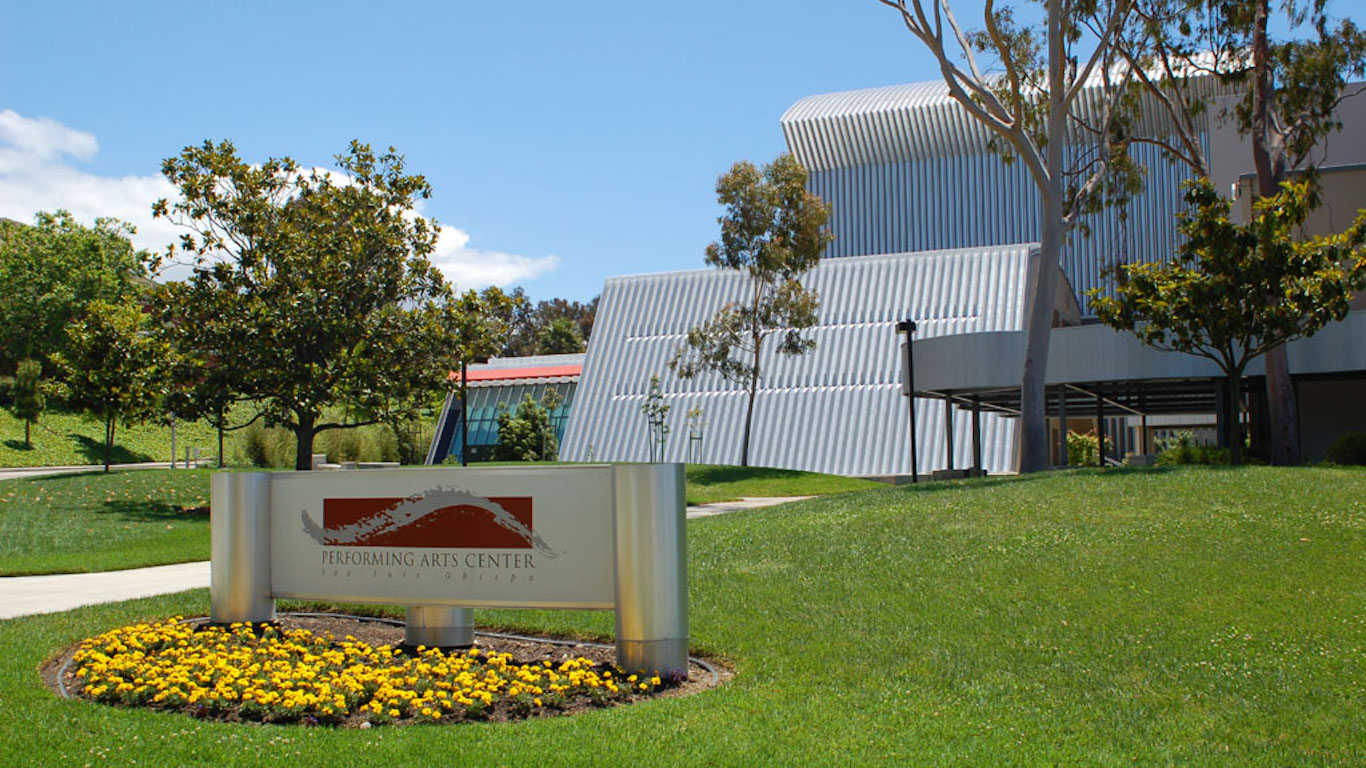
5. California: California Polytechnic State University
> City: San Luis Obispo
> Acceptance rate: 34.6%
> Undergraduate enrollment: 21,303
> Avg. annual cost of attendance: $25,960
> Employment rate 10 yrs. after enrollment: 90.8%
> Typical earnings 10 yrs. after enrollment: $66,900
6. Colorado: Colorado School of Mines
> City: Golden
> Acceptance rate: 55.7%
> Undergraduate enrollment: 4,751
> Avg. annual cost of attendance: $32,347
> Employment rate 10 yrs. after enrollment: 91.9%
> Typical earnings 10 yrs. after enrollment: $84,900
[in-text-ad]
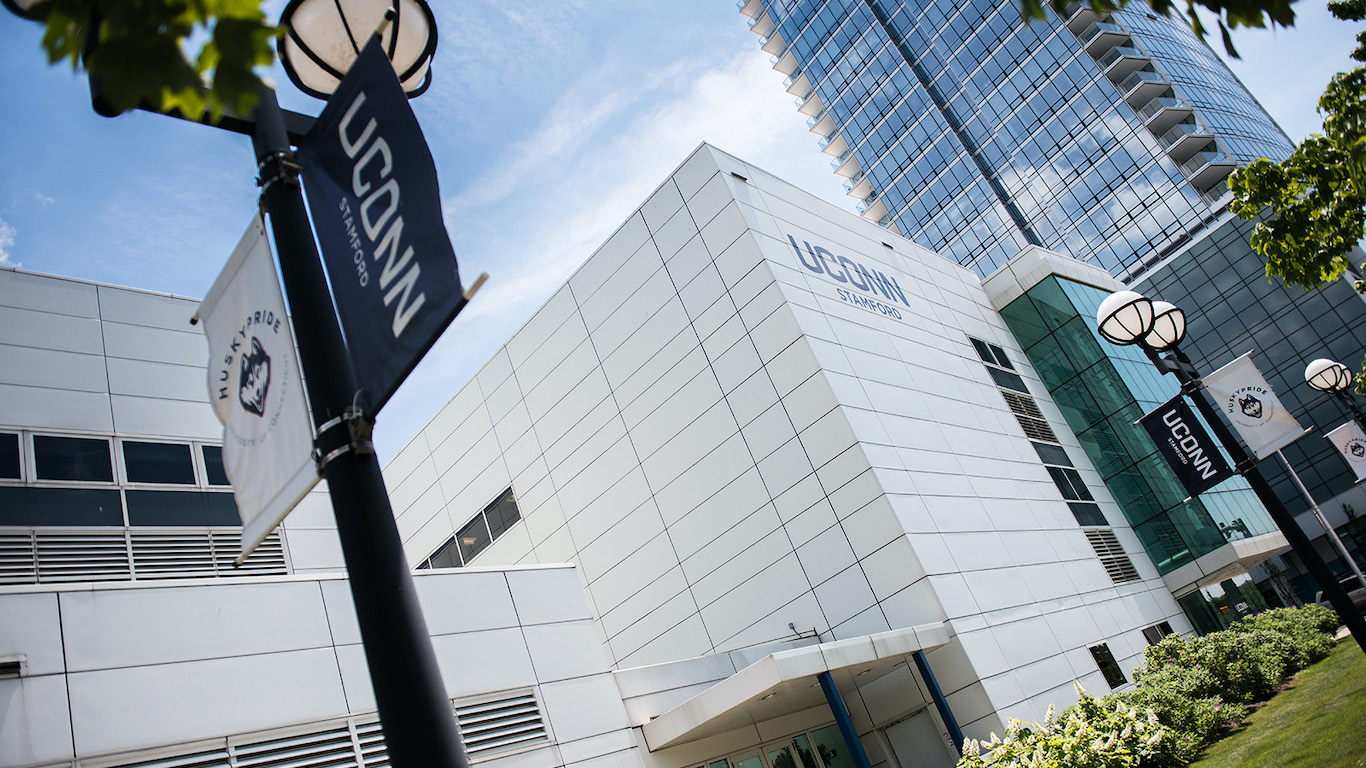
7. Connecticut: University of Connecticut-Stamford
> City: Stamford
> Acceptance rate: 82.3%
> Undergraduate enrollment: 1,670
> Avg. annual cost of attendance: $15,747
> Employment rate 10 yrs. after enrollment: 93.0%
> Typical earnings 10 yrs. after enrollment: $58,400
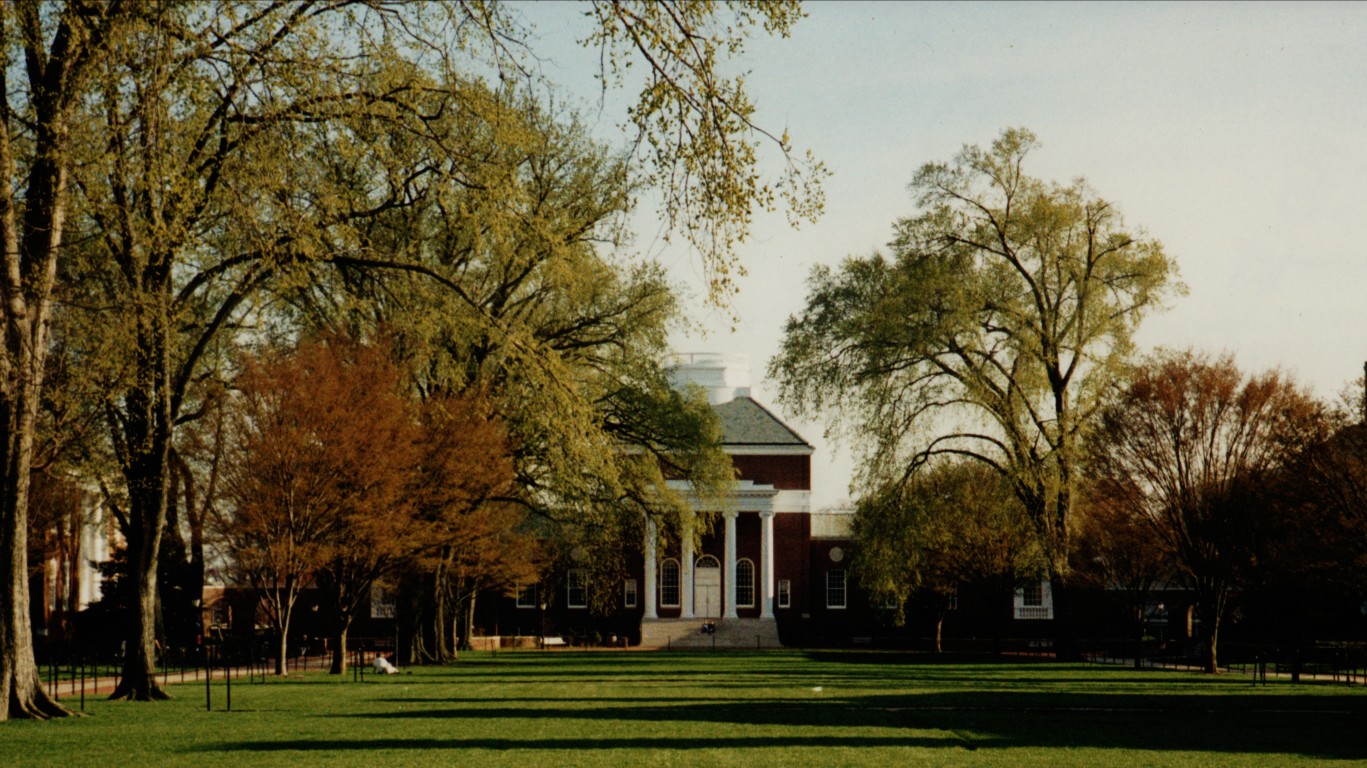
8. Delaware: University of Delaware
> City: Newark
> Acceptance rate: 62.9%
> Undergraduate enrollment: 18,948
> Avg. annual cost of attendance: $25,210
> Employment rate 10 yrs. after enrollment: 93.8%
> Typical earnings 10 yrs. after enrollment: $57,000

9. Florida: Embry-Riddle Aeronautical University-Worldwide
> City: Daytona Beach
> Acceptance rate: 63.3%
> Undergraduate enrollment: 10,256
> Avg. annual cost of attendance: $22,656
> Employment rate 10 yrs. after enrollment: 92.1%
> Typical earnings 10 yrs. after enrollment: $66,200
[in-text-ad-2]
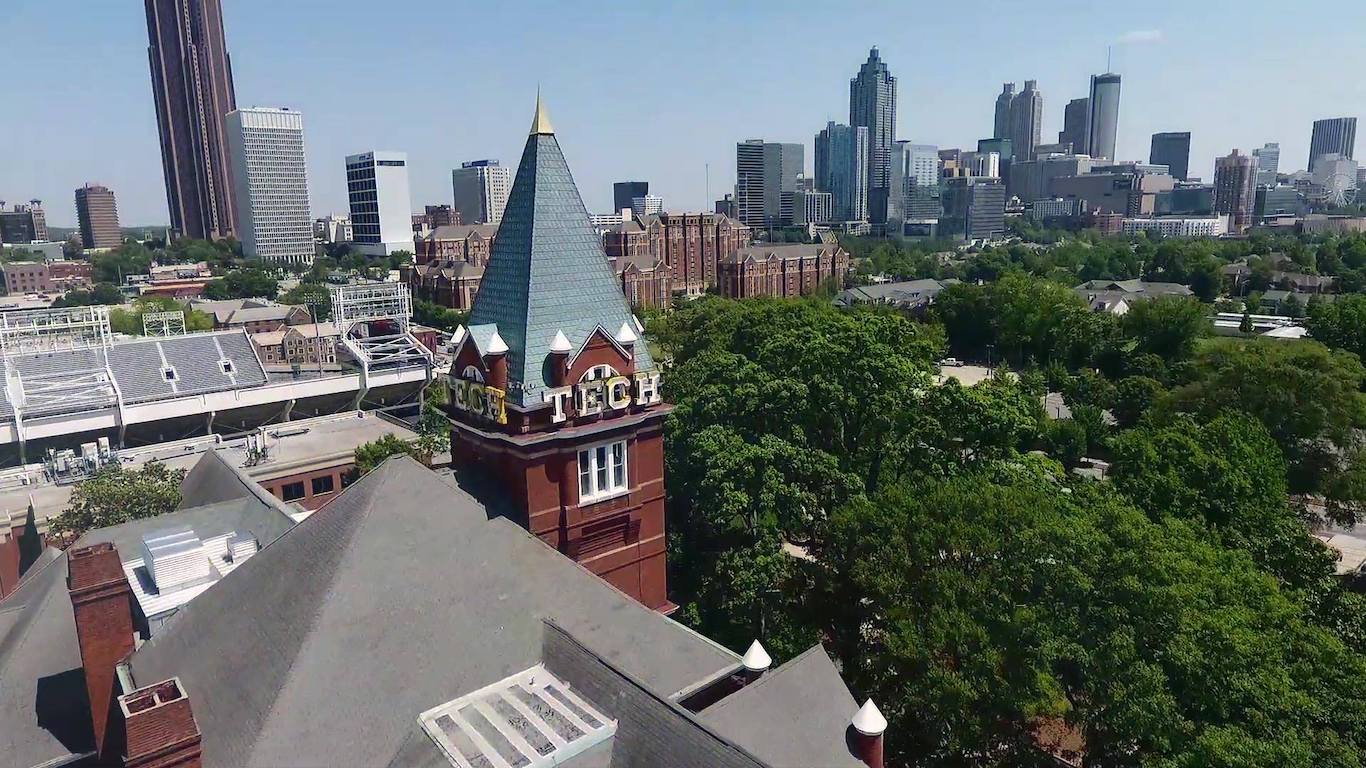
10. Georgia: Georgia Institute of Technology-Main Campus
> City: Atlanta
> Acceptance rate: 23.4%
> Undergraduate enrollment: 14,810
> Avg. annual cost of attendance: $27,245
> Employment rate 10 yrs. after enrollment: 92.5%
> Typical earnings 10 yrs. after enrollment: $79,100
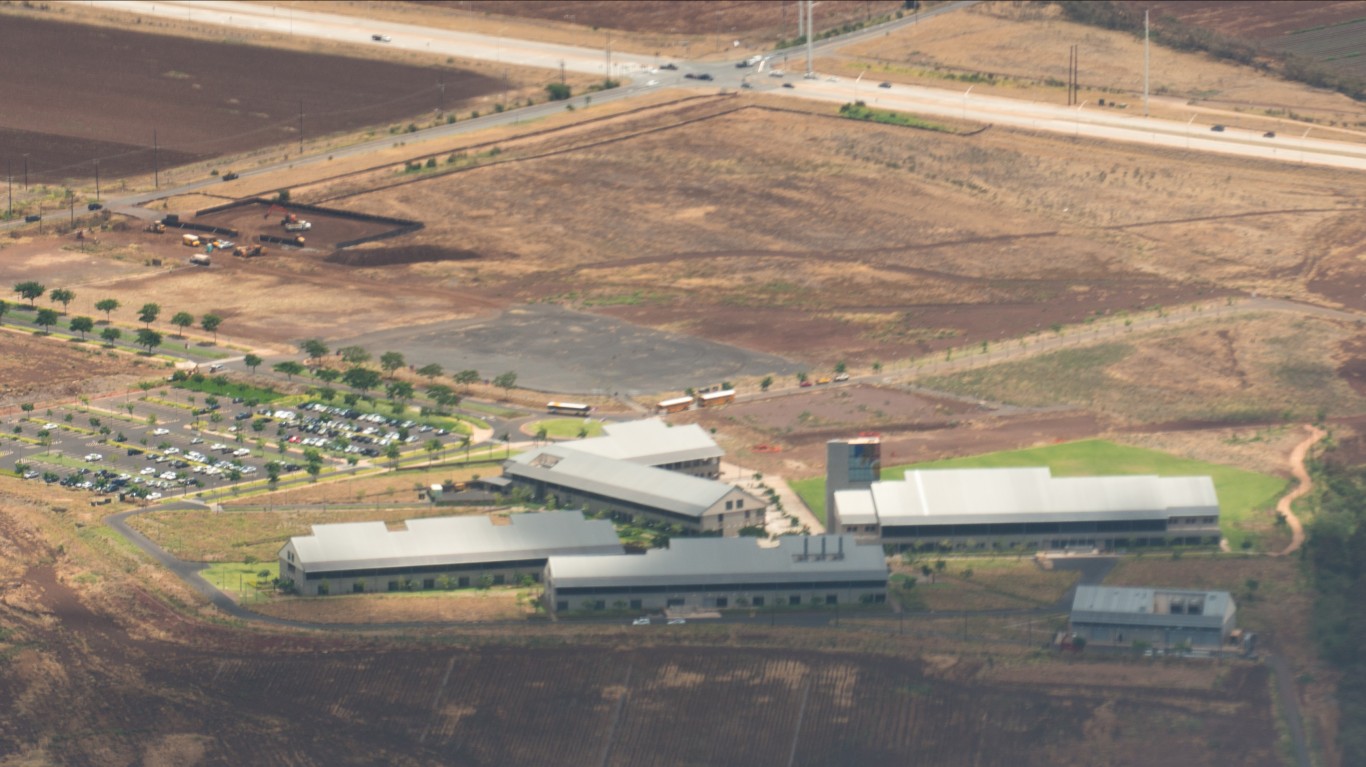
11. Hawaii: University of Hawaii-West Oahu
> City: Kapolei
> Acceptance rate: 78.8%
> Undergraduate enrollment: 2,747
> Avg. annual cost of attendance: $14,029
> Employment rate 10 yrs. after enrollment: 80.6%
> Typical earnings 10 yrs. after enrollment: $38,600
[in-text-ad]

12. Idaho: Brigham Young University-Idaho
> City: Rexburg
> Acceptance rate: 94.8%
> Undergraduate enrollment: 35,038
> Avg. annual cost of attendance: $11,833
> Employment rate 10 yrs. after enrollment: 70.8%
> Typical earnings 10 yrs. after enrollment: $42,700
13. Illinois: University of Illinois at Urbana-Champaign
> City: Champaign
> Acceptance rate: 61.5%
> Undergraduate enrollment: 32,884
> Avg. annual cost of attendance: $30,064
> Employment rate 10 yrs. after enrollment: 93.1%
> Typical earnings 10 yrs. after enrollment: $61,500
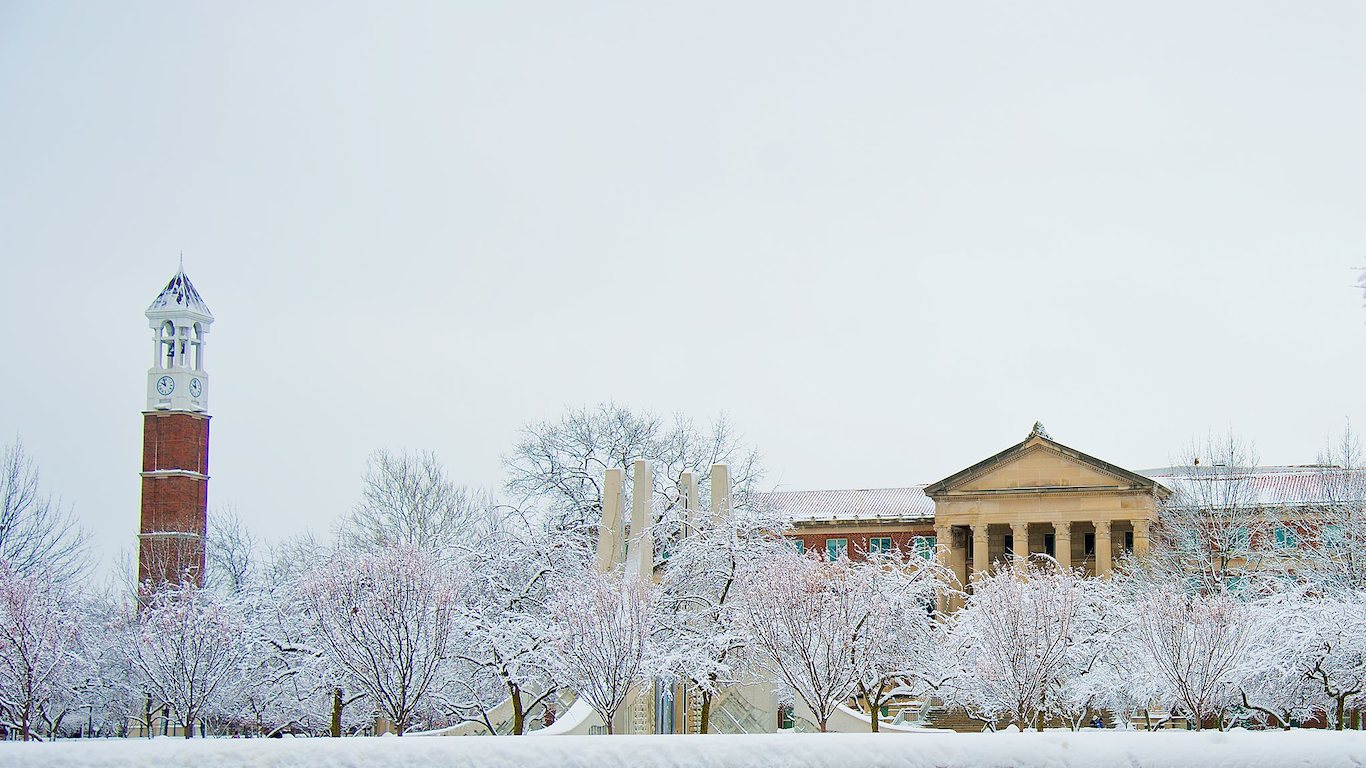
14. Indiana: Purdue University-Main Campus
> City: West Lafayette
> Acceptance rate: 57.5%
> Undergraduate enrollment: 31,887
> Avg. annual cost of attendance: $22,718
> Employment rate 10 yrs. after enrollment: 91.9%
> Typical earnings 10 yrs. after enrollment: $55,100
[in-text-ad-2]
15. Iowa: Iowa State University
> City: Ames
> Acceptance rate: 89.3%
> Undergraduate enrollment: 30,116
> Avg. annual cost of attendance: $19,878
> Employment rate 10 yrs. after enrollment: 93.3%
> Typical earnings 10 yrs. after enrollment: $50,700
16. Kansas: Fort Hays State University
> City: Hays
> Acceptance rate: 88.6%
> Undergraduate enrollment: 12,174
> Avg. annual cost of attendance: $16,753
> Employment rate 10 yrs. after enrollment: 90.4%
> Typical earnings 10 yrs. after enrollment: $38,200
[in-text-ad]
17. Kentucky: Northern Kentucky University
> City: Highland Heights
> Acceptance rate: 90.4%
> Undergraduate enrollment: 10,728
> Avg. annual cost of attendance: $17,377
> Employment rate 10 yrs. after enrollment: 89.1%
> Typical earnings 10 yrs. after enrollment: $37,500
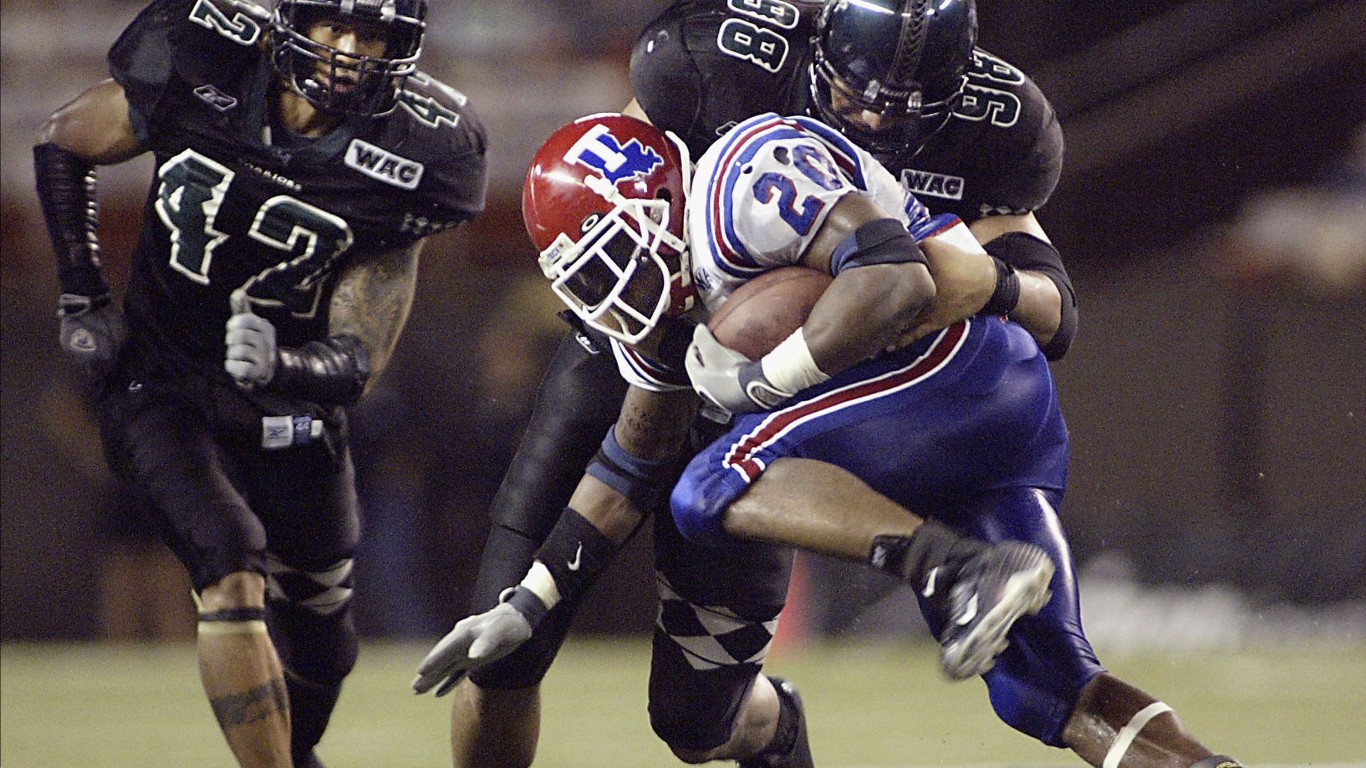
18. Louisiana: Louisiana Tech University
> City: Ruston
> Acceptance rate: 64.8%
> Undergraduate enrollment: 8,277
> Avg. annual cost of attendance: $19,225
> Employment rate 10 yrs. after enrollment: 88.9%
> Typical earnings 10 yrs. after enrollment: $41,500
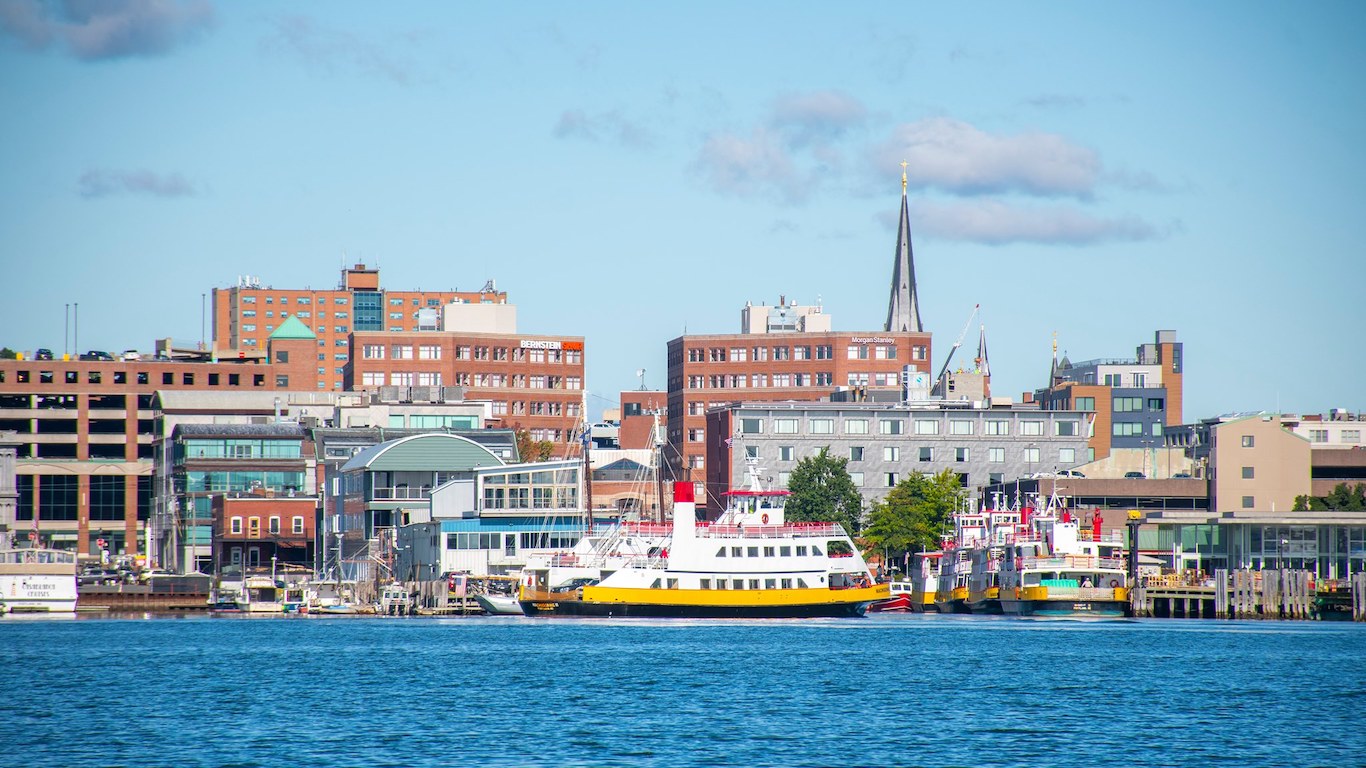
19. Maine: University of Southern Maine
> City: Portland
> Acceptance rate: 83.5%
> Undergraduate enrollment: 5,248
> Avg. annual cost of attendance: $19,306
> Employment rate 10 yrs. after enrollment: 90.4%
> Typical earnings 10 yrs. after enrollment: $38,700
[in-text-ad-2]
20. Maryland: University of Maryland
> City: College Park
> Acceptance rate: 44.5%
> Undergraduate enrollment: 29,273
> Avg. annual cost of attendance: $25,701
> Employment rate 10 yrs. after enrollment: 90.8%
> Typical earnings 10 yrs. after enrollment: $62,900
21. Massachusetts: Westfield State University
> City: Westfield
> Acceptance rate: 85.3%
> Undergraduate enrollment: 5,375
> Avg. annual cost of attendance: $21,684
> Employment rate 10 yrs. after enrollment: 93.6%
> Typical earnings 10 yrs. after enrollment: $46,100
[in-text-ad]

22. Michigan: Michigan Technological University
> City: Houghton
> Acceptance rate: 74.5%
> Undergraduate enrollment: 5,829
> Avg. annual cost of attendance: $27,537
> Employment rate 10 yrs. after enrollment: 93.0%
> Typical earnings 10 yrs. after enrollment: $66,400
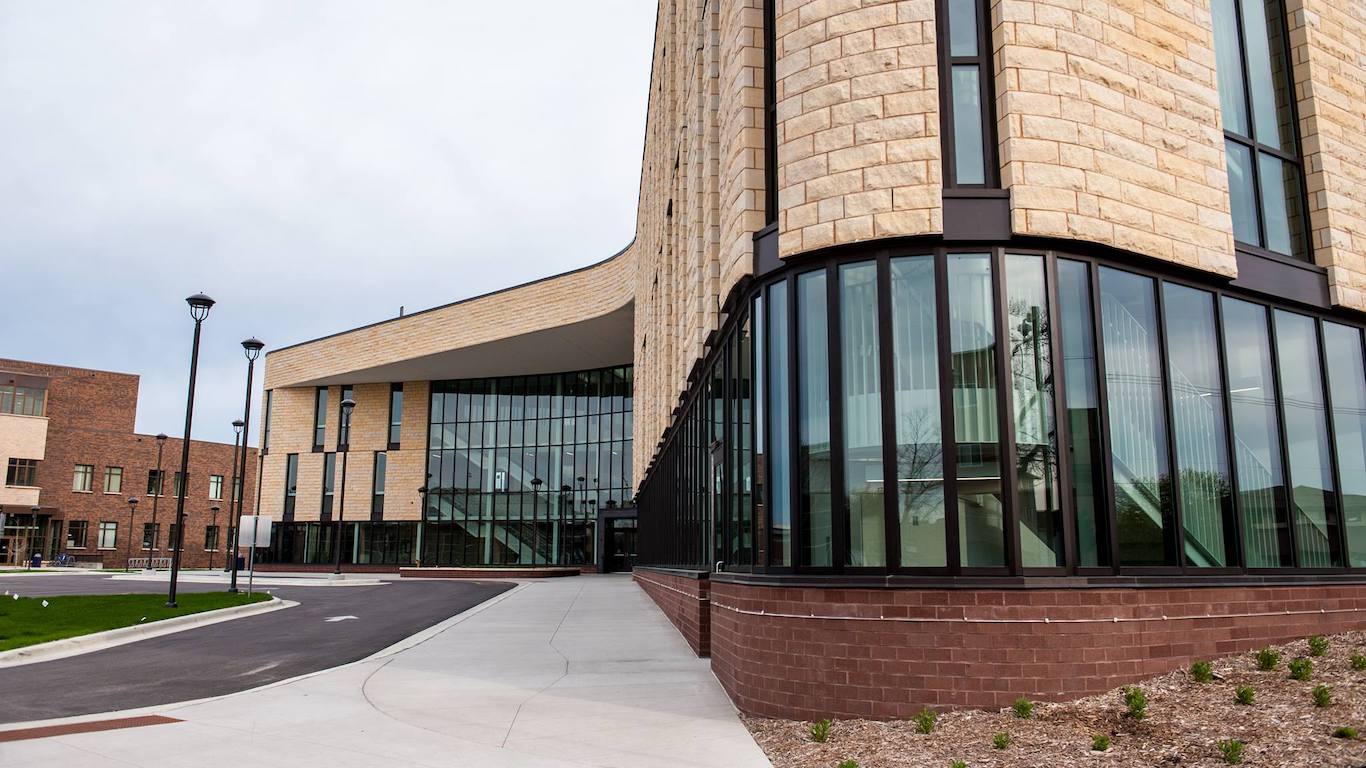
23. Minnesota: Minnesota State University
> City: Mankato
> Acceptance rate: 61.0%
> Undergraduate enrollment: 11,966
> Avg. annual cost of attendance: $18,993
> Employment rate 10 yrs. after enrollment: 93.9%
> Typical earnings 10 yrs. after enrollment: $44,900
24. Mississippi: Mississippi State University
> City: Mississippi State
> Acceptance rate: 62.4%
> Undergraduate enrollment: 17,723
> Avg. annual cost of attendance: $23,483
> Employment rate 10 yrs. after enrollment: 90.0%
> Typical earnings 10 yrs. after enrollment: $40,200
[in-text-ad-2]
25. Missouri: Truman State University
> City: Kirksville
> Acceptance rate: 67.5%
> Undergraduate enrollment: 5,241
> Avg. annual cost of attendance: $20,633
> Employment rate 10 yrs. after enrollment: 94.3%
> Typical earnings 10 yrs. after enrollment: $44,500
26. Montana: Montana State University
> City: Bozeman
> Acceptance rate: 83.1%
> Undergraduate enrollment: 14,383
> Avg. annual cost of attendance: $19,980
> Employment rate 10 yrs. after enrollment: 89.8%
> Typical earnings 10 yrs. after enrollment: $43,200
[in-text-ad]
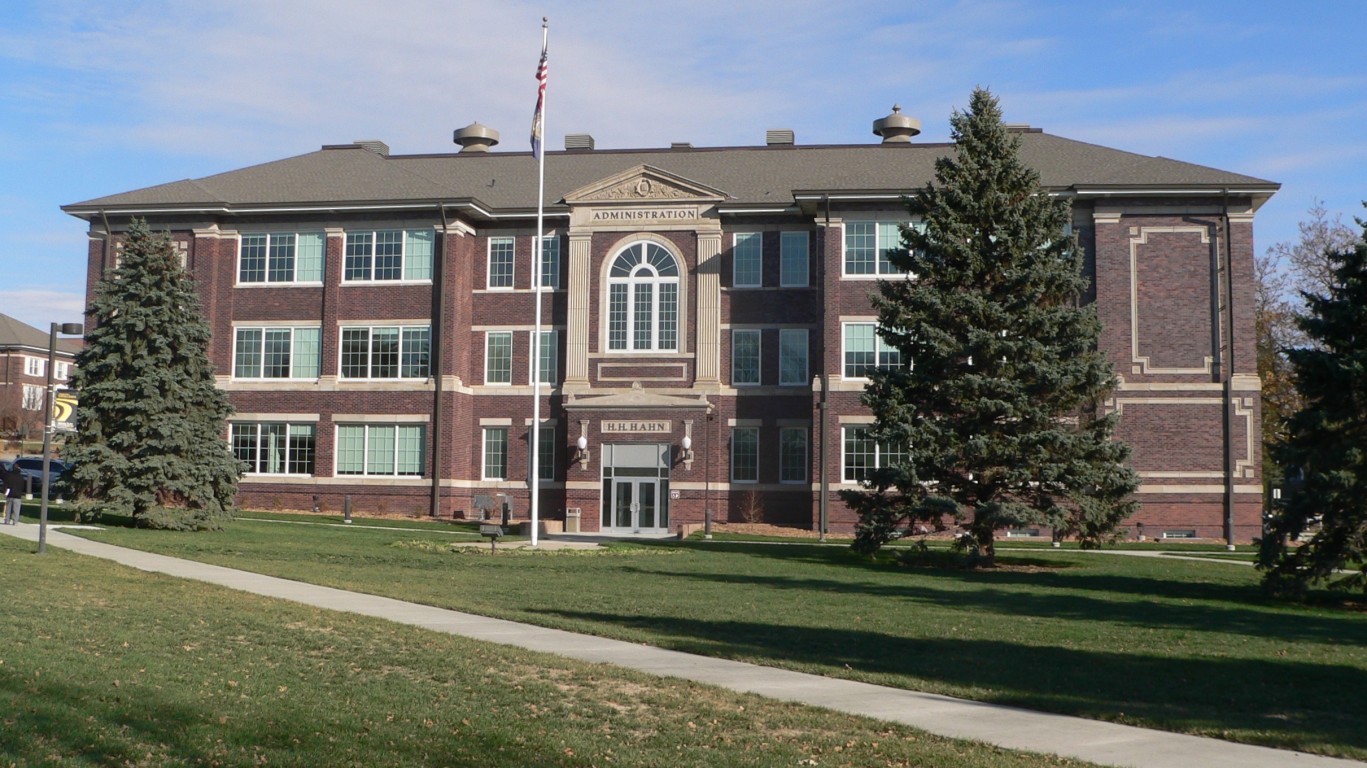
27. Nebraska: Wayne State College
> City: Wayne
> Acceptance rate: N/A
> Undergraduate enrollment: 2,610
> Avg. annual cost of attendance: $17,371
> Employment rate 10 yrs. after enrollment: 93.2%
> Typical earnings 10 yrs. after enrollment: $36,100
28. Nevada: University of Nevada
> City: Reno
> Acceptance rate: 88.0%
> Undergraduate enrollment: 17,930
> Avg. annual cost of attendance: $21,142
> Employment rate 10 yrs. after enrollment: 88.7%
> Typical earnings 10 yrs. after enrollment: $47,000
29. New Hampshire: Keene State College
> City: Keene
> Acceptance rate: 82.7%
> Undergraduate enrollment: 3,688
> Avg. annual cost of attendance: $26,094
> Employment rate 10 yrs. after enrollment: 92.2%
> Typical earnings 10 yrs. after enrollment: $42,400
[in-text-ad-2]
30. New Jersey: Rutgers University-Newark
> City: Newark
> Acceptance rate: 64.2%
> Undergraduate enrollment: 8,122
> Avg. annual cost of attendance: $24,719
> Employment rate 10 yrs. after enrollment: 91.6%
> Typical earnings 10 yrs. after enrollment: $57,900
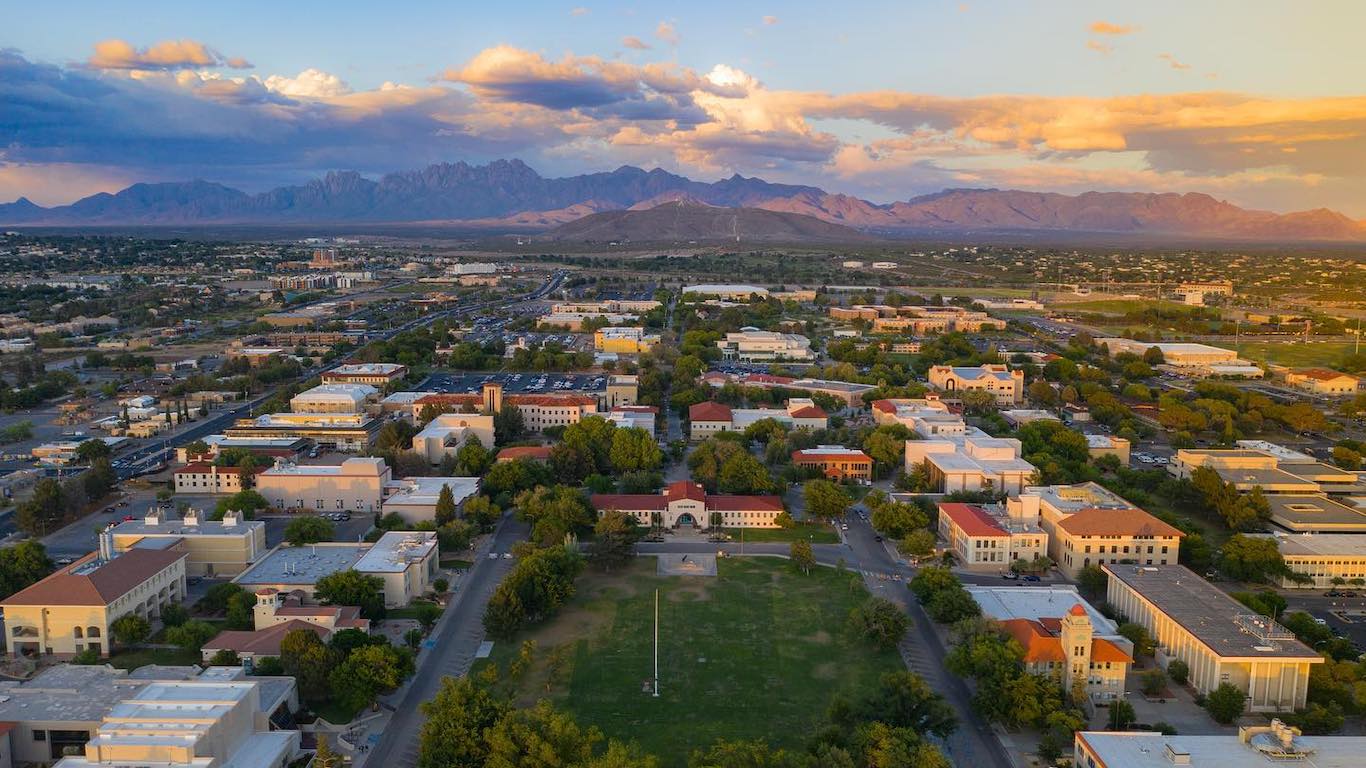
31. New Mexico: New Mexico State University-Main Campus
> City: Las Cruces
> Acceptance rate: 63.8%
> Undergraduate enrollment: 11,173
> Avg. annual cost of attendance: $17,124
> Employment rate 10 yrs. after enrollment: 83.9%
> Typical earnings 10 yrs. after enrollment: $34,600
[in-text-ad]
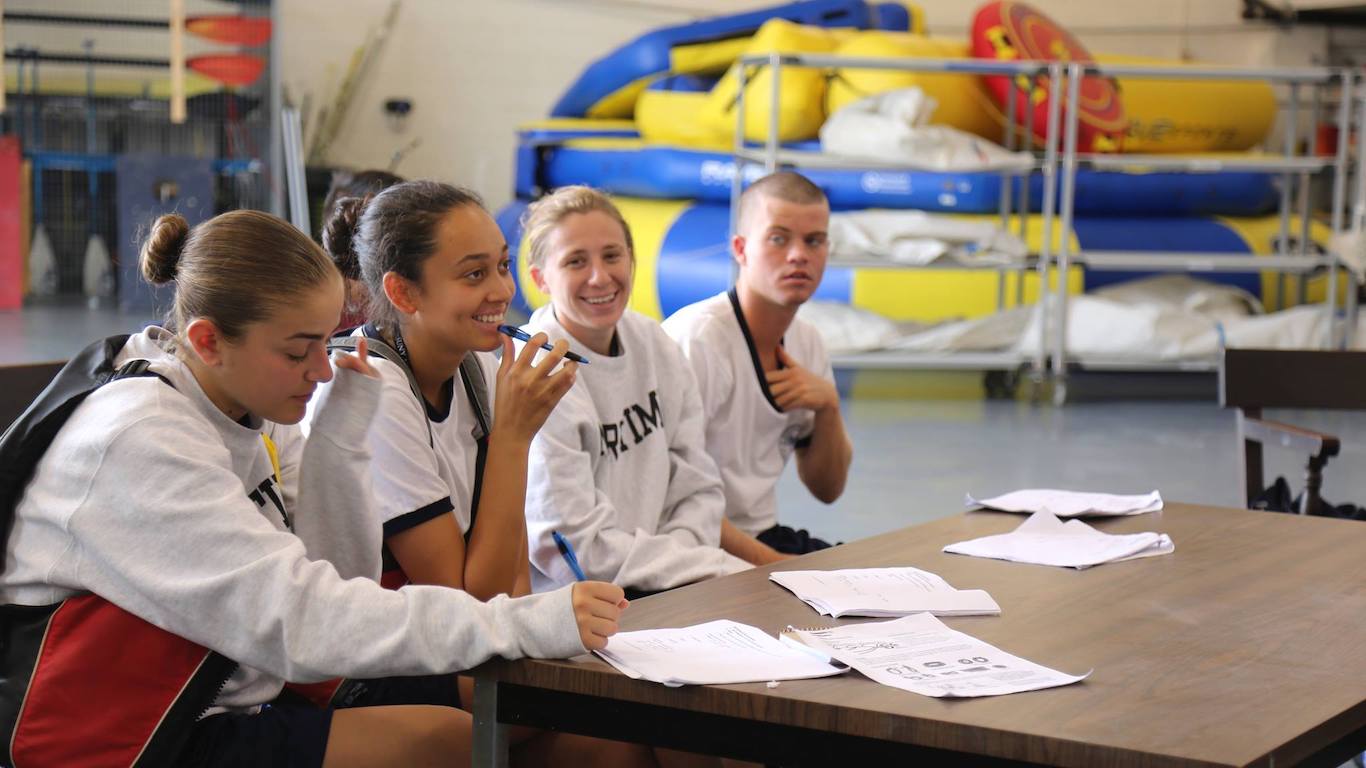
32. New York: SUNY Maritime College
> City: Throggs Neck
> Acceptance rate: 69.5%
> Undergraduate enrollment: 1,633
> Avg. annual cost of attendance: $24,388
> Employment rate 10 yrs. after enrollment: 92.7%
> Typical earnings 10 yrs. after enrollment: $82,800
33. North Carolina: North Carolina State University at Raleigh
> City: Raleigh
> Acceptance rate: 51.4%
> Undergraduate enrollment: 22,801
> Avg. annual cost of attendance: $22,844
> Employment rate 10 yrs. after enrollment: 91.9%
> Typical earnings 10 yrs. after enrollment: $52,500
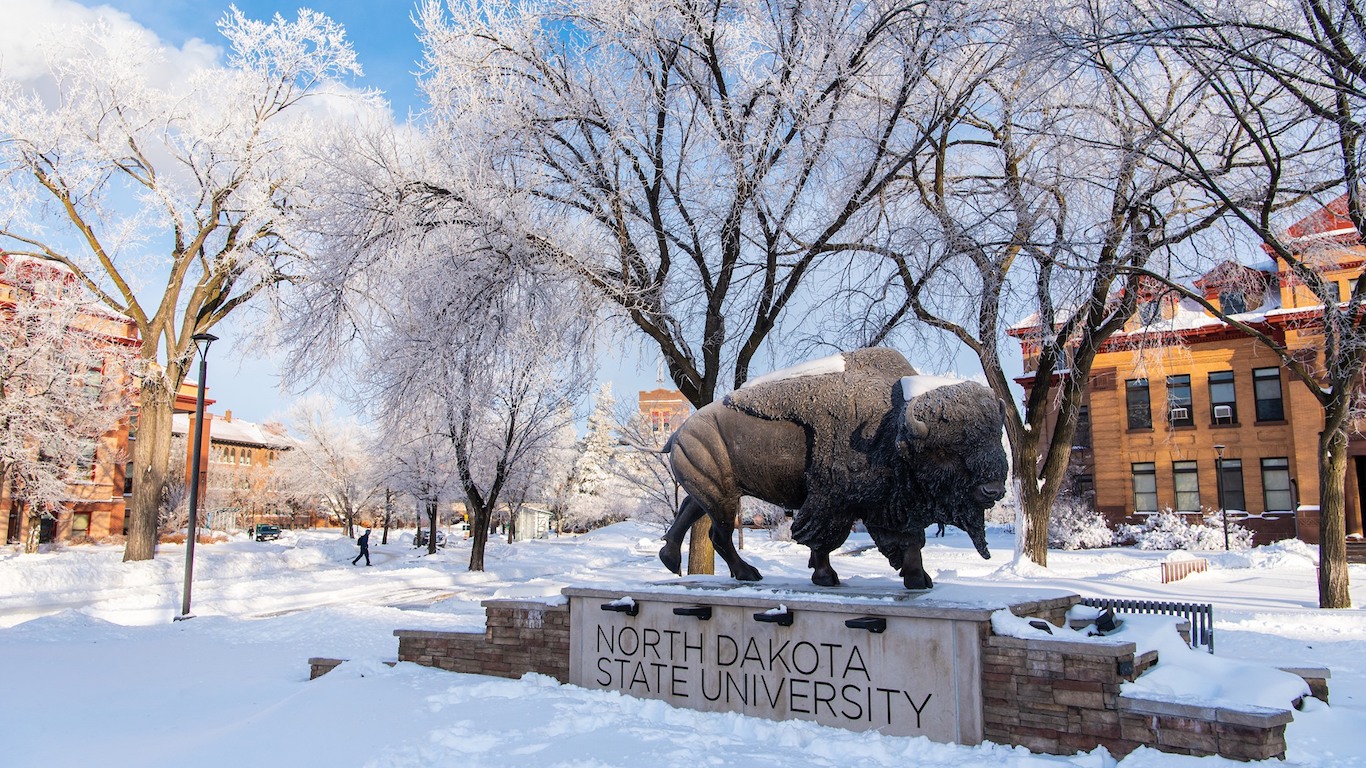
34. North Dakota: North Dakota State University-Main Campus
> City: Fargo
> Acceptance rate: 91.6%
> Undergraduate enrollment: 11,687
> Avg. annual cost of attendance: $19,874
> Employment rate 10 yrs. after enrollment: 93.9%
> Typical earnings 10 yrs. after enrollment: $48,200
[in-text-ad-2]
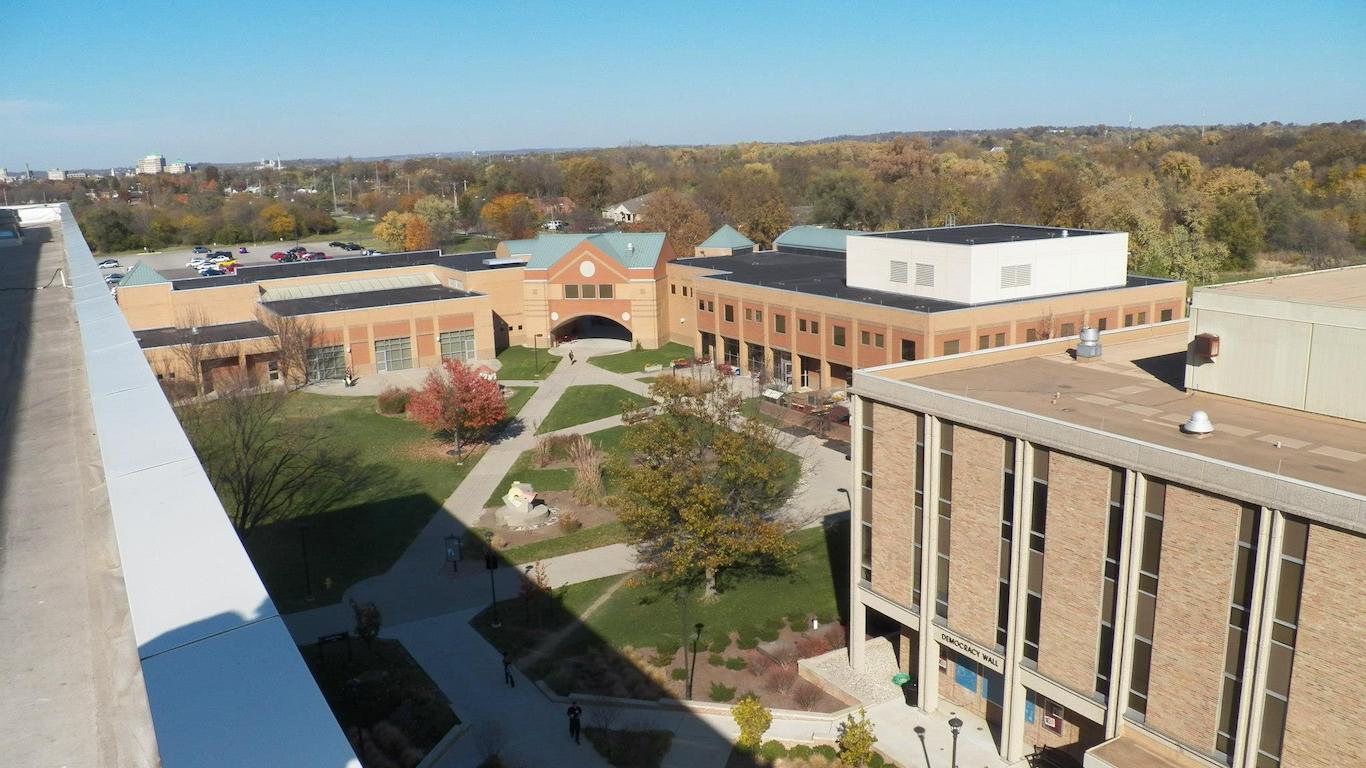
35. Ohio: Miami University-Hamilton
> City: Hamilton
> Acceptance rate: N/A
> Undergraduate enrollment: 2,545
> Avg. annual cost of attendance: $13,463
> Employment rate 10 yrs. after enrollment: 90.1%
> Typical earnings 10 yrs. after enrollment: $47,100
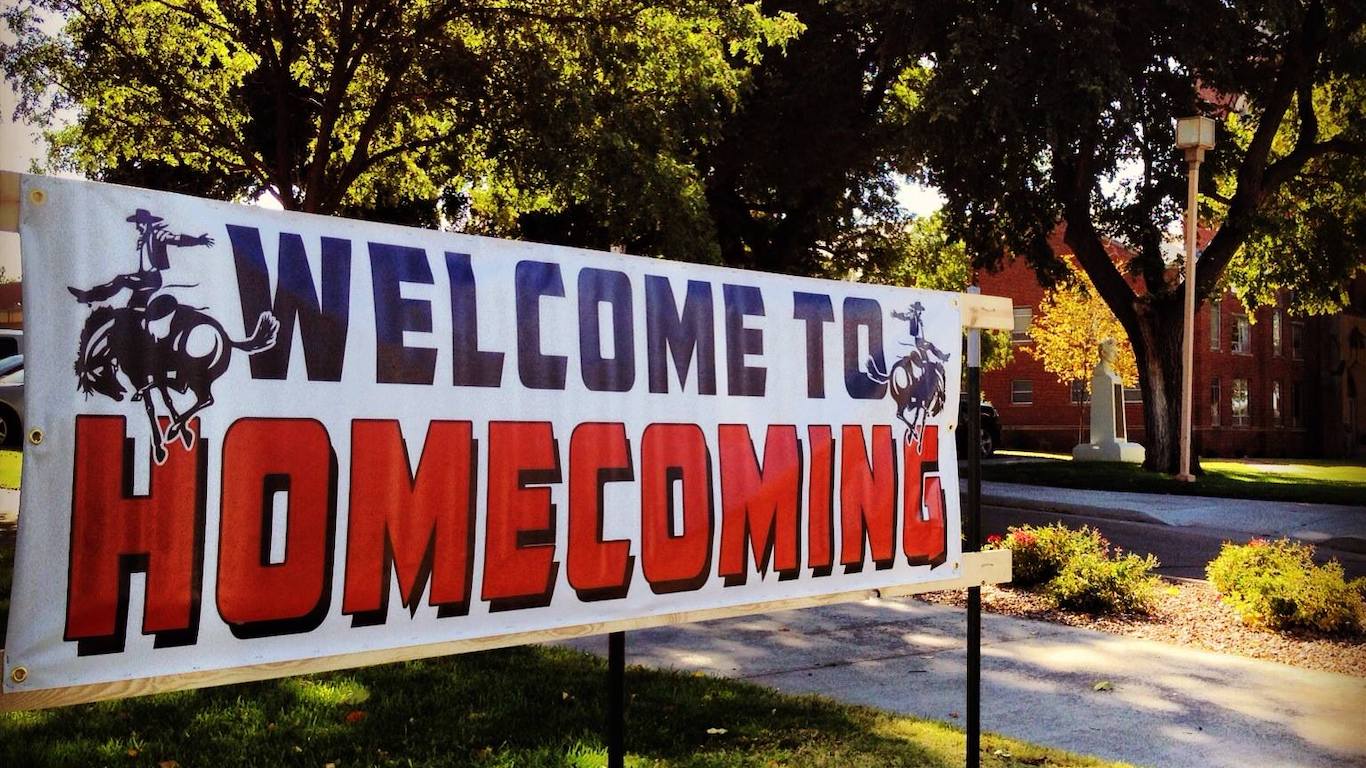
36. Oklahoma: Northwestern Oklahoma State University
> City: Alva
> Acceptance rate: 83.0%
> Undergraduate enrollment: 1,735
> Avg. annual cost of attendance: $15,057
> Employment rate 10 yrs. after enrollment: 86.3%
> Typical earnings 10 yrs. after enrollment: $36,400
[in-text-ad]
37. Oregon: Oregon Institute of Technology
> City: Klamath Falls
> Acceptance rate: 61.4%
> Undergraduate enrollment: 3,543
> Avg. annual cost of attendance: $22,466
> Employment rate 10 yrs. after enrollment: 88.9%
> Typical earnings 10 yrs. after enrollment: $56,600
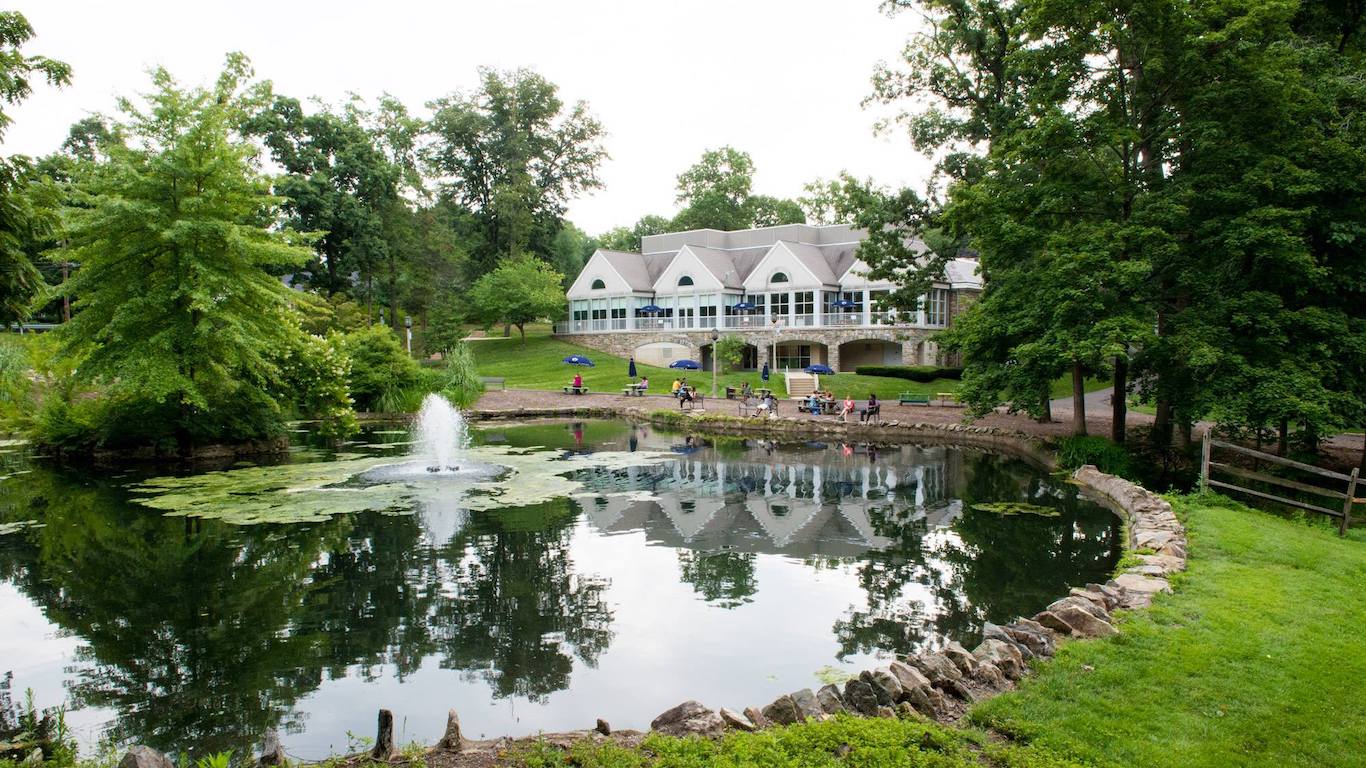
38. Pennsylvania: Pennsylvania State University-Penn State Abington
> City: Abington
> Acceptance rate: 85.2%
> Undergraduate enrollment: 3,674
> Avg. annual cost of attendance: $23,536
> Employment rate 10 yrs. after enrollment: 92.0%
> Typical earnings 10 yrs. after enrollment: $50,100
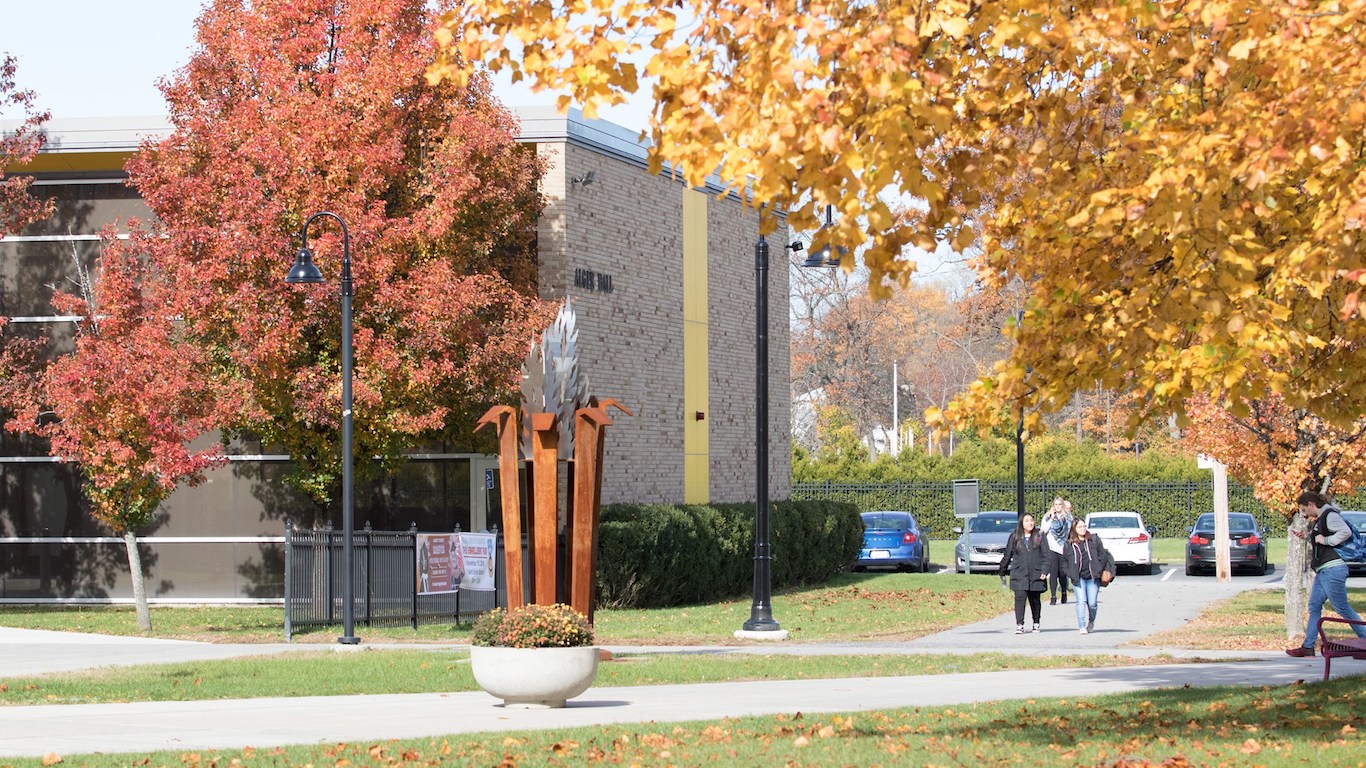
39. Rhode Island: Rhode Island College
> City: Providence
> Acceptance rate: 73.6%
> Undergraduate enrollment: 6,900
> Avg. annual cost of attendance: $15,726
> Employment rate 10 yrs. after enrollment: 92.7%
> Typical earnings 10 yrs. after enrollment: $41,400
[in-text-ad-2]
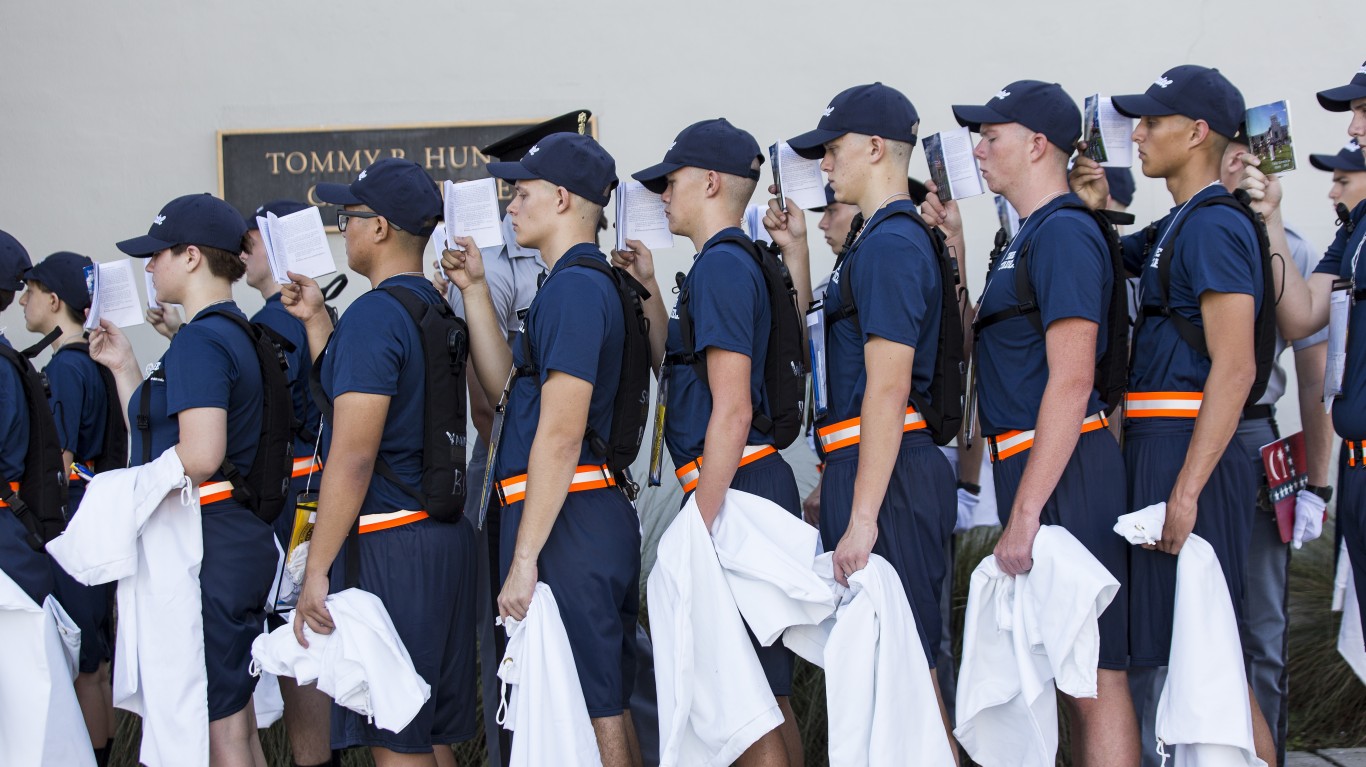
40. South Carolina: Citadel Military College of South Carolina
> City: Charleston
> Acceptance rate: 81.1%
> Undergraduate enrollment: 2,814
> Avg. annual cost of attendance: $27,838
> Employment rate 10 yrs. after enrollment: 94.3%
> Typical earnings 10 yrs. after enrollment: $56,800

41. South Dakota: South Dakota School of Mines and Technology
> City: Rapid City
> Acceptance rate: 83.4%
> Undergraduate enrollment: 2,295
> Avg. annual cost of attendance: $23,835
> Employment rate 10 yrs. after enrollment: 91.0%
> Typical earnings 10 yrs. after enrollment: $56,500
[in-text-ad]
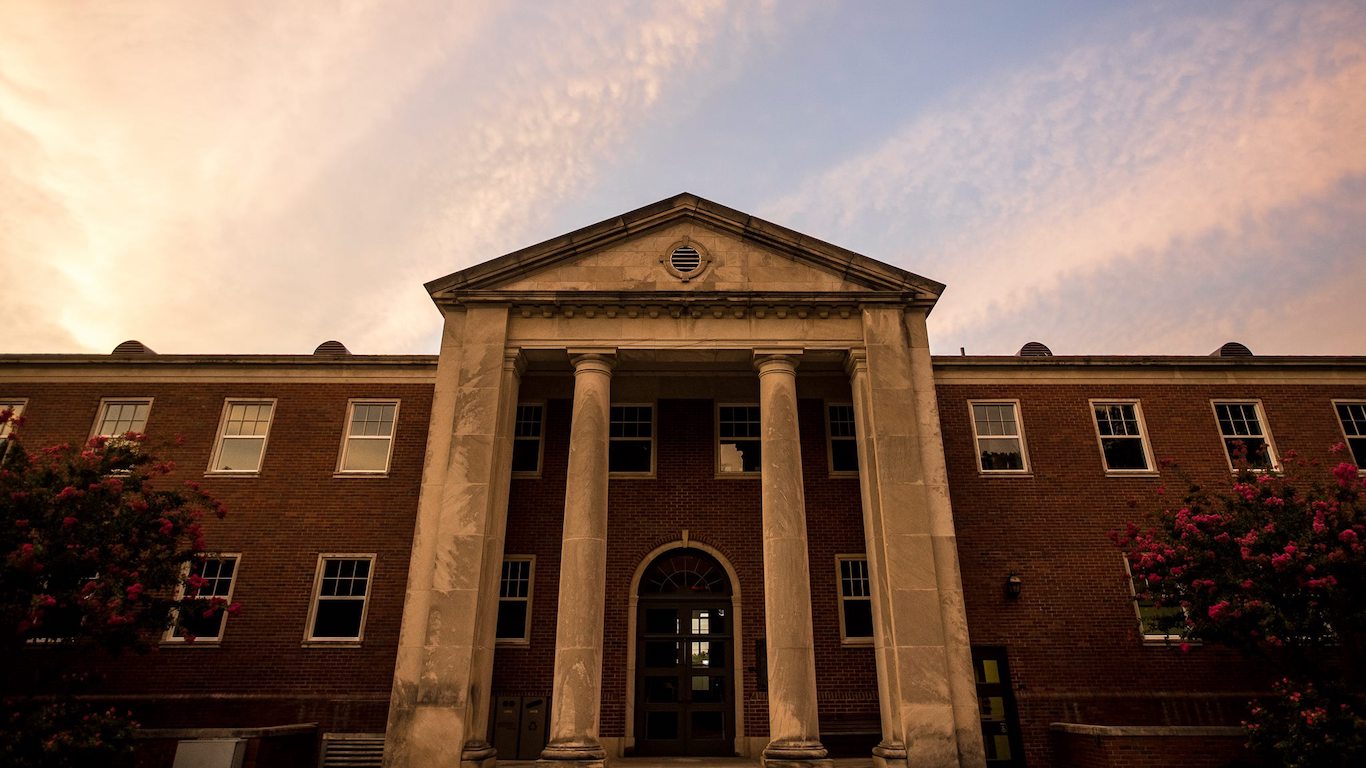
42. Tennessee: The University of Tennessee-Martin
> City: Martin
> Acceptance rate: 61.5%
> Undergraduate enrollment: 5,522
> Avg. annual cost of attendance: $19,666
> Employment rate 10 yrs. after enrollment: 88.6%
> Typical earnings 10 yrs. after enrollment: $36,200
43. Texas: The University of Texas at Austin
> City: Austin
> Acceptance rate: 36.5%
> Undergraduate enrollment: 39,965
> Avg. annual cost of attendance: $24,933
> Employment rate 10 yrs. after enrollment: 91.8%
> Typical earnings 10 yrs. after enrollment: $58,200

44. Utah: Weber State University
> City: Ogden
> Acceptance rate: N/A
> Undergraduate enrollment: 16,947
> Avg. annual cost of attendance: $15,054
> Employment rate 10 yrs. after enrollment: 84.4%
> Typical earnings 10 yrs. after enrollment: $44,500
[in-text-ad-2]
45. Vermont: Castleton University
> City: Castleton
> Acceptance rate: 81.5%
> Undergraduate enrollment: 1,757
> Avg. annual cost of attendance: $23,173
> Employment rate 10 yrs. after enrollment: 94.7%
> Typical earnings 10 yrs. after enrollment: $37,900
46. Virginia: James Madison University
> City: Harrisonburg
> Acceptance rate: 75.2%
> Undergraduate enrollment: 19,666
> Avg. annual cost of attendance: $24,750
> Employment rate 10 yrs. after enrollment: 94.3%
> Typical earnings 10 yrs. after enrollment: $56,600
[in-text-ad]
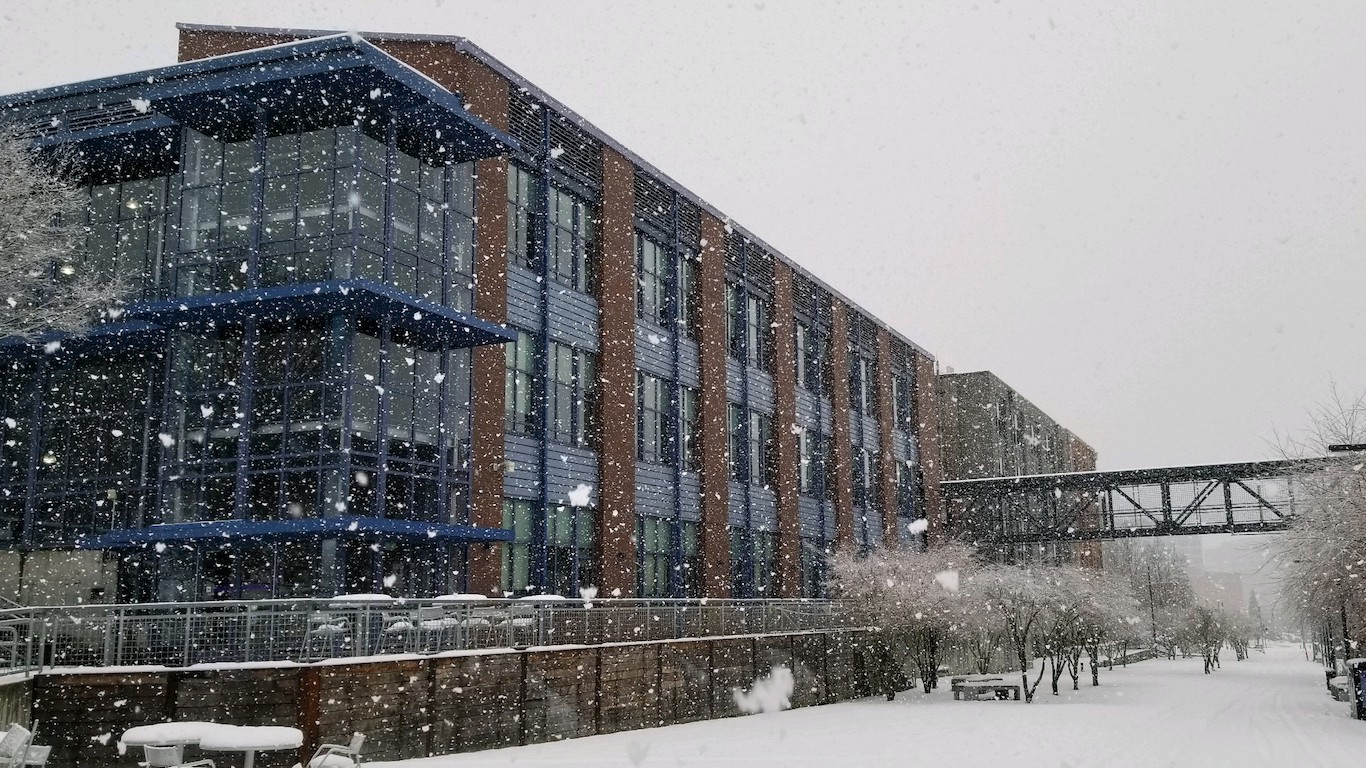
47. Washington: University of Washington-Tacoma Campus
> City: Tacoma
> Acceptance rate: 83.9%
> Undergraduate enrollment: 4,412
> Avg. annual cost of attendance: $19,708
> Employment rate 10 yrs. after enrollment: 89.2%
> Typical earnings 10 yrs. after enrollment: $57,700
48. West Virginia: West Virginia University
> City: Morgantown
> Acceptance rate: 71.9%
> Undergraduate enrollment: 21,703
> Avg. annual cost of attendance: $20,702
> Employment rate 10 yrs. after enrollment: 91.0%
> Typical earnings 10 yrs. after enrollment: $45,800
49. Wisconsin: University of Wisconsin
> City: La Crosse
> Acceptance rate: 73.4%
> Undergraduate enrollment: 9,436
> Avg. annual cost of attendance: $17,235
> Employment rate 10 yrs. after enrollment: 94.7%
> Typical earnings 10 yrs. after enrollment: $48,000
[in-text-ad-2]
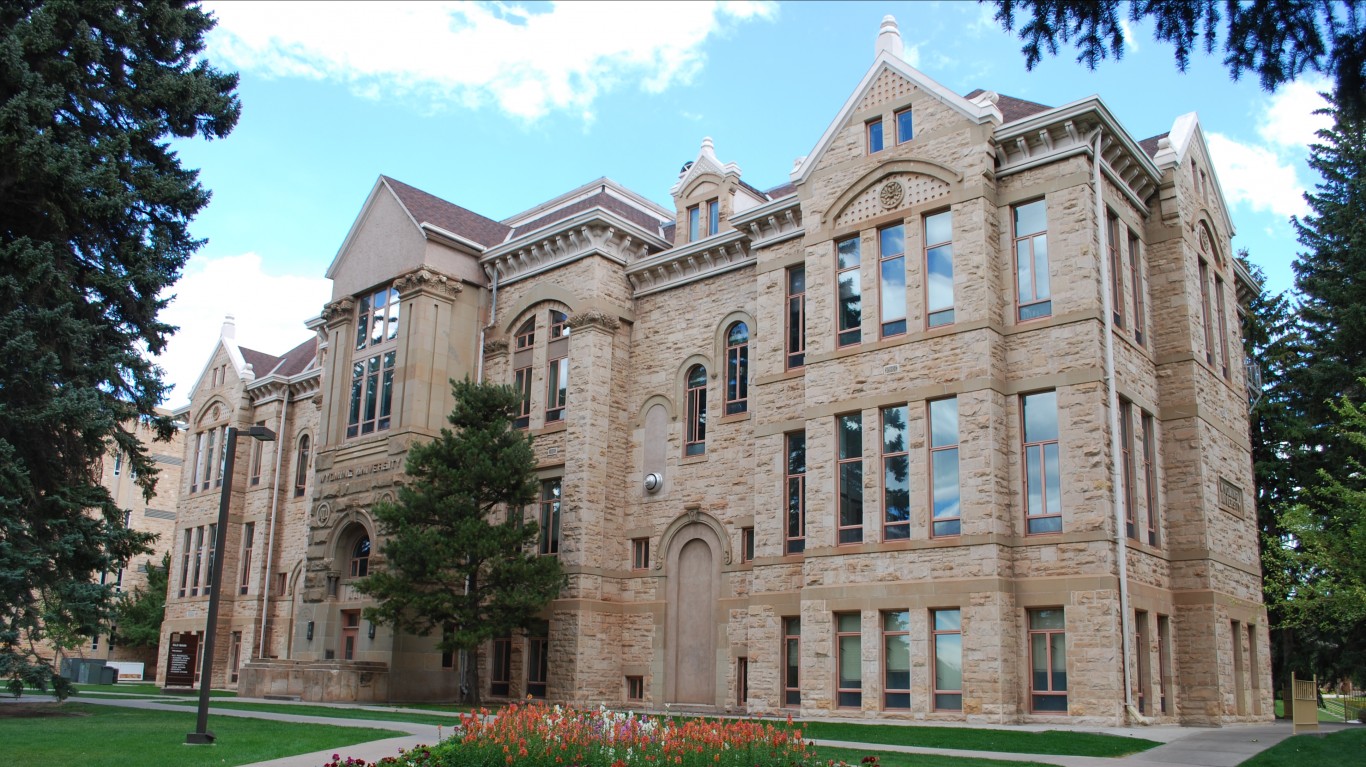
50. Wyoming: University of Wyoming
> City: Laramie
> Acceptance rate: 96.8%
> Undergraduate enrollment: 9,623
> Avg. annual cost of attendance: $19,615
> Employment rate 10 yrs. after enrollment: 88.6%
> Typical earnings 10 yrs. after enrollment: $47,300
Methodology
To determine the most affordable colleges with the best outcomes in every state, 24/7 Wall St. constructed an index of seven measures. To measure the affordability of a college, we included: 1) average annual net price; 2) average cost of attendance; and 3) percentage of students who have made progress paying their student loans. To evaluate the outcomes of graduates of each college, we included: 4) employment rates for graduates six years after the first year of enrollment; 5) employment rates for graduates 10 years after the first year of enrollment; 6) median earnings for graduates six years after the first year of enrollment; and 7) median earnings for graduates 10 years after the first year of enrollment. We reviewed data for over 6,000 bachelor-degree granting institutions. All data are from the U.S. Department of Education College Scorecard program and are for the most recent period available.
1. Data on the average net price — which is the average yearly price of attending a school (tuition plus living expenses) for first-time, full-time undergraduates after financial aid — for students who receive financial aid in the 2016-17 academic year was included in the index at full weight.
2. Data on the average cost of attendance, which does not account for financial aid, for all students in the 2016-17 academic year was included in the index at full weight.
3. Data on the percentage of students who left school with federal loans in the 2011-12 academic year who are not in default on their loans and who have put some money toward the initial loan balance within five years of entering repayment was included in the index at full weight.
4. Data on the percentage of individuals who entered university in the 2008-09 academic year and were employed six years later was included in the index at half weight.
5. Data on the percentage of individuals who entered university in the 2004-05 academic year and were employed 10 years later was included in the index at half weight.
6. Data on the median earnings of individuals who entered university in the 2008-09 academic year and were employed six years later was included in the index at half weight.
7. Data on the median earnings of individuals who entered university in the 2004-05 academic year and were employed 10 years later was included in the index at half weight.
Only universities that primarily grant bachelor’s degrees and have at least 1,500 undergraduates enrolled as of fall 2017 were considered. Data on acceptance rates are also from the Department of Education and are for fall 2017.
Are you ahead, or behind on retirement? For families with more than $500,000 saved for retirement, finding a financial advisor who puts your interest first can be the difference, and today it’s easier than ever. SmartAsset’s free tool matches you with up to three fiduciary financial advisors who serve your area in minutes. Each advisor has been carefully vetted and must act in your best interests. Start your search now.
If you’ve saved and built a substantial nest egg for you and your family, don’t delay; get started right here and help your retirement dreams become a retirement reality.
Thank you for reading! Have some feedback for us?
Contact the 24/7 Wall St. editorial team.