The Common Core State Standards Initiative, implemented during the Obama administration, established a uniform set of expectations for American public school students from kindergarten through 12th grade. Still, the authority to establish budgets, standards, and curriculums for public school students falls largely to state governments — and partially as a result, education outcomes vary considerably across the country.
24/7 Wall St. created an index, inspired by the Quality Counts ranking of state education created by independent news journal Education Week, to identify the states with the best and worst schools. States were ranked from best performing down to worst on a variety of measures covering school funding, academic achievement, and enrollment.
High rates of proficiency in reading and math and the share of students who graduate on time are direct measures of how effective a state’s school system is — and the highest ranking states on this list tend to do well in these measures. For example, in each of the top 10 states on this list, the share of 8th graders proficient in math and reading exceeds the 32.9% and 32.4% national averages. Similarly, in nine of the top 10 states, graduation rates exceed the 84.6% national average. Here is a look at the U.S. cities where students are most likely to graduate from high school.
Other data included in our index, like public school funding per pupil and preschool enrollment, do not reflect student outcomes but can often be indicative of school quality and a child’s likelihood for academic success. While there are countless external factors that can affect a child’s academic performance, including family income and parental educational attainment, we only included measures directly related to state school systems.
It is important to note that this list is intended to rank state school systems as a whole, and that a state’s ranking on this list is not indicative of school outcomes and quality in specific districts. Even in lower ranking states, there are schools and school districts with better than average outcomes. Here is a list of the best public high school in every state.
Click here to see the states with the best and worst schools
Click here to read our methodology

1. Massachusetts
> High school graduation rate: 88.3% (tied — 12th highest)
> Public school spending: $16,197 per pupil (7th highest)
> 3 & 4 yr. olds enrolled in preschool: 58.4% (4th highest)
> 8th grade proficiency: 47.4% math; 44.7% reading
> Adults with a bachelor’s degree: 44.5% (the highest)
See all stories featuring: Massachusetts
[in-text-ad]
2. New Jersey
> High school graduation rate: 90.5% (2nd highest)
> Public school spending: $18,920 per pupil (3rd highest)
> 3 & 4 yr. olds enrolled in preschool: 62.1% (the highest)
> 8th grade proficiency: 44.1% math; 42.9% reading
> Adults with a bachelor’s degree: 40.8% (3rd highest)
See all stories featuring: New Jersey
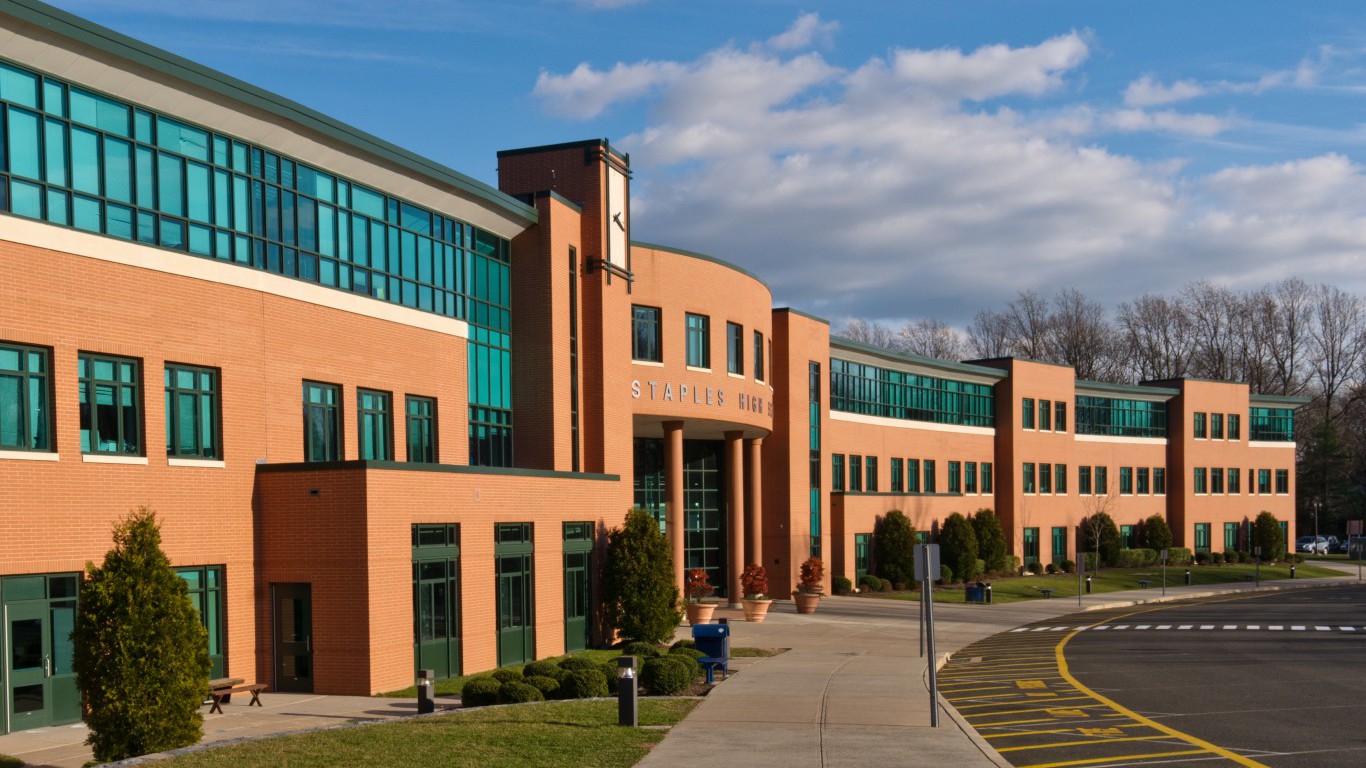
3. Connecticut
> High school graduation rate: 87.9% (15th highest)
> Public school spending: $19,322 per pupil (2nd highest)
> 3 & 4 yr. olds enrolled in preschool: 61.7% (3rd highest)
> 8th grade proficiency: 39.2% math; 41.0% reading
> Adults with a bachelor’s degree: 39.6% (5th highest)
See all stories featuring: Connecticut
4. New Hampshire
> High school graduation rate: 88.9% (10th highest)
> Public school spending: $15,683 per pupil (10th highest)
> 3 & 4 yr. olds enrolled in preschool: 57.6% (5th highest)
> 8th grade proficiency: 38.5% math; 37.7% reading
> Adults with a bachelor’s degree: 36.8% (9th highest)
See all stories featuring: New Hampshire
[in-text-ad-2]
5. Vermont
> High school graduation rate: 89.1% (tied — 8th highest)
> Public school spending: $18,290 per pupil (4th highest)
> 3 & 4 yr. olds enrolled in preschool: 61.7% (2nd highest)
> 8th grade proficiency: 38.3% math; 40.2% reading
> Adults with a bachelor’s degree: 38.7% (7th highest)
See all stories featuring: Vermont
6. Wyoming
> High school graduation rate: 86.2% (25th highest)
> Public school spending: $16,537 per pupil (6th highest)
> 3 & 4 yr. olds enrolled in preschool: 45.0% (25th lowest)
> 8th grade proficiency: 37.1% math; 33.9% reading
> Adults with a bachelor’s degree: 26.9% (9th lowest)
See all stories featuring: Wyoming
[in-text-ad]
7. Minnesota
> High school graduation rate: 82.7% (tied — 17th lowest)
> Public school spending: $12,647 per pupil (17th highest)
> 3 & 4 yr. olds enrolled in preschool: 49.6% (11th highest)
> 8th grade proficiency: 44.2% math; 34.2% reading
> Adults with a bachelor’s degree: 36.7% (10th highest)
See all stories featuring: Minnesota
8. Nebraska
> High school graduation rate: 89.1% (tied — 8th highest)
> Public school spending: $12,579 per pupil (19th highest)
> 3 & 4 yr. olds enrolled in preschool: 43.3% (19th lowest)
> 8th grade proficiency: 36.9% math; 33.8% reading
> Adults with a bachelor’s degree: 32.4% (19th highest)
See all stories featuring: Nebraska
9. Pennsylvania
> High school graduation rate: 86.6% (tied — 22nd highest)
> Public school spending: $15,798 per pupil (9th highest)
> 3 & 4 yr. olds enrolled in preschool: 46.9% (17th highest)
> 8th grade proficiency: 38.6% math; 35.2% reading
> Adults with a bachelor’s degree: 31.8% (22nd highest)
See all stories featuring: Pennsylvania
[in-text-ad-2]

10. Virginia
> High school graduation rate: 86.9% (tied — 19th highest)
> Public school spending: $11,886 per pupil (24th highest)
> 3 & 4 yr. olds enrolled in preschool: 48.1% (14th highest)
> 8th grade proficiency: 37.8% math; 33.2% reading
> Adults with a bachelor’s degree: 39.3% (6th highest)
See all stories featuring: Virginia
11. Wisconsin
> High school graduation rate: 88.6% (11th highest)
> Public school spending: $11,968 per pupil (22nd highest)
> 3 & 4 yr. olds enrolled in preschool: 37.1% (7th lowest)
> 8th grade proficiency: 41.3% math; 38.5% reading
> Adults with a bachelor’s degree: 30.0% (22nd lowest)
See all stories featuring: Wisconsin
[in-text-ad]
12. Illinois
> High school graduation rate: 87% (18th highest)
> Public school spending: $15,337 per pupil (11th highest)
> 3 & 4 yr. olds enrolled in preschool: 54.2% (7th highest)
> 8th grade proficiency: 33.8% math; 35.5% reading
> Adults with a bachelor’s degree: 35.1% (12th highest)
See all stories featuring: Illinois
13. Maryland
> High school graduation rate: 87.7% (16th highest)
> Public school spending: $14,848 per pupil (13th highest)
> 3 & 4 yr. olds enrolled in preschool: 47.6% (15th highest)
> 8th grade proficiency: 32.6% math; 36.0% reading
> Adults with a bachelor’s degree: 40.8% (3rd highest)
See all stories featuring: Maryland
14. Maine
> High school graduation rate: 86.9% (tied — 19th highest)
> Public school spending: $13,690 per pupil (16th highest)
> 3 & 4 yr. olds enrolled in preschool: 53.5% (8th highest)
> 8th grade proficiency: 33.6% math; 35.5% reading
> Adults with a bachelor’s degree: 31.5% (24th highest)
See all stories featuring: Maine
[in-text-ad-2]
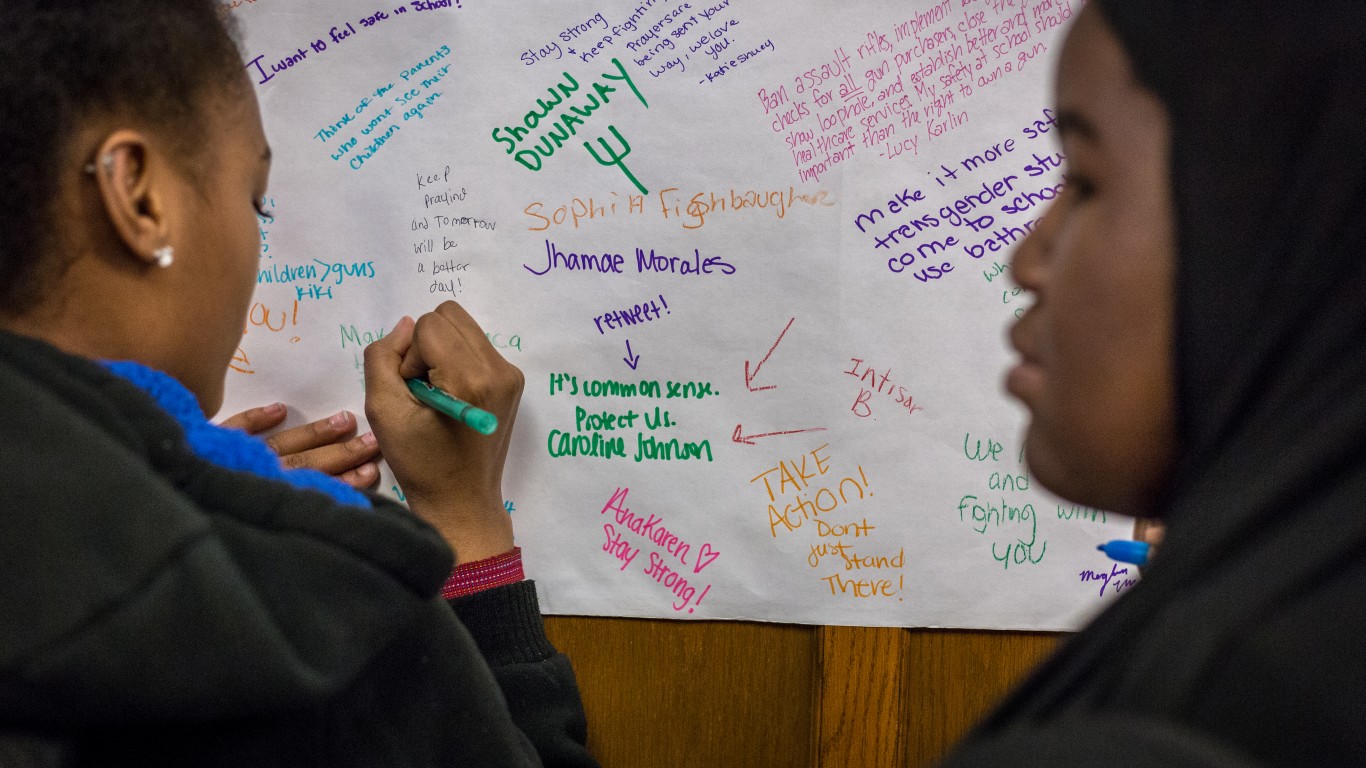
15. Iowa
> High school graduation rate: 91% (the highest)
> Public school spending: $11,461 per pupil (25th lowest)
> 3 & 4 yr. olds enrolled in preschool: 45.4% (21st highest)
> 8th grade proficiency: 32.6% math; 32.6% reading
> Adults with a bachelor’s degree: 29.0% (16th lowest)
See all stories featuring: Iowa
16. New York
> High school graduation rate: 81.8% (12th lowest)
> Public school spending: $23,091 per pupil (the highest)
> 3 & 4 yr. olds enrolled in preschool: 55.0% (6th highest)
> 8th grade proficiency: 33.5% math; 32.5% reading
> Adults with a bachelor’s degree: 37.2% (8th highest)
See all stories featuring: New York
[in-text-ad]
17. Colorado
> High school graduation rate: 79.1% (6th lowest)
> Public school spending: $9,809 per pupil (12th lowest)
> 3 & 4 yr. olds enrolled in preschool: 49.9% (9th highest)
> 8th grade proficiency: 36.9% math; 37.7% reading
> Adults with a bachelor’s degree: 41.7% (2nd highest)
See all stories featuring: Colorado
18. Indiana
> High school graduation rate: 83.8% (21st lowest)
> Public school spending: $10,045 per pupil (16th lowest)
> 3 & 4 yr. olds enrolled in preschool: 37.7% (8th lowest)
> 8th grade proficiency: 37.4% math; 37.0% reading
> Adults with a bachelor’s degree: 27.1% (10th lowest)
See all stories featuring: Indiana
19. Ohio
> High school graduation rate: 84.2% (23rd lowest)
> Public school spending: $12,645 per pupil (18th highest)
> 3 & 4 yr. olds enrolled in preschool: 43.6% (21st lowest)
> 8th grade proficiency: 37.5% math; 38.1% reading
> Adults with a bachelor’s degree: 29.0% (16th lowest)
See all stories featuring: Ohio
[in-text-ad-2]
20. Montana
> High school graduation rate: 85.8% (24th lowest)
> Public school spending: $11,443 per pupil (24th lowest)
> 3 & 4 yr. olds enrolled in preschool: 41.4% (17th lowest)
> 8th grade proficiency: 35.7% math; 34.3% reading
> Adults with a bachelor’s degree: 31.7% (23rd highest)
See all stories featuring: Montana
21. Delaware
> High school graduation rate: 86.9% (tied — 19th highest)
> Public school spending: $15,302 per pupil (12th highest)
> 3 & 4 yr. olds enrolled in preschool: 48.7% (12th highest)
> 8th grade proficiency: 29.2% math; 31.0% reading
> Adults with a bachelor’s degree: 31.3% (25th highest)
See all stories featuring: Delaware
[in-text-ad]
22. Utah
> High school graduation rate: 86% (25th lowest)
> Public school spending: $7,179 per pupil (the lowest)
> 3 & 4 yr. olds enrolled in preschool: 38.0% (10th lowest)
> 8th grade proficiency: 37.3% math; 37.8% reading
> Adults with a bachelor’s degree: 34.9% (13th highest)
See all stories featuring: Utah

23. Florida
> High school graduation rate: 82.3% (13th lowest)
> Public school spending: $9,075 per pupil (7th lowest)
> 3 & 4 yr. olds enrolled in preschool: 49.9% (10th highest)
> 8th grade proficiency: 30.6% math; 33.9% reading
> Adults with a bachelor’s degree: 30.4% (25th lowest)
See all stories featuring: Florida
24. Washington
> High school graduation rate: 79.4% (7th lowest)
> Public school spending: $11,989 per pupil (21st highest)
> 3 & 4 yr. olds enrolled in preschool: 45.0% (25th highest)
> 8th grade proficiency: 40.0% math; 38.5% reading
> Adults with a bachelor’s degree: 36.7% (10th highest)
See all stories featuring: Washington
[in-text-ad-2]
25. North Carolina
> High school graduation rate: 86.6% (tied — 22nd highest)
> Public school spending: $9,072 per pupil (6th lowest)
> 3 & 4 yr. olds enrolled in preschool: 43.8% (22nd lowest)
> 8th grade proficiency: 36.5% math; 32.9% reading
> Adults with a bachelor’s degree: 31.9% (20th highest)
See all stories featuring: North Carolina
26. Missouri
> High school graduation rate: 88.3% (tied — 12th highest)
> Public school spending: $10,589 per pupil (19th lowest)
> 3 & 4 yr. olds enrolled in preschool: 47.0% (16th highest)
> 8th grade proficiency: 31.6% math; 33.3% reading
> Adults with a bachelor’s degree: 29.5% (18th lowest)
See all stories featuring: Missouri
[in-text-ad]

27. South Dakota
> High school graduation rate: 83.7% (20th lowest)
> Public school spending: $9,939 per pupil (14th lowest)
> 3 & 4 yr. olds enrolled in preschool: 37.8% (9th lowest)
> 8th grade proficiency: 39.4% math; 31.9% reading
> Adults with a bachelor’s degree: 29.2% (17th lowest)
See all stories featuring: South Dakota
28. Rhode Island
> High school graduation rate: 84.1% (22nd lowest)
> Public school spending: $15,943 per pupil (8th highest)
> 3 & 4 yr. olds enrolled in preschool: 33.9% (the lowest)
> 8th grade proficiency: 29.5% math; 35.0% reading
> Adults with a bachelor’s degree: 34.4% (14th highest)
See all stories featuring: Rhode Island
29. Kentucky
> High school graduation rate: 89.7% (tied — 4th highest)
> Public school spending: $10,121 per pupil (17th lowest)
> 3 & 4 yr. olds enrolled in preschool: 42.7% (18th lowest)
> 8th grade proficiency: 29.0% math; 33.4% reading
> Adults with a bachelor’s degree: 24.8% (5th lowest)
See all stories featuring: Kentucky
[in-text-ad-2]
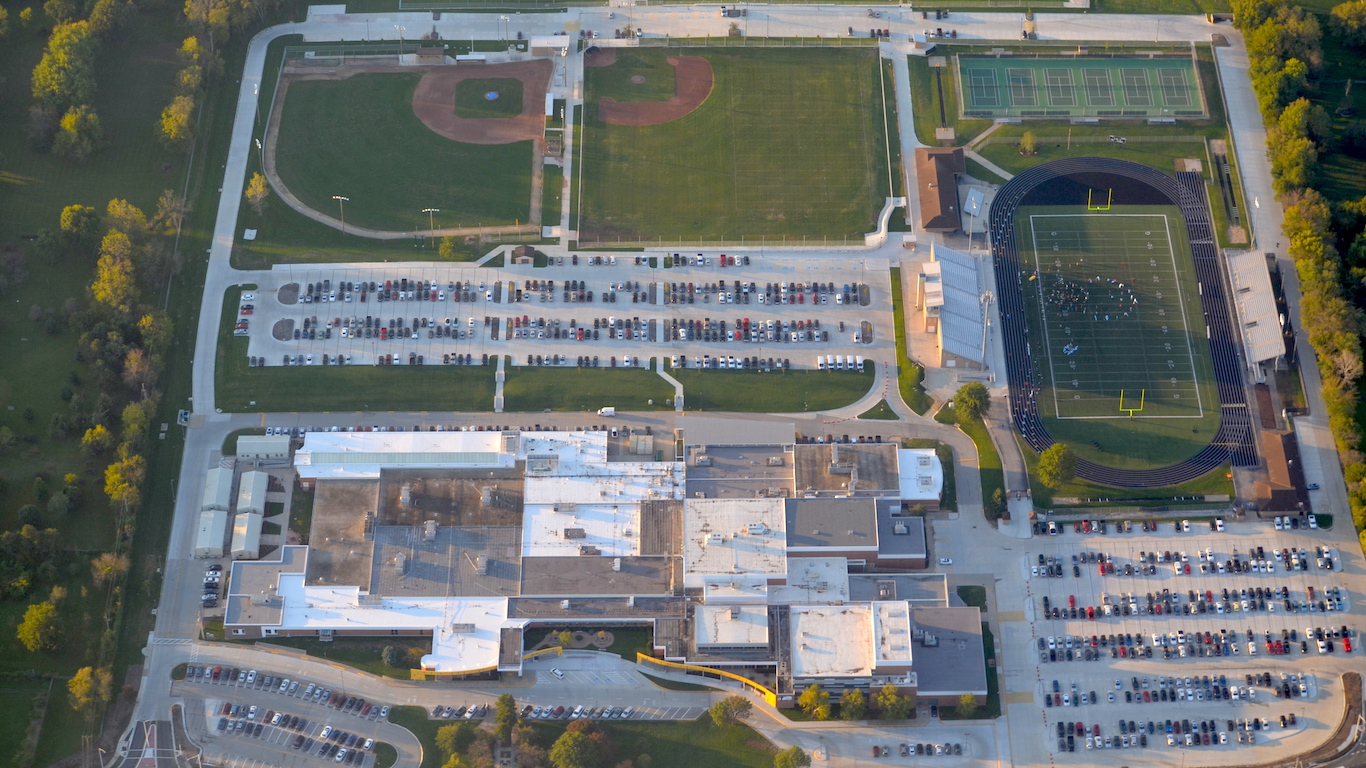
30. Kansas
> High school graduation rate: 86.5% (24th highest)
> Public school spending: $10,961 per pupil (21st lowest)
> 3 & 4 yr. olds enrolled in preschool: 45.8% (19th highest)
> 8th grade proficiency: 32.9% math; 32.3% reading
> Adults with a bachelor’s degree: 33.8% (17th highest)
See all stories featuring: Kansas
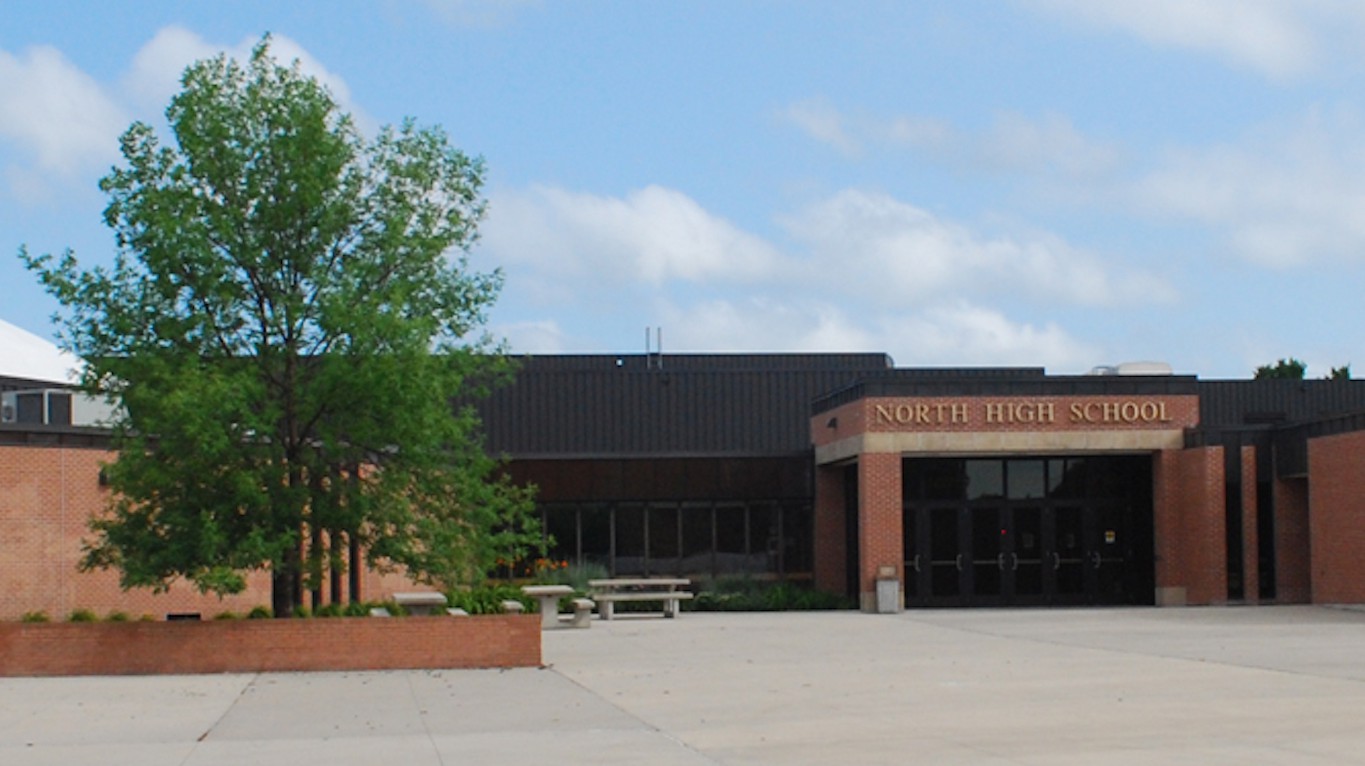
31. North Dakota
> High school graduation rate: 87.2% (17th highest)
> Public school spending: $13,760 per pupil (15th highest)
> 3 & 4 yr. olds enrolled in preschool: 38.5% (11th lowest)
> 8th grade proficiency: 37.4% math; 31.6% reading
> Adults with a bachelor’s degree: 29.7% (21st lowest)
See all stories featuring: North Dakota
[in-text-ad]
32. Tennessee
> High school graduation rate: 89.8% (3rd highest)
> Public school spending: $9,184 per pupil (8th lowest)
> 3 & 4 yr. olds enrolled in preschool: 35.3% (5th lowest)
> 8th grade proficiency: 31.2% math; 31.6% reading
> Adults with a bachelor’s degree: 27.5% (11th lowest)
See all stories featuring: Tennessee

33. Idaho
> High school graduation rate: 79.7% (8th lowest)
> Public school spending: $7,486 per pupil (2nd lowest)
> 3 & 4 yr. olds enrolled in preschool: 36.0% (6th lowest)
> 8th grade proficiency: 37.3% math; 37.1% reading
> Adults with a bachelor’s degree: 27.7% (13th lowest)
See all stories featuring: Idaho
34. Arkansas
> High school graduation rate: 88% (14th highest)
> Public school spending: $9,967 per pupil (15th lowest)
> 3 & 4 yr. olds enrolled in preschool: 45.4% (22nd highest)
> 8th grade proficiency: 27.3% math; 29.5% reading
> Adults with a bachelor’s degree: 23.3% (3rd lowest)
See all stories featuring: Arkansas
[in-text-ad-2]
35. California
> High school graduation rate: 82.7% (tied — 17th lowest)
> Public school spending: $12,143 per pupil (20th highest)
> 3 & 4 yr. olds enrolled in preschool: 45.6% (20th highest)
> 8th grade proficiency: 28.5% math; 29.8% reading
> Adults with a bachelor’s degree: 34.2% (15th highest)
See all stories featuring: California
36. Texas
> High school graduation rate: 89.7% (tied — 4th highest)
> Public school spending: $9,375 per pupil (10th lowest)
> 3 & 4 yr. olds enrolled in preschool: 38.7% (12th lowest)
> 8th grade proficiency: 29.6% math; 25.0% reading
> Adults with a bachelor’s degree: 30.3% (24th lowest)
See all stories featuring: Texas
[in-text-ad]
37. Georgia
> High school graduation rate: 80.6% (10th lowest)
> Public school spending: $10,205 per pupil (18th lowest)
> 3 & 4 yr. olds enrolled in preschool: 46.1% (18th highest)
> 8th grade proficiency: 31.1% math; 32.1% reading
> Adults with a bachelor’s degree: 31.9% (20th highest)
See all stories featuring: Georgia
38. Michigan
> High school graduation rate: 80.2% (9th lowest)
> Public school spending: $11,907 per pupil (23rd highest)
> 3 & 4 yr. olds enrolled in preschool: 43.5% (20th lowest)
> 8th grade proficiency: 31.0% math; 31.5% reading
> Adults with a bachelor’s degree: 29.6% (19th lowest)
See all stories featuring: Michigan
39. Oregon
> High school graduation rate: 76.7% (2nd lowest)
> Public school spending: $11,264 per pupil (23rd lowest)
> 3 & 4 yr. olds enrolled in preschool: 45.2% (23rd highest)
> 8th grade proficiency: 31.4% math; 34.0% reading
> Adults with a bachelor’s degree: 34.0% (16th highest)
See all stories featuring: Oregon
[in-text-ad-2]
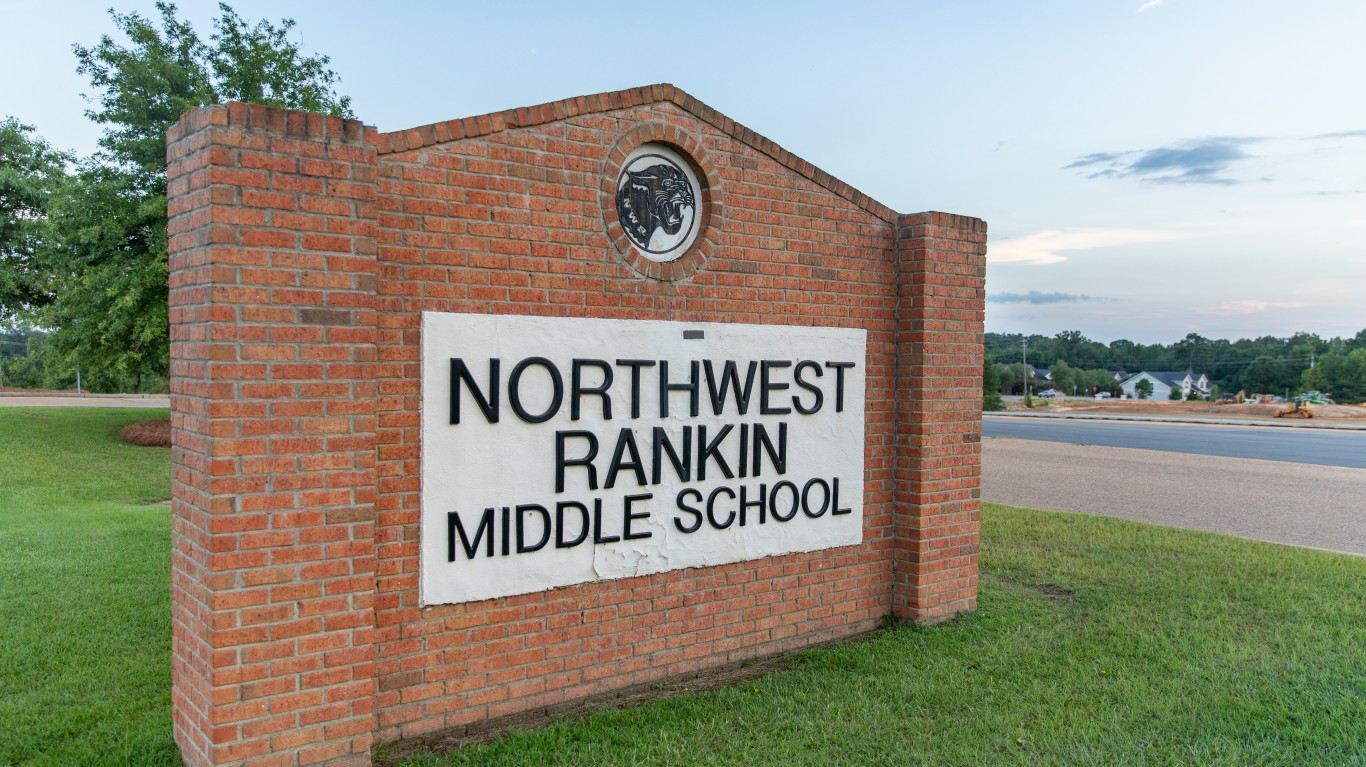
40. Mississippi
> High school graduation rate: 83% (18th lowest)
> Public school spending: $8,771 per pupil (5th lowest)
> 3 & 4 yr. olds enrolled in preschool: 45.1% (24th highest)
> 8th grade proficiency: 24.3% math; 25.0% reading
> Adults with a bachelor’s degree: 23.2% (2nd lowest)
See all stories featuring: Mississippi
41. South Carolina
> High school graduation rate: 83.6% (19th lowest)
> Public school spending: $10,590 per pupil (20th lowest)
> 3 & 4 yr. olds enrolled in preschool: 39.1% (13th lowest)
> 8th grade proficiency: 28.9% math; 29.3% reading
> Adults with a bachelor’s degree: 28.3% (14th lowest)
See all stories featuring: South Carolina
[in-text-ad]
42. Hawaii
> High school graduation rate: 82.7% (tied — 17th lowest)
> Public school spending: $14,322 per pupil (14th highest)
> 3 & 4 yr. olds enrolled in preschool: 44.2% (23rd lowest)
> 8th grade proficiency: 27.7% math; 29.2% reading
> Adults with a bachelor’s degree: 33.5% (18th highest)
See all stories featuring: Hawaii
43. Alaska
> High school graduation rate: 78.2% (5th lowest)
> Public school spending: $17,838 per pupil (5th highest)
> 3 & 4 yr. olds enrolled in preschool: 44.3% (24th lowest)
> 8th grade proficiency: 29.0% math; 23.3% reading
> Adults with a bachelor’s degree: 30.2% (23rd lowest)
See all stories featuring: Alaska
44. Oklahoma
> High school graduation rate: 82.6% (14th lowest)
> Public school spending: $7,940 per pupil (3rd lowest)
> 3 & 4 yr. olds enrolled in preschool: 41.4% (16th lowest)
> 8th grade proficiency: 25.5% math; 25.6% reading
> Adults with a bachelor’s degree: 25.6% (8th lowest)
See all stories featuring: Oklahoma
[in-text-ad-2]
45. Arizona
> High school graduation rate: 78% (3rd lowest)
> Public school spending: $8,003 per pupil (4th lowest)
> 3 & 4 yr. olds enrolled in preschool: 35.1% (3rd lowest)
> 8th grade proficiency: 31.0% math; 28.4% reading
> Adults with a bachelor’s degree: 29.7% (21st lowest)
See all stories featuring: Arizona
46. Alabama
> High school graduation rate: 89.3% (7th highest)
> Public school spending: $9,511 per pupil (11th lowest)
> 3 & 4 yr. olds enrolled in preschool: 40.9% (15th lowest)
> 8th grade proficiency: 21.3% math; 23.6% reading
> Adults with a bachelor’s degree: 25.5% (7th lowest)
See all stories featuring: Alabama
[in-text-ad]
47. West Virginia
> High school graduation rate: 89.4% (6th highest)
> Public school spending: $11,554 per pupil (25th highest)
> 3 & 4 yr. olds enrolled in preschool: 34.6% (2nd lowest)
> 8th grade proficiency: 24.1% math; 25.3% reading
> Adults with a bachelor’s degree: 21.3% (the lowest)
See all stories featuring: West Virginia
48. Nevada
> High school graduation rate: 80.9% (11th lowest)
> Public school spending: $9,320 per pupil (9th lowest)
> 3 & 4 yr. olds enrolled in preschool: 35.1% (4th lowest)
> 8th grade proficiency: 25.7% math; 28.6% reading
> Adults with a bachelor’s degree: 24.9% (6th lowest)
See all stories featuring: Nevada
49. Louisiana
> High school graduation rate: 78.1% (4th lowest)
> Public school spending: $11,199 per pupil (22nd lowest)
> 3 & 4 yr. olds enrolled in preschool: 48.3% (13th highest)
> 8th grade proficiency: 23.1% math; 27.2% reading
> Adults with a bachelor’s degree: 24.3% (4th lowest)
See all stories featuring: Louisiana
[in-text-ad-2]
50. New Mexico
> High school graduation rate: 71.1% (the lowest)
> Public school spending: $9,881 per pupil (13th lowest)
> 3 & 4 yr. olds enrolled in preschool: 40.4% (14th lowest)
> 8th grade proficiency: 20.7% math; 23.3% reading
> Adults with a bachelor’s degree: 27.7% (13th lowest)
See all stories featuring: New Mexico
The Average American Has No Idea How Much Money You Can Make Today (Sponsor)
The last few years made people forget how much banks and CD’s can pay. Meanwhile, interest rates have spiked and many can afford to pay you much more, but most are keeping yields low and hoping you won’t notice.
But there is good news. To win qualified customers, some accounts are paying almost 10x the national average! That’s an incredible way to keep your money safe and earn more at the same time. Our top pick for high yield savings accounts includes other benefits as well. You can earn up to 3.80% with a Checking & Savings Account today Sign up and get up to $300 with direct deposit. No account fees. FDIC Insured.
Click here to see how much more you could be earning on your savings today. It takes just a few minutes to open an account to make your money work for you.
Our top pick for high yield savings accounts includes other benefits as well. You can earn up to 4.00% with a Checking & Savings Account from Sofi. Sign up and get up to $300 with direct deposit. No account fees. FDIC Insured.
Thank you for reading! Have some feedback for us?
Contact the 24/7 Wall St. editorial team.
 24/7 Wall St.



 24/7 Wall St.
 24/7 Wall St.
