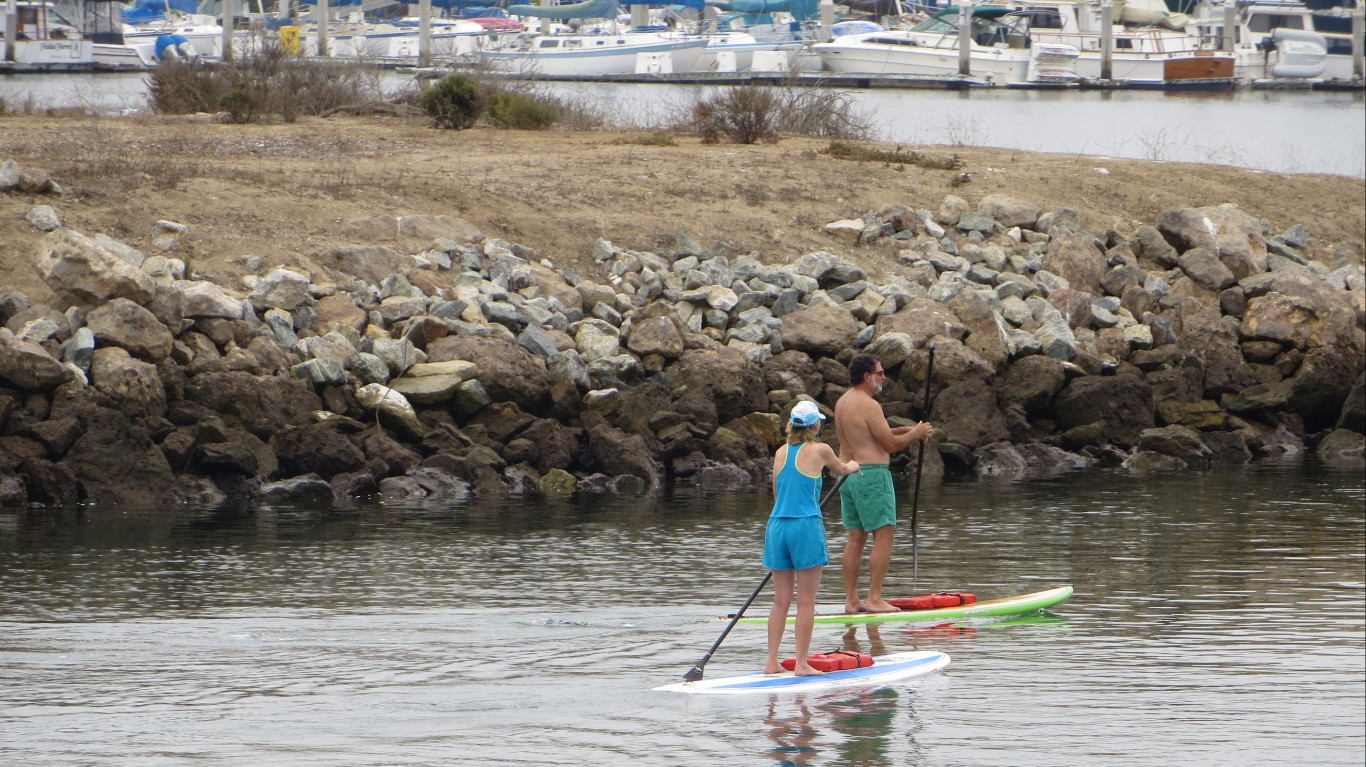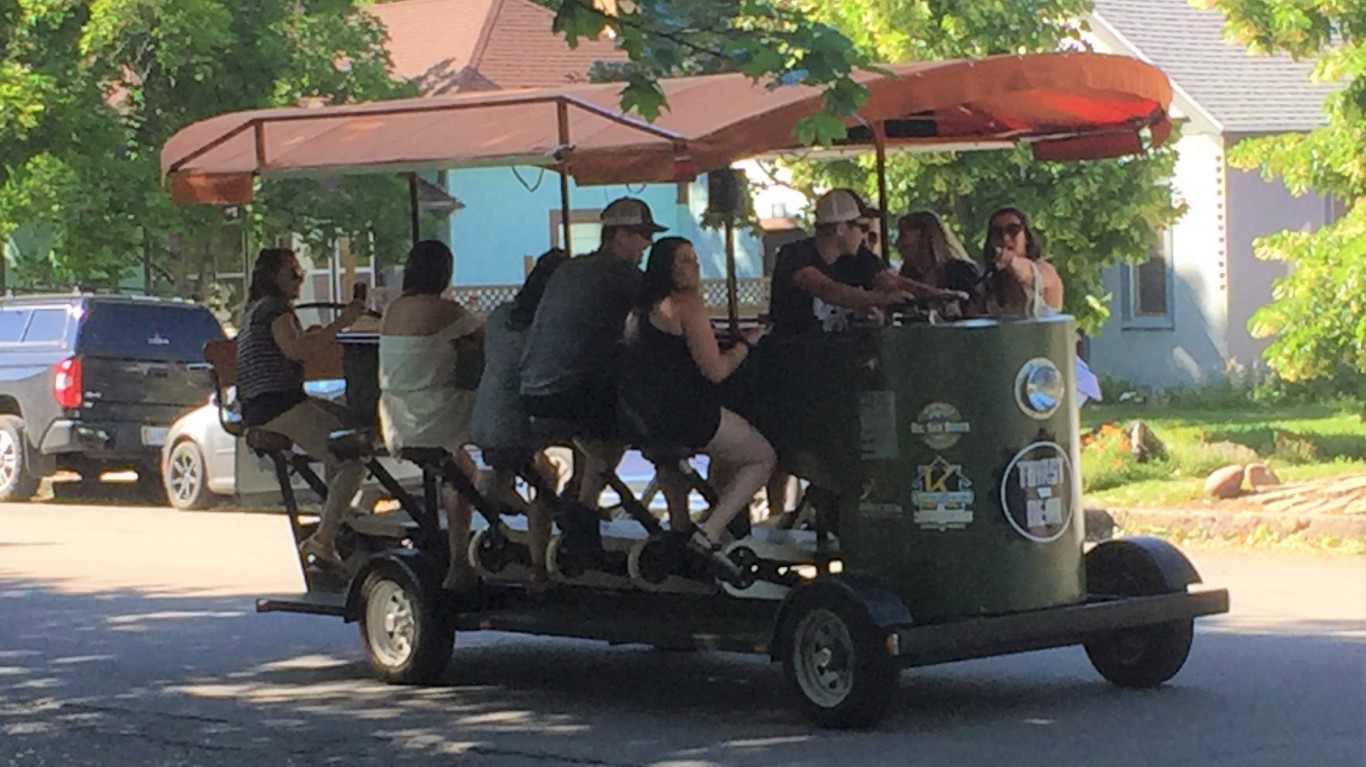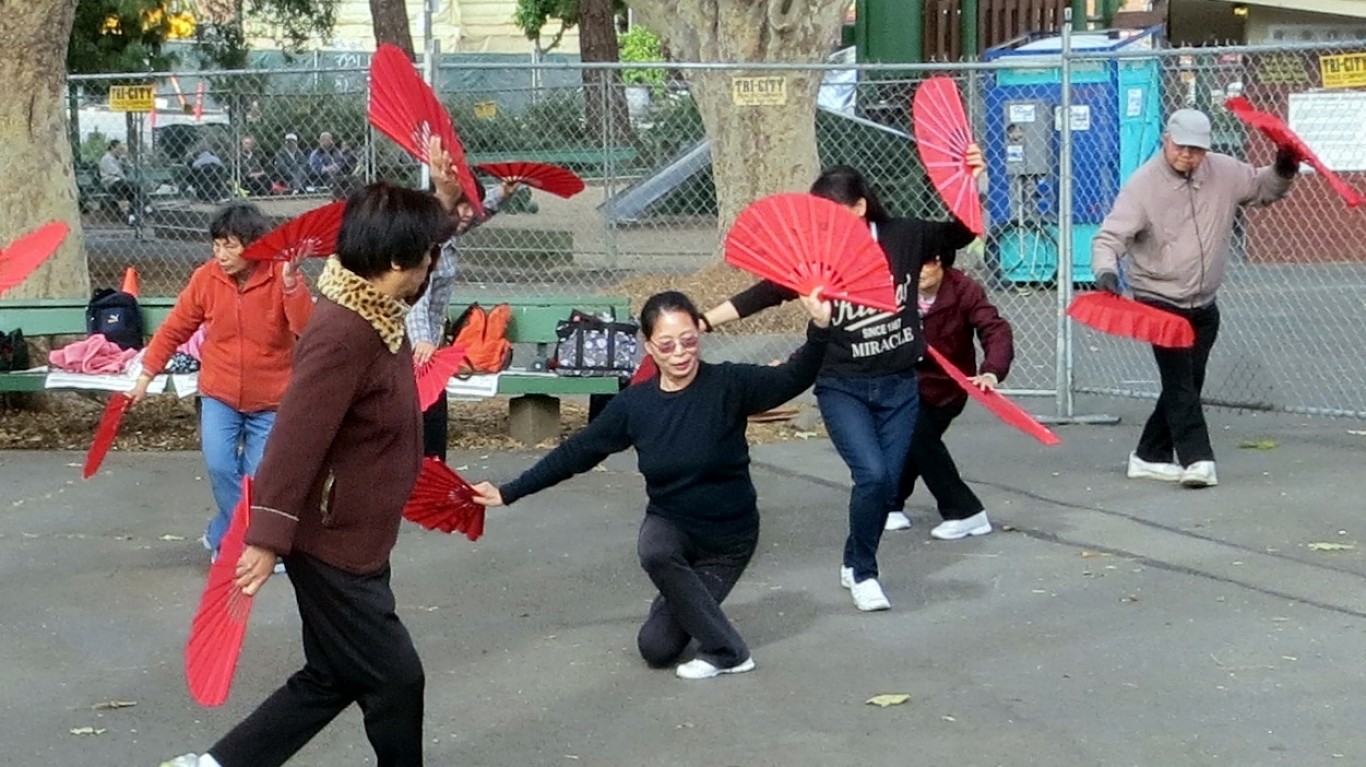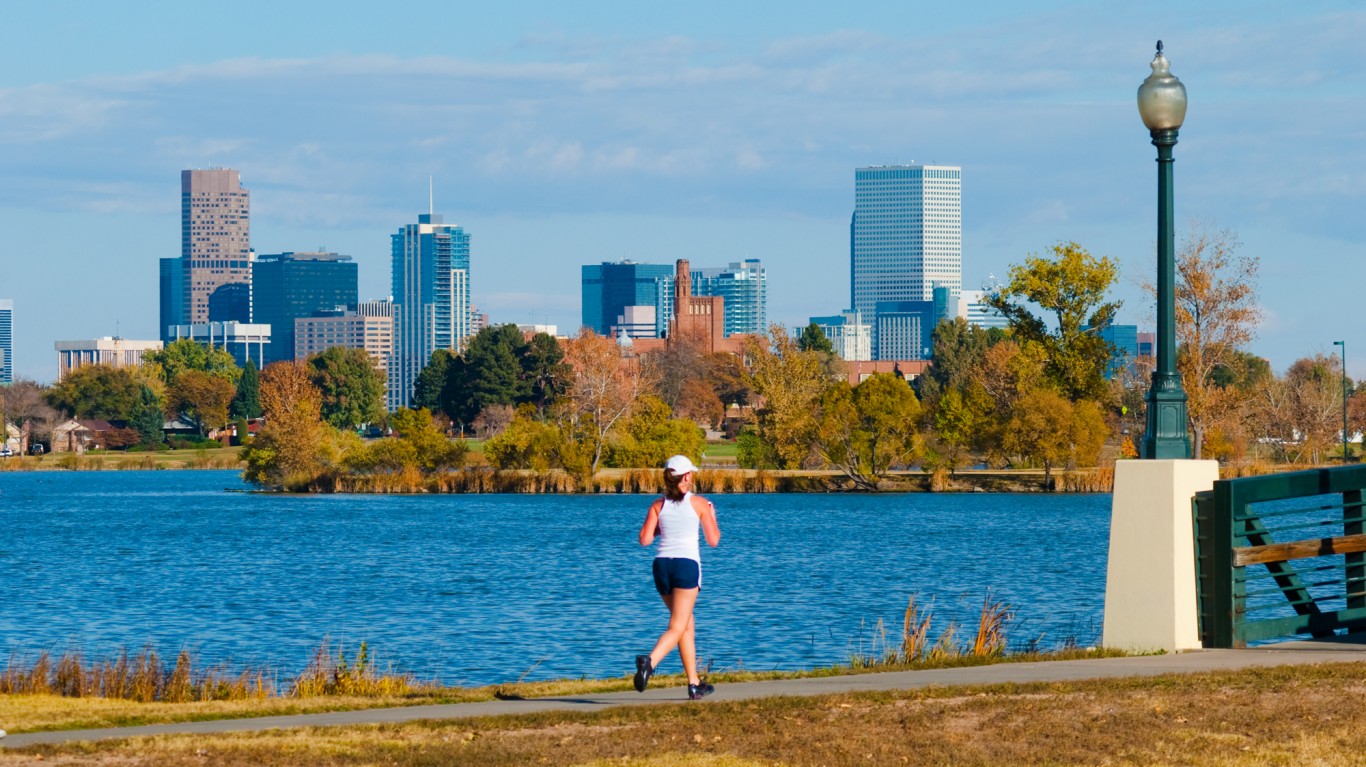
It seems like a contradiction but as obesity is on the rise, so is the number of Americans who exercise. Almost 40% of adults and nearly 20% of adolescents in the country are obese, the highest percentage ever recorded. But the share of adults who now meet or exceed federal exercise guidelines — 150 minutes of moderate aerobic exercise or 75 minutes of vigorous physical activity a week – increased from 18.2% in 2008 to 24.3% by 2017, according to the Centers for Disease Control and Prevention.
The share of inactive adults and those who exercise regularly varies greatly from city to city. 24/7 Tempo reviewed data from the 2019 County Health Rankings & Roadmaps report to determine which cities have the most active residents.
There is one emerging trend: metropolitan areas in western states from California to Colorado have relatively higher shares of adults who report regular leisure-time physical activity, including working out and other activities people engage in outside of work and in their free time.
The most physically active cities are clustered in a few regions. Ten of the 15 cities where the highest shares of adults exercise are either in California or Oregon. In contrast, many cities where the lowest percentage of adults are physically active are in the South.
One of the most accessible exercises, which also happens to be completely free — is walking. It’s easy to forget that walking is actually an aerobic activity — here are 30 reasons why walking is the best exercise.
Click here for the 50 cities getting the most exercise
Click here to read our detailed findings and methodology
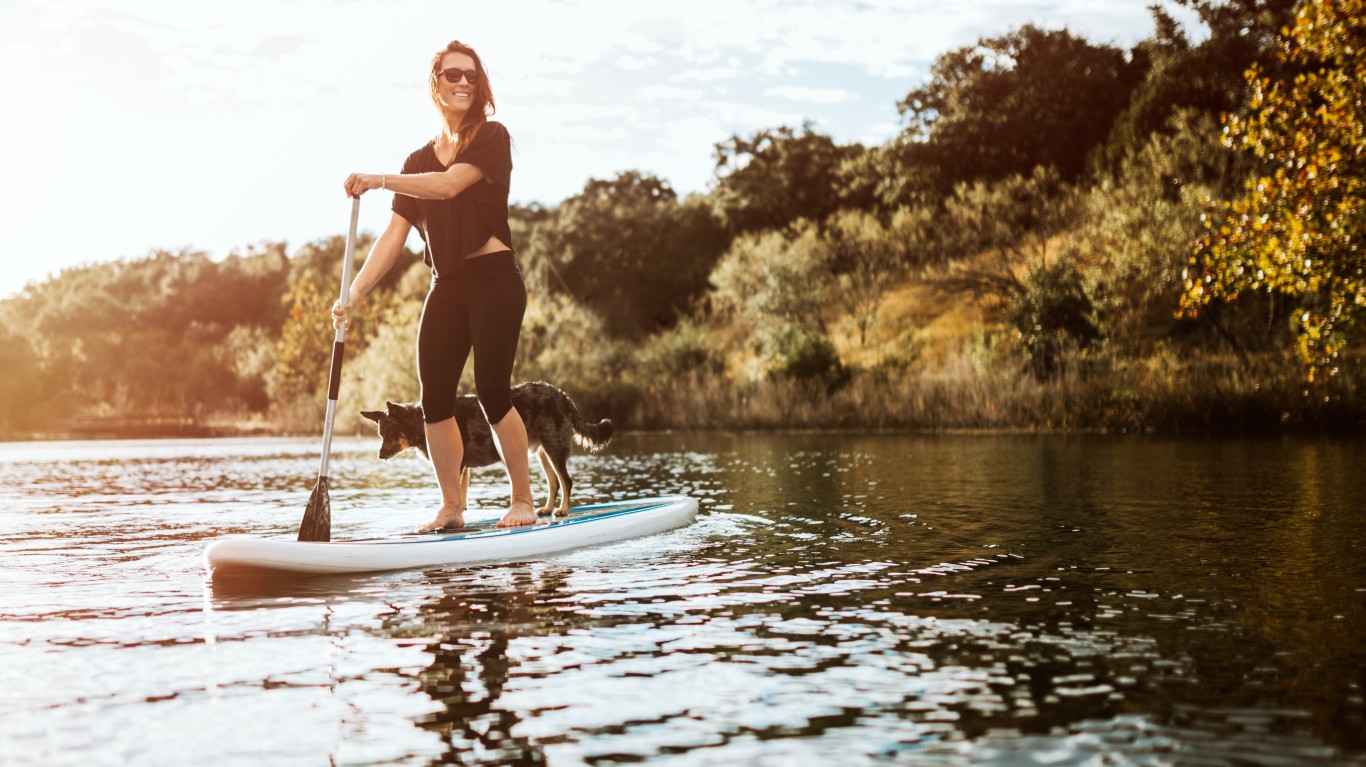
50. Austin-Round Rock, TX
> Adults who exercise regularly: 83.2% (38th highest)
> Pop. with access to places for physical activity: 87.0% (99th highest)
> Recreational and sports facilities: 313, or 14.8 per 100K (51st highest)
> Adult obesity rate: 25.2% (42nd lowest)
> Median household income: $76,925 (28th highest)
> Population: 2,168,316
[in-text-ad]
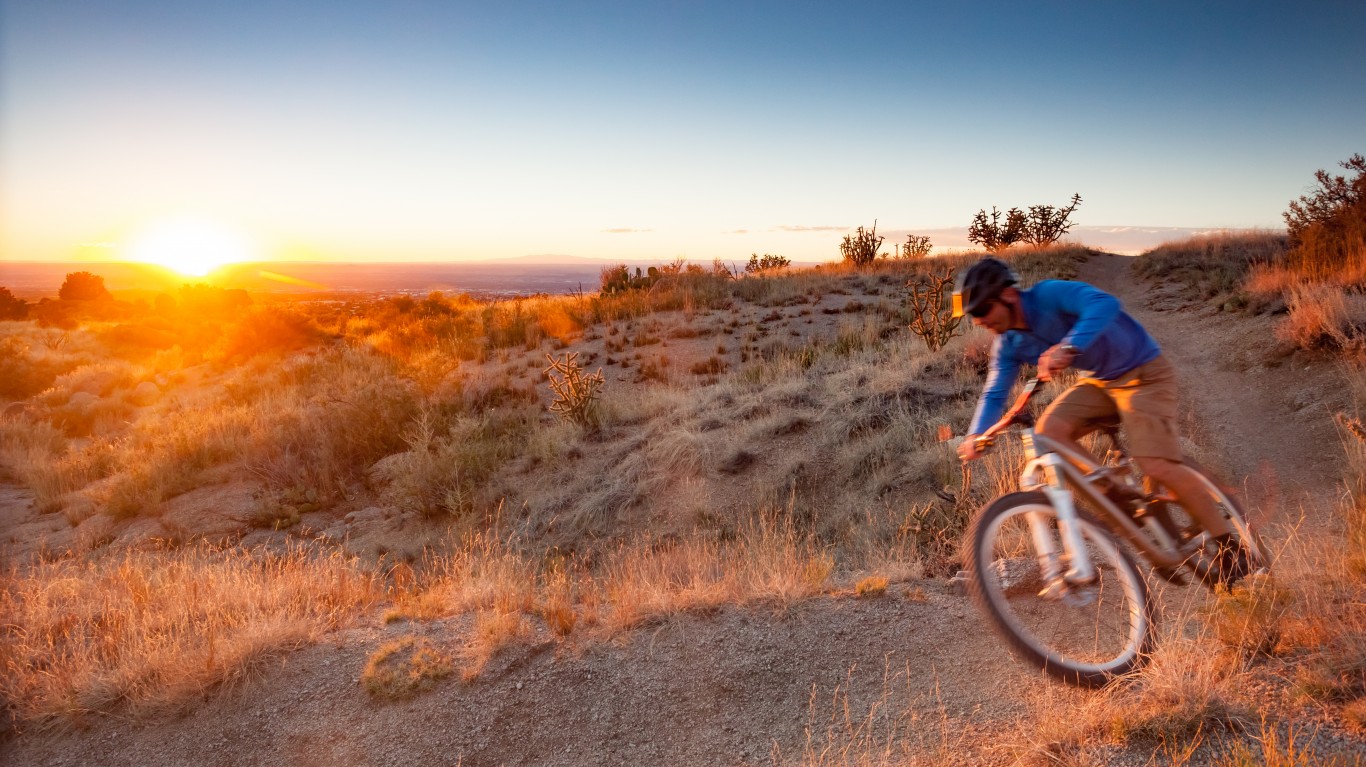
49. Albuquerque, NM
> Adults who exercise regularly: 84.2% (28th highest)
> Pop. with access to places for physical activity: 84.8% (131st highest)
> Recreational and sports facilities: 93, or 10.2 per 100K (187th lowest)
> Adult obesity rate: 23.9% (33rd lowest)
> Median household income: $51,134 (269th highest)
> Population: 916,791
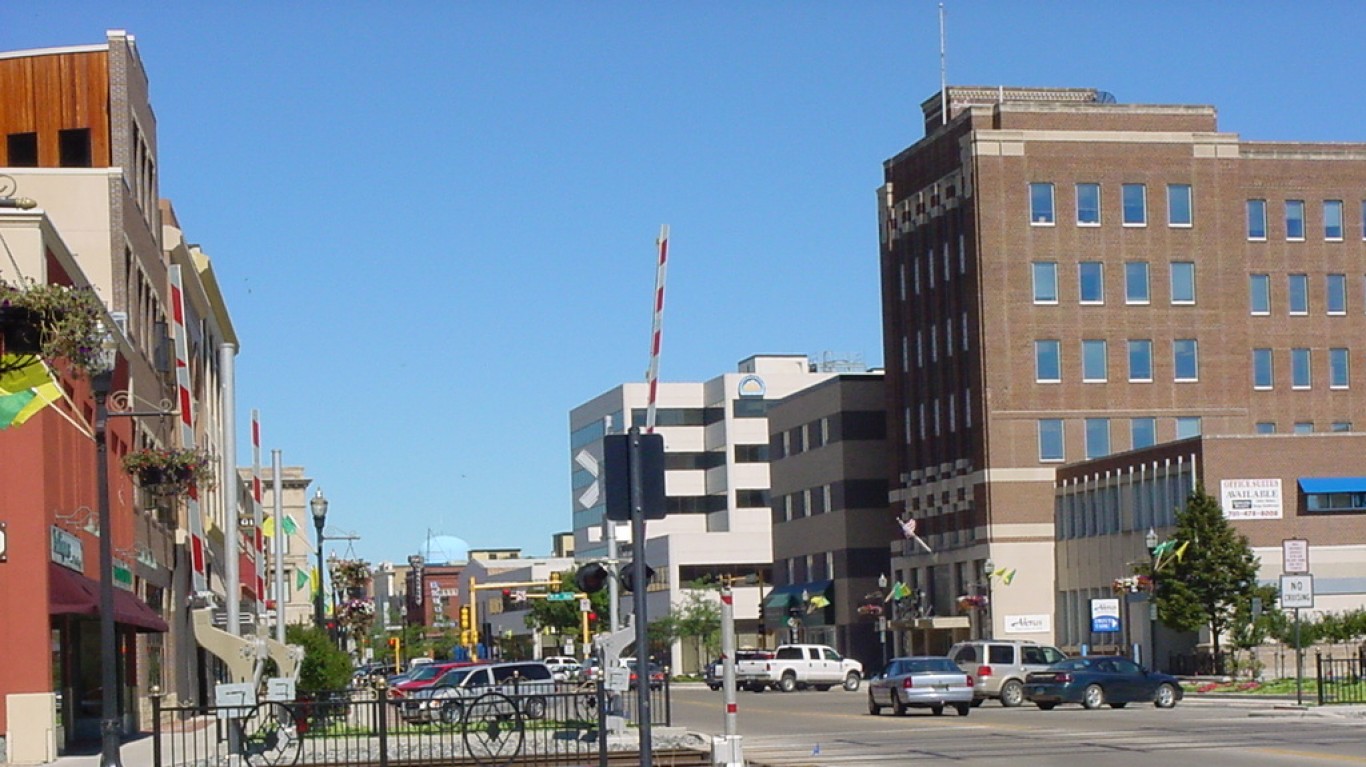
48. Fargo, ND-MN
> Adults who exercise regularly: 82.7% (54th highest)
> Pop. with access to places for physical activity: 88.3% (85th highest)
> Recreational and sports facilities: 39, or 16.2 per 100K (30th highest)
> Adult obesity rate: 30.7% (186th lowest)
> Median household income: $65,073 (76th highest)
> Population: 245,471
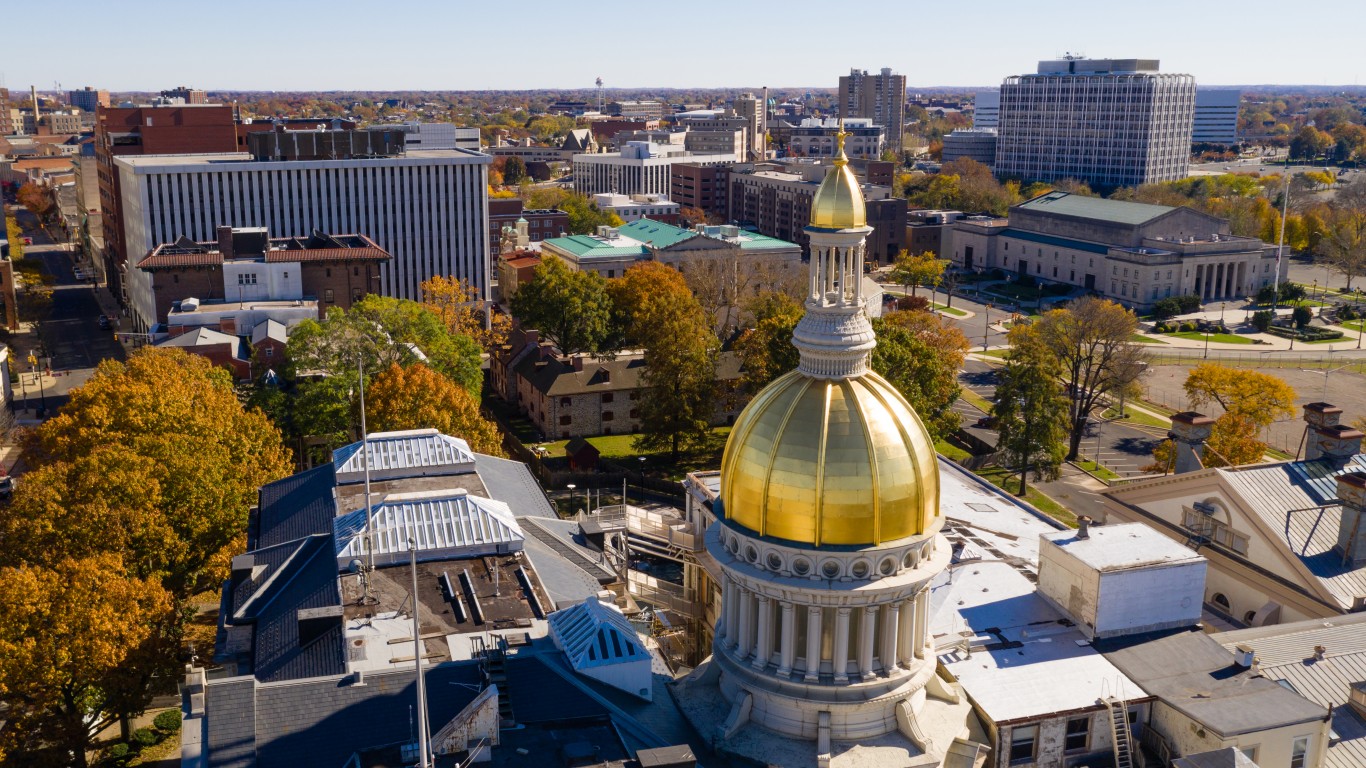
47. Trenton, NJ
> Adults who exercise regularly: 78.0% (154th highest)
> Pop. with access to places for physical activity: 98.6% (3rd highest)
> Recreational and sports facilities: 63, or 16.8 per 100K (22nd highest)
> Adult obesity rate: 25.2% (43rd lowest)
> Median household income: $80,632 (18th highest)
> Population: 369,811
[in-text-ad-2]
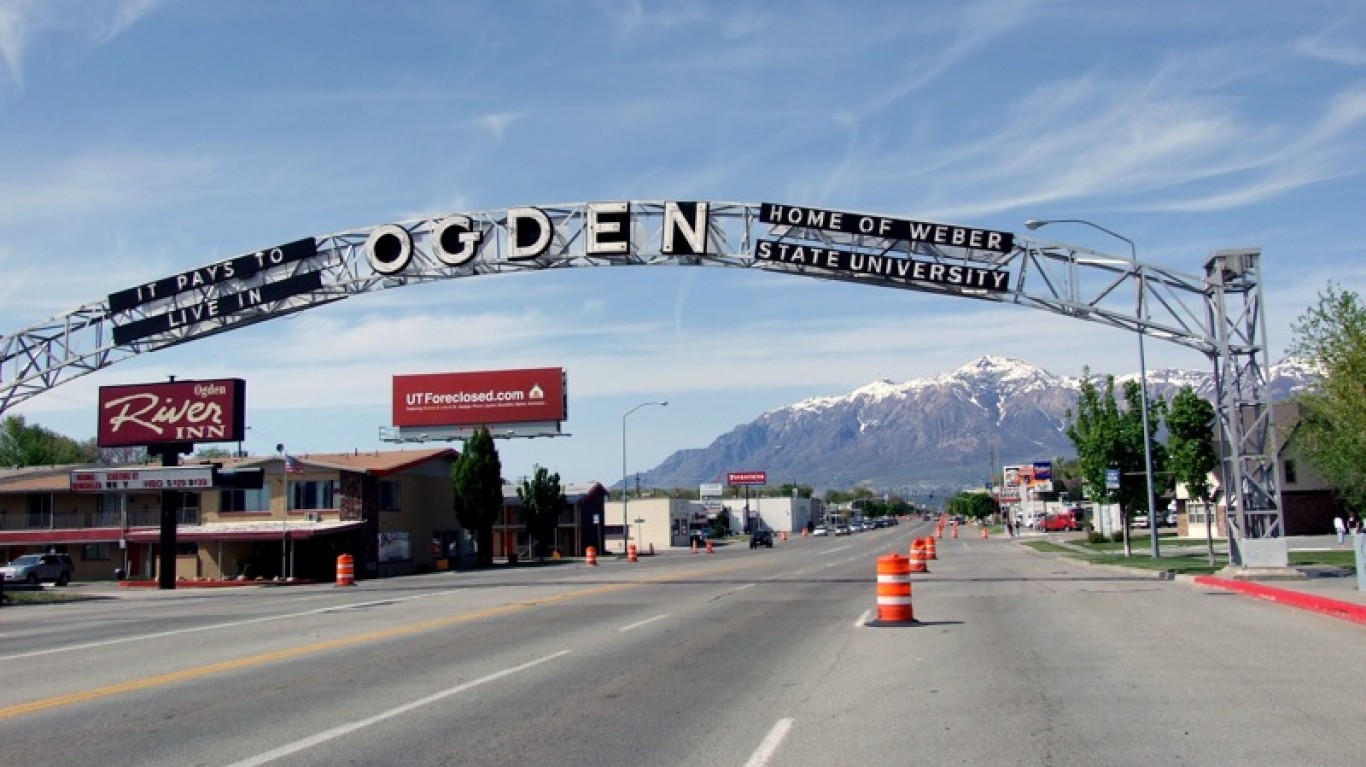
46. Ogden-Clearfield, UT
> Adults who exercise regularly: 82.7% (53rd highest)
> Pop. with access to places for physical activity: 88.3% (84th highest)
> Recreational and sports facilities: 44, or 6.6 per 100K (51st lowest)
> Adult obesity rate: 28.2% (122nd lowest)
> Median household income: $76,653 (29th highest)
> Population: 676,948

45. Hartford-West Hartford-East Hartford, CT
> Adults who exercise regularly: 80.1% (95th highest)
> Pop. with access to places for physical activity: 94.2% (26th highest)
> Recreational and sports facilities: 188, or 15.5 per 100K (38th highest)
> Adult obesity rate: 25.5% (53rd lowest)
> Median household income: $77,258 (26th highest)
> Population: 1,206,300
[in-text-ad]
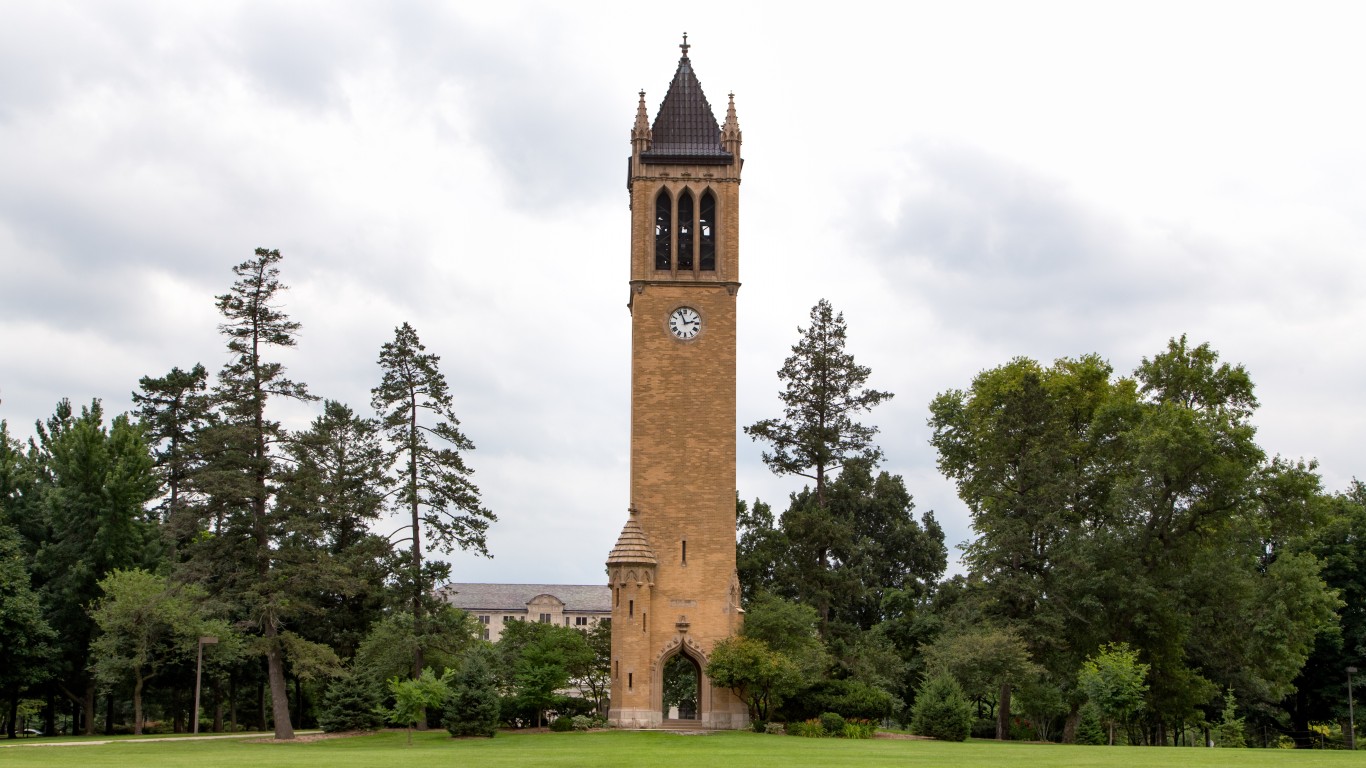
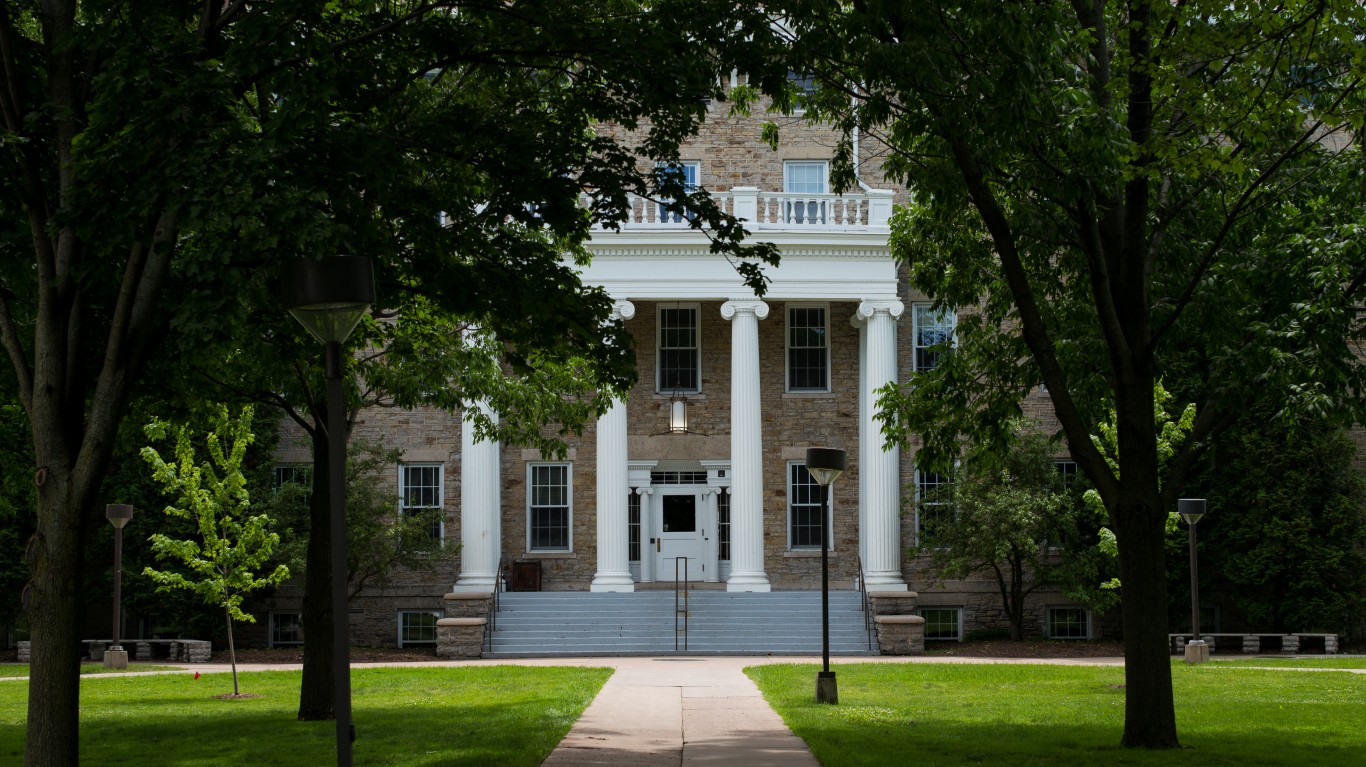
44. Ames, IA
> Adults who exercise regularly: 81.4% (75th highest)
> Pop. with access to places for physical activity: 92.1% (44th highest)
> Recreational and sports facilities: 18, or 18.5 per 100K (15th highest)
> Adult obesity rate: 27.7% (107th lowest)
> Median household income: $54,586 (171st lowest)
> Population: 98,105
43. Bremerton-Silverdale, WA
> Adults who exercise regularly: 84.7% (21st highest)
> Pop. with access to places for physical activity: 85.1% (125th highest)
> Recreational and sports facilities: 29, or 10.9 per 100K (163rd highest)
> Adult obesity rate: 30.3% (179th lowest)
> Median household income: $76,945 (27th highest)
> Population: 269,805
42. Vallejo-Fairfield, CA
> Adults who exercise regularly: 79.3% (118th highest)
> Pop. with access to places for physical activity: 96.9% (10th highest)
> Recreational and sports facilities: 47, or 10.6 per 100K (178th highest)
> Adult obesity rate: 27.4% (98th lowest)
> Median household income: $84,395 (12th highest)
> Population: 446,610
[in-text-ad-2]
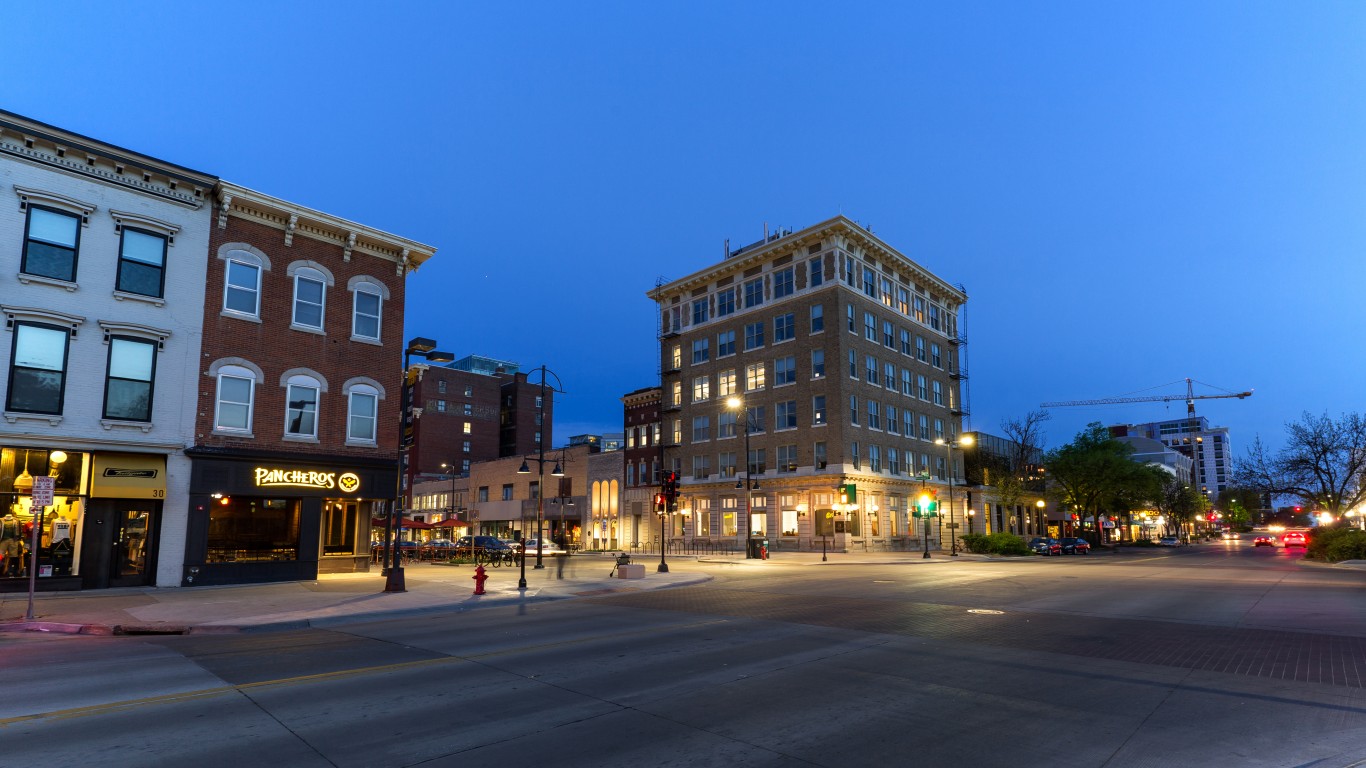
41. Iowa City, IA
> Adults who exercise regularly: 82.7% (52nd highest)
> Pop. with access to places for physical activity: 89.7% (69th highest)
> Recreational and sports facilities: 22, or 12.8 per 100K (80th highest)
> Adult obesity rate: 25.7% (57th lowest)
> Median household income: $64,635 (80th highest)
> Population: 173,401
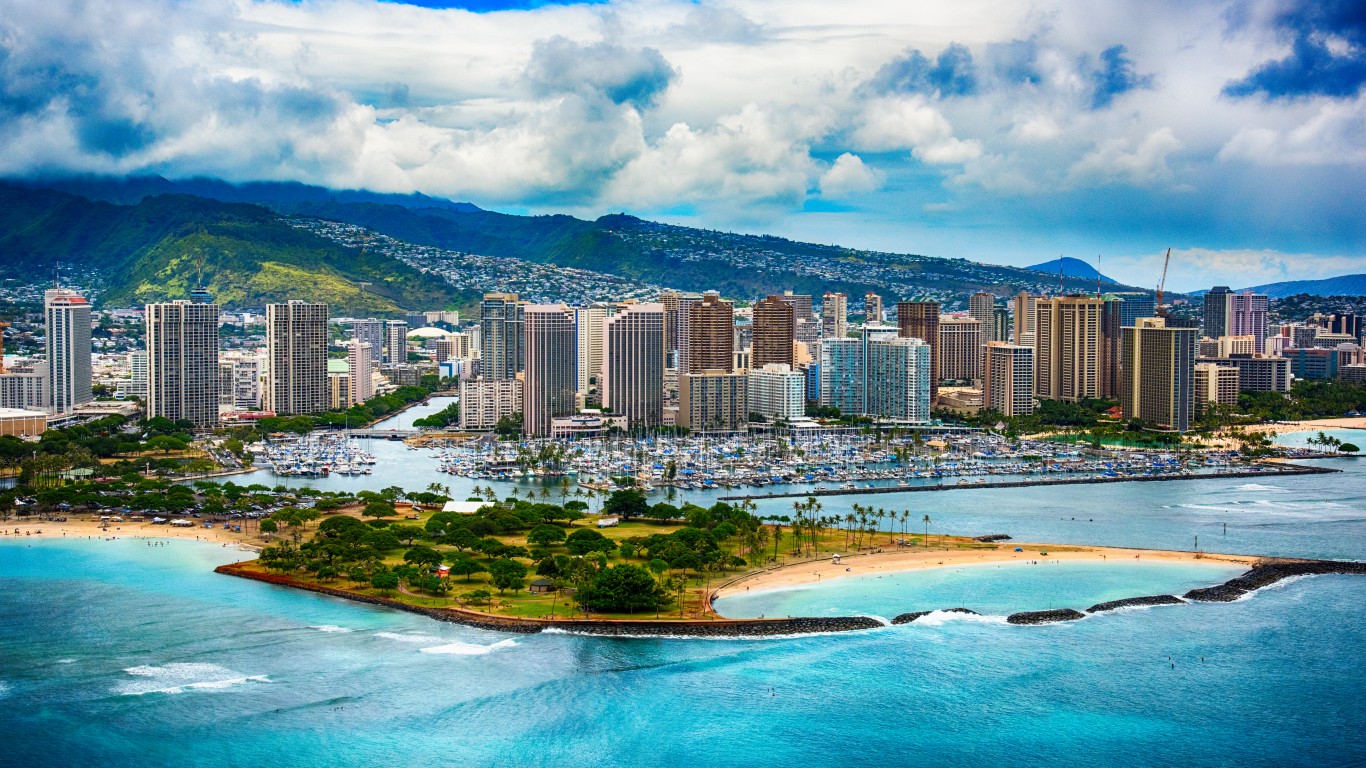
40. Urban Honolulu, HI
> Adults who exercise regularly: 79.8% (106th highest)
> Pop. with access to places for physical activity: 96.1% (14th highest)
> Recreational and sports facilities: 47, or 4.8 per 100K (16th lowest)
> Adult obesity rate: 23.0% (23rd lowest)
> Median household income: $84,423 (11st highest)
> Population: 980,080
[in-text-ad]
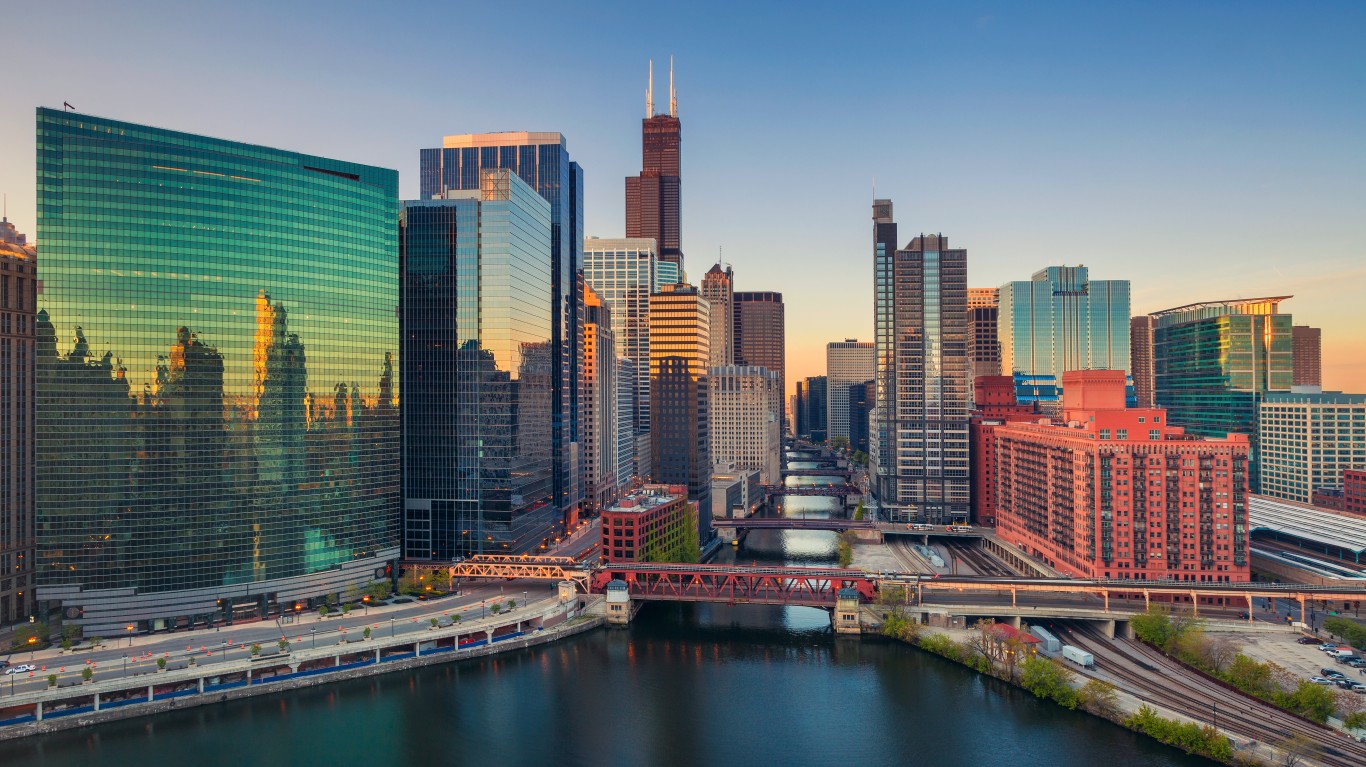
39. Chicago-Naperville-Elgin, IL-IN-WI
> Adults who exercise regularly: 79.4% (114th highest)
> Pop. with access to places for physical activity: 97.5% (6th highest)
> Recreational and sports facilities: 1,202, or 12.6 per 100K (89th highest)
> Adult obesity rate: 28.2% (123rd lowest)
> Median household income: $70,760 (49th highest)
> Population: 9,497,790
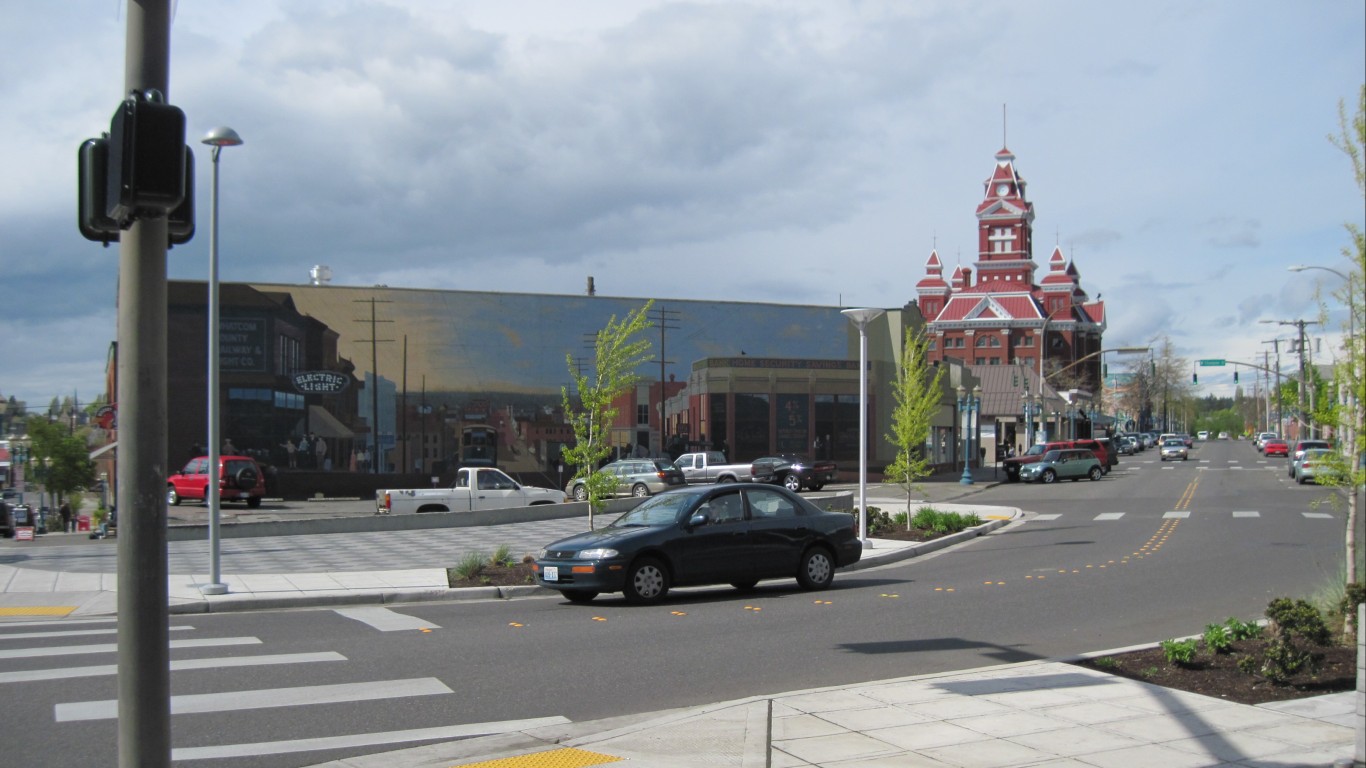
38. Bellingham, WA
> Adults who exercise regularly: 85.3% (13th highest)
> Pop. with access to places for physical activity: 84.7% (132nd highest)
> Recreational and sports facilities: 38, or 17.2 per 100K (19th highest)
> Adult obesity rate: 25.4% (51st lowest)
> Median household income: $62,268 (103rd highest)
> Population: 225,685
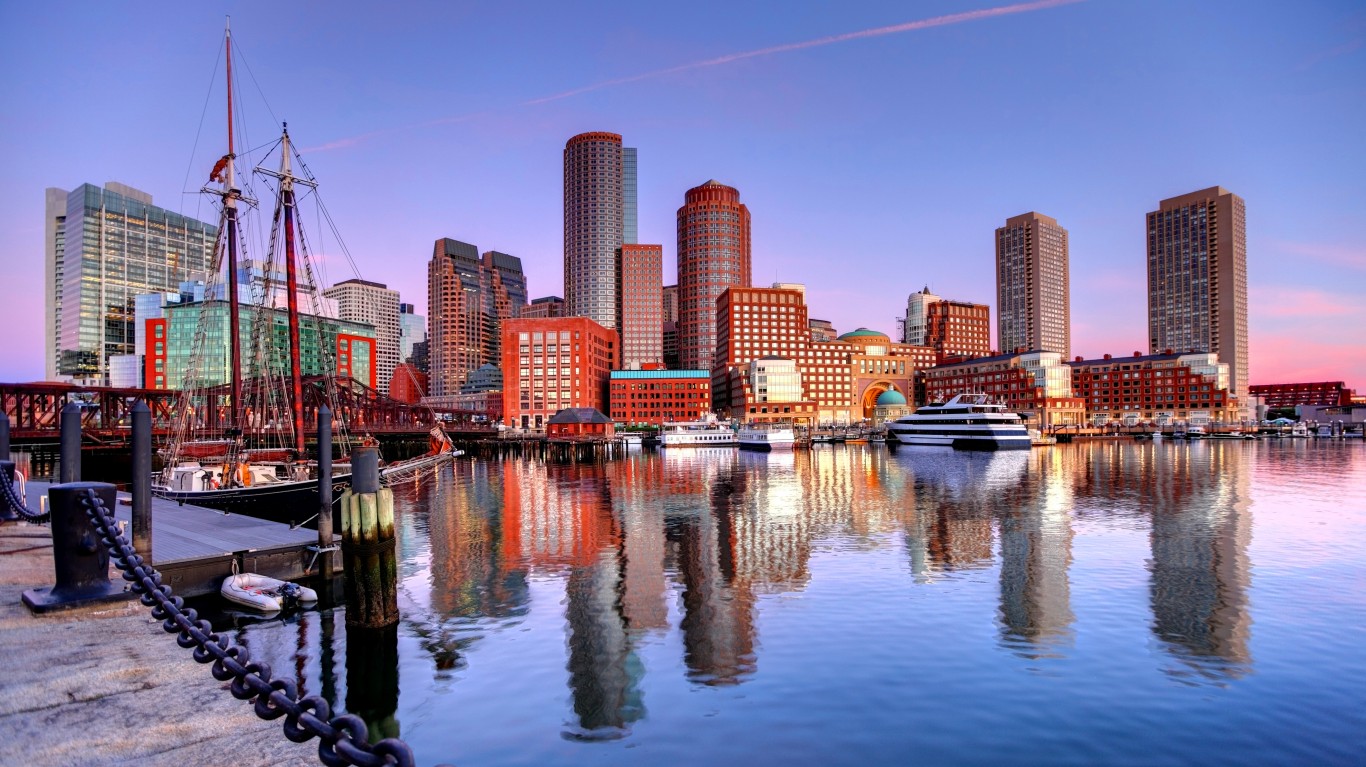
37. Boston-Cambridge-Newton, MA-NH
> Adults who exercise regularly: 80.8% (83rd highest)
> Pop. with access to places for physical activity: 94.8% (23rd highest)
> Recreational and sports facilities: 1,001, or 20.7 per 100K (6th highest)
> Adult obesity rate: 23.8% (30th lowest)
> Median household income: $88,711 (6th highest)
> Population: 4,875,390
[in-text-ad-2]
36. Oshkosh-Neenah, WI
> Adults who exercise regularly: 82.2% (67th highest)
> Pop. with access to places for physical activity: 91.8% (46th highest)
> Recreational and sports facilities: 21, or 12.3 per 100K (102nd highest)
> Adult obesity rate: 37.0% (365th lowest)
> Median household income: $56,589 (176th highest)
> Population: 171,020
35. Appleton, WI
> Adults who exercise regularly: 82.9% (45th highest)
> Pop. with access to places for physical activity: 90.5% (58th highest)
> Recreational and sports facilities: 30, or 12.7 per 100K (85th highest)
> Adult obesity rate: 29.3% (140th lowest)
> Median household income: $65,826 (68th highest)
> Population: 237,524
[in-text-ad]
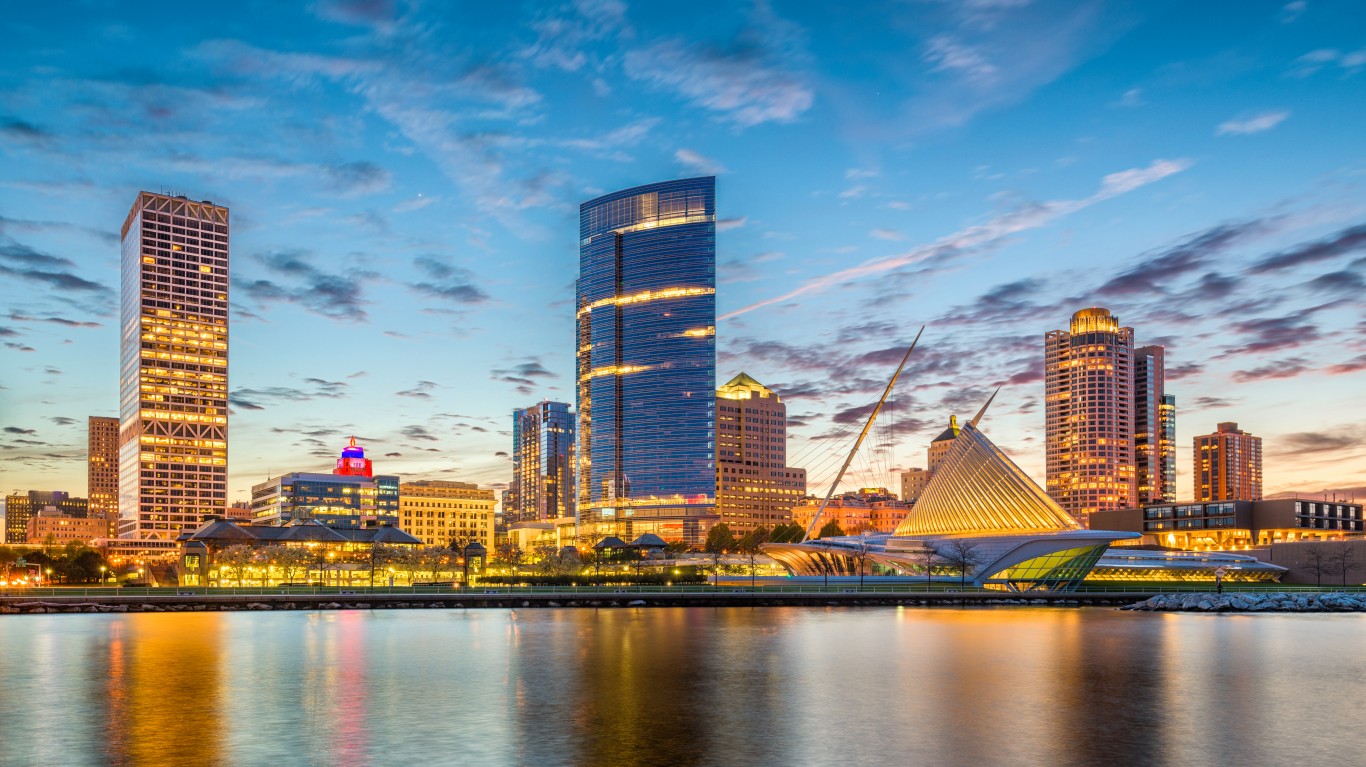
34. Milwaukee-Waukesha-West Allis, WI
> Adults who exercise regularly: 80.5% (88th highest)
> Pop. with access to places for physical activity: 96.0% (15th highest)
> Recreational and sports facilities: 214, or 13.6 per 100K (63rd highest)
> Adult obesity rate: 31.1% (196th lowest)
> Median household income: $60,643 (124st highest)
> Population: 1,576,113
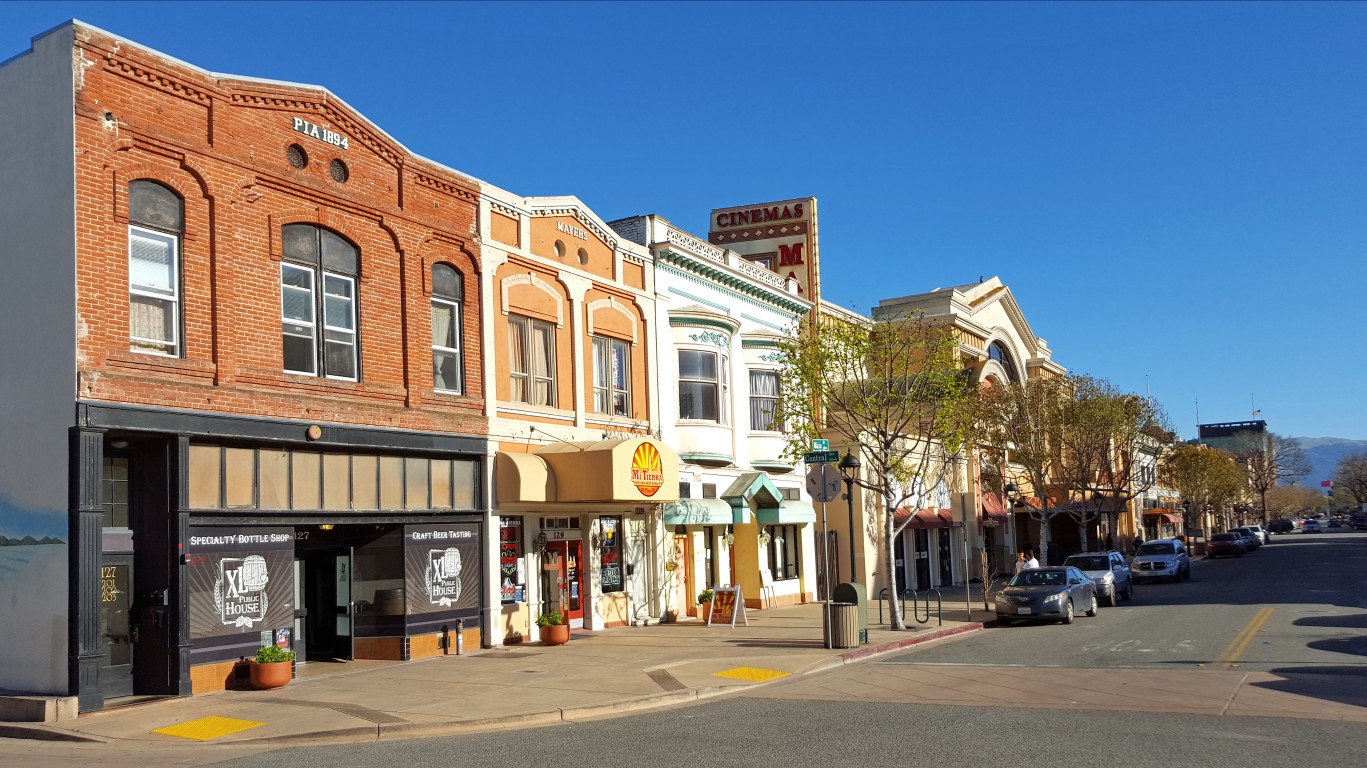
33. Salinas, CA
> Adults who exercise regularly: 82.9% (46th highest)
> Pop. with access to places for physical activity: 90.7% (57th highest)
> Recreational and sports facilities: 35, or 8.0 per 100K (98th lowest)
> Adult obesity rate: 25.4% (49th lowest)
> Median household income: $70,681 (51st highest)
> Population: 435,594
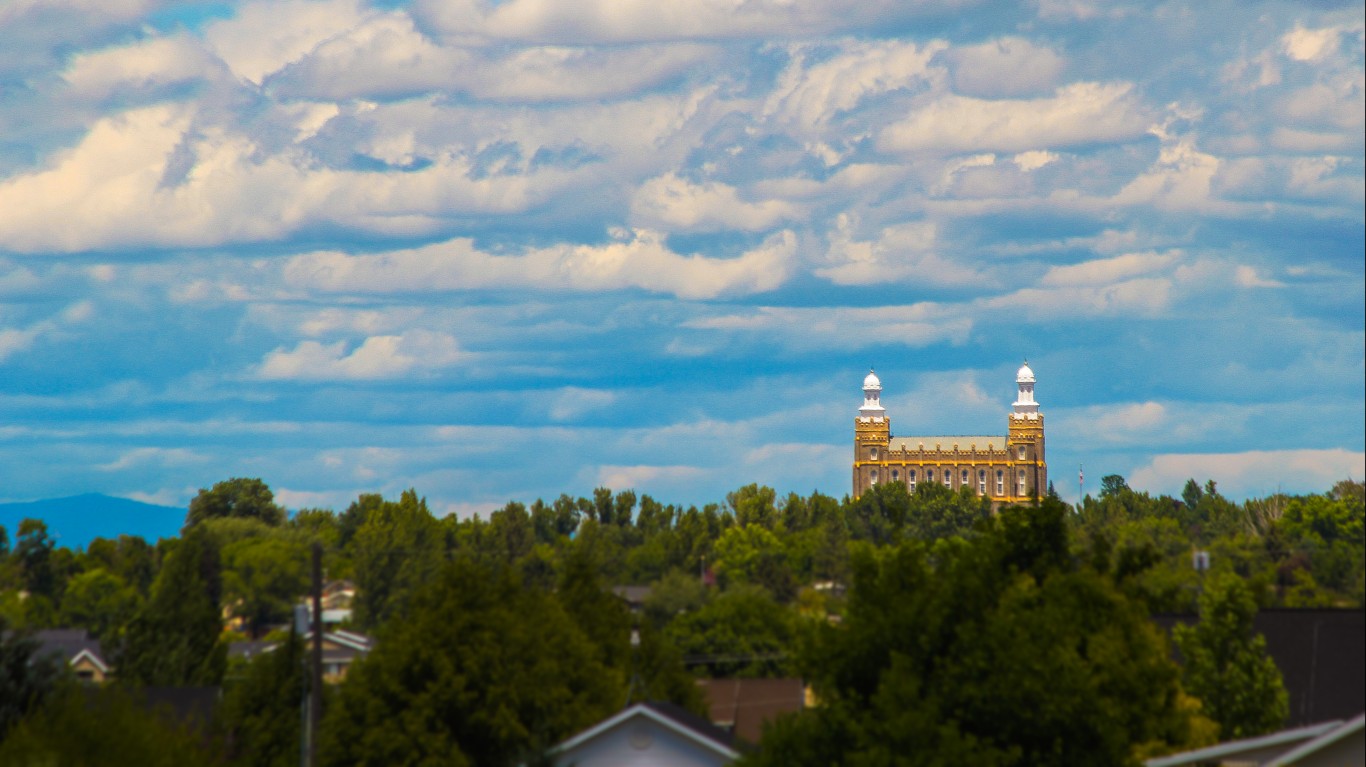
32. Logan, UT-ID
> Adults who exercise regularly: 86.2% (9th highest)
> Pop. with access to places for physical activity: 83.8% (140th highest)
> Recreational and sports facilities: 13, or 9.4 per 100K (146th lowest)
> Adult obesity rate: 26.5% (74th lowest)
> Median household income: $59,414 (143rd highest)
> Population: 141,476
[in-text-ad-2]
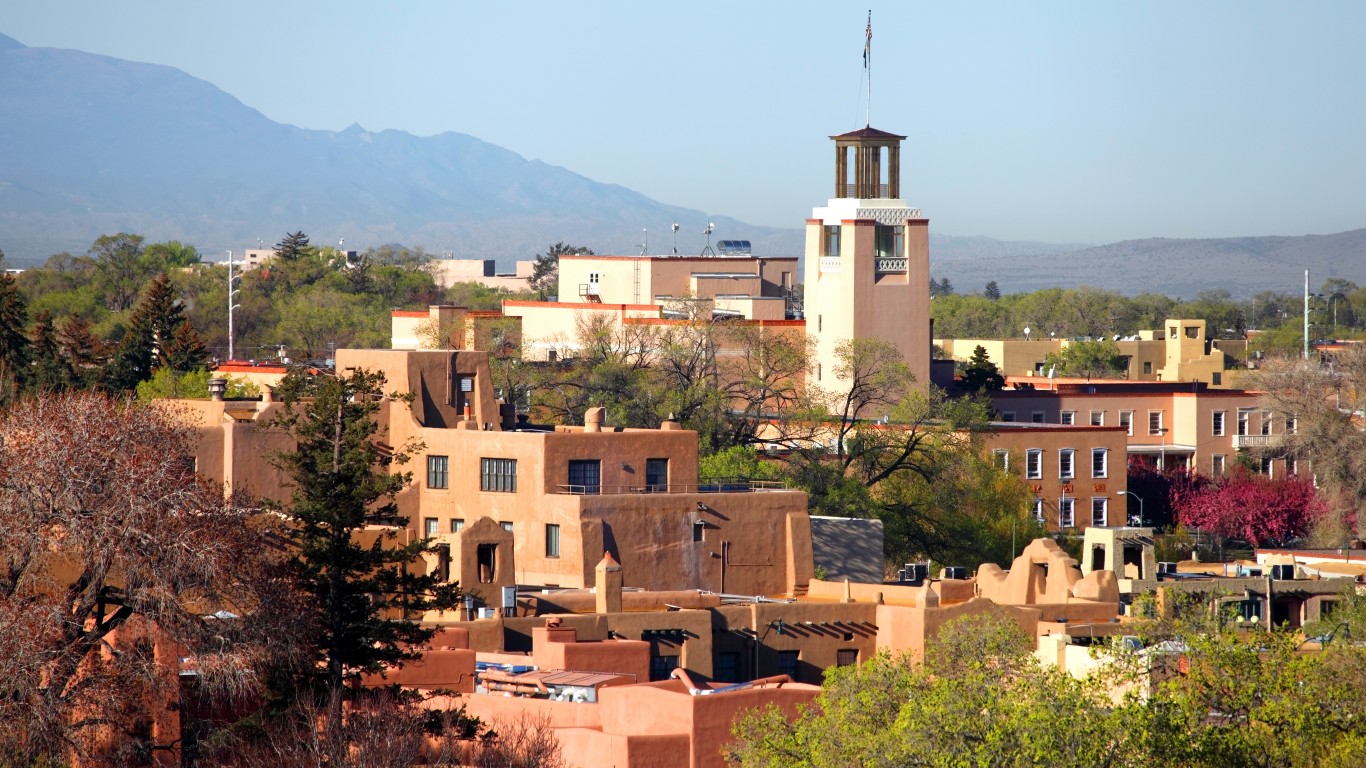
31. Santa Fe, NM
> Adults who exercise regularly: 89.4% (2nd highest)
> Pop. with access to places for physical activity: 77.1% (145th lowest)
> Recreational and sports facilities: 25, or 16.8 per 100K (23rd highest)
> Adult obesity rate: 14.3% (the lowest)
> Median household income: $60,193 (133rd highest)
> Population: 150,056
30. Colorado Springs, CO
> Adults who exercise regularly: 84.7% (20th highest)
> Pop. with access to places for physical activity: 88.1% (86th highest)
> Recreational and sports facilities: 76, or 10.5 per 100K (181st highest)
> Adult obesity rate: 22.5% (17th lowest)
> Median household income: $67,430 (62nd highest)
> Population: 738,939
[in-text-ad]
29. Napa, CA
> Adults who exercise regularly: 83.1% (40th highest)
> Pop. with access to places for physical activity: 92.4% (41st highest)
> Recreational and sports facilities: 24, or 17.0 per 100K (20th highest)
> Adult obesity rate: 21.6% (16th lowest)
> Median household income: $87,025 (8th highest)
> Population: 139,417
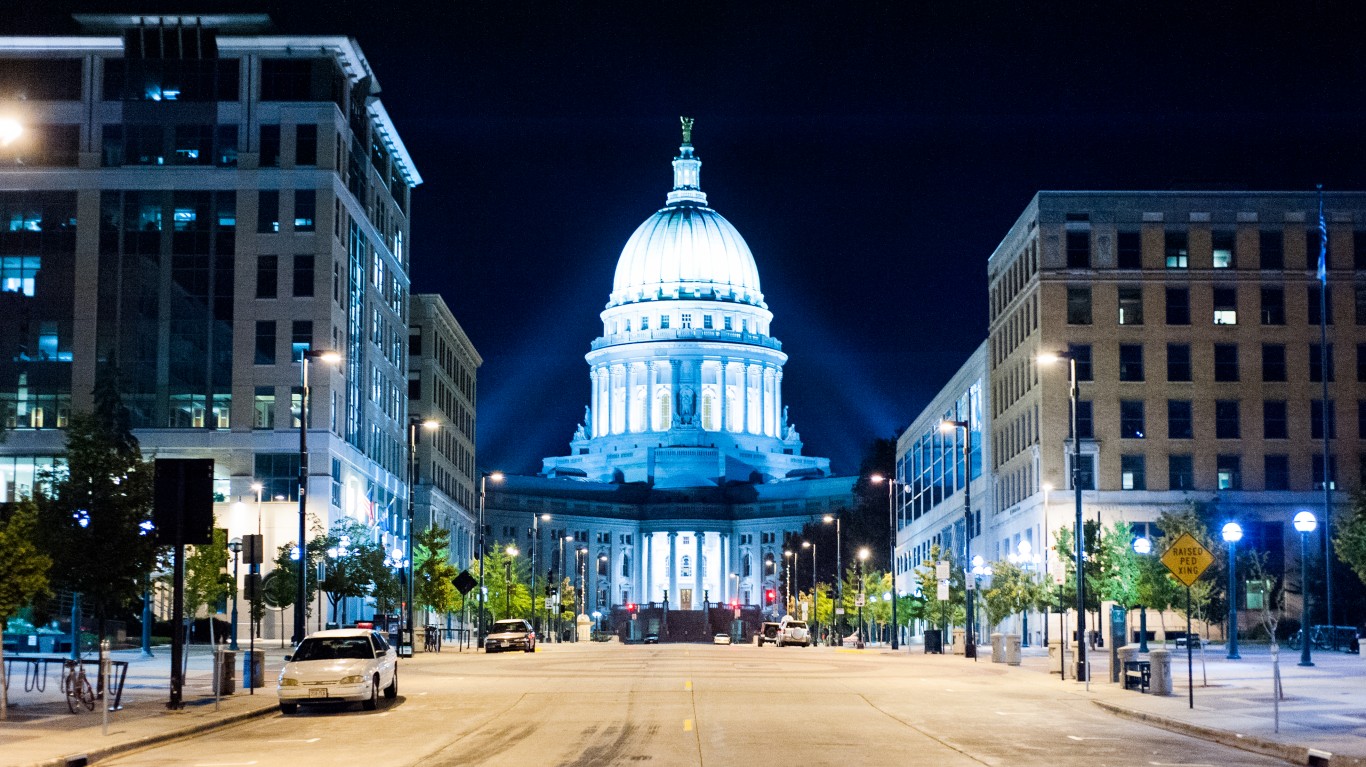
28. Madison, WI
> Adults who exercise regularly: 84.5% (26th highest)
> Pop. with access to places for physical activity: 89.6% (70th highest)
> Recreational and sports facilities: 121, or 18.5 per 100K (14th highest)
> Adult obesity rate: 26.1% (64th lowest)
> Median household income: $70,463 (53st highest)
> Population: 660,422
27. Lawrence, KS
> Adults who exercise regularly: 83.3% (37th highest)
> Pop. with access to places for physical activity: 92.2% (43rd highest)
> Recreational and sports facilities: 14, or 11.6 per 100K (134th highest)
> Adult obesity rate: 27.7% (109th lowest)
> Median household income: $54,668 (208th highest)
> Population: 121,436
[in-text-ad-2]
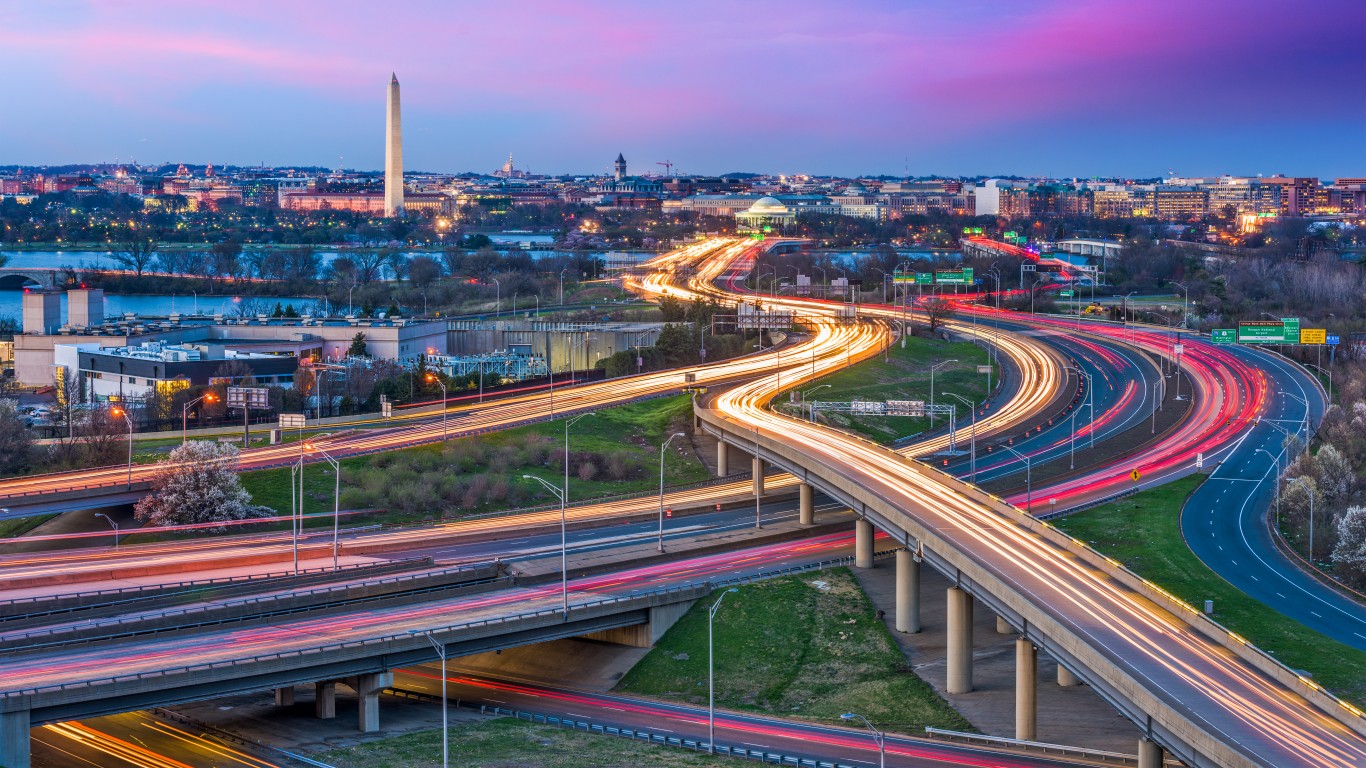
26. Washington-Arlington-Alexandria, DC-VA-MD-WV
> Adults who exercise regularly: 82.0% (69th highest)
> Pop. with access to places for physical activity: 94.9% (18th highest)
> Recreational and sports facilities: 886, or 14.3 per 100K (57th highest)
> Adult obesity rate: 26.3% (70th lowest)
> Median household income: $102,180 (3rd highest)
> Population: 6,251,240
25. Eugene, OR
> Adults who exercise regularly: 84.9% (18th highest)
> Pop. with access to places for physical activity: 88.9% (75th highest)
> Recreational and sports facilities: 40, or 10.7 per 100K (172nd highest)
> Adult obesity rate: 27.6% (106th lowest)
> Median household income: $53,172 (153rd lowest)
> Population: 379,611
[in-text-ad]
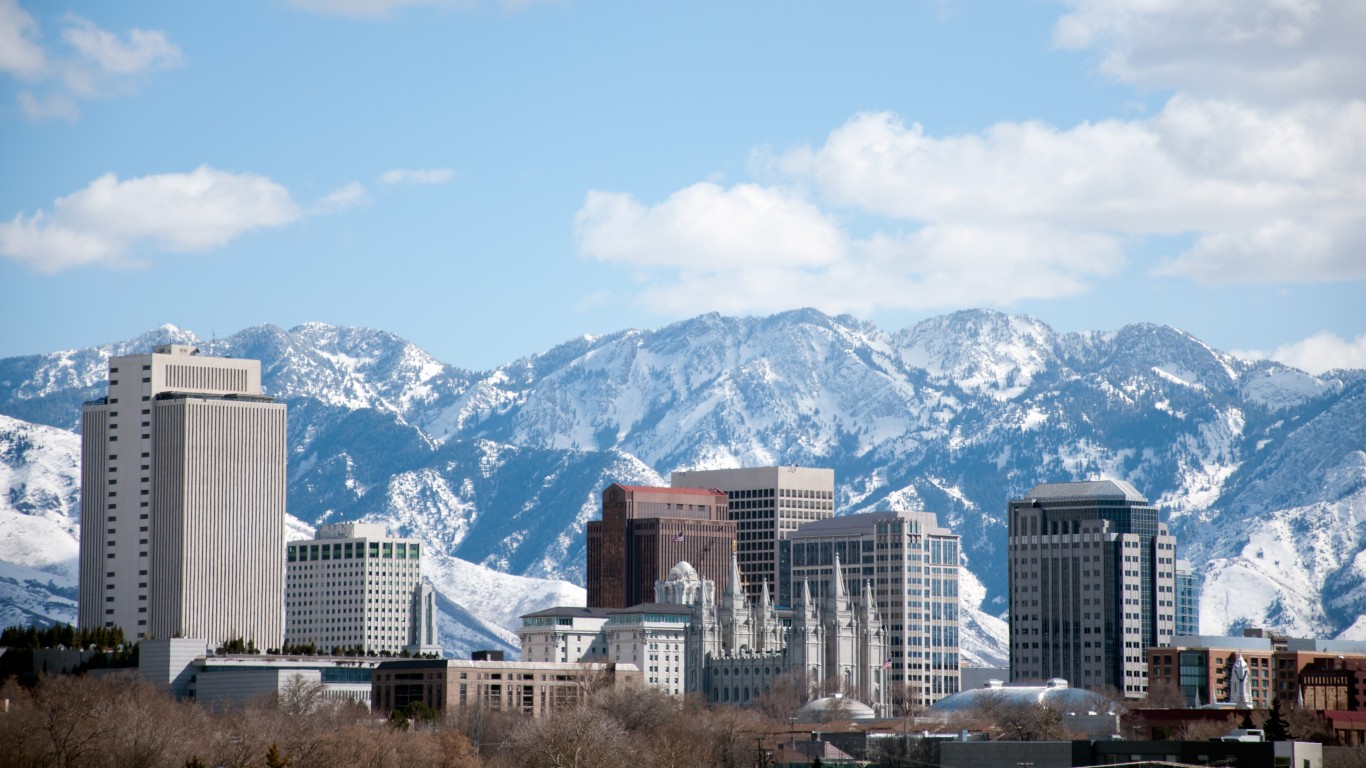
24. Salt Lake City, UT
> Adults who exercise regularly: 84.0% (30th highest)
> Pop. with access to places for physical activity: 91.2% (51st highest)
> Recreational and sports facilities: 118, or 9.8 per 100K (208th highest)
> Adult obesity rate: 25.3% (45th lowest)
> Median household income: $73,730 (35th highest)
> Population: 1,222,540
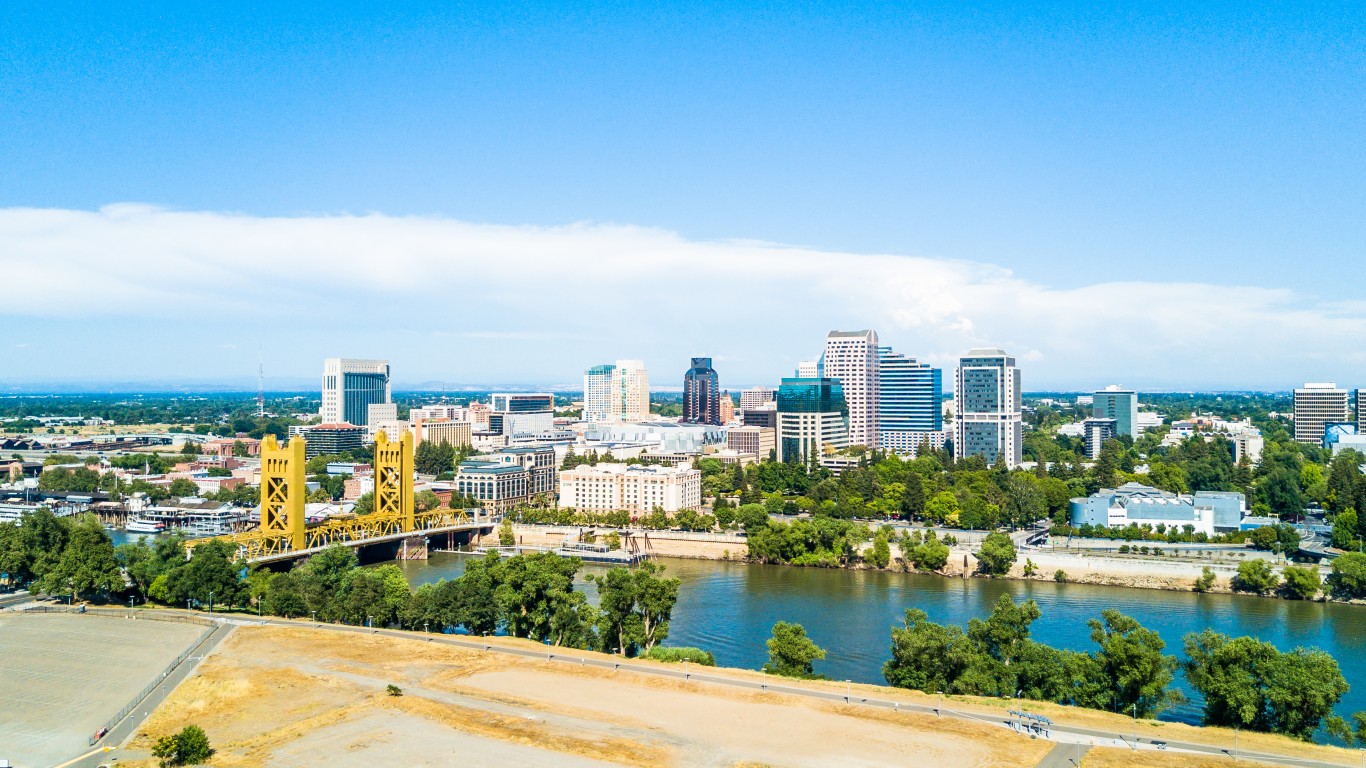
23. Sacramento–Roseville–Arden-Arcade, CA
> Adults who exercise regularly: 82.5% (60th highest)
> Pop. with access to places for physical activity: 95.4% (16th highest)
> Recreational and sports facilities: 270, or 11.6 per 100K (131st highest)
> Adult obesity rate: 24.8% (40th lowest)
> Median household income: $73,142 (37th highest)
> Population: 2,345,210

22. San Luis Obispo-Paso Robles-Arroyo Grande, CA
> Adults who exercise regularly: 85.7% (11st highest)
> Pop. with access to places for physical activity: 88.8% (77th highest)
> Recreational and sports facilities: 45, or 15.9 per 100K (32nd highest)
> Adult obesity rate: 23.5% (27th lowest)
> Median household income: $71,148 (45th highest)
> Population: 284,010
[in-text-ad-2]
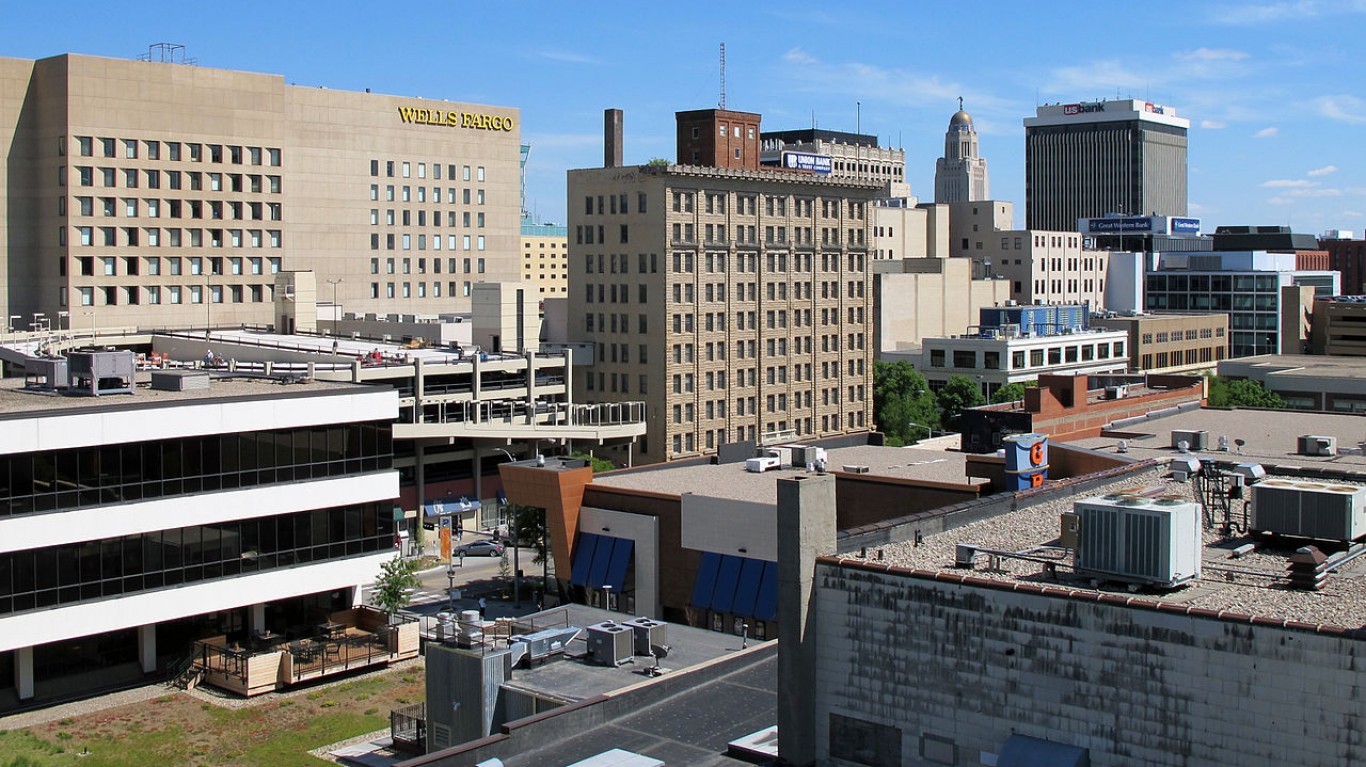
21. Lincoln, NE
> Adults who exercise regularly: 83.0% (44th highest)
> Pop. with access to places for physical activity: 94.9% (20th highest)
> Recreational and sports facilities: 58, or 17.5 per 100K (17th highest)
> Adult obesity rate: 27.7% (110th lowest)
> Median household income: $58,506 (151st highest)
> Population: 333,964
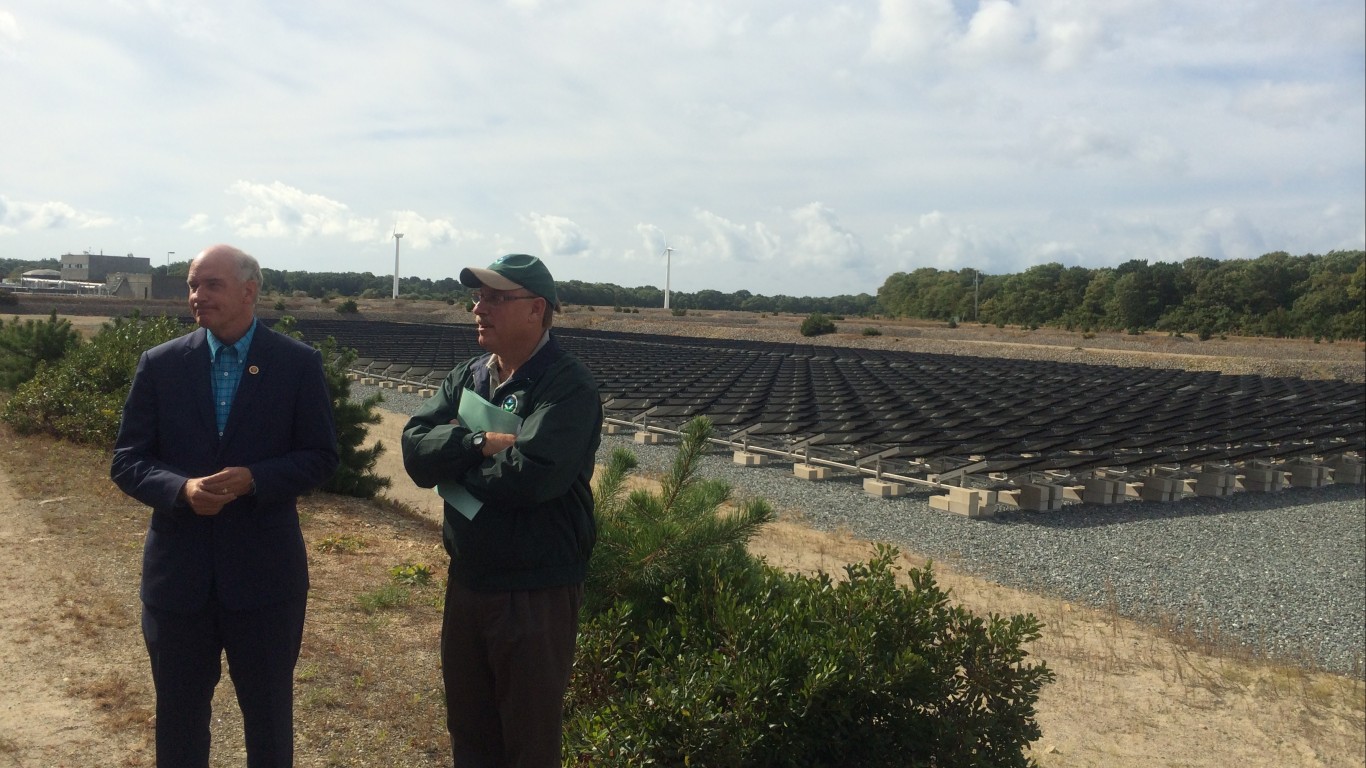
20. Barnstable Town, MA
> Adults who exercise regularly: 84.8% (19th highest)
> Pop. with access to places for physical activity: 90.9% (53rd highest)
> Recreational and sports facilities: 48, or 22.5 per 100K (2nd highest)
> Adult obesity rate: 20.4% (7th lowest)
> Median household income: $68,902 (58th highest)
> Population: 213,413
[in-text-ad]
19. Minneapolis-St. Paul-Bloomington, MN-WI
> Adults who exercise regularly: 83.1% (39th highest)
> Pop. with access to places for physical activity: 94.9% (19th highest)
> Recreational and sports facilities: 552, or 15.3 per 100K (42nd highest)
> Adult obesity rate: 25.8% (58th lowest)
> Median household income: $79,578 (20th highest)
> Population: 3,629,190
18. Oxnard-Thousand Oaks-Ventura, CA
> Adults who exercise regularly: 82.3% (66th highest)
> Pop. with access to places for physical activity: 97.2% (7th highest)
> Recreational and sports facilities: 103, or 12.1 per 100K (114th highest)
> Adult obesity rate: 21.0% (12th lowest)
> Median household income: $84,566 (10th highest)
> Population: 850,967
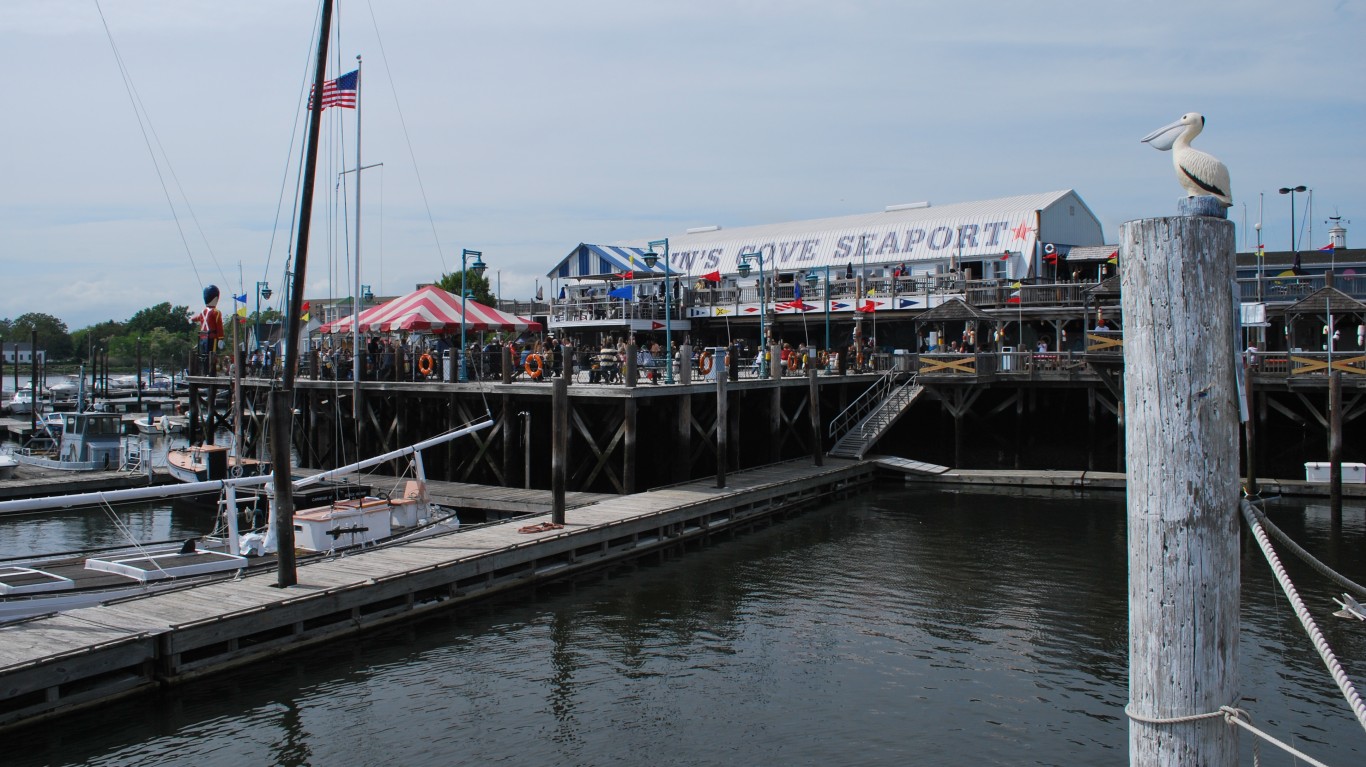
17. Bridgeport-Stamford-Norwalk, CT
> Adults who exercise regularly: 82.7% (55th highest)
> Pop. with access to places for physical activity: 96.8% (11th highest)
> Recreational and sports facilities: 228, or 24.0 per 100K (the highest)
> Adult obesity rate: 21.6% (15th lowest)
> Median household income: $91,079 (5th highest)
> Population: 943,823
[in-text-ad-2]
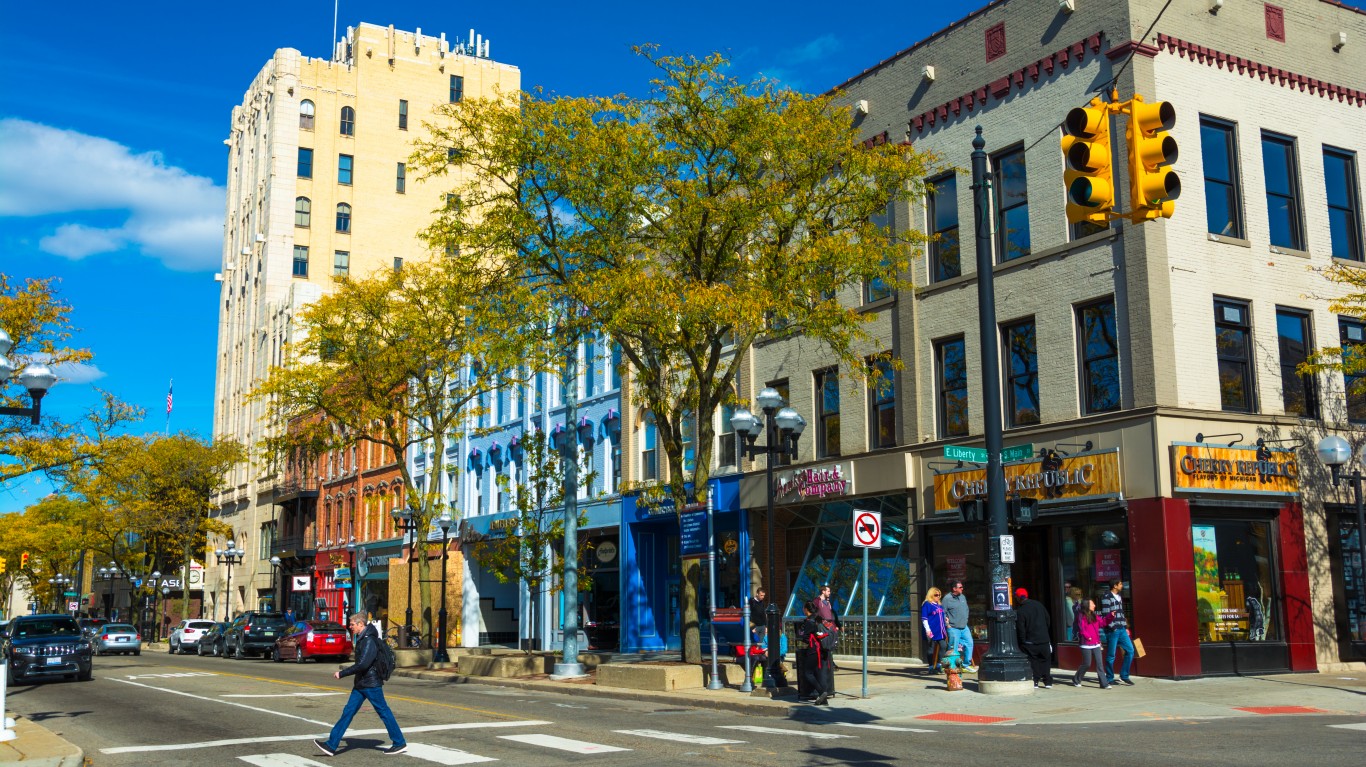
16. Ann Arbor, MI
> Adults who exercise regularly: 85.5% (12nd highest)
> Pop. with access to places for physical activity: 91.2% (49th highest)
> Recreational and sports facilities: 49, or 13.3 per 100K (68th highest)
> Adult obesity rate: 23.8% (31st lowest)
> Median household income: $71,860 (41st highest)
> Population: 370,963
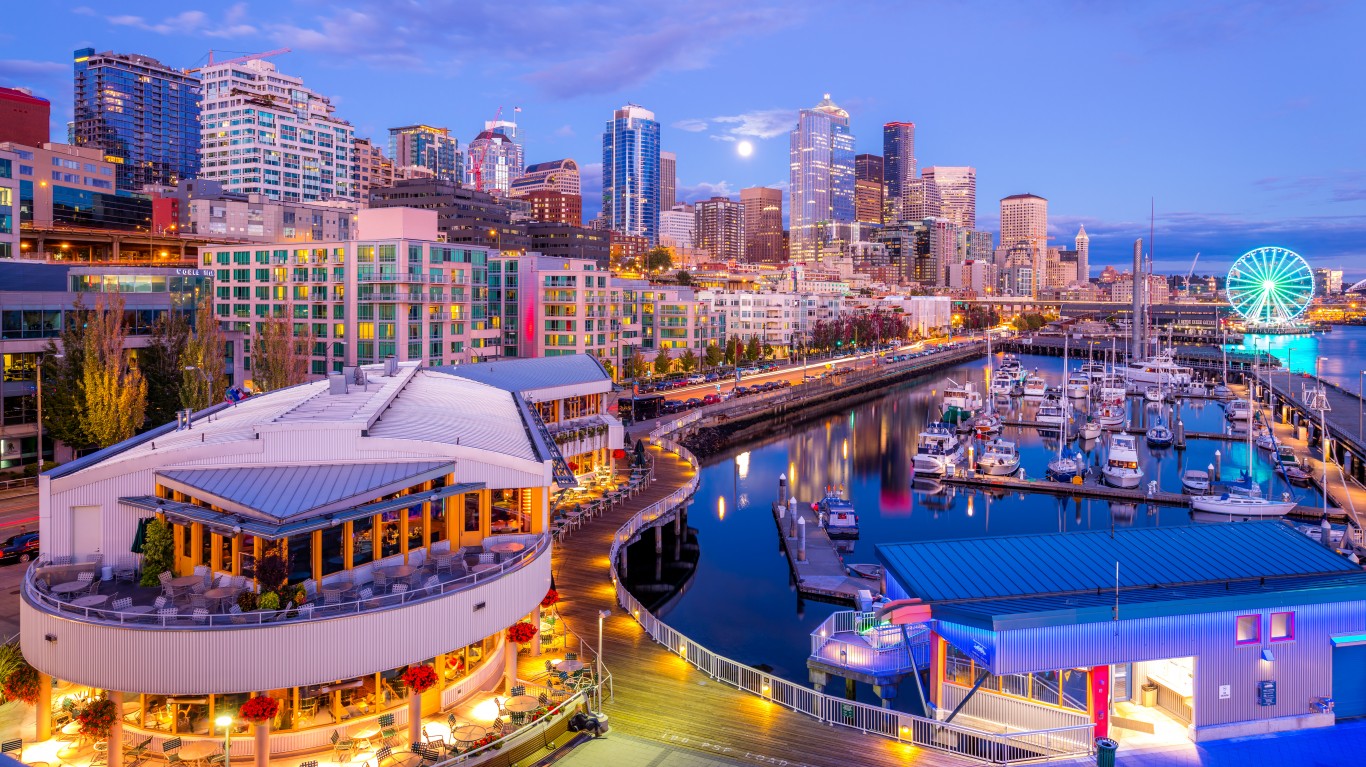
15. Seattle-Tacoma-Bellevue, WA
> Adults who exercise regularly: 85.0% (17th highest)
> Pop. with access to places for physical activity: 92.7% (37th highest)
> Recreational and sports facilities: 537, or 13.9 per 100K (59th highest)
> Adult obesity rate: 25.6% (55th lowest)
> Median household income: $87,910 (7th highest)
> Population: 3,939,363
[in-text-ad]
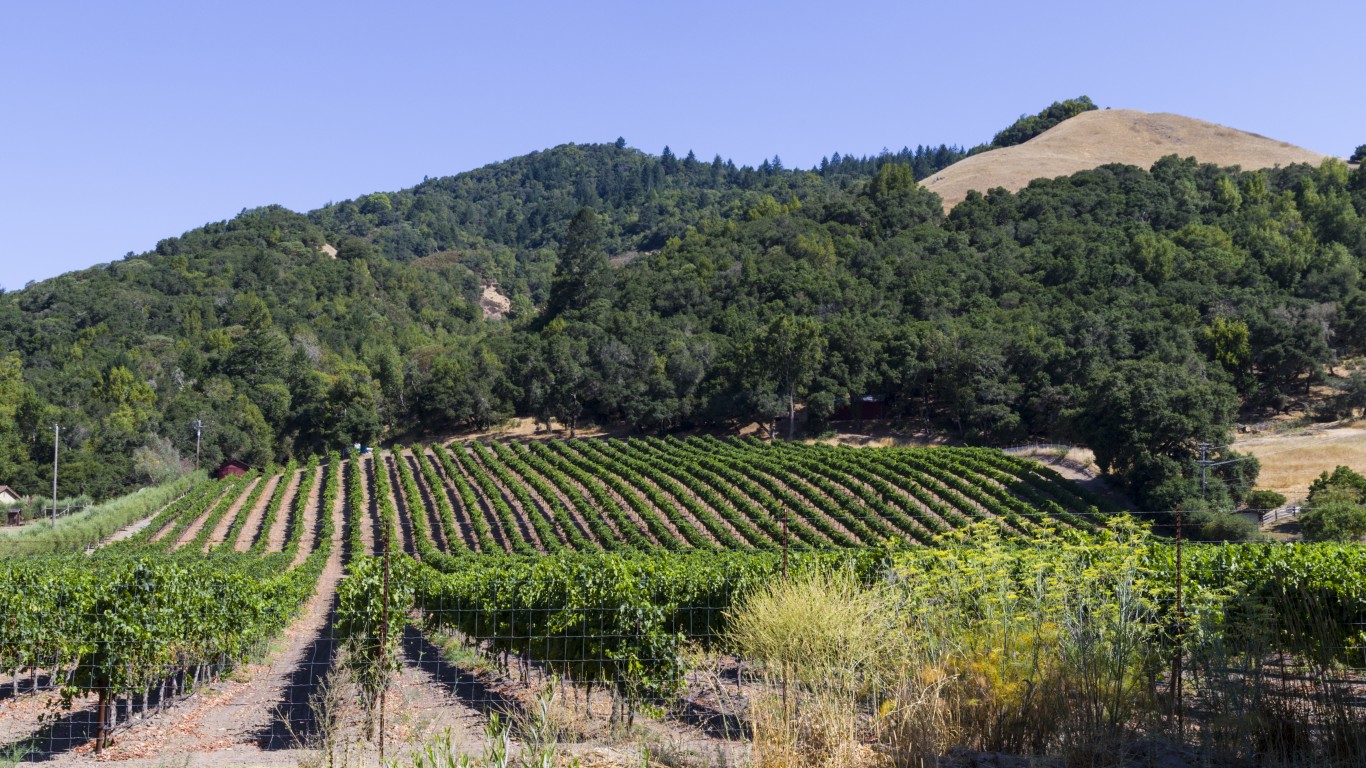
14. Santa Rosa, CA
> Adults who exercise regularly: 84.7% (22nd highest)
> Pop. with access to places for physical activity: 93.5% (31st highest)
> Recreational and sports facilities: 79, or 15.7 per 100K (36th highest)
> Adult obesity rate: 19.8% (5th lowest)
> Median household income: $81,395 (15th highest)
> Population: 499,942
13. Missoula, MT
> Adults who exercise regularly: 85.1% (15th highest)
> Pop. with access to places for physical activity: 93.0% (33rd highest)
> Recreational and sports facilities: 23, or 19.6 per 100K (8th highest)
> Adult obesity rate: 23.4% (26th lowest)
> Median household income: $56,598 (175th highest)
> Population: 118,791
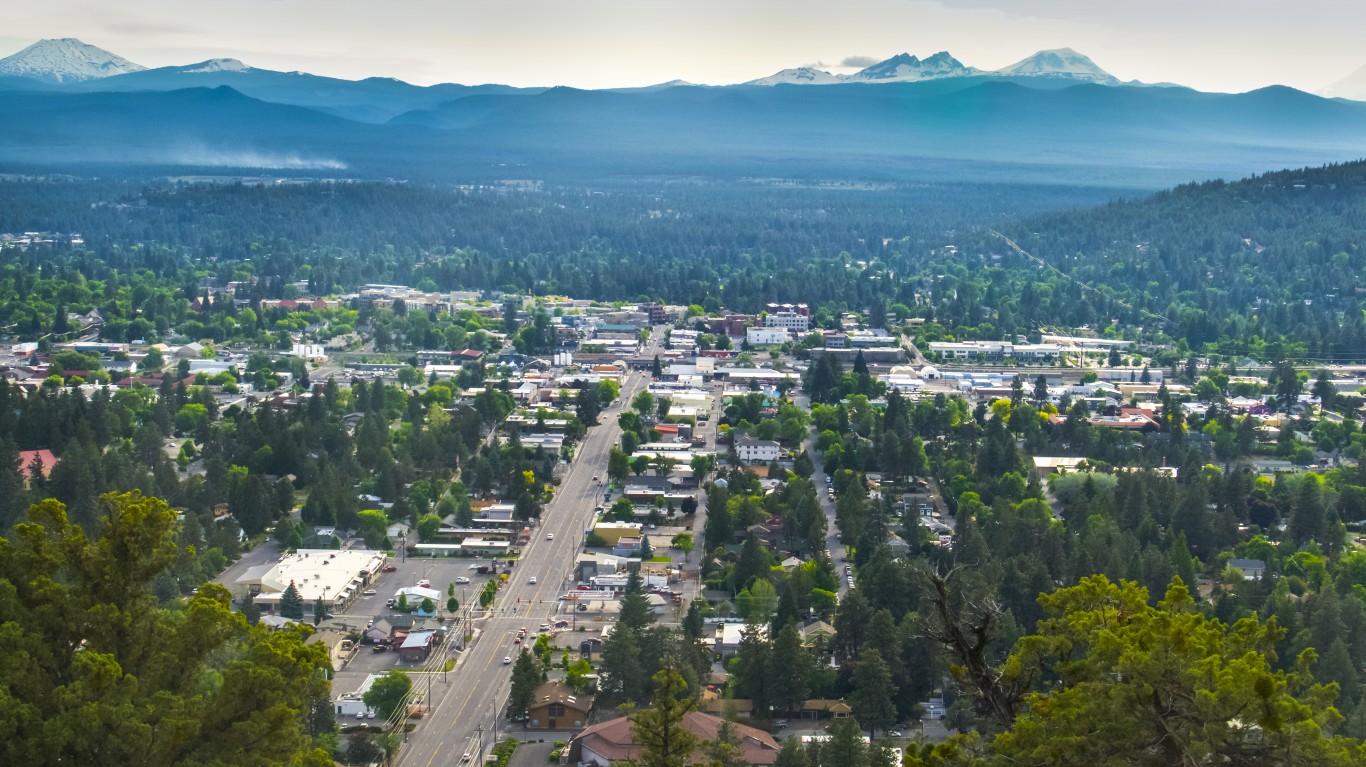
12. Bend-Redmond, OR
> Adults who exercise regularly: 87.1% (6th highest)
> Pop. with access to places for physical activity: 89.7% (66th highest)
> Recreational and sports facilities: 35, or 18.7 per 100K (12nd highest)
> Adult obesity rate: 22.9% (21st lowest)
> Median household income: $67,577 (61st highest)
> Population: 191,996
[in-text-ad-2]

11. Los Angeles-Long Beach-Anaheim, CA
> Adults who exercise regularly: 83.7% (33rd highest)
> Pop. with access to places for physical activity: 97.5% (5th highest)
> Recreational and sports facilities: 1,491, or 11.2 per 100K (146th highest)
> Adult obesity rate: 20.9% (11st lowest)
> Median household income: $72,563 (39th highest)
> Population: 13,291,486
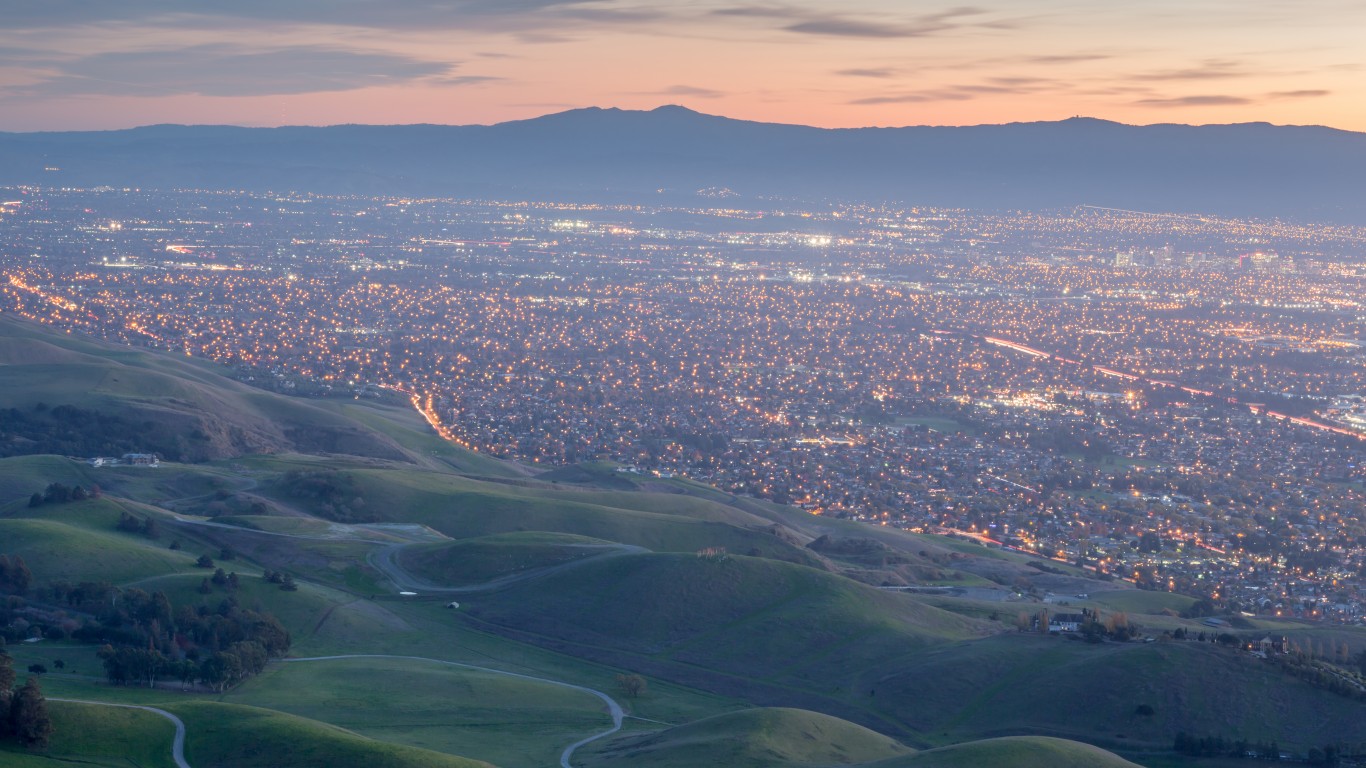
10. San Jose-Sunnyvale-Santa Clara, CA
> Adults who exercise regularly: 83.7% (31st highest)
> Pop. with access to places for physical activity: 97.9% (4th highest)
> Recreational and sports facilities: 301, or 15.1 per 100K (47th highest)
> Adult obesity rate: 19.9% (6th lowest)
> Median household income: $124,696 (the highest)
> Population: 1,999,107
[in-text-ad]
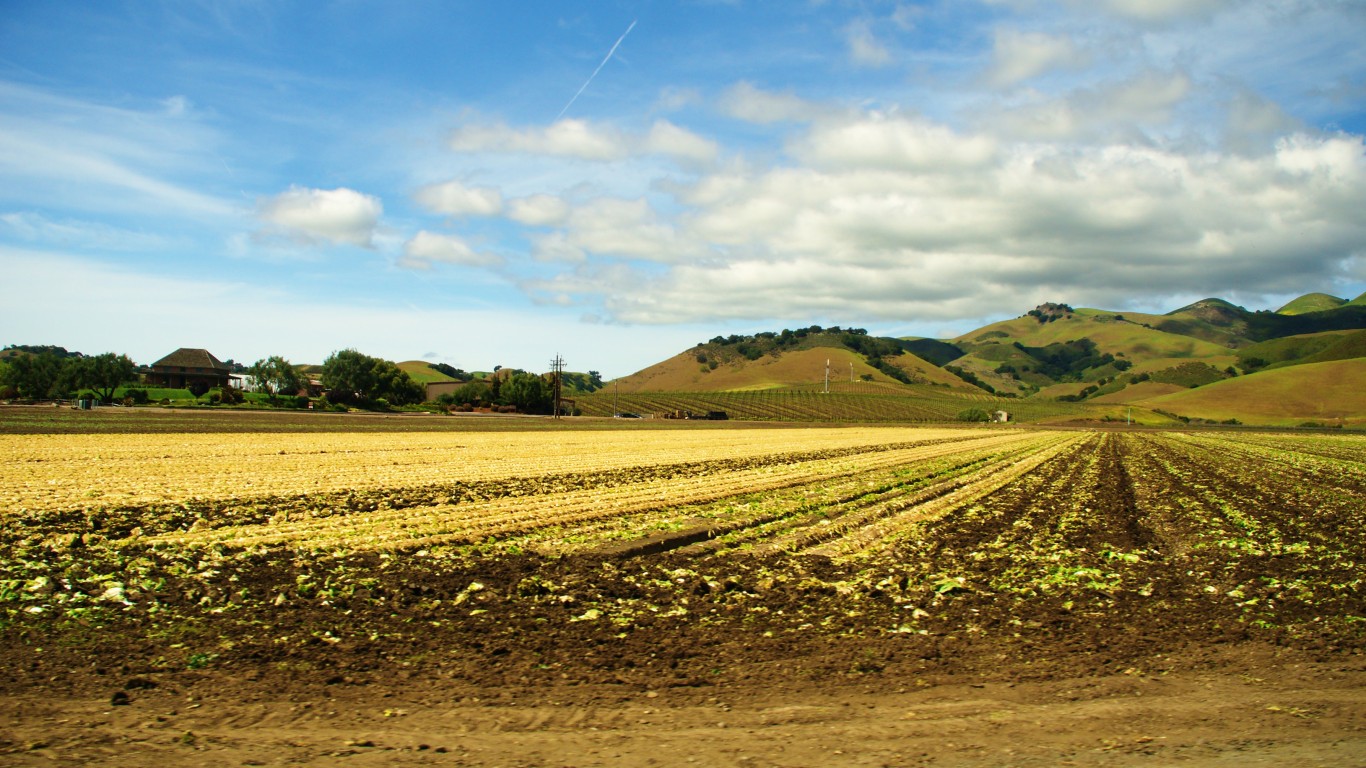
9. Santa Maria-Santa Barbara, CA
> Adults who exercise regularly: 85.3% (14th highest)
> Pop. with access to places for physical activity: 94.8% (22nd highest)
> Recreational and sports facilities: 71, or 15.8 per 100K (34th highest)
> Adult obesity rate: 21.0% (13th lowest)
> Median household income: $77,472 (25th highest)
> Population: 446,527
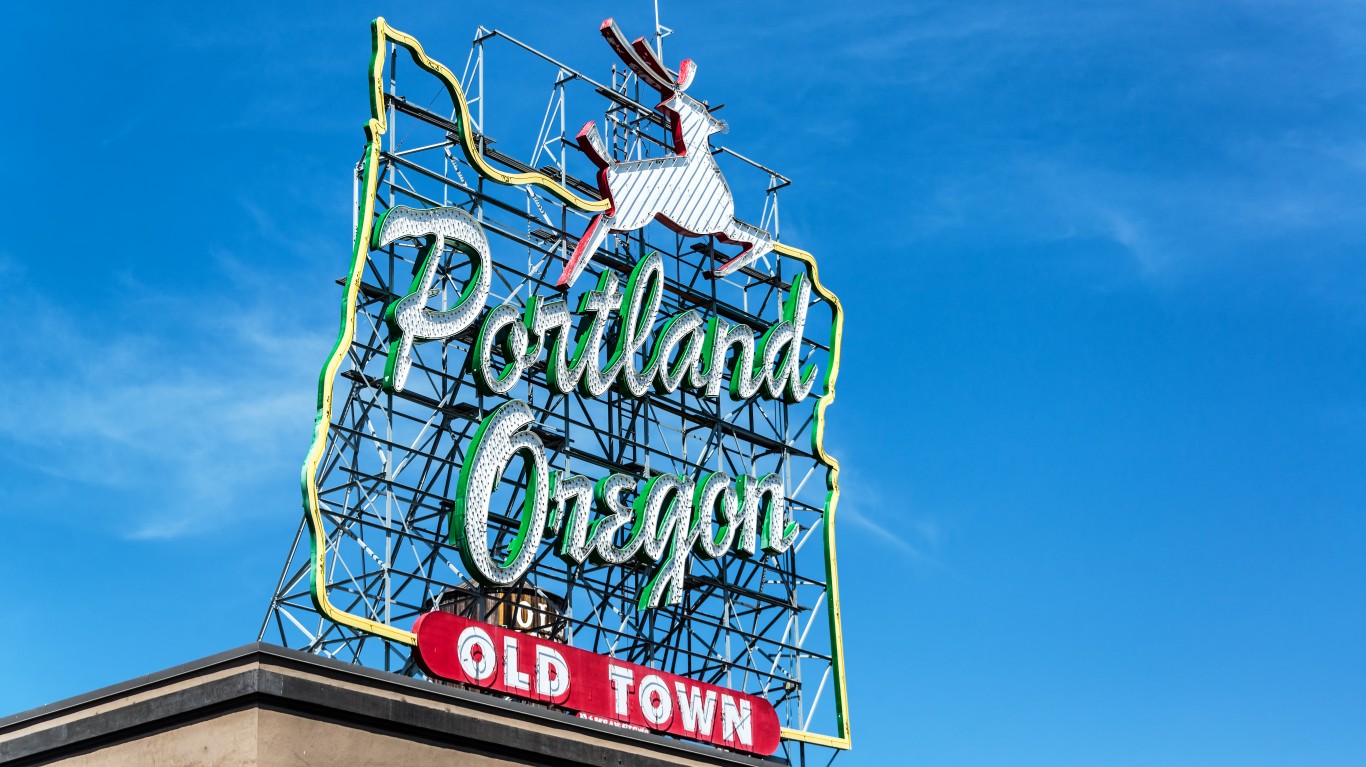
8. Portland-Vancouver-Hillsboro, OR-WA
> Adults who exercise regularly: 85.9% (10th highest)
> Pop. with access to places for physical activity: 94.5% (24th highest)
> Recreational and sports facilities: 303, or 12.4 per 100K (100th highest)
> Adult obesity rate: 26.7% (78th lowest)
> Median household income: $75,599 (31st highest)
> Population: 2,478,996
7. San Diego-Carlsbad, CA
> Adults who exercise regularly: 85.1% (16th highest)
> Pop. with access to places for physical activity: 97.0% (9th highest)
> Recreational and sports facilities: 415, or 12.4 per 100K (97th highest)
> Adult obesity rate: 20.4% (8th lowest)
> Median household income: $79,079 (22nd highest)
> Population: 3,343,364
[in-text-ad-2]
6. Corvallis, OR
> Adults who exercise regularly: 88.5% (3rd highest)
> Pop. with access to places for physical activity: 90.3% (62nd highest)
> Recreational and sports facilities: 14, or 15.4 per 100K (41st highest)
> Adult obesity rate: 26.5% (77th lowest)
> Median household income: $63,773 (90th highest)
> Population: 92,101
5. San Francisco-Oakland-Hayward, CA
> Adults who exercise regularly: 84.7% (23rd highest)
> Pop. with access to places for physical activity: 99.0% (1st highest)
> Recreational and sports facilities: 700, or 14.8 per 100K (49th highest)
> Adult obesity rate: 20.7% (10th lowest)
> Median household income: $107,898 (2nd highest)
> Population: 4,729,484
[in-text-ad]

4. Fort Collins, CO
> Adults who exercise regularly: 87.8% (5th highest)
> Pop. with access to places for physical activity: 92.5% (39th highest)
> Recreational and sports facilities: 65, or 18.9 per 100K (10th highest)
> Adult obesity rate: 18.8% (4th lowest)
> Median household income: $71,091 (46th highest)
> Population: 350,518

3. Denver-Aurora-Lakewood, CO
> Adults who exercise regularly: 86.5% (7th highest)
> Pop. with access to places for physical activity: 96.7% (12nd highest)
> Recreational and sports facilities: 452, or 15.6 per 100K (37th highest)
> Adult obesity rate: 20.5% (9th lowest)
> Median household income: $79,478 (21st highest)
> Population: 2,932,415
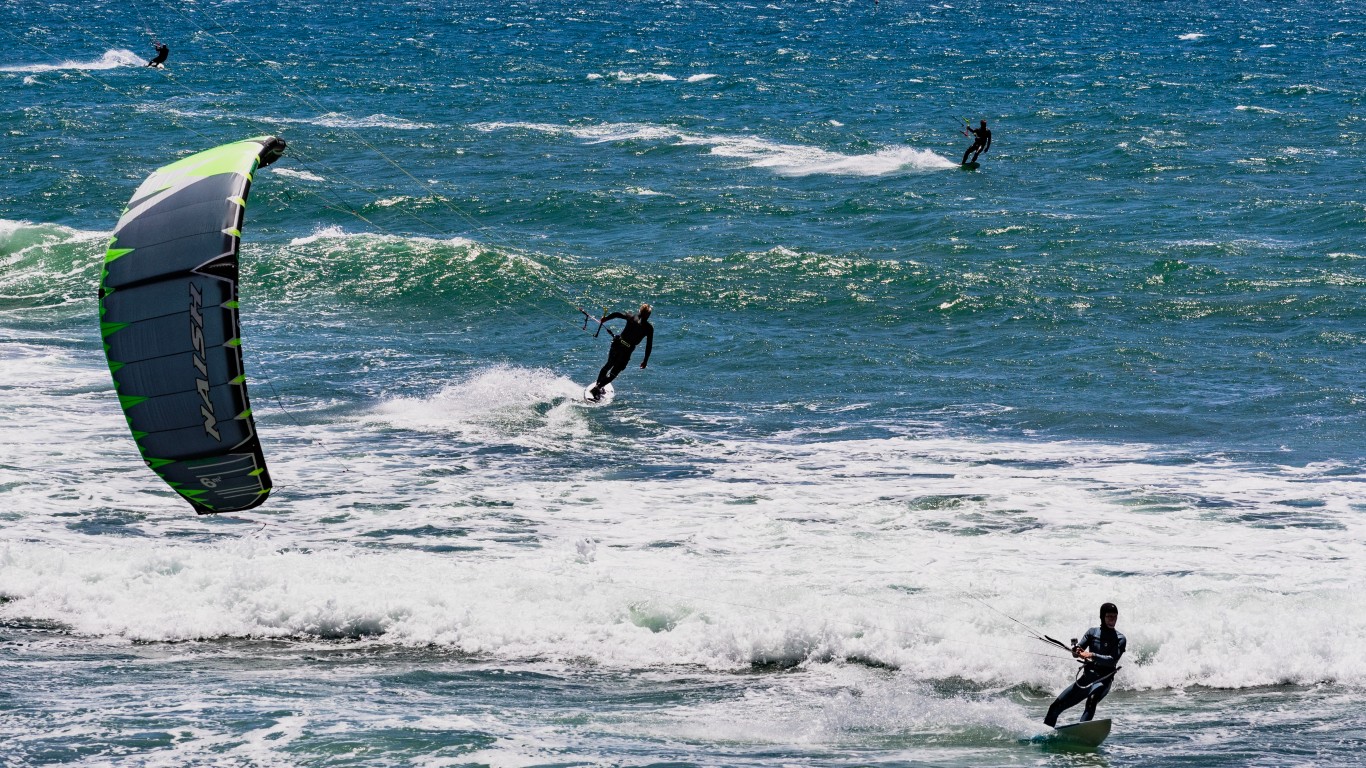
2. Santa Cruz-Watsonville, CA
> Adults who exercise regularly: 88.1% (4th highest)
> Pop. with access to places for physical activity: 94.0% (27th highest)
> Recreational and sports facilities: 37, or 13.4 per 100K (66th highest)
> Adult obesity rate: 17.4% (3rd lowest)
> Median household income: $86,941 (9th highest)
> Population: 274,255
[in-text-ad-2]
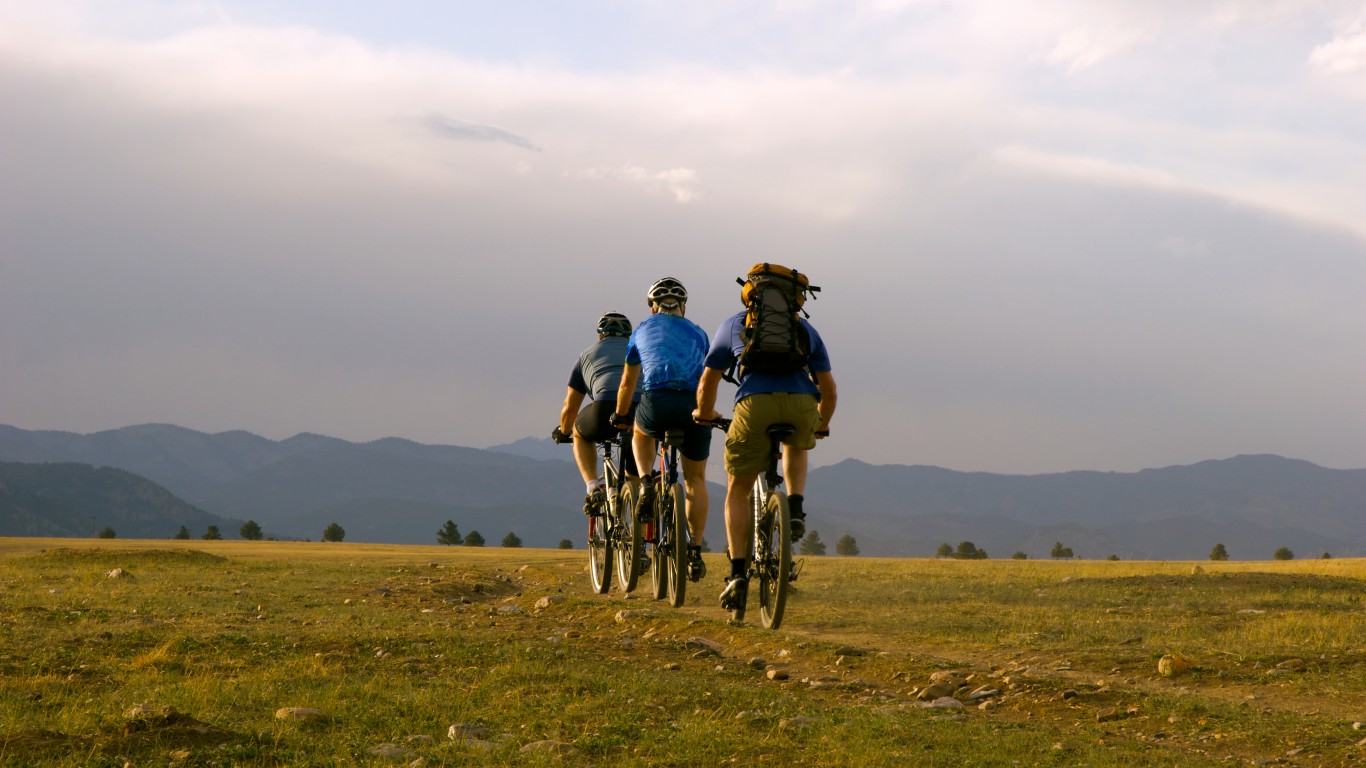
1. Boulder, CO
> Adults who exercise regularly: 90.7% (the highest)
> Pop. with access to places for physical activity: 96.6% (13th highest)
> Recreational and sports facilities: 70, or 21.7 per 100K (4th highest)
> Adult obesity rate: 14.9% (2nd lowest)
> Median household income: $83,755 (13th highest)
> Population: 326,078
Detailed Findings
Even little time spent exercising is better than none. The share of adult residents who are overweight or obese is notably higher in metropolitan areas where people are less active. In only five of the 50 cities on this list, the adult obesity rate is higher than the national rate of approximately 28%.
In cities where the highest share of adults exercise regularly, residents also tend to feel healthier. In these cities, a lower share of adults report being in poor or fair health than the 16% of adults who do nationwide. The opposite tends to be true in cities where a higher share of adults don’t exercise.
Income also appears to be a factor in whether people spend time working out. Of the 50 cities where the highest share of people are physically active, only five have a median household income below the national median of nearly $62,000. Income is also a factor in determining health. Wealthier people are more likely to exercise as they have more money to spare on gym memberships and working out apparel.
Methodology
To determine the cities getting the most exercise, 24/7 Tempo reviewed the most recent 2019 dataset collected by County Health Rankings & Roadmaps, a collaboration between the Robert Wood Johnson Foundation and the University of Wisconsin Population Health Institute. We created an index that includes two measures: the share of adults who report being physically active and the share of the population with access to places for physical activity. We applied the index to all 381 metro areas in the United States.
Obesity rates — the share of adult residents who report a body mass index of 30 or greater — also came from County Health Rankings. Population figures, as well as median household income came from the Census Bureau’s American Community Survey 2018 1-Year Estimates.
The number of fitness and recreational sports facilities that feature exercise and other active physical fitness conditioning per 100,000 people came from the Census’ County Business Patterns for 2017. Fitness centers per 100,000 people were adjusted according to the 2017 total population.
Take This Retirement Quiz To Get Matched With An Advisor Now (Sponsored)
Are you ready for retirement? Planning for retirement can be overwhelming, that’s why it could be a good idea to speak to a fiduciary financial advisor about your goals today.
Start by taking this retirement quiz right here from SmartAsset that will match you with up to 3 financial advisors that serve your area and beyond in 5 minutes. Smart Asset is now matching over 50,000 people a month.
Click here now to get started.
Thank you for reading! Have some feedback for us?
Contact the 24/7 Wall St. editorial team.
 24/7 Wall St.
 24/7 Wall St.

 24/7 Wall St.

 24/7 Wall St.
 24/7 Wall St.