Special Report
How This Winter Compares to Typical Winters in Your City

Published:
Last Updated:

January 2020 was the world’s warmest January on record, according to scientists at NOAA’s National Centers for Environmental Information, which maintains a 141 year climate history. This January was the fifth warmest on record in the United States, with the vast majority of weather stations reporting above average temperatures for November, December, and January.
NOAA based this departure from normal temperatures on the difference between historical and recent temperature averages. But while globally this January was the warmest, not all places have experienced similarly mild winter weather this year. (Here are America’s coldest cities.)
To capture some of these geographical differences and measure winter conditions in places most Americans reside, 24/7 Wall St. compared average temperature and precipitation data from NOAA’s U.S. Historical Climatology Network for weather stations near the country’s 50 largest cities. We analyzed data for over 1,200 weather stations.
The average temperature this winter through January was lower than the respective historical averages in just 15 of 1,218 U.S. weather stations. Temperatures were average or warmer than average in all other weather stations. However, climate change. However, climate change effects are nothing if not erratic, and despite an overall mild winter, in many areas of the U.S. winter is far from over. The 2020 Farmer’s Almanac predicted in early January severe winter storms in March and a late Spring. (Here are the 25 worst holiday storms of all time.)
It is important to note that the temperature and precipitation data used for this story come exclusively from the weather stations listed in the USHCN data base. Some of these weather stations lie within the municipal boundaries of the major city with which they are associated. In other cities, the closest weather station in the database can often be several miles outside city limits. As a result, the variances from the seasonal averages noted in this piece may not always be an exact reflection of conditions in the city, but rather, a close approximation. Distances between the weather station and the center of the city are noted below for consideration.
Click here to see how this winter compares to typical winters in your city
Click here to read our methodology

1. New York, New York
> Weather station & distance from city center: NY City Cntrl Park, NY, 6.3 miles
> Population: 8,443,713
> Temp difference this winter compared to historical avg.: 3.1 °F
> Avg. temp this winter through Jan. 2020: 40.5 °F
> Avg. temp on record Nov-Jan 2019 (150 years through 2019): 37.3 °F
> Avg. precipitation this winter through Jan. 2020: 3.7 inches
> Avg. precipitation on record Nov-Jan (179 years through 2019): 3.5 inches
[in-text-ad]
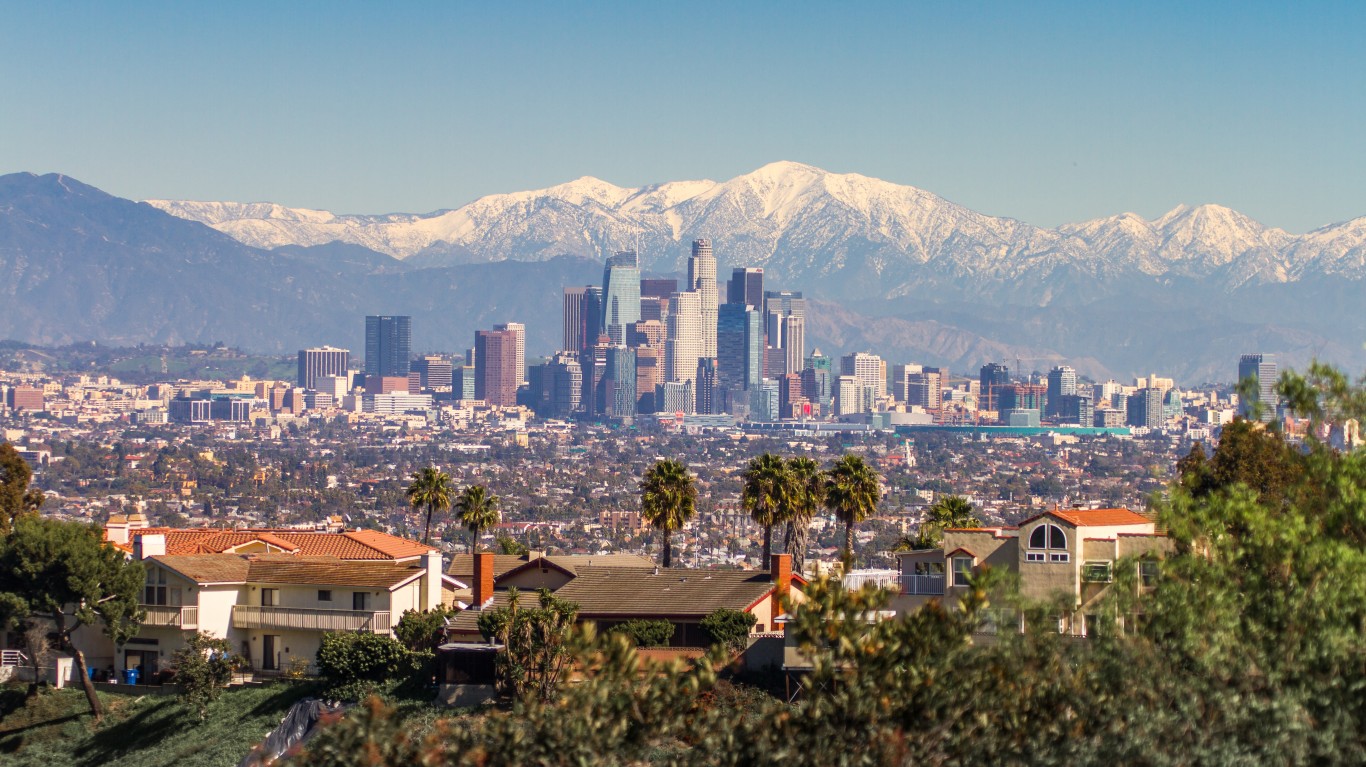
2. Los Angeles, California
> Weather station & distance from city center: Pasadena, CA, 15.2 miles
> Population: 3,959,657
> Temp difference this winter compared to historical avg.: 3.2 °F
> Avg. temp this winter through Jan. 2020: 57.7 °F
> Avg. temp on record Nov-Jan 2019 (119 years through 2019): 54.5 °F
> Avg. precipitation this winter through Jan. 2020: 2.5 inches
> Avg. precipitation on record Nov-Jan (127 years through 2019): 3.0 inches
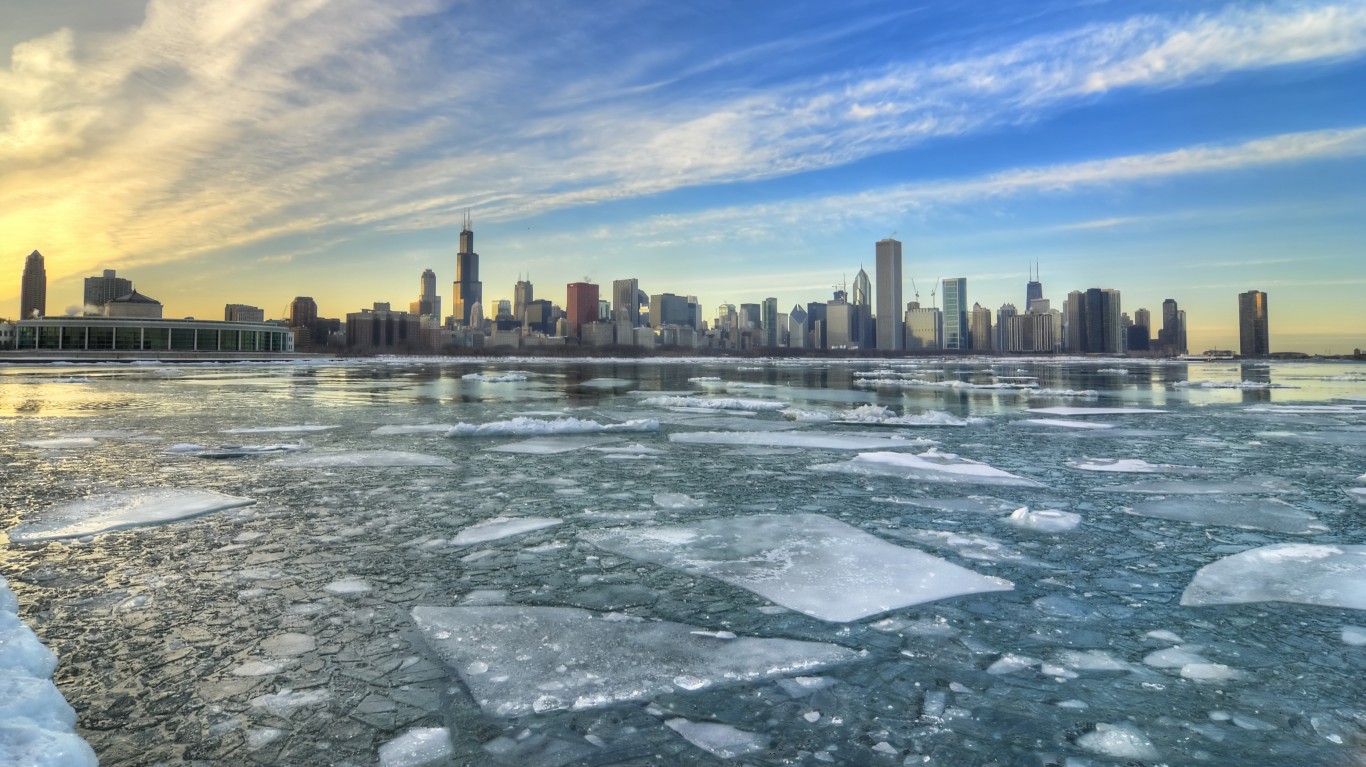
3. Chicago, Illinois
> Weather station & distance from city center: Hobart 2 Wnw, IN, 28.9 miles
> Population: 2,718,555
> Temp difference this winter compared to historical avg.: 3.2 °F
> Avg. temp this winter through Jan. 2020: 32.2 °F
> Avg. temp on record Nov-Jan 2019 (125 years through 2019): 29.0 °F
> Avg. precipitation this winter through Jan. 2020: 1.8 inches
> Avg. precipitation on record Nov-Jan (123 years through 2019): 2.2 inches
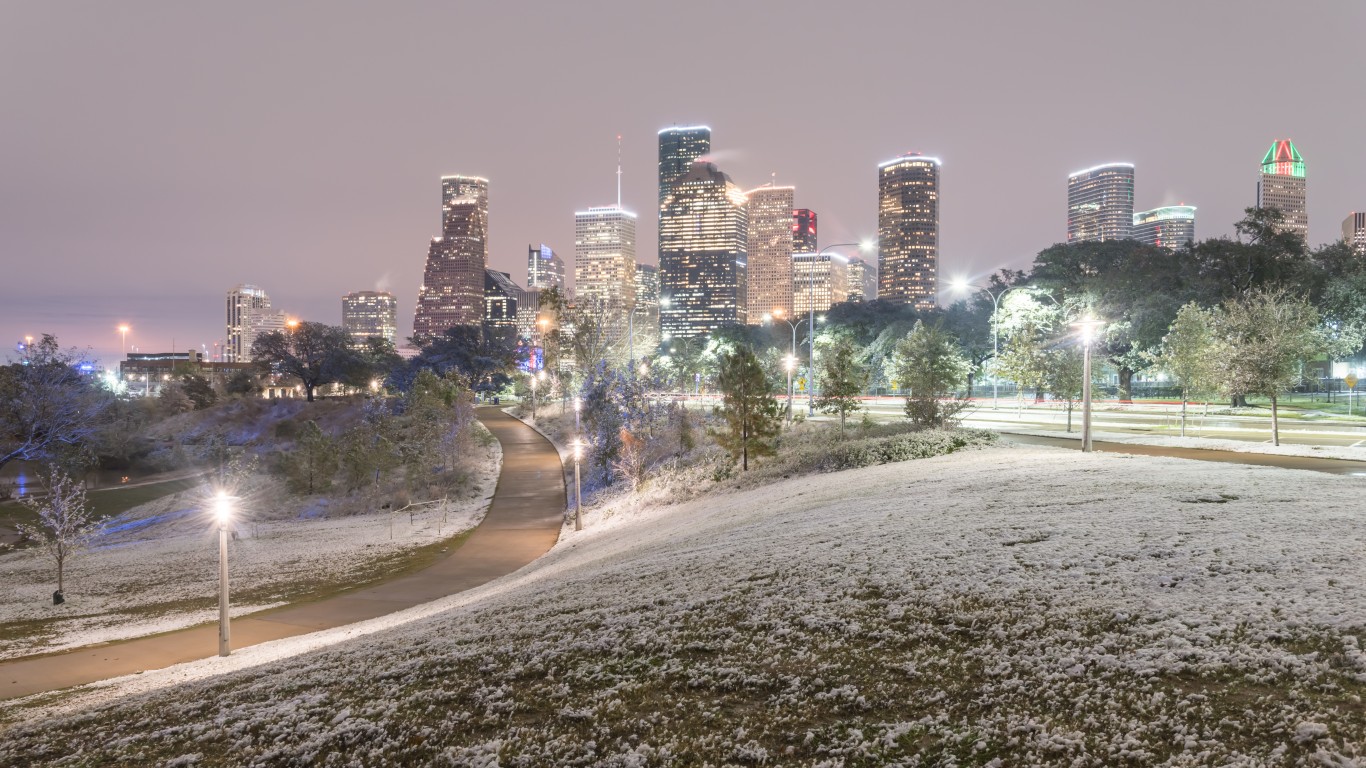
4. Houston, Texas
> Weather station & distance from city center: Liberty, TX, 40.3 miles
> Population: 2,295,982
> Temp difference this winter compared to historical avg.: 2.0 °F
> Avg. temp this winter through Jan. 2020: 58.2 °F
> Avg. temp on record Nov-Jan 2019 (122 years through 2019): 56.2 °F
> Avg. precipitation this winter through Jan. 2020: 2.5 inches
> Avg. precipitation on record Nov-Jan (121 years through 2019): 4.6 inches
[in-text-ad-2]

5. Phoenix, Arizona
> Weather station & distance from city center: Buckeye, AZ, 31.5 miles
> Population: 1,610,071
> Temp difference this winter compared to historical avg.: 2.6 °F
> Avg. temp this winter through Jan. 2020: 55.1 °F
> Avg. temp on record Nov-Jan 2019 (122 years through 2019): 52.5 °F
> Avg. precipitation this winter through Jan. 2020: 0.8 inches
> Avg. precipitation on record Nov-Jan (131 years through 2019): 0.7 inches

6. Philadelphia, Pennsylvania
> Weather station & distance from city center: Moorestown, NJ, 9.5 miles
> Population: 1,575,522
> Temp difference this winter compared to historical avg.: 2.3 °F
> Avg. temp this winter through Jan. 2020: 40.1 °F
> Avg. temp on record Nov-Jan 2019 (131 years through 2019): 37.8 °F
> Avg. precipitation this winter through Jan. 2020: 3.6 inches
> Avg. precipitation on record Nov-Jan (155 years through 2019): 3.4 inches
[in-text-ad]
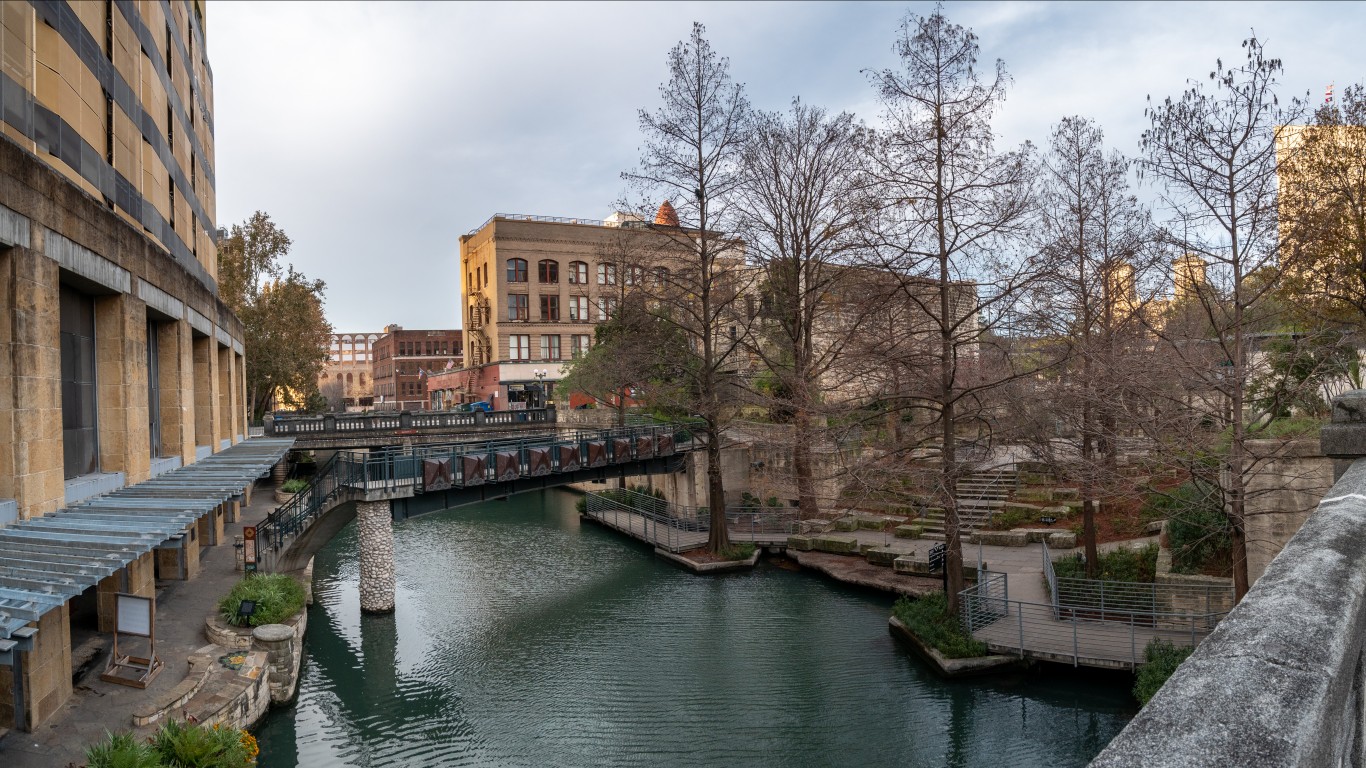
7. San Antonio, Texas
> Weather station & distance from city center: San Antonio Intl Ap, TX, 5.7 miles
> Population: 1,486,521
> Temp difference this winter compared to historical avg.: 2.4 °F
> Avg. temp this winter through Jan. 2020: 57.3 °F
> Avg. temp on record Nov-Jan 2019 (127 years through 2019): 55.0 °F
> Avg. precipitation this winter through Jan. 2020: 1.0 inches
> Avg. precipitation on record Nov-Jan (149 years through 2019): 1.8 inches

8. San Diego, California
> Weather station & distance from city center: Chula Vista, CA, 13.4 miles
> Population: 1,401,932
> Temp difference this winter compared to historical avg.: 1.8 °F
> Avg. temp this winter through Jan. 2020: 57.4 °F
> Avg. temp on record Nov-Jan 2019 (119 years through 2019): 55.6 °F
> Avg. precipitation this winter through Jan. 2020: 2.1 inches
> Avg. precipitation on record Nov-Jan (120 years through 2019): 1.4 inches

9. Dallas, Texas
> Weather station & distance from city center: Greenville Kgvl Radio, TX, 46.6 miles
> Population: 1,318,806
> Temp difference this winter compared to historical avg.: 0.1 °F
> Avg. temp this winter through Jan. 2020: 49.9 °F
> Avg. temp on record Nov-Jan 2019 (119 years through 2019): 49.7 °F
> Avg. precipitation this winter through Jan. 2020: 2.6 inches
> Avg. precipitation on record Nov-Jan (121 years through 2019): 3.0 inches
[in-text-ad-2]

10. San Jose, California
> Weather station & distance from city center: Santa Cruz, CA, 22.9 miles
> Population: 1,026,658
> Temp difference this winter compared to historical avg.: 1.3 °F
> Avg. temp this winter through Jan. 2020: 53.2 °F
> Avg. temp on record Nov-Jan (126 years through 2019): 51.8 °F
> Avg. precipitation this winter through Jan. 2020: 3.1 inches
> Avg. precipitation on record Nov-Jan (142 years through 2019): 4.9 inches

11. Austin, Texas
> Weather station & distance from city center: Blanco, TX, 42.6 miles
> Population: 935,755
> Temp difference this winter compared to historical avg.: 2.1 °F
> Avg. temp this winter through Jan. 2020: 52.4 °F
> Avg. temp on record Nov-Jan (126 years through 2019): 50.4 °F
> Avg. precipitation this winter through Jan. 2020: 3.2 inches
> Avg. precipitation on record Nov-Jan (124 years through 2019): 2.2 inches
[in-text-ad]
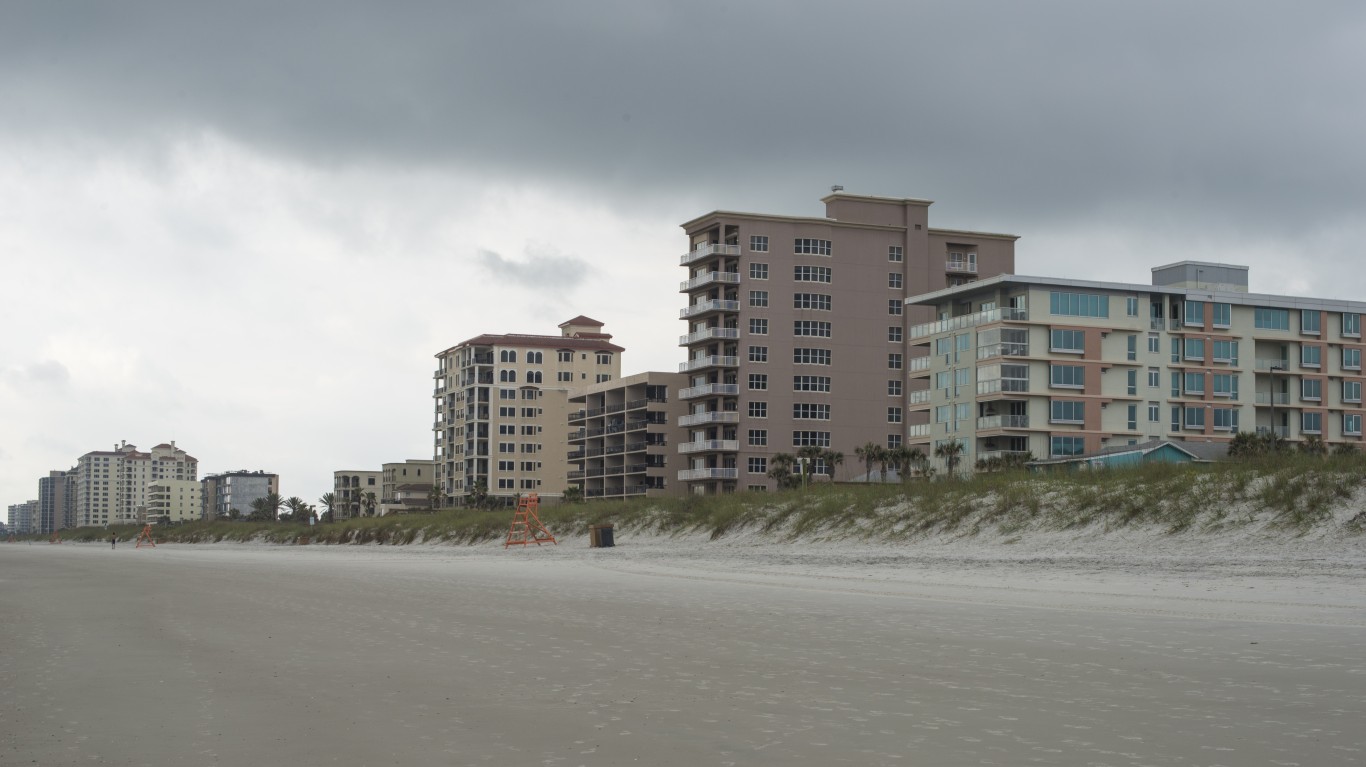
12. Jacksonville, Florida
> Weather station & distance from city center: Fernandina Beach, FL, 25.8 miles
> Population: 878,907
> Temp difference this winter compared to historical avg.: 2.6 °F
> Avg. temp this winter through Jan. 2020: 60.4 °F
> Avg. temp on record Nov-Jan 2019 (127 years through 2019): 57.7 °F
> Avg. precipitation this winter through Jan. 2020: 3.2 inches
> Avg. precipitation on record Nov-Jan (128 years through 2019): 2.7 inches

13. San Francisco, California
> Weather station & distance from city center: Berkeley, CA, 13.0 miles
> Population: 870,044
> Temp difference this winter compared to historical avg.: 2.1 °F
> Avg. temp this winter through Jan. 2020: 52.0 °F
> Avg. temp on record Nov-Jan (126 years through 2019): 49.9 °F
> Avg. precipitation this winter through Jan. 2020: 2.8 inches
> Avg. precipitation on record Nov-Jan (133 years through 2019): 4.0 inches
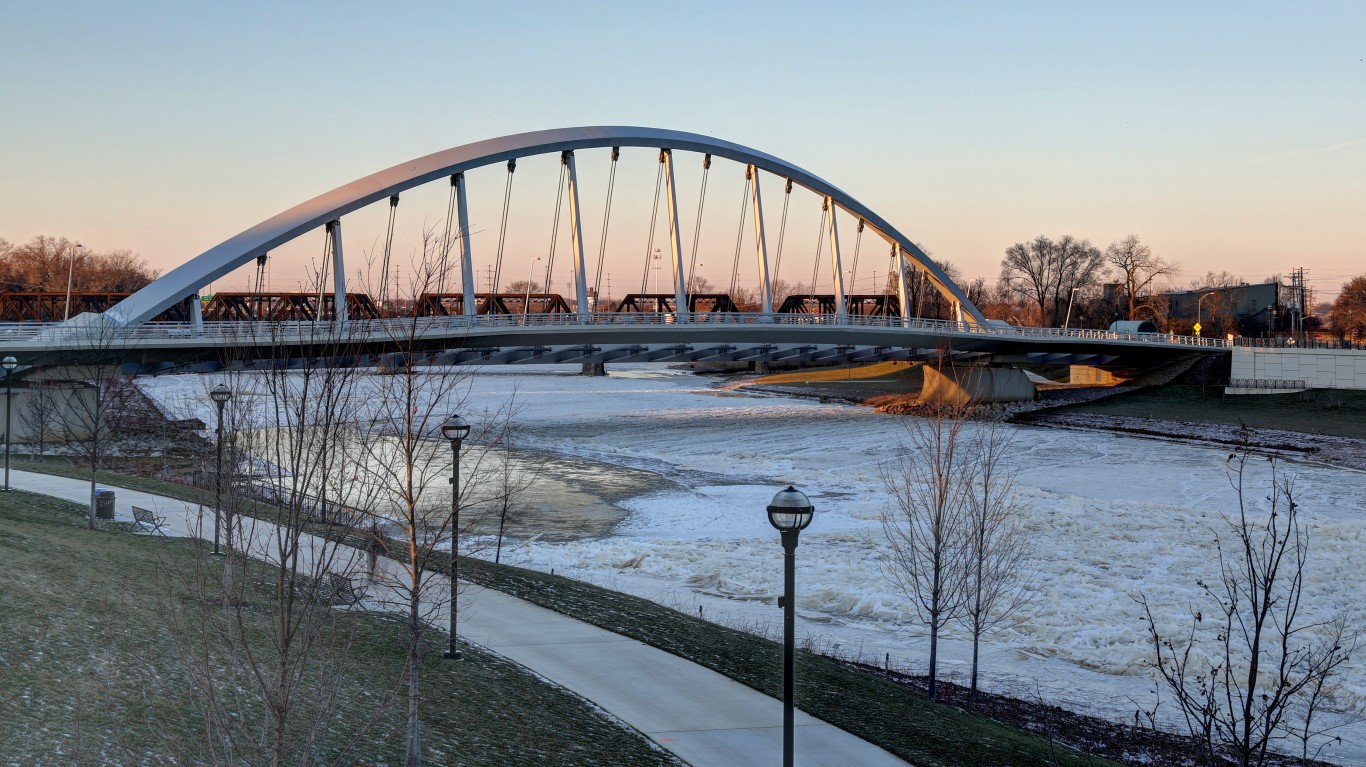
14. Columbus, Ohio
> Weather station & distance from city center: Delaware, OH, 23.4 miles
> Population: 867,628
> Temp difference this winter compared to historical avg.: 2.7 °F
> Avg. temp this winter through Jan. 2020: 36.9 °F
> Avg. temp on record Nov-Jan (126 years through 2019): 34.3 °F
> Avg. precipitation this winter through Jan. 2020: 2.6 inches
> Avg. precipitation on record Nov-Jan (126 years through 2019): 2.7 inches
[in-text-ad-2]

15. Indianapolis city (balance), Indiana
> Weather station & distance from city center: Whitestown, IN, 18.7 miles
> Population: 857,637
> Temp difference this winter compared to historical avg.: 2.9 °F
> Avg. temp this winter through Jan. 2020: 34.2 °F
> Avg. temp on record Nov-Jan (126 years through 2019): 31.3 °F
> Avg. precipitation this winter through Jan. 2020: 2.7 inches
> Avg. precipitation on record Nov-Jan (127 years through 2019): 2.9 inches
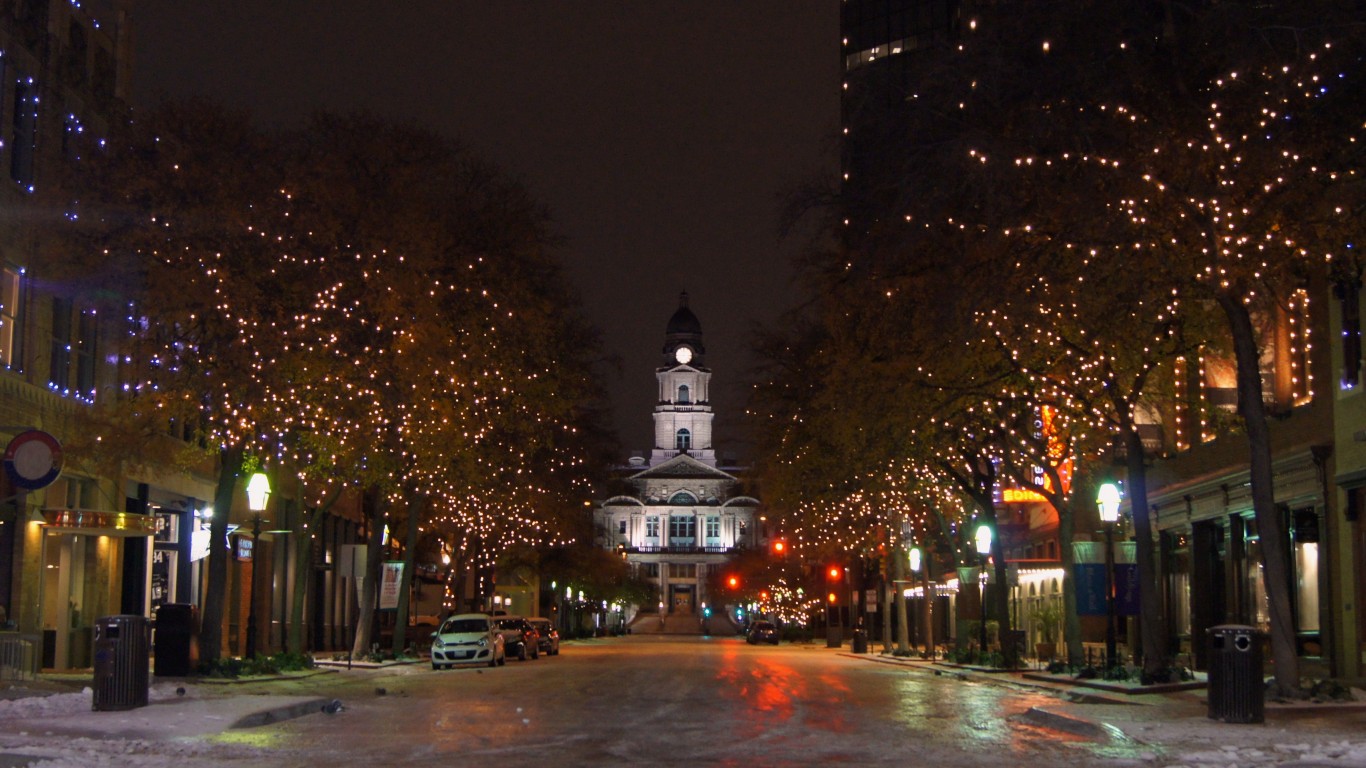
16. Fort Worth, Texas
> Weather station & distance from city center: Weatherford, TX, 24.7 miles
> Population: 855,786
> Temp difference this winter compared to historical avg.: 0.0 °F
> Avg. temp this winter through Jan. 2020: 48.8 °F
> Avg. temp on record Nov-Jan 2019 (123 years through 2019): 48.8 °F
> Avg. precipitation this winter through Jan. 2020: 2.4 inches
> Avg. precipitation on record Nov-Jan (129 years through 2019): 2.0 inches
[in-text-ad]

17. Charlotte, North Carolina
> Weather station & distance from city center: Winthrop Univ, SC, 21.8 miles
> Population: 841,611
> Temp difference this winter compared to historical avg.: 2.0 °F
> Avg. temp this winter through Jan. 2020: 47.6 °F
> Avg. temp on record Nov-Jan (126 years through 2019): 45.6 °F
> Avg. precipitation this winter through Jan. 2020: 3.2 inches
> Avg. precipitation on record Nov-Jan (127 years through 2019): 3.5 inches

18. Seattle, Washington
> Weather station & distance from city center: Seattle Urban Site, WA, 2.3 miles
> Population: 708,823
> Temp difference this winter compared to historical avg.: 1.4 °F
> Avg. temp this winter through Jan. 2020: 45.2 °F
> Avg. temp on record Nov-Jan 2019 (124 years through 2019): 43.9 °F
> Avg. precipitation this winter through Jan. 2020: 4.8 inches
> Avg. precipitation on record Nov-Jan (126 years through 2019): 5.3 inches
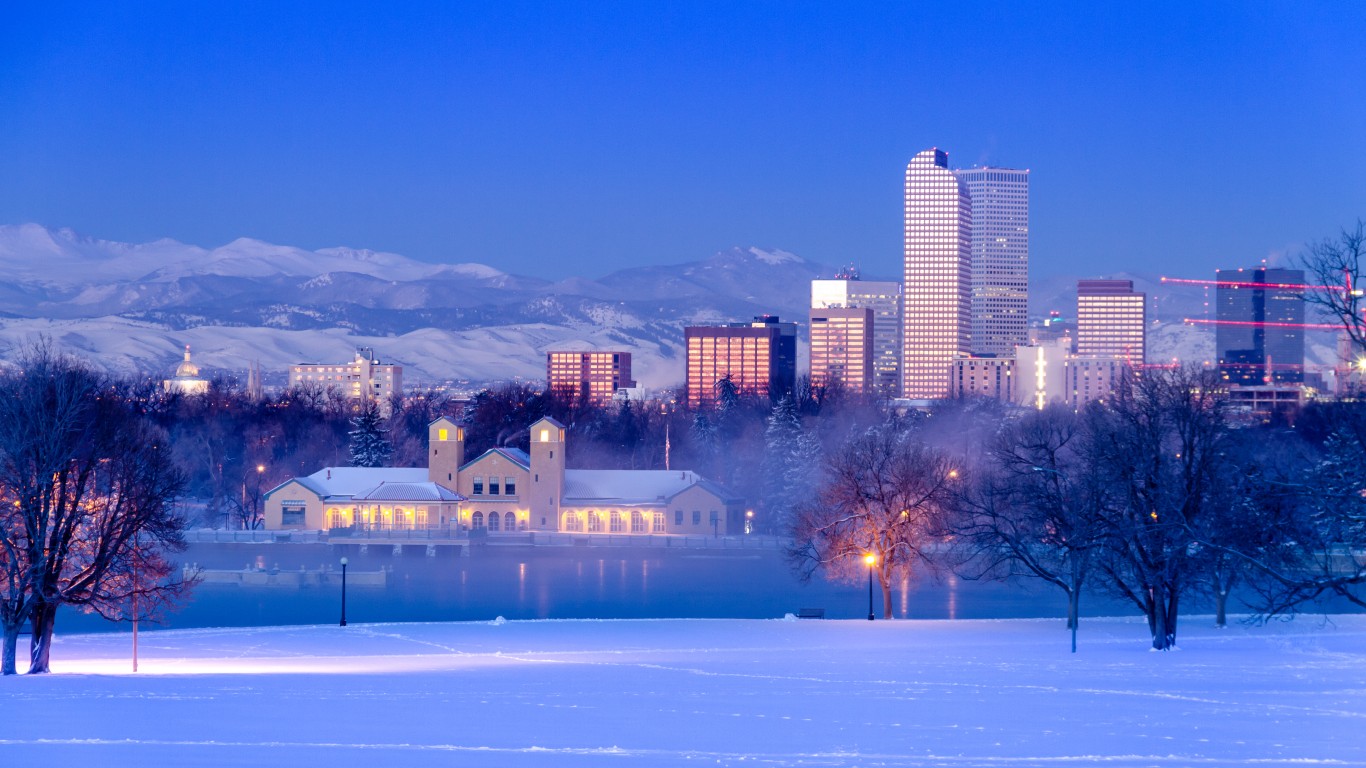
19. Denver, Colorado
> Weather station & distance from city center: Boulder, CO, 26.1 miles
> Population: 693,417
> Temp difference this winter compared to historical avg.: 2.5 °F
> Avg. temp this winter through Jan. 2020: 35.5 °F
> Avg. temp on record Nov-Jan 2019 (123 years through 2019): 33.0 °F
> Avg. precipitation this winter through Jan. 2020: 0.9 inches
> Avg. precipitation on record Nov-Jan (124 years through 2019): 0.8 inches
[in-text-ad-2]

20. Washington, District of Columbia
> Weather station & distance from city center: Beltsville, MD, 9.8 miles
> Population: 684,498
> Temp difference this winter compared to historical avg.: 3.2 °F
> Avg. temp this winter through Jan. 2020: 40.6 °F
> Avg. temp on record Nov-Jan 2019 (125 years through 2019): 37.5 °F
> Avg. precipitation this winter through Jan. 2020: 2.7 inches
> Avg. precipitation on record Nov-Jan (131 years through 2019): 3.0 inches
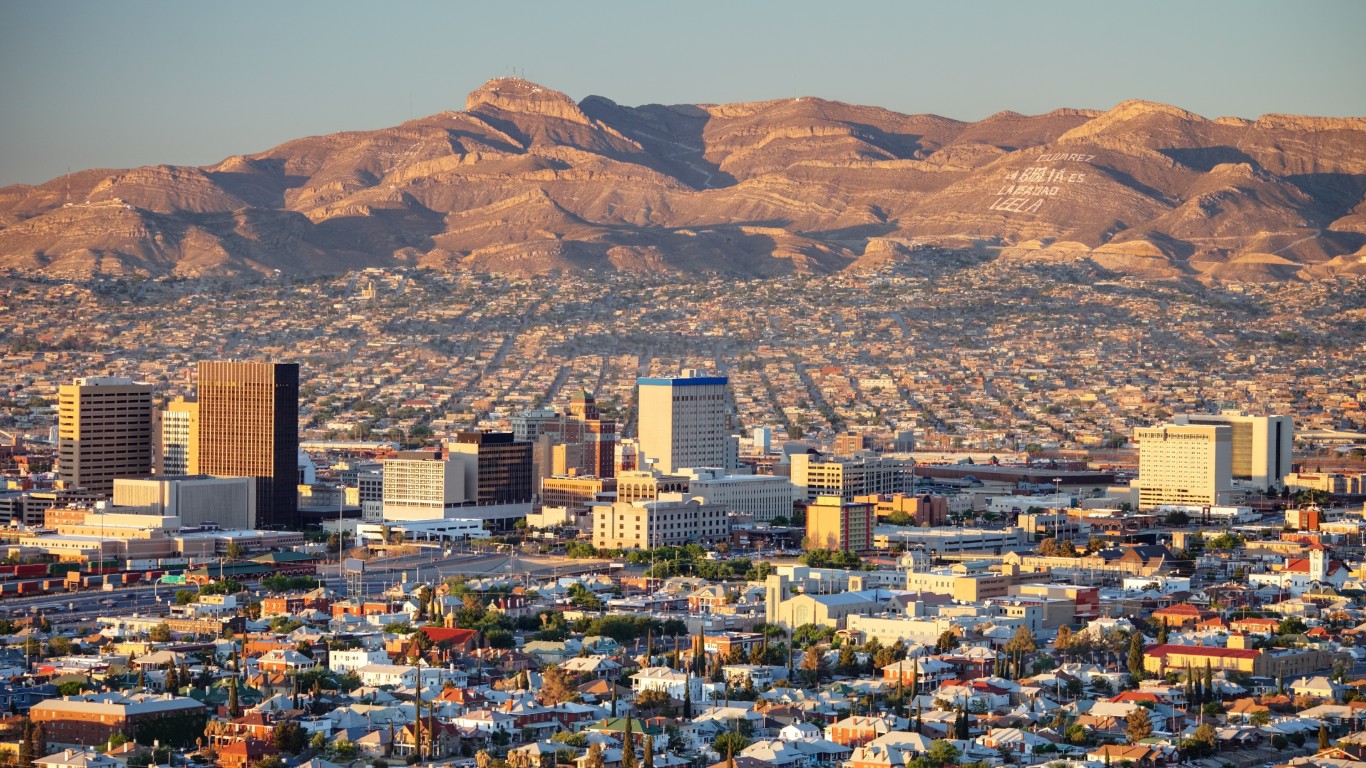
21. El Paso, Texas
> Weather station & distance from city center: El Paso Ap, TX, 4.1 miles
> Population: 680,354
> Temp difference this winter compared to historical avg.: 2.0 °F
> Avg. temp this winter through Jan. 2020: 50.1 °F
> Avg. temp on record Nov-Jan 2019 (131 years through 2019): 48.1 °F
> Avg. precipitation this winter through Jan. 2020: 0.9 inches
> Avg. precipitation on record Nov-Jan (142 years through 2019): 0.5 inches
[in-text-ad]

22. Boston, Massachusetts
> Weather station & distance from city center: Blue Hill, MA, 7.5 miles
> Population: 679,413
> Temp difference this winter compared to historical avg.: 2.6 °F
> Avg. temp this winter through Jan. 2020: 34.6 °F
> Avg. temp on record Nov-Jan 2019 (135 years through 2019): 32.0 °F
> Avg. precipitation this winter through Jan. 2020: 4.4 inches
> Avg. precipitation on record Nov-Jan (134 years through 2019): 4.3 inches
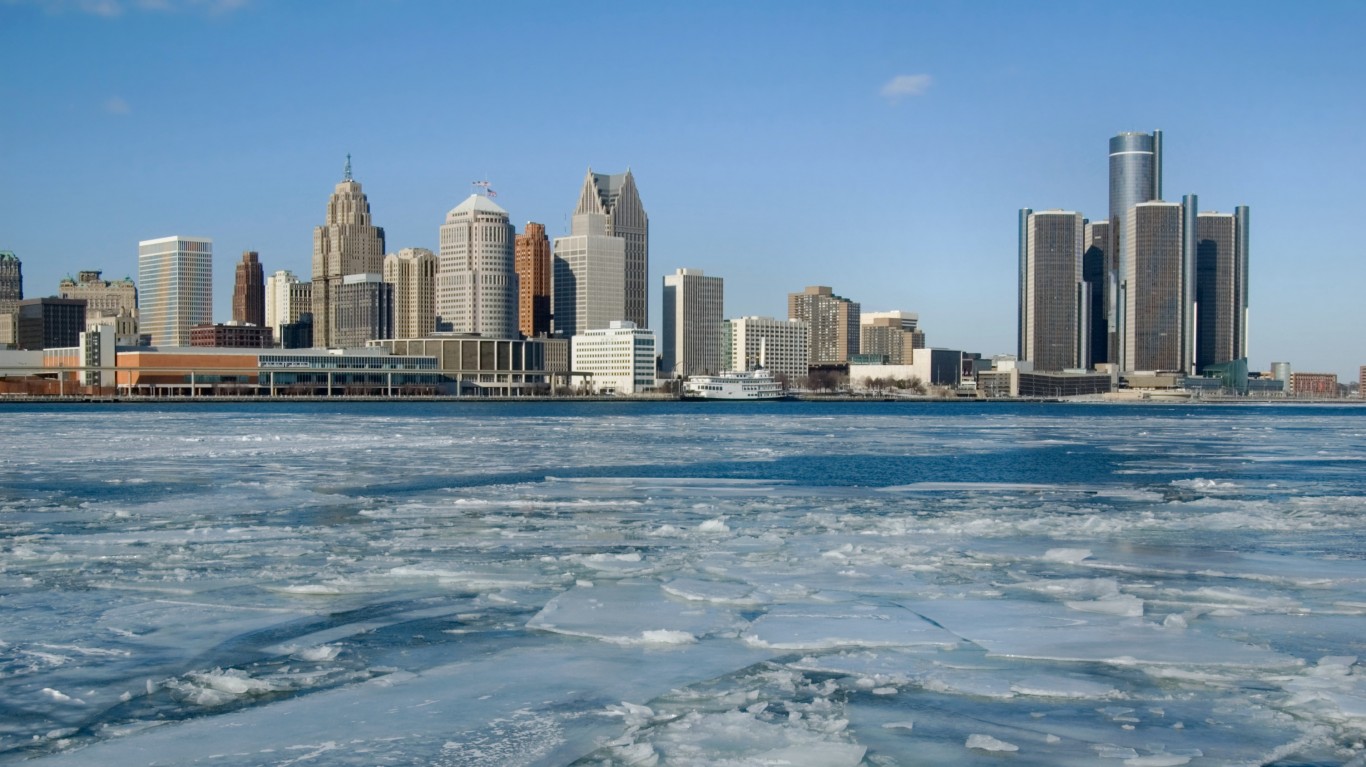
23. Detroit, Michigan
> Weather station & distance from city center: Mt Clemens Ang Base, MI, 21.2 miles
> Population: 677,155
> Temp difference this winter compared to historical avg.: 4.0 °F
> Avg. temp this winter through Jan. 2020: 33.6 °F
> Avg. temp on record Nov-Jan 2019 (132 years through 2019): 29.6 °F
> Avg. precipitation this winter through Jan. 2020: 2.1 inches
> Avg. precipitation on record Nov-Jan (137 years through 2019): 2.1 inches

24. Nashville-Davidson metropolitan government (balance), Tennessee
> Weather station & distance from city center: Murfreesboro 5 N, TN, 28.8 miles
> Population: 660,062
> Temp difference this winter compared to historical avg.: 1.8 °F
> Avg. temp this winter through Jan. 2020: 44.1 °F
> Avg. temp on record Nov-Jan (126 years through 2019): 42.3 °F
> Avg. precipitation this winter through Jan. 2020: 5.3 inches
> Avg. precipitation on record Nov-Jan (137 years through 2019): 4.5 inches
[in-text-ad-2]

25. Memphis, Tennessee
> Weather station & distance from city center: Hernando, MS, 19.9 miles
> Population: 653,248
> Temp difference this winter compared to historical avg.: 1.2 °F
> Avg. temp this winter through Jan. 2020: 46.0 °F
> Avg. temp on record Nov-Jan 2019 (128 years through 2019): 44.9 °F
> Avg. precipitation this winter through Jan. 2020: 3.3 inches
> Avg. precipitation on record Nov-Jan (128 years through 2019): 4.6 inches

26. Portland, Oregon
> Weather station & distance from city center: Vancouver 4 Nne, WA, 9.7 miles
> Population: 639,387
> Temp difference this winter compared to historical avg.: 3.6 °F
> Avg. temp this winter through Jan. 2020: 41.9 °F
> Avg. temp on record Nov-Jan (126 years through 2019): 38.3 °F
> Avg. precipitation this winter through Jan. 2020: 4.7 inches
> Avg. precipitation on record Nov-Jan (144 years through 2019): 6.0 inches
[in-text-ad]

27. Oklahoma City, Oklahoma
> Weather station & distance from city center: Guthrie 5S, OK, 25.0 miles
> Population: 637,284
> Temp difference this winter compared to historical avg.: 3.3 °F
> Avg. temp this winter through Jan. 2020: 44.2 °F
> Avg. temp on record Nov-Jan 2019 (125 years through 2019): 40.9 °F
> Avg. precipitation this winter through Jan. 2020: 2.1 inches
> Avg. precipitation on record Nov-Jan (127 years through 2019): 1.6 inches
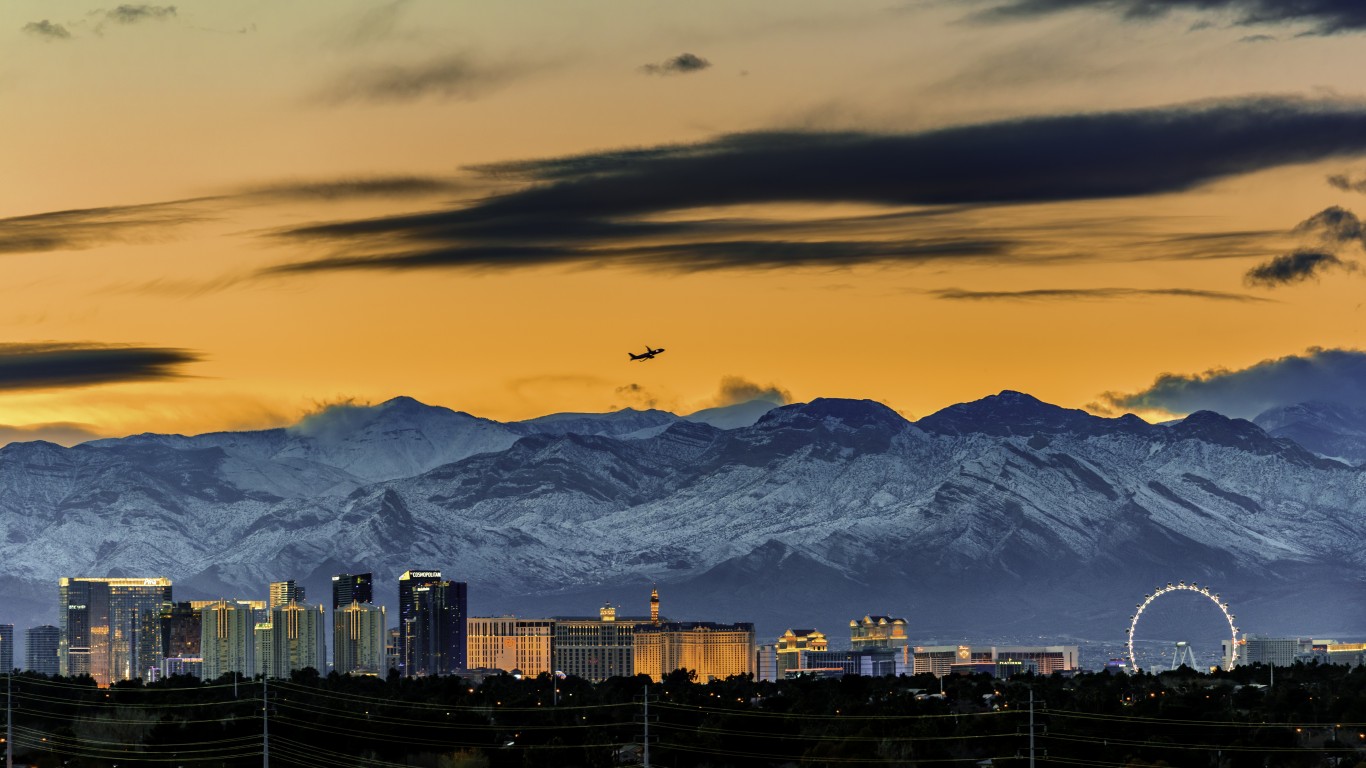
28. Las Vegas, Nevada
> Weather station & distance from city center: Boulder City, NV, 29.2 miles
> Population: 626,637
> Temp difference this winter compared to historical avg.: 1.1 °F
> Avg. temp this winter through Jan. 2020: 51.2 °F
> Avg. temp on record Nov-Jan 2019 (113 years through 2019): 50.1 °F
> Avg. precipitation this winter through Jan. 2020: 0.8 inches
> Avg. precipitation on record Nov-Jan (120 years through 2019): 0.5 inches

29. Louisville/Jefferson County metro government (balance), Kentucky
> Weather station & distance from city center: Charlestown 5 Nnw, IN, 22.1 miles
> Population: 617,032
> Temp difference this winter compared to historical avg.: 2.7 °F
> Avg. temp this winter through Jan. 2020: 39.1 °F
> Avg. temp on record Nov-Jan (126 years through 2019): 36.4 °F
> Avg. precipitation this winter through Jan. 2020: 4.0 inches
> Avg. precipitation on record Nov-Jan (127 years through 2019): 3.6 inches
[in-text-ad-2]
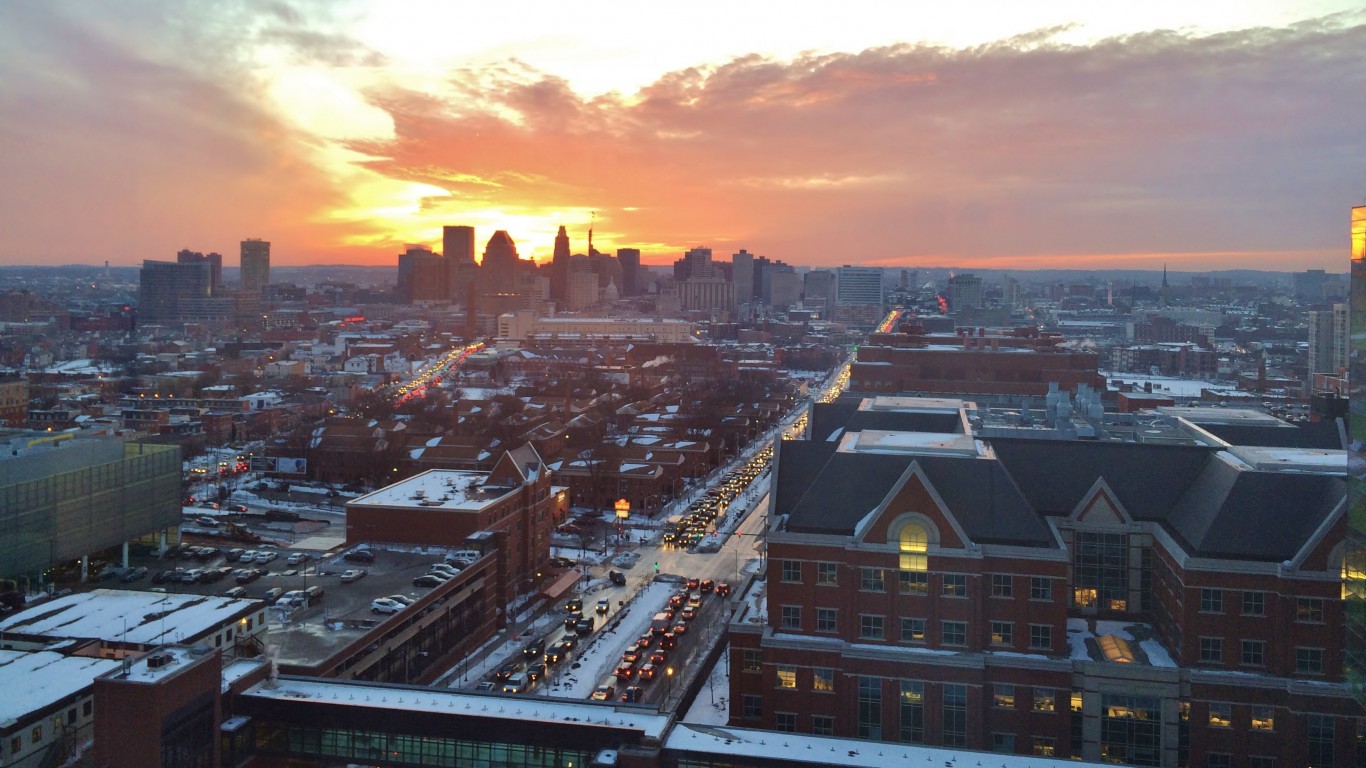
30. Baltimore, Maryland
> Weather station & distance from city center: Md Sci Ctr Baltimore, MD, 1.7 miles
> Population: 614,700
> Temp difference this winter compared to historical avg.: 2.6 °F
> Avg. temp this winter through Jan. 2020: 43.3 °F
> Avg. temp on record Nov-Jan (126 years through 2019): 40.7 °F
> Avg. precipitation this winter through Jan. 2020: 2.6 inches
> Avg. precipitation on record Nov-Jan (158 years through 2019): 3.2 inches

31. Milwaukee, Wisconsin
> Weather station & distance from city center: Milwaukee Mt Mary Col, WI, 3.2 miles
> Population: 596,886
> Temp difference this winter compared to historical avg.: 4.4 °F
> Avg. temp this winter through Jan. 2020: 31.5 °F
> Avg. temp on record Nov-Jan 2019 (145 years through 2019): 27.1 °F
> Avg. precipitation this winter through Jan. 2020: 1.7 inches
> Avg. precipitation on record Nov-Jan (128 years through 2019): 1.8 inches
[in-text-ad]
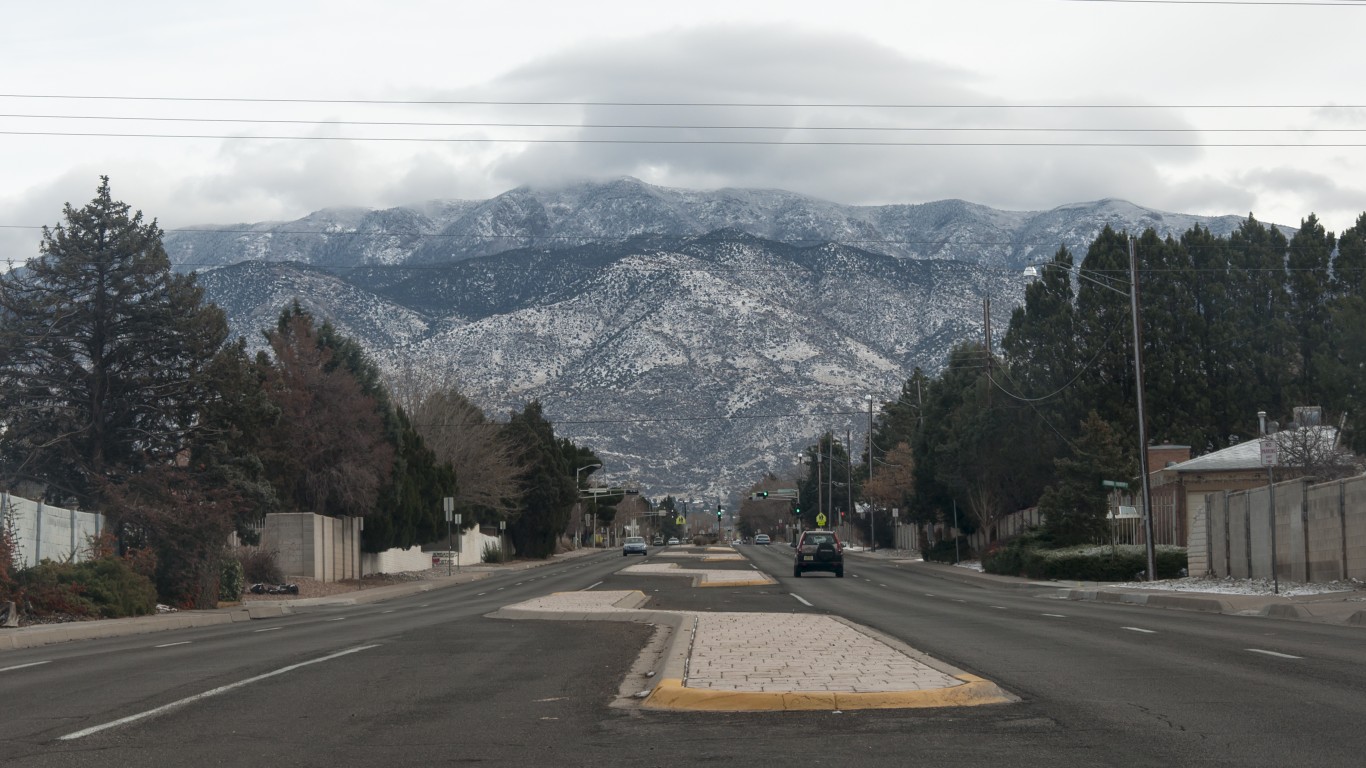
32. Albuquerque, New Mexico
> Weather station & distance from city center: Los Lunas 3 Ssw, NM, 24.2 miles
> Population: 559,202
> Temp difference this winter compared to historical avg.: 2.0 °F
> Avg. temp this winter through Jan. 2020: 36.9 °F
> Avg. temp on record Nov-Jan 2019 (125 years through 2019): 35.0 °F
> Avg. precipitation this winter through Jan. 2020: 1.0 inches
> Avg. precipitation on record Nov-Jan (131 years through 2019): 0.4 inches
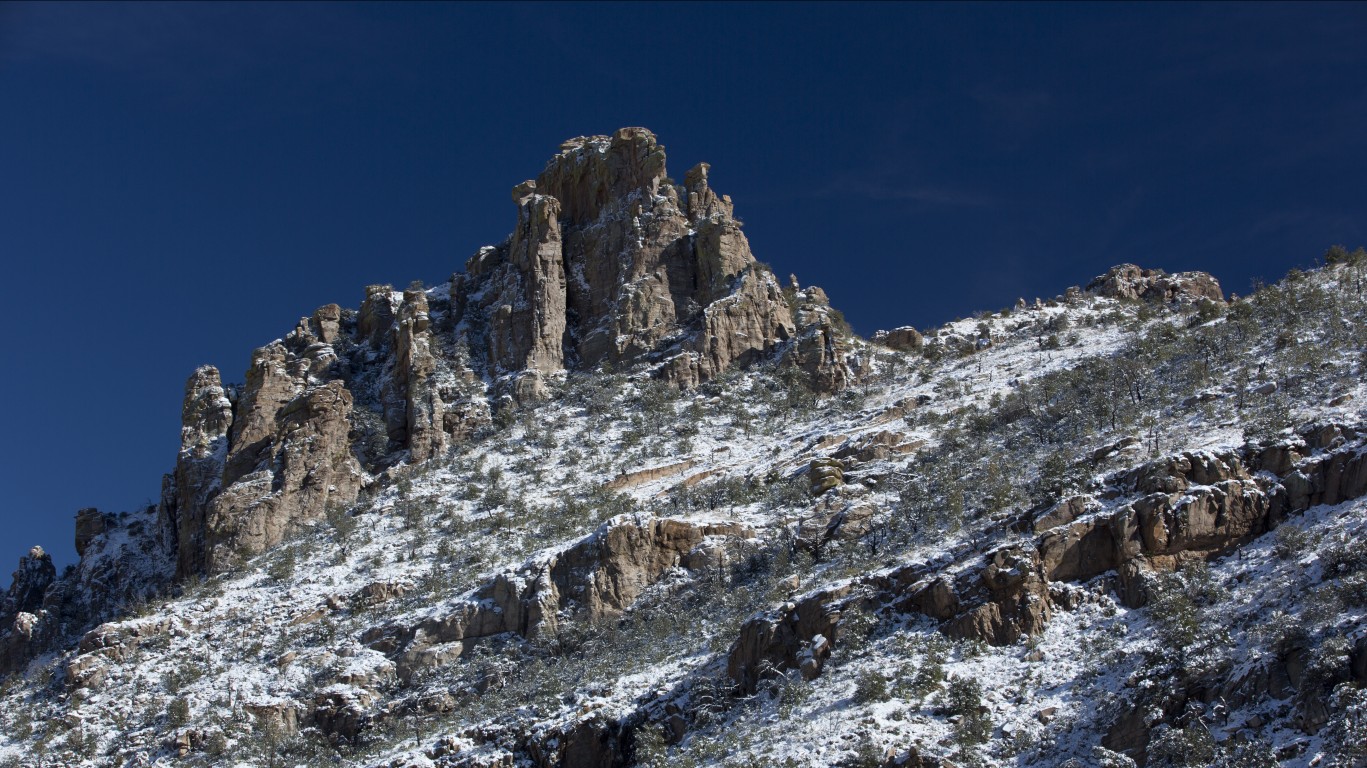
33. Tucson, Arizona
> Weather station & distance from city center: Tucson Wfo, AZ, 6.8 miles
> Population: 539,216
> Temp difference this winter compared to historical avg.: 1.4 °F
> Avg. temp this winter through Jan. 2020: 57.0 °F
> Avg. temp on record Nov-Jan (126 years through 2019): 55.6 °F
> Avg. precipitation this winter through Jan. 2020: 1.2 inches
> Avg. precipitation on record Nov-Jan (152 years through 2019): 0.8 inches

34. Fresno, California
> Weather station & distance from city center: Fresno Yosemite AP, Ca, 4.1 miles
> Population: 522,277
> Temp difference this winter compared to historical avg.: 3.4 °F
> Avg. temp this winter through Jan. 2020: 51.9 °F
> Avg. temp on record Nov-Jan 2019 (124 years through 2019): 48.5 °F
> Avg. precipitation this winter through Jan. 2020: 1.2 inches
> Avg. precipitation on record Nov-Jan (142 years through 2019): 1.5 inches
[in-text-ad-2]
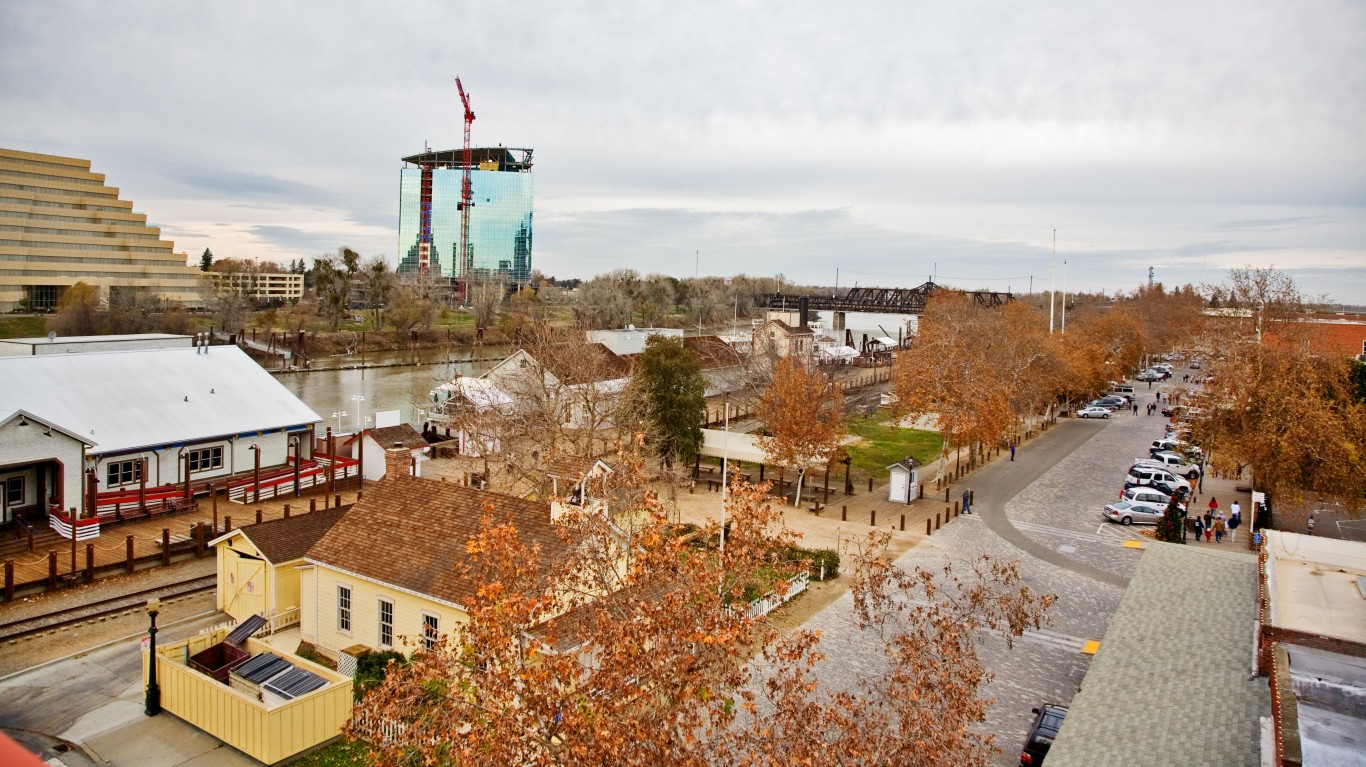
35. Sacramento, California
> Weather station & distance from city center: Davis 2 Wsw Exp, CA, 16.8 miles
> Population: 495,011
> Temp difference this winter compared to historical avg.: 3.9 °F
> Avg. temp this winter through Jan. 2020: 51.9 °F
> Avg. temp on record Nov-Jan (126 years through 2019): 48.0 °F
> Avg. precipitation this winter through Jan. 2020: 2.9 inches
> Avg. precipitation on record Nov-Jan (148 years through 2019): 3.0 inches

36. Mesa, Arizona
> Weather station & distance from city center: Chandler Heights, AZ, 13.7 miles
> Population: 491,194
> Temp difference this winter compared to historical avg.: 2.2 °F
> Avg. temp this winter through Jan. 2020: 55.7 °F
> Avg. temp on record Nov-Jan (126 years through 2019): 53.5 °F
> Avg. precipitation this winter through Jan. 2020: 1.6 inches
> Avg. precipitation on record Nov-Jan (123 years through 2019): 0.8 inches
[in-text-ad]

37. Kansas City, Missouri
> Weather station & distance from city center: Olathe 3E, KS, 19.7 miles
> Population: 481,417
> Temp difference this winter compared to historical avg.: 2.3 °F
> Avg. temp this winter through Jan. 2020: 37.5 °F
> Avg. temp on record Nov-Jan 2019 (127 years through 2019): 35.2 °F
> Avg. precipitation this winter through Jan. 2020: 1.9 inches
> Avg. precipitation on record Nov-Jan (136 years through 2019): 1.6 inches

38. Atlanta, Georgia
> Weather station & distance from city center: Newnan 5N, GA, 31.2 miles
> Population: 479,655
> Temp difference this winter compared to historical avg.: 2.6 °F
> Avg. temp this winter through Jan. 2020: 48.4 °F
> Avg. temp on record Nov-Jan (126 years through 2019): 45.8 °F
> Avg. precipitation this winter through Jan. 2020: 6.5 inches
> Avg. precipitation on record Nov-Jan (128 years through 2019): 4.4 inches

39. Long Beach, California
> Weather station & distance from city center: Newport Beach Harbor, CA, 21.3 miles
> Population: 468,883
> Temp difference this winter compared to historical avg.: 2.1 °F
> Avg. temp this winter through Jan. 2020: 57.9 °F
> Avg. temp on record Nov-Jan (126 years through 2019): 55.8 °F
> Avg. precipitation this winter through Jan. 2020: 1.7 inches
> Avg. precipitation on record Nov-Jan (121 years through 2019): 1.7 inches
[in-text-ad-2]
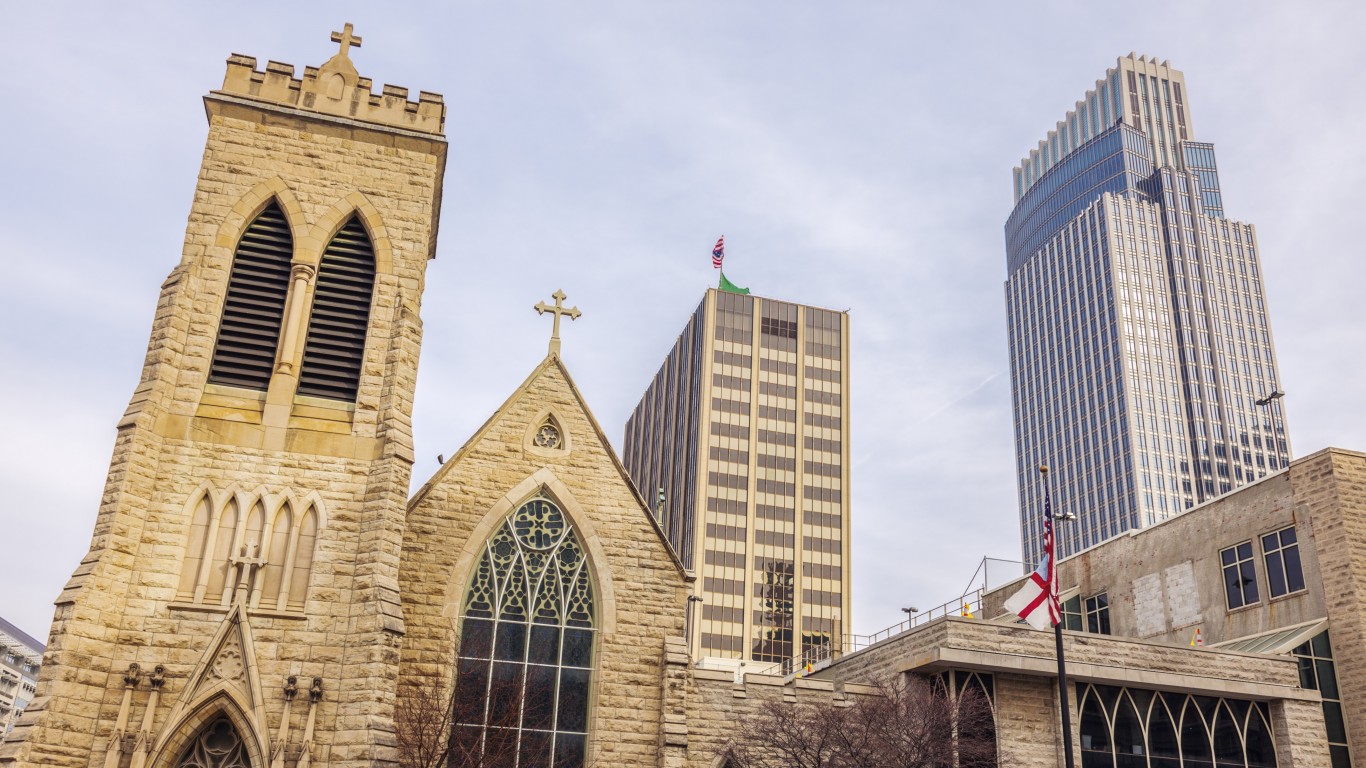
40. Omaha, Nebraska
> Weather station & distance from city center: Ashland No 2, NE, 22.9 miles
> Population: 465,112
> Temp difference this winter compared to historical avg.: 1.7 °F
> Avg. temp this winter through Jan. 2020: 31.4 °F
> Avg. temp on record Nov-Jan (126 years through 2019): 29.7 °F
> Avg. precipitation this winter through Jan. 2020: 1.3 inches
> Avg. precipitation on record Nov-Jan (133 years through 2019): 0.9 inches
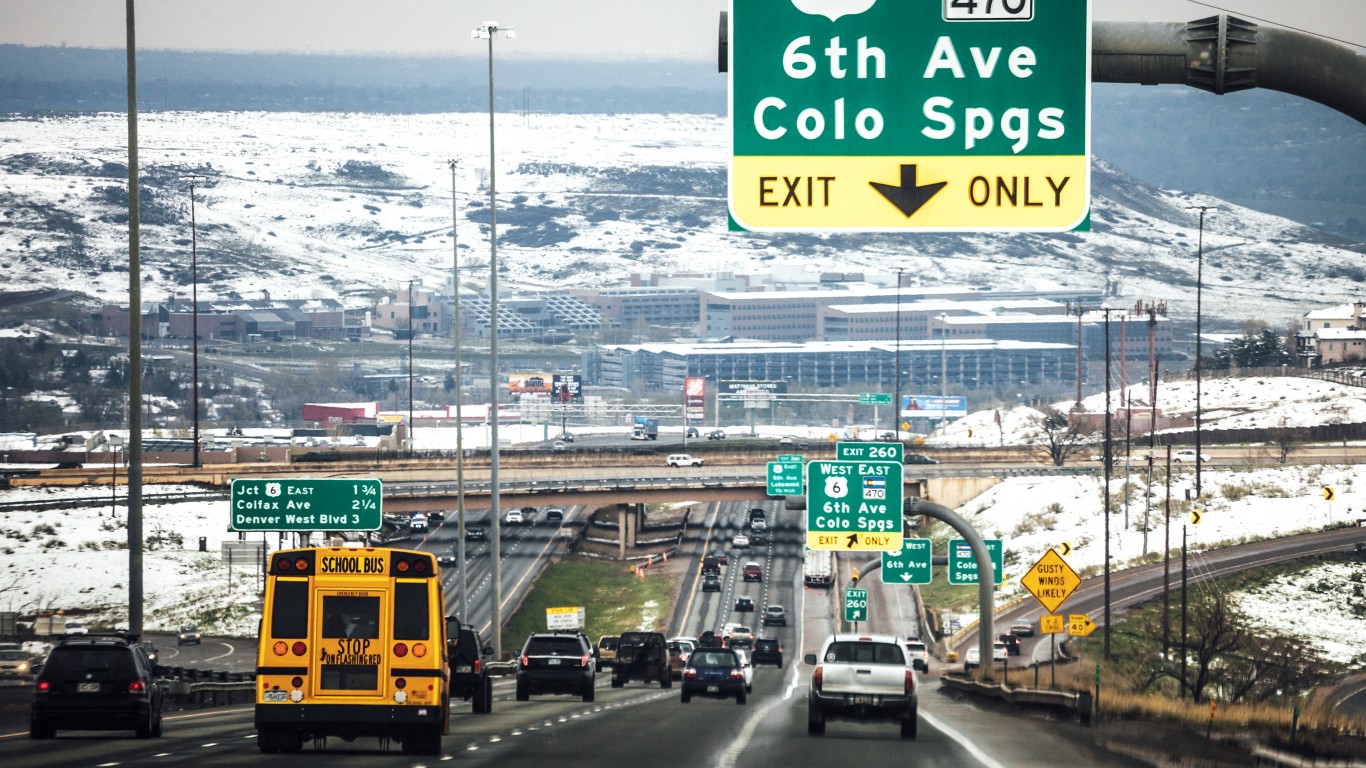
41. Colorado Springs, Colorado
> Weather station & distance from city center: Cheesman, CO, 37.0 miles
> Population: 457,502
> Temp difference this winter compared to historical avg.: 1.1 °F
> Avg. temp this winter through Jan. 2020: 34.4 °F
> Avg. temp on record Nov-Jan 2019 (121 years through 2019): 33.3 °F
> Avg. precipitation this winter through Jan. 2020: 0.5 inches
> Avg. precipitation on record Nov-Jan (119 years through 2019): 0.5 inches
[in-text-ad]
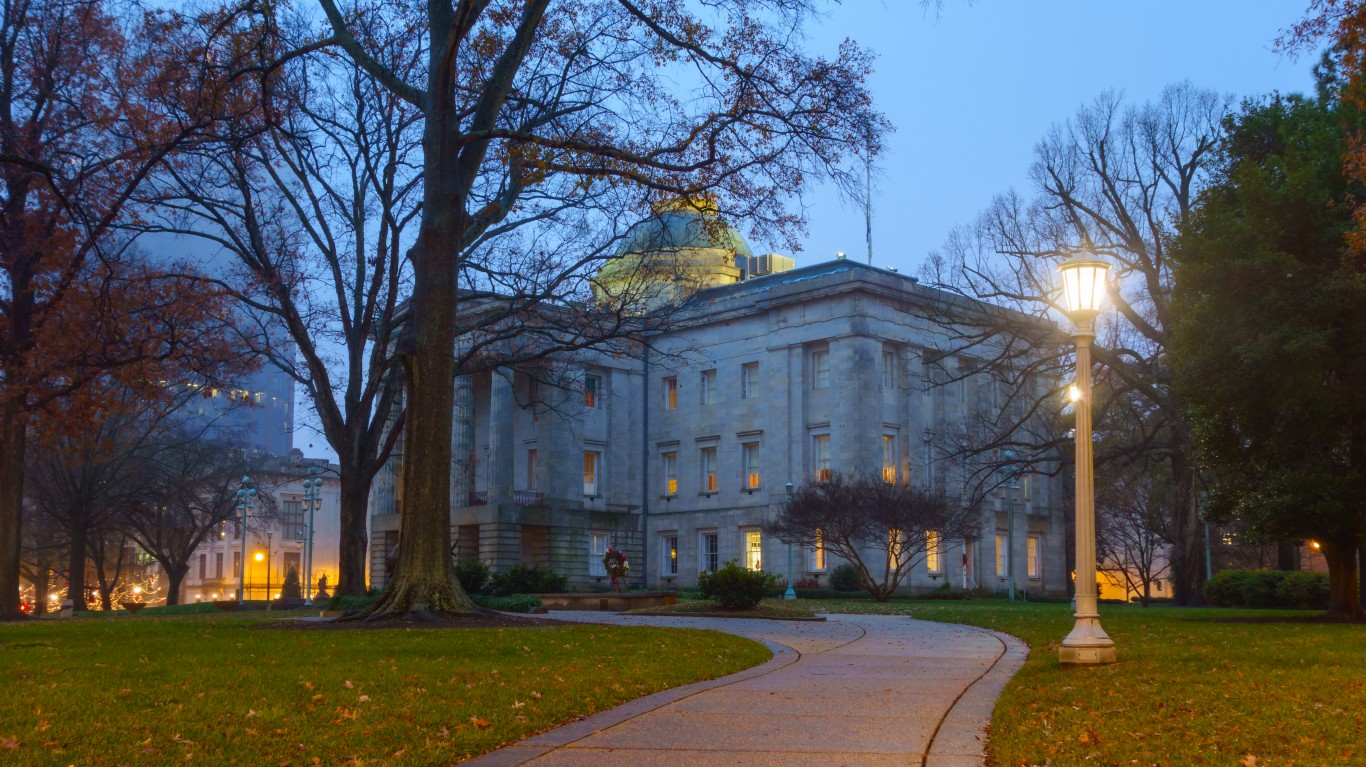
42. Raleigh, North Carolina
> Weather station & distance from city center: Chapel Hill 2 W, NC, 25.0 miles
> Population: 457,159
> Temp difference this winter compared to historical avg.: 2.2 °F
> Avg. temp this winter through Jan. 2020: 46.1 °F
> Avg. temp on record Nov-Jan 2019 (127 years through 2019): 44.0 °F
> Avg. precipitation this winter through Jan. 2020: 3.5 inches
> Avg. precipitation on record Nov-Jan (136 years through 2019): 3.5 inches

43. Miami, Florida
> Weather station & distance from city center: Perrine 4W, FL, 19.8 miles
> Population: 451,214
> Temp difference this winter compared to historical avg.: 2.6 °F
> Avg. temp this winter through Jan. 2020: 70.7 °F
> Avg. temp on record Nov-Jan 2019 (120 years through 2019): 68.0 °F
> Avg. precipitation this winter through Jan. 2020: 1.6 inches
> Avg. precipitation on record Nov-Jan (108 years through 2019): 2.0 inches
44. Virginia Beach, Virginia
> Weather station & distance from city center: Norfolk Intl Ap, VA, 14.3 miles
> Population: 450,135
> Temp difference this winter compared to historical avg.: 2.9 °F
> Avg. temp this winter through Jan. 2020: 49.0 °F
> Avg. temp on record Nov-Jan (126 years through 2019): 46.1 °F
> Avg. precipitation this winter through Jan. 2020: 2.6 inches
> Avg. precipitation on record Nov-Jan (148 years through 2019): 3.3 inches
[in-text-ad-2]

45. Oakland, California
> Weather station & distance from city center: Berkeley, CA, 6.3 miles
> Population: 421,042
> Temp difference this winter compared to historical avg.: 2.1 °F
> Avg. temp this winter through Jan. 2020: 52.0 °F
> Avg. temp on record Nov-Jan (126 years through 2019): 49.9 °F
> Avg. precipitation this winter through Jan. 2020: 2.8 inches
> Avg. precipitation on record Nov-Jan (133 years through 2019): 4.0 inches
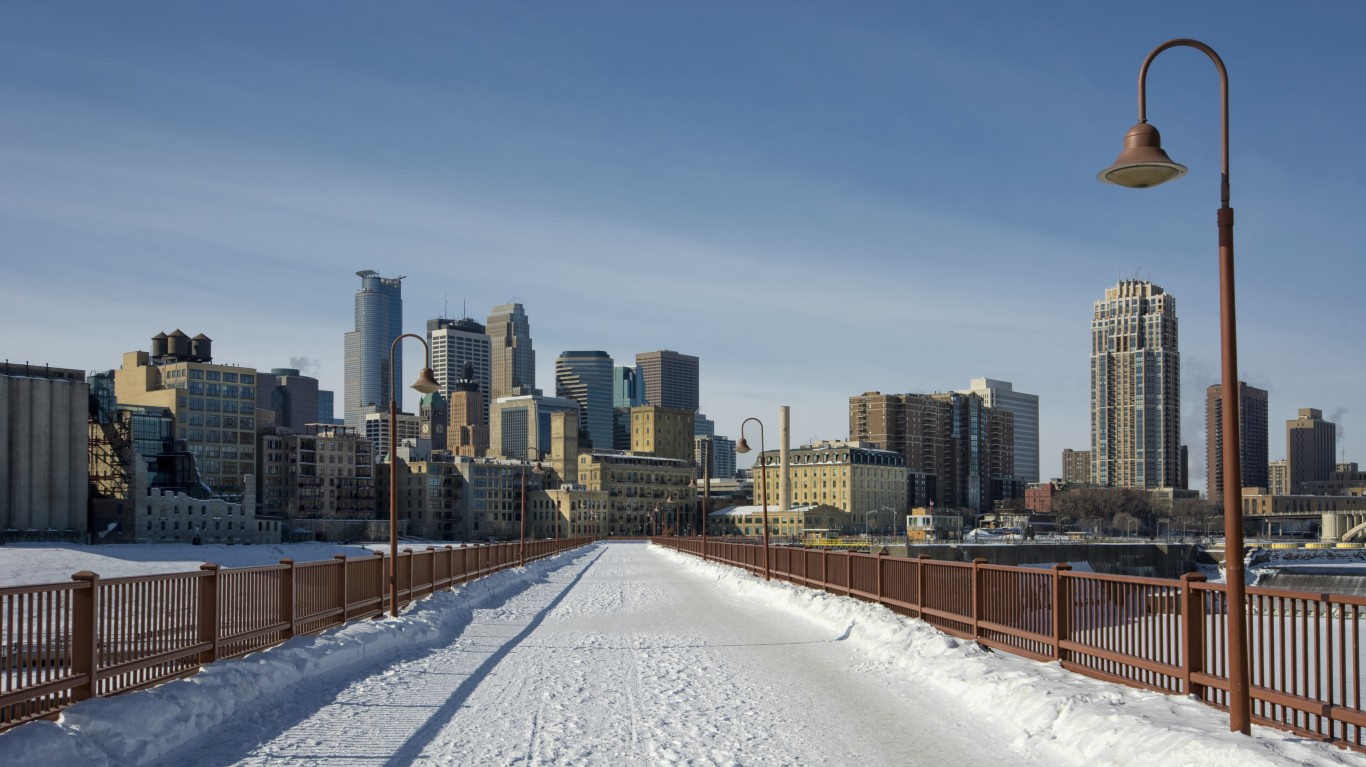
46. Minneapolis, Minnesota
> Weather station & distance from city center: Minneapolis/St Paul Ap, MN, 5.9 miles
> Population: 416,021
> Temp difference this winter compared to historical avg.: 2.9 °F
> Avg. temp this winter through Jan. 2020: 24.9 °F
> Avg. temp on record Nov-Jan 2019 (129 years through 2019): 22.0 °F
> Avg. precipitation this winter through Jan. 2020: 1.7 inches
> Avg. precipitation on record Nov-Jan (183 years through 2019): 1.1 inches
[in-text-ad]
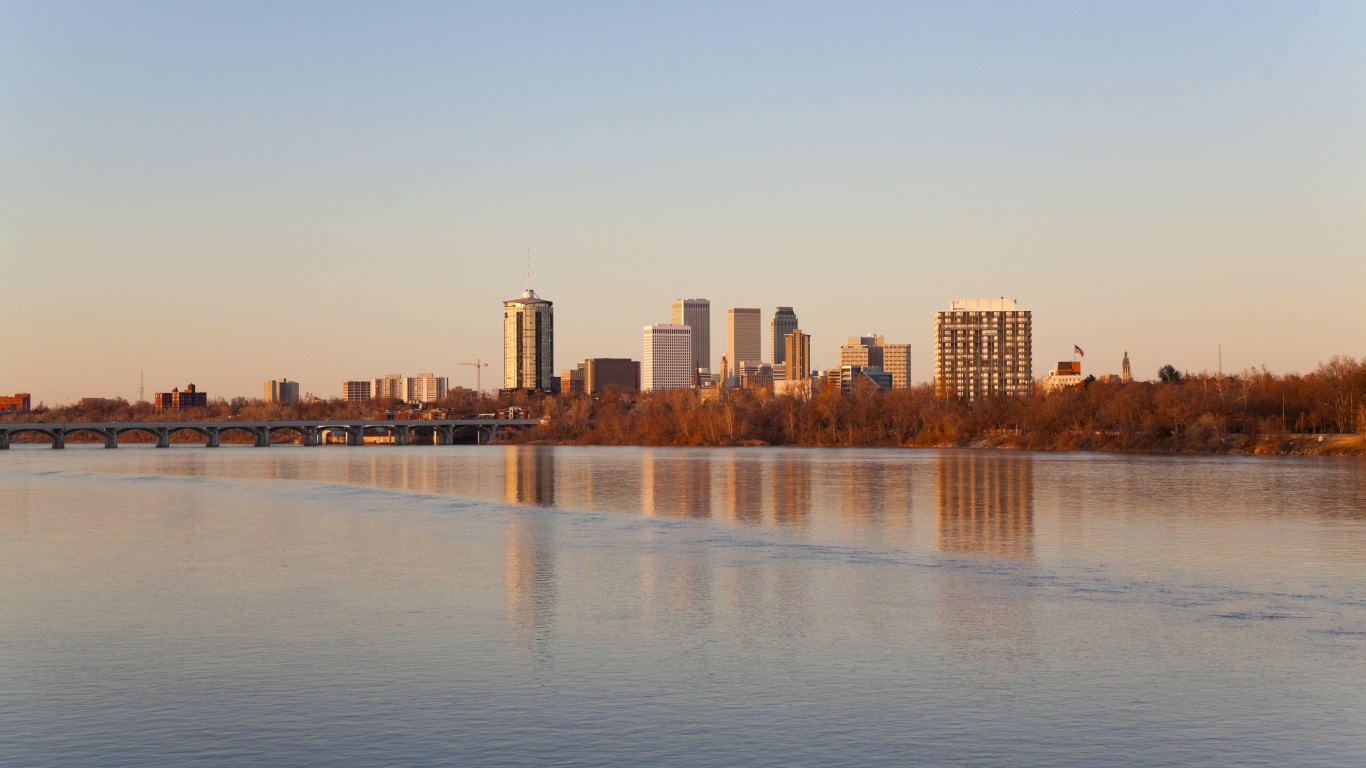
47. Tulsa, Oklahoma
> Weather station & distance from city center: Claremore 2 Ene, OK, 22.5 miles
> Population: 402,223
> Temp difference this winter compared to historical avg.: 2.1 °F
> Avg. temp this winter through Jan. 2020: 43.6 °F
> Avg. temp on record Nov-Jan 2019 (127 years through 2019): 41.5 °F
> Avg. precipitation this winter through Jan. 2020: 2.8 inches
> Avg. precipitation on record Nov-Jan (123 years through 2019): 2.2 inches

48. Arlington, Texas
> Weather station & distance from city center: Weatherford, TX, 37.6 miles
> Population: 392,462
> Temp difference this winter compared to historical avg.: 0.0 °F
> Avg. temp this winter through Jan. 2020: 48.8 °F
> Avg. temp on record Nov-Jan 2019 (123 years through 2019): 48.8 °F
> Avg. precipitation this winter through Jan. 2020: 2.4 inches
> Avg. precipitation on record Nov-Jan (129 years through 2019): 2.0 inches

49. New Orleans, Louisiana
> Weather station & distance from city center: New Orleans Audubon, LA, 16.0 miles
> Population: 389,648
> Temp difference this winter compared to historical avg.: 1.4 °F
> Avg. temp this winter through Jan. 2020: 59.7 °F
> Avg. temp on record Nov-Jan 2019 (128 years through 2019): 58.3 °F
> Avg. precipitation this winter through Jan. 2020: 2.7 inches
> Avg. precipitation on record Nov-Jan (130 years through 2019): 4.4 inches
[in-text-ad-2]
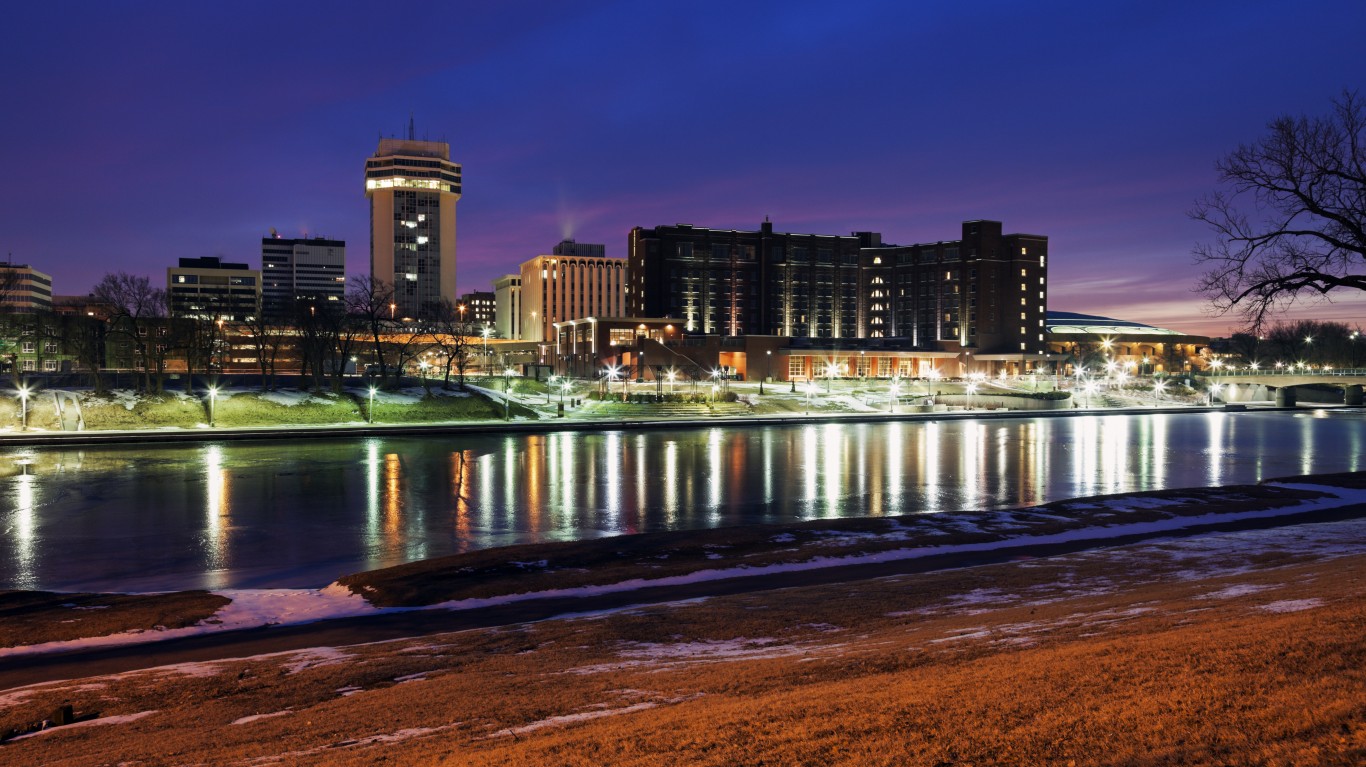
50. Wichita, Kansas
> Weather station & distance from city center: El Dorado, KS, 28.7 miles
> Population: 389,563
> Temp difference this winter compared to historical avg.: 1.3 °F
> Avg. temp this winter through Jan. 2020: 38.9 °F
> Avg. temp on record Nov-Jan (126 years through 2019): 37.5 °F
> Avg. precipitation this winter through Jan. 2020: 1.5 inches
> Avg. precipitation on record Nov-Jan (128 years through 2019): 1.3 inches
Methodology
In order to compare the severity of this year’s winter to previous years by city, 24/7 Wall St. reviewed historical monthly precipitation and temperature data from the U.S. Historical Climatology Network Monthly (USHCN) Version 2.5.0 for the months of November, December, and January for 1,218 weather stations across the United States.
Weather stations from the USHCN were matched to cities based on the straight-line proximity between the coordinates of a weather station and the coordinates of the geographic center of a city, assigning the nearest weather station to the nearest city. City boundaries definitions came from the U.S. Census Bureau. For the 50 largest cities, the nearest weather station lies an average of 56.5 miles away from the center of the city to which it is assigned.
Population, median household income, and educational attainment for cities with available data came from the American Community Survey 2018 5-Year Estimates.
If you’re one of the over 4 Million Americans set to retire this year, you may want to pay attention.
Finding a financial advisor who puts your interest first can be the difference between a rich retirement and barely getting by, and today it’s easier than ever. SmartAsset’s free tool matches you with up to three fiduciary financial advisors that serve your area in minutes. Each advisor has been carefully vetted, and must act in your best interests. Start your search now.
Don’t waste another minute; get started right here and help your retirement dreams become a retirement reality.
Thank you for reading! Have some feedback for us?
Contact the 24/7 Wall St. editorial team.