
Americans spent an average of $3,189 on food eaten away from home in 2017 (the last year for which figures are available), according to data site Statista. People aged 35 to 44 spent the most, an average of $4,249. A CNBC report estimated last year that more than half of every dollar spent on food in this country goes to restaurants.
We not only spend a lot on food, but we also do it often. Americans eat out an average of 5.9 times a week, including both full-service and fast food restaurants, according to a 2018 survey of dining trends by the restaurant site Zagat.com.
The advent of COVID-19 has almost certainly changed the equation dramatically. Many thousands of restaurants nationwide have already closed their doors, either voluntarily or in response to local or state government mandates. Some have shuttered completely, while many more continue to provide takeout and/or delivery service, where permitted under the new rules. This is a list of all the states with mandated bar and restaurant closings.
When the dust settles and the coronavirus has been vanquished, it seems likely that many eating places, on every level, will be gone for good. There is no reason to think, however, that overall spending patterns will have changed substantially.
To learn which communities spent the most money per capita on dining out in 2017, 24/7 Tempo compiled statistics focusing on full-service restaurant spending in some 293 towns and metropolitan areas around the country. Of the 30 cities listed here, 20 of them are west of the Mississippi, and the majority of them are wealthy municipalities known as tourist destination or resort communities. Sometimes unexpected places turn out to be among the U.S. cities with the most underrated food scenes.
Click here to see the cities where people spend the most on dining out.
The 10 biggest overall restaurant spending per capita were in places with comparatively small populations, none of them exceeding 100,000 people. The most populous entry by far is California’s San Francisco-Oakland-Hayward area, which far outpaces all the rest with some 4,673,221 people — and it’s No. 27 on the list.
To determine the cities where people spent the most money per capita on dining out at the time of this survey, 24/7 Tempo created an index based on the number of full-service restaurants and the full-service restaurant spending per capita across 293 urban areas of at least 10,000 people. Only full-service restaurants were considered, meaning those that generally offer table service from a wait staff, serving food and beverages for consumption on-premises. Limited-service restaurants — establishments in which patrons select and pay for items before eating, including fast-food chains and counter-service independents — were not considered.
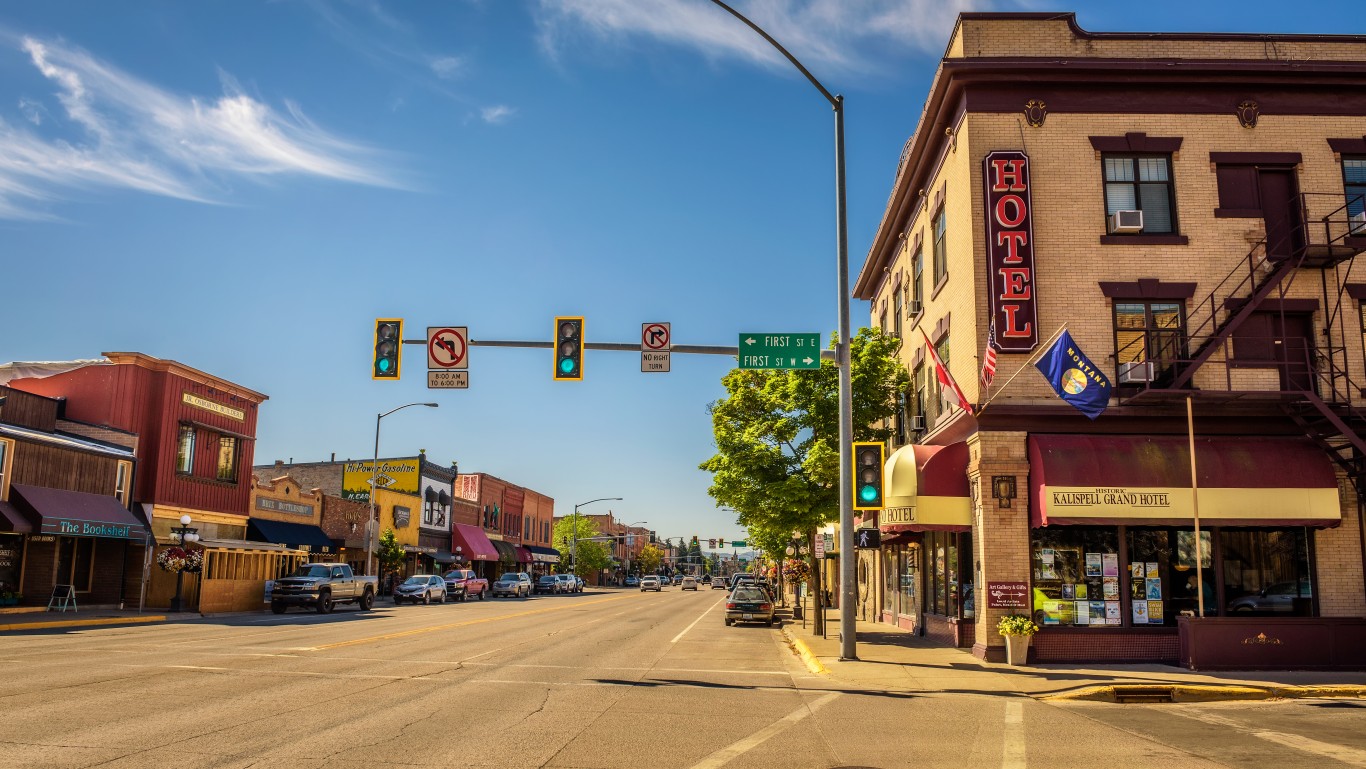
30. Kalispell, Montana
> Population: 98,082
> Total amount spent dining out in 2017: $122,856,000
> Per capita amount spent dining out in 2017: $1,253
> Full-service restaurants: 125
[in-text-ad]
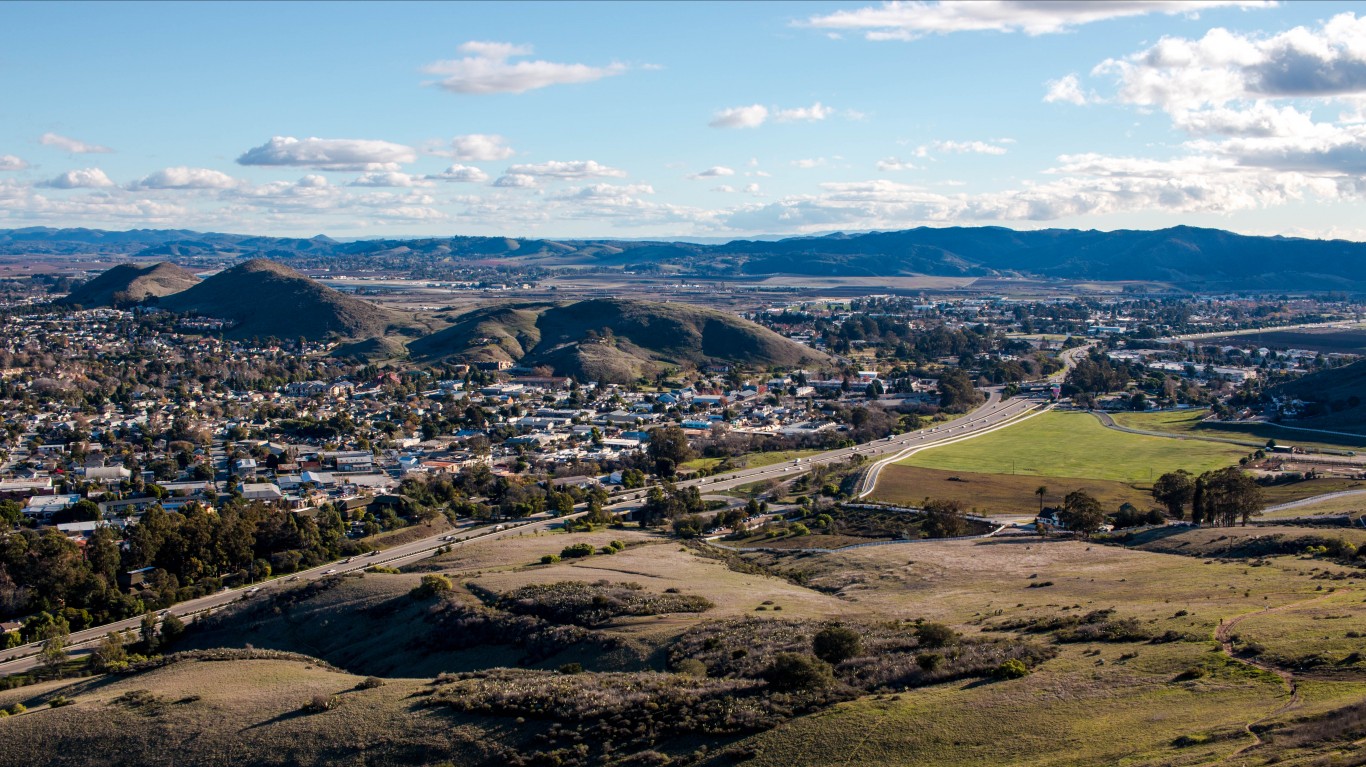
29. San Luis Obispo-Paso Robles-Arroyo Grande, California
> Population: 281,455
> Total amount spent dining out in 2017: $382,164,000
> Per capita amount spent dining out in 2017: $1,358
> Full-service restaurants: 351
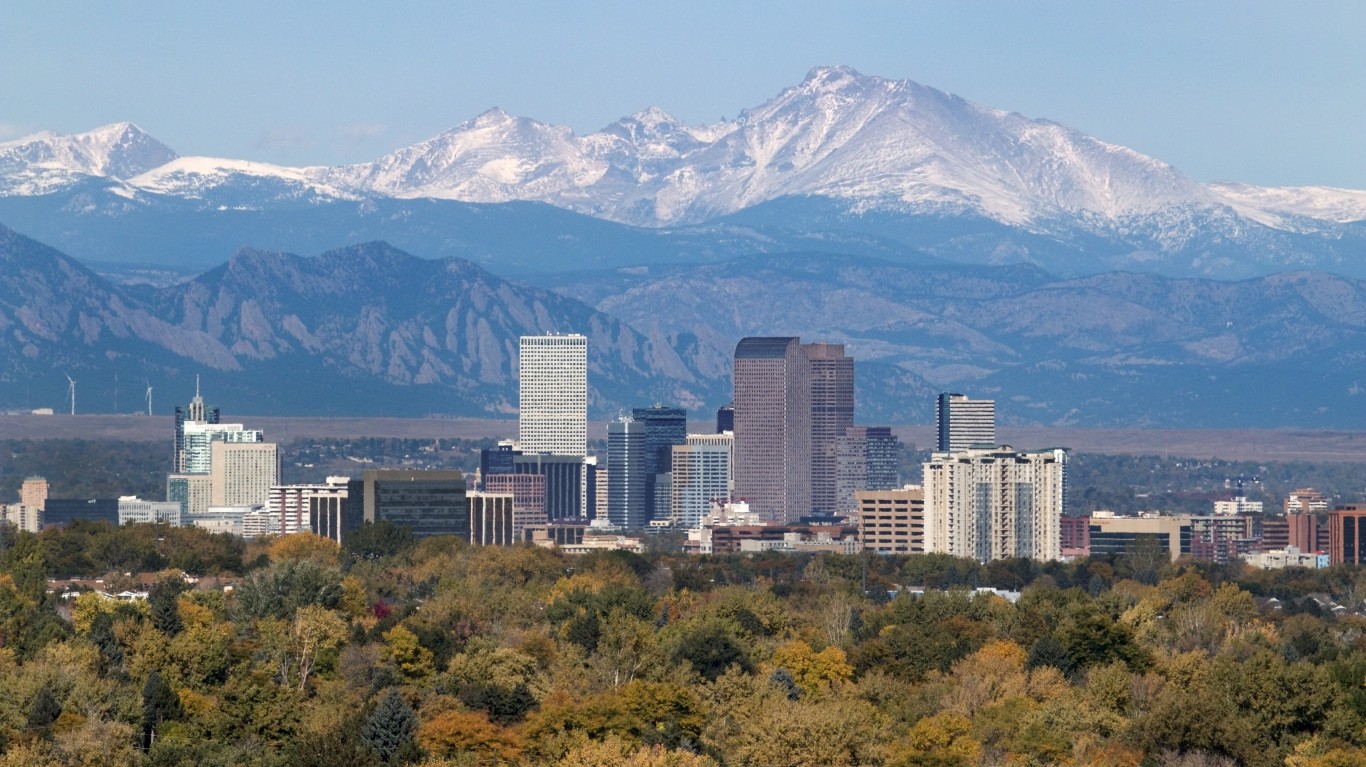
28. Boulder, Colorado
> Population: 321,030
> Total amount spent dining out in 2017: $517,441,000
> Per capita amount spent dining out in 2017: $1,612
> Full-service restaurants: 356

27. San Francisco-Oakland-Hayward, California
> Population: 4,673,221
> Total amount spent dining out in 2017: $7,329,460,000
> Per capita amount spent dining out in 2017: $1,568
> Full-service restaurants: 5372
[in-text-ad-2]

26. Hood River, Oregon
> Population: 23,131
> Total amount spent dining out in 2017: $27,152,000
> Per capita amount spent dining out in 2017: $1,174
> Full-service restaurants: 35

25. Portland-South Portland, Maine
> Population: 529,323
> Total amount spent dining out in 2017: $734,607,000
> Per capita amount spent dining out in 2017: $1,388
> Full-service restaurants: 716
[in-text-ad]
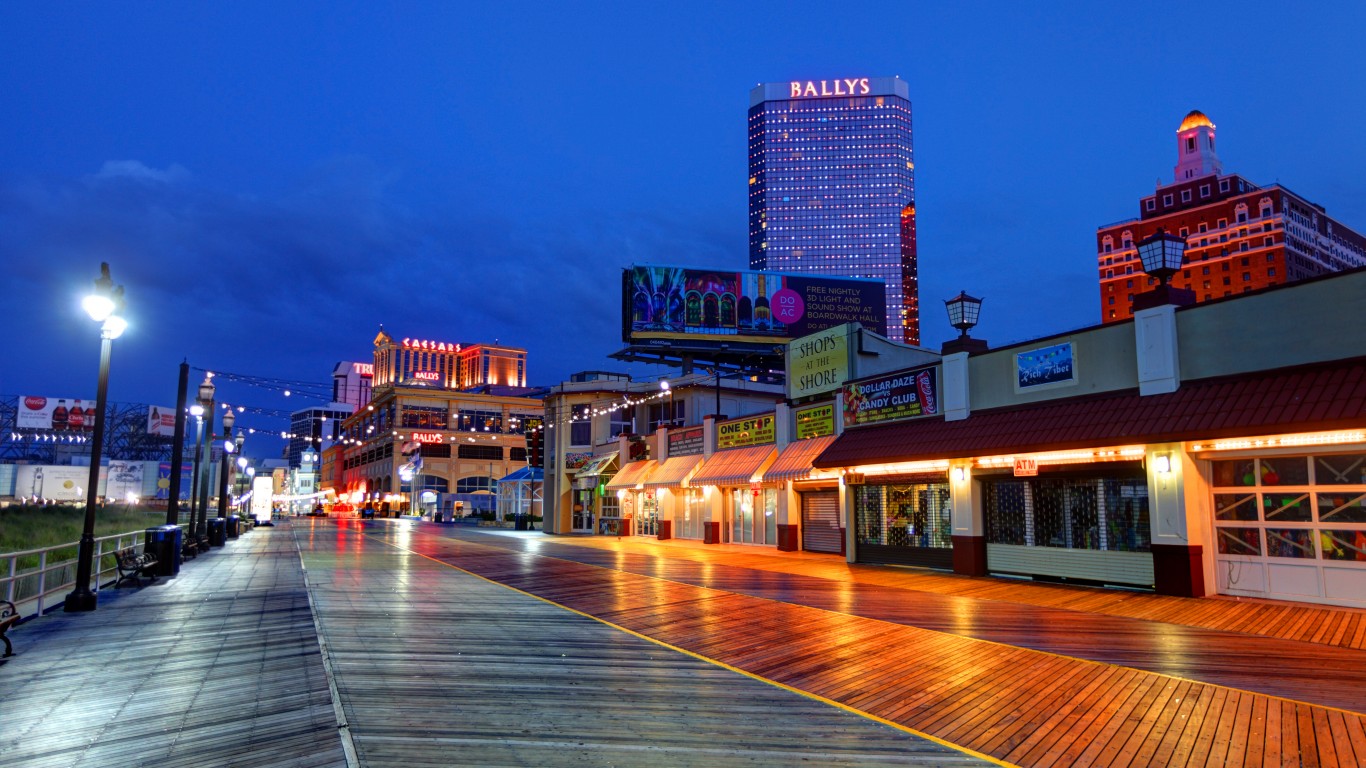
24. Atlantic City-Hammonton, New Jersey
> Population: 268,539
> Total amount spent dining out in 2017: $434,466,000
> Per capita amount spent dining out in 2017: $1,618
> Full-service restaurants: 329

23. Laconia, New Hampshire
> Population: 60,640
> Total amount spent dining out in 2017: $87,437,000
> Per capita amount spent dining out in 2017: $1,442
> Full-service restaurants: 86
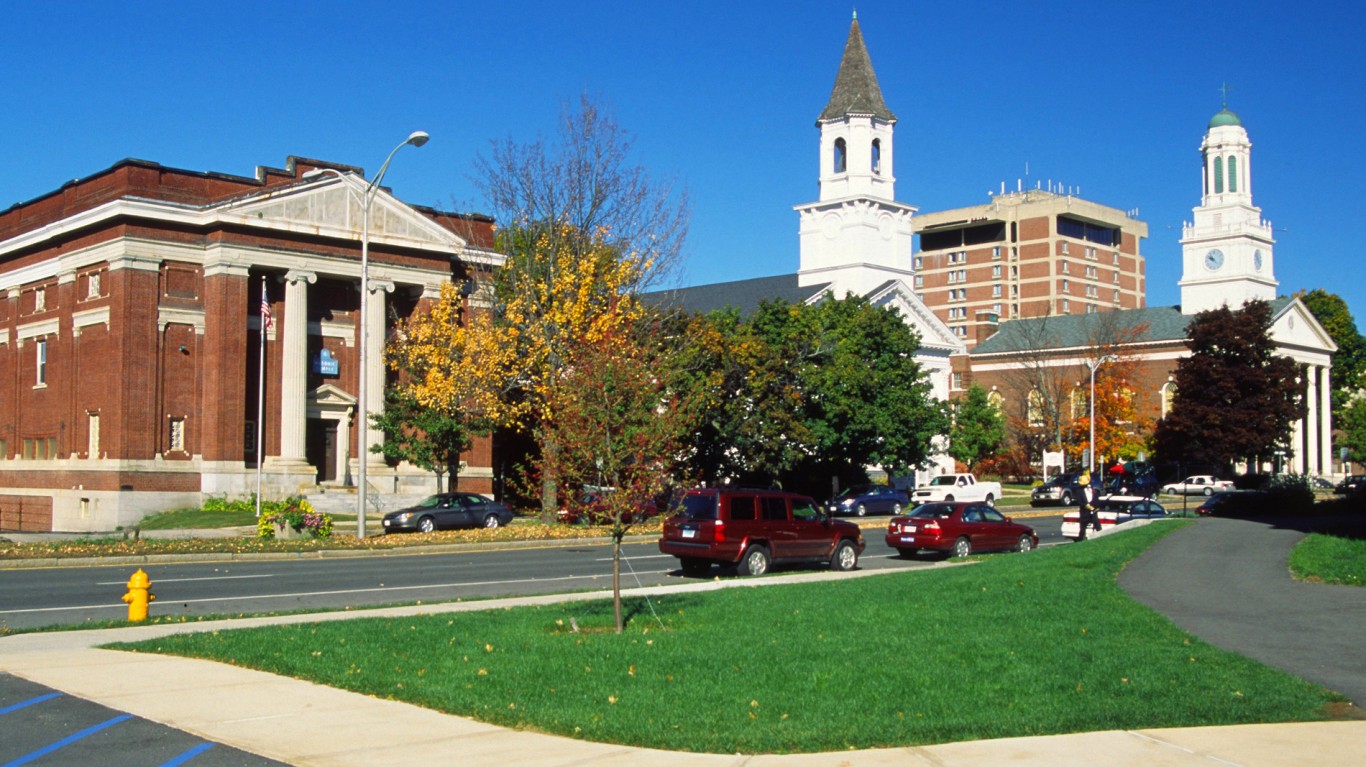
22. Pittsfield, Massachusetts
> Population: 127,328
> Total amount spent dining out in 2017: $146,085,000
> Per capita amount spent dining out in 2017: $1,147
> Full-service restaurants: 213
[in-text-ad-2]

21. Flagstaff, Arizona
> Population: 140,217
> Total amount spent dining out in 2017: $241,002,000
> Per capita amount spent dining out in 2017: $1,719
> Full-service restaurants: 177
20. Brookings, Oregon
> Population: 22,507
> Total amount spent dining out in 2017: $20,834,000
> Per capita amount spent dining out in 2017: $926
> Full-service restaurants: 42
[in-text-ad]
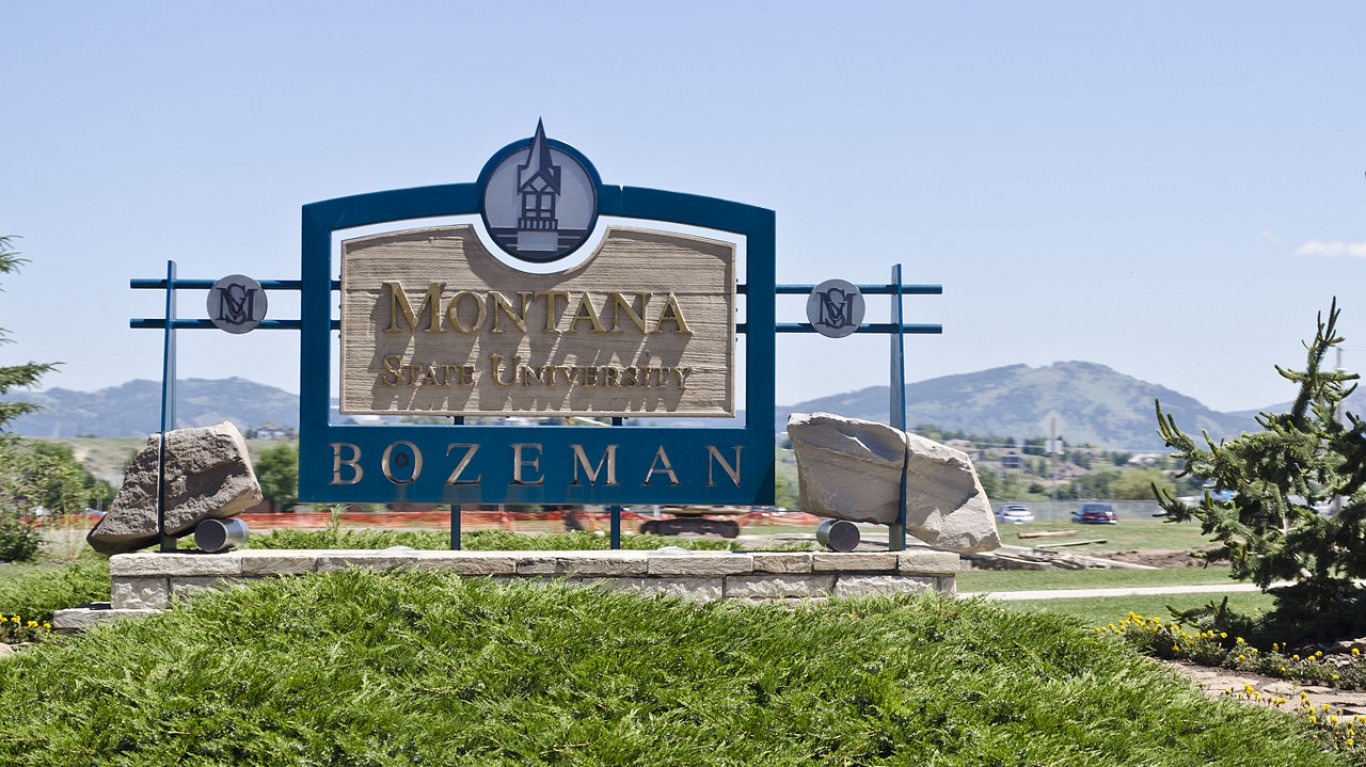
19. Bozeman, Montana
> Population: 104,729
> Total amount spent dining out in 2017: $172,055,000
> Per capita amount spent dining out in 2017: $1,643
> Full-service restaurants: 139
18. Easton, Maryland
> Population: 37,211
> Total amount spent dining out in 2017: $57,299,000
> Per capita amount spent dining out in 2017: $1,540
> Full-service restaurants: 55
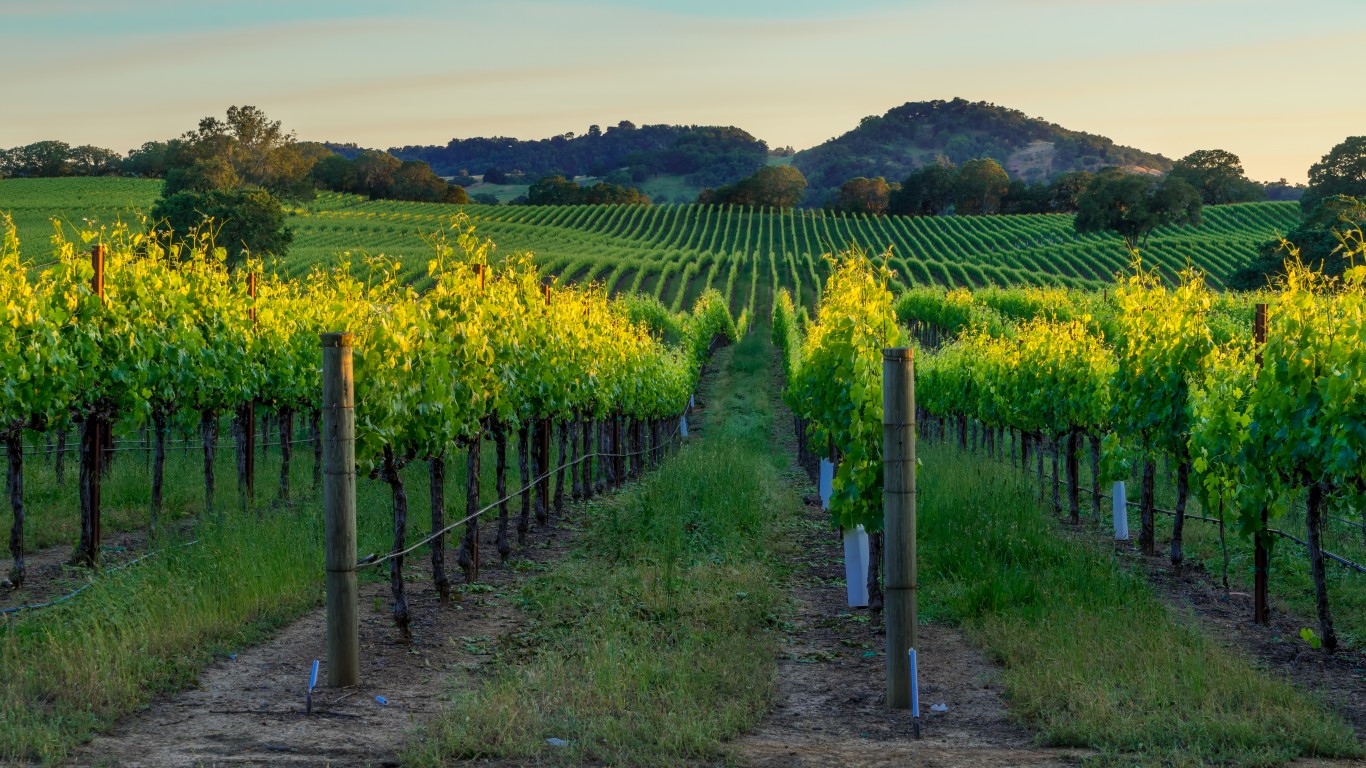
17. Napa, California
> Population: 140,530
> Total amount spent dining out in 2017: $318,389,000
> Per capita amount spent dining out in 2017: $2,266
> Full-service restaurants: 149
[in-text-ad-2]
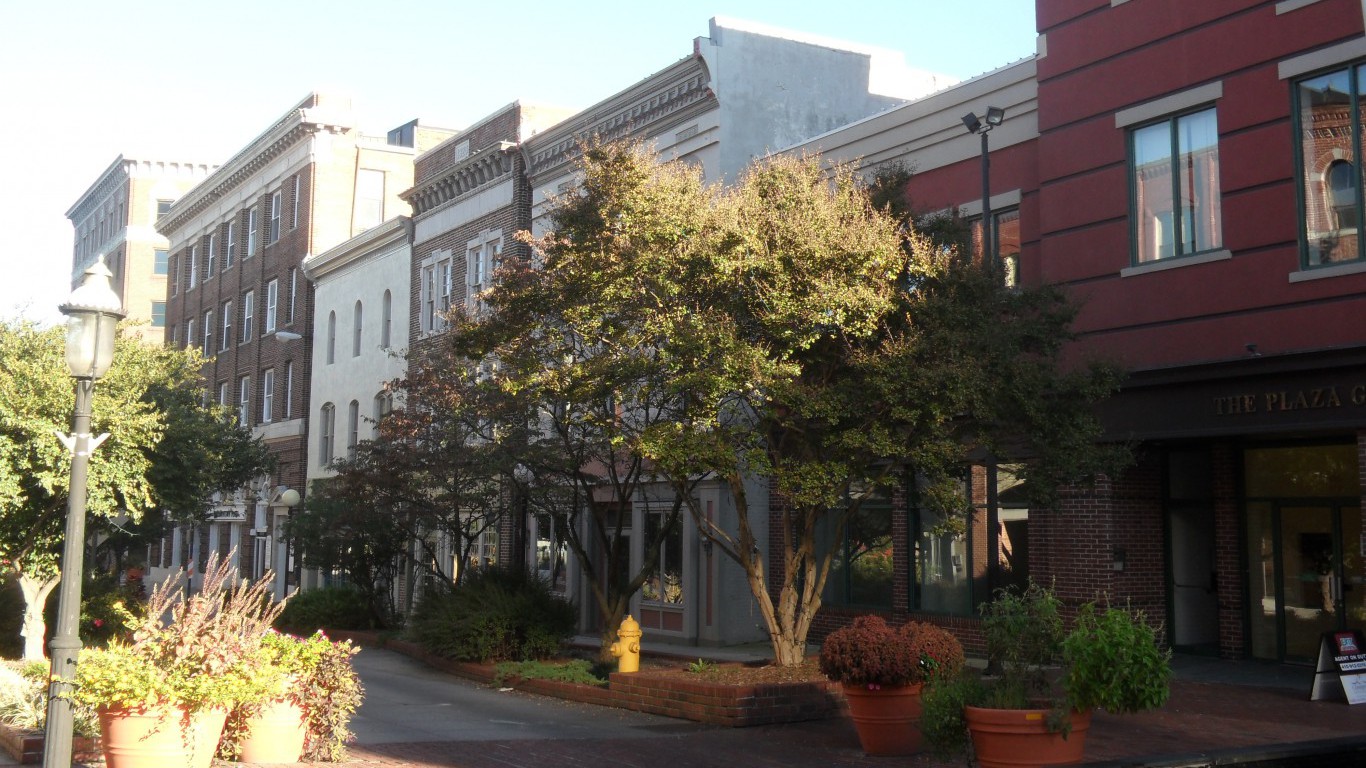
16. Salisbury, Maryland
> Population: 399,013
> Total amount spent dining out in 2017: $756,157,000
> Per capita amount spent dining out in 2017: $1,895
> Full-service restaurants: 563

15. Kapaa, Hawaii
> Population: 71,377
> Total amount spent dining out in 2017: $187,156,000
> Per capita amount spent dining out in 2017: $2,622
> Full-service restaurants: 94
[in-text-ad]
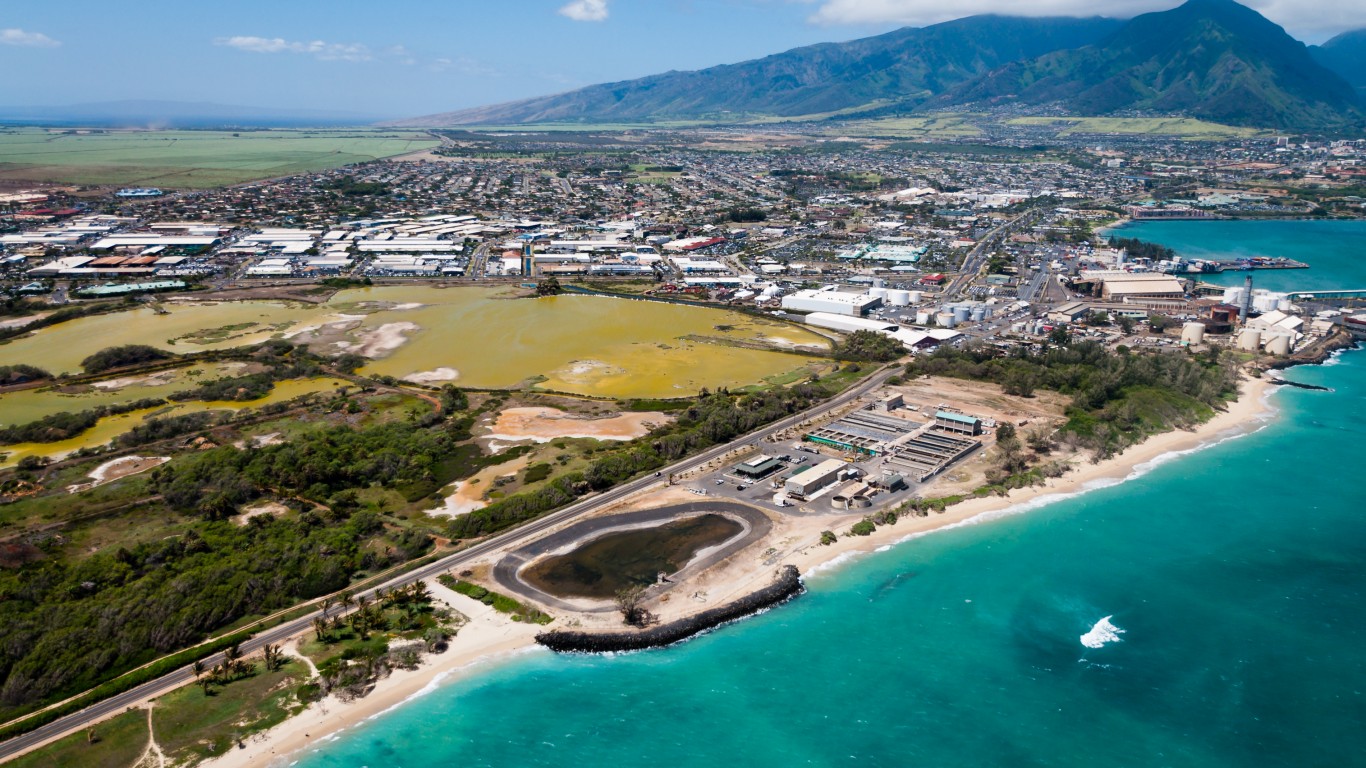
14. Kahului-Wailuku-Lahaina, Hawaii
> Population: 165,356
> Total amount spent dining out in 2017: $506,543,000
> Per capita amount spent dining out in 2017: $3,063
> Full-service restaurants: 183

13. Hailey, Idaho
> Population: 28,201
> Total amount spent dining out in 2017: $48,254,000
> Per capita amount spent dining out in 2017: $1,711
> Full-service restaurants: 65
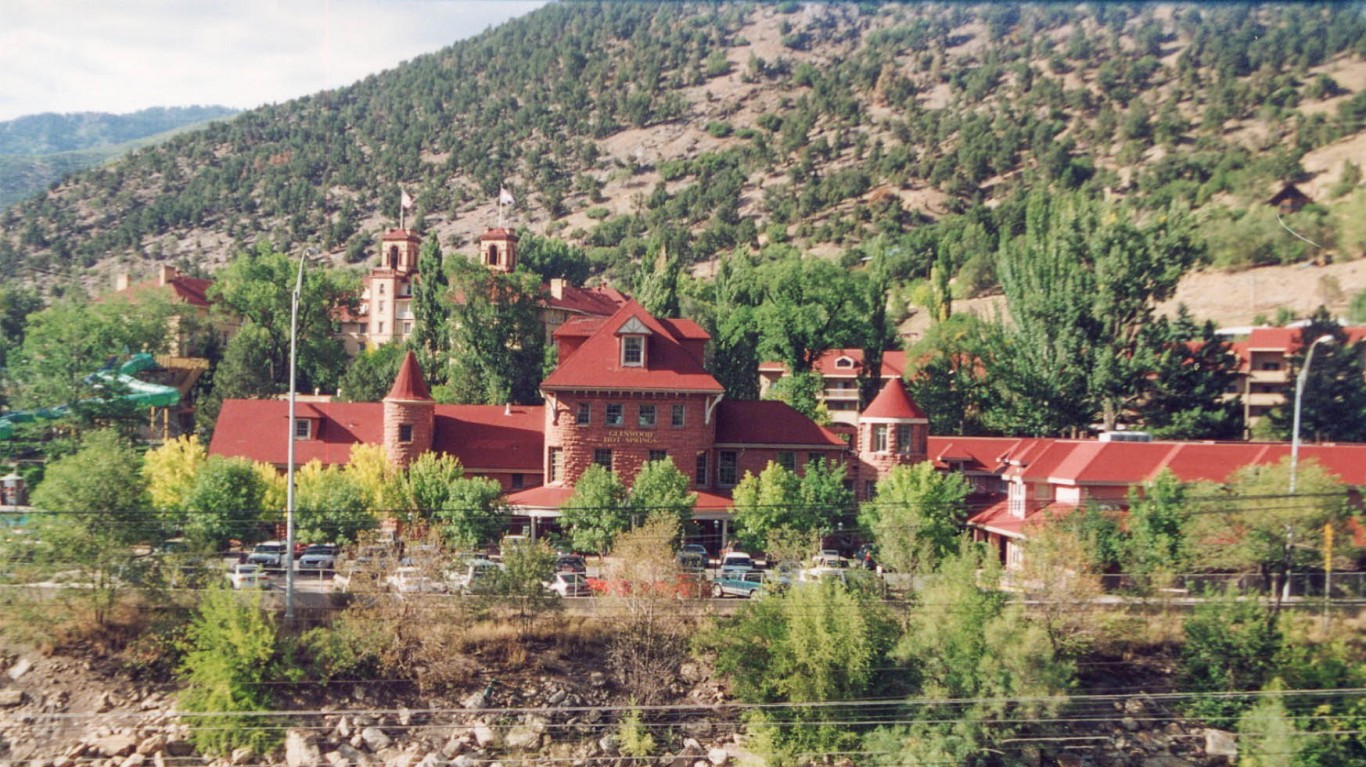
12. Glenwood Springs, Colorado
> Population: 76,447
> Total amount spent dining out in 2017: $195,972,000
> Per capita amount spent dining out in 2017: $2,564
> Full-service restaurants: 149
[in-text-ad-2]

11. Barnstable Town, Massachusetts
> Population: 213,690
> Total amount spent dining out in 2017: $542,931,000
> Per capita amount spent dining out in 2017: $2,541
> Full-service restaurants: 433
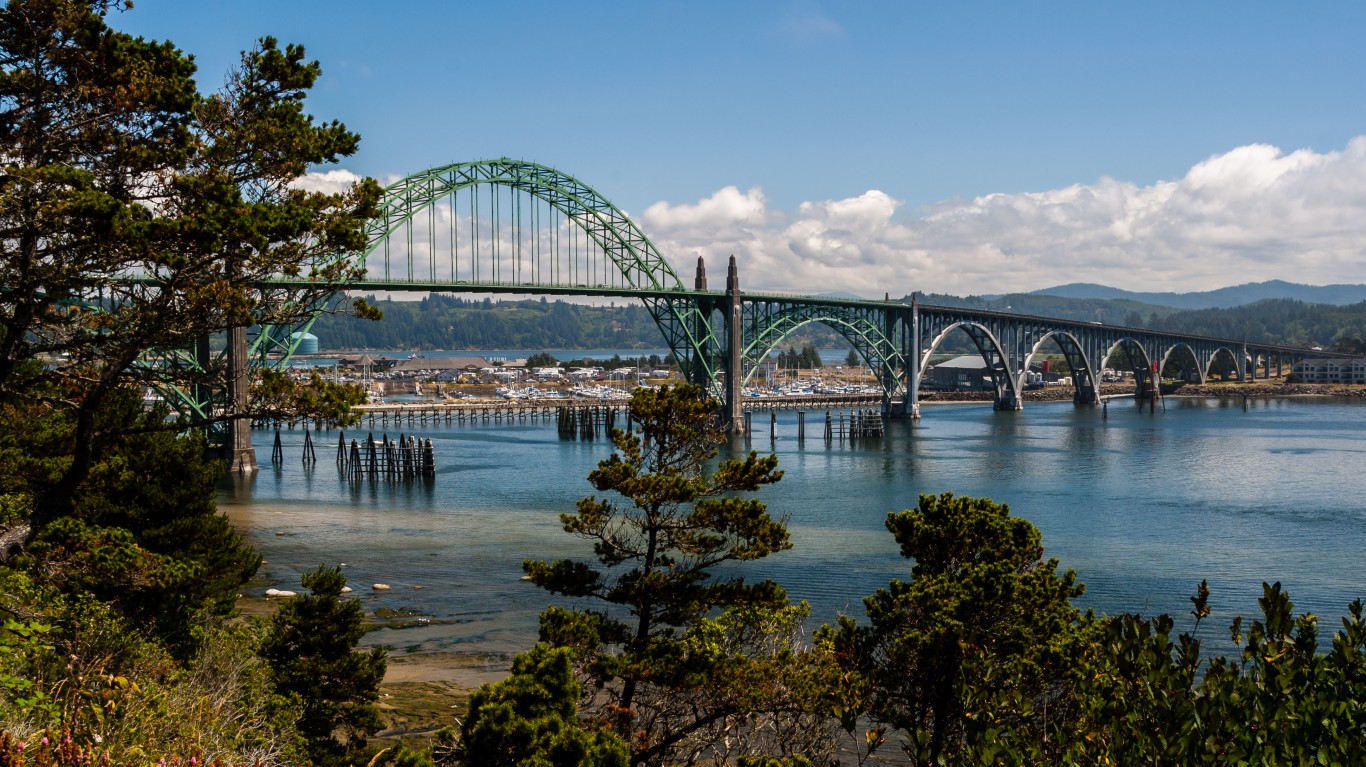
10. Newport, Oregon
> Population: 47,881
> Total amount spent dining out in 2017: $103,678,000
> Per capita amount spent dining out in 2017: $2,165
> Full-service restaurants: 112
[in-text-ad]
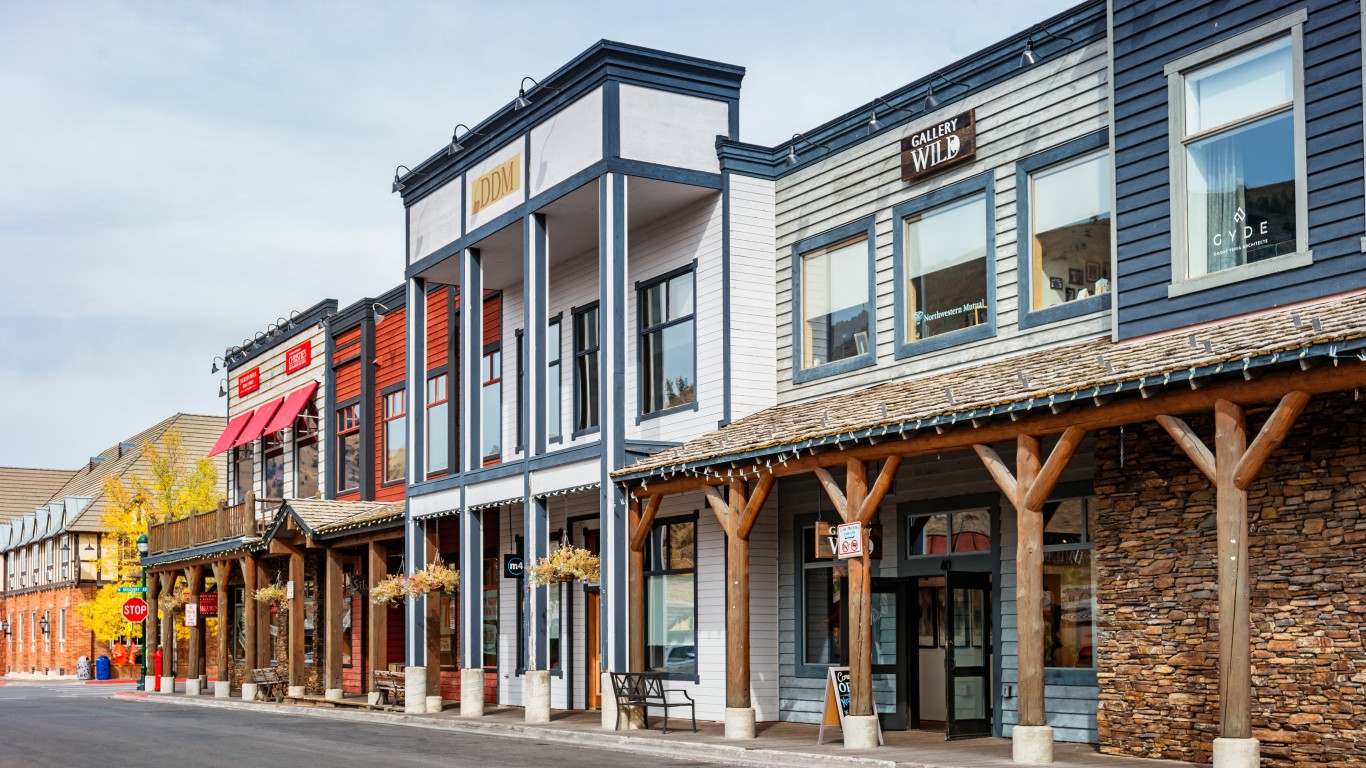
9. Jackson, Wyoming
> Population: 34,139
> Total amount spent dining out in 2017: $107,187,000
> Per capita amount spent dining out in 2017: $3,140
> Full-service restaurants: 85
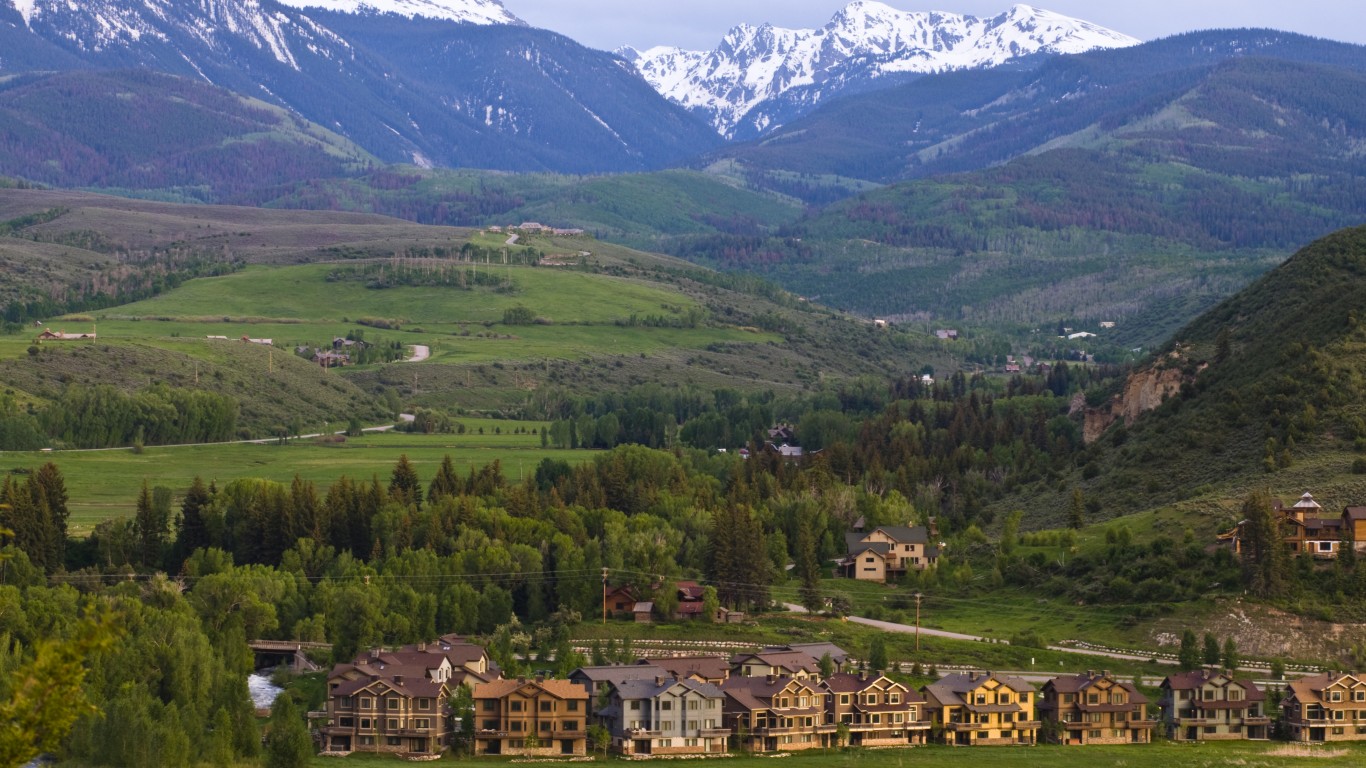
8. Edwards, Colorado
> Population: 54,357
> Total amount spent dining out in 2017: $182,315,000
> Per capita amount spent dining out in 2017: $3,354
> Full-service restaurants: 128

7. Astoria, Oregon
> Population: 38,562
> Total amount spent dining out in 2017: $110,192,000
> Per capita amount spent dining out in 2017: $2,858
> Full-service restaurants: 112
[in-text-ad-2]

6. Summit Park, Utah
> Population: 40,511
> Total amount spent dining out in 2017: $156,123,000
> Per capita amount spent dining out in 2017: $3,854
> Full-service restaurants: 93
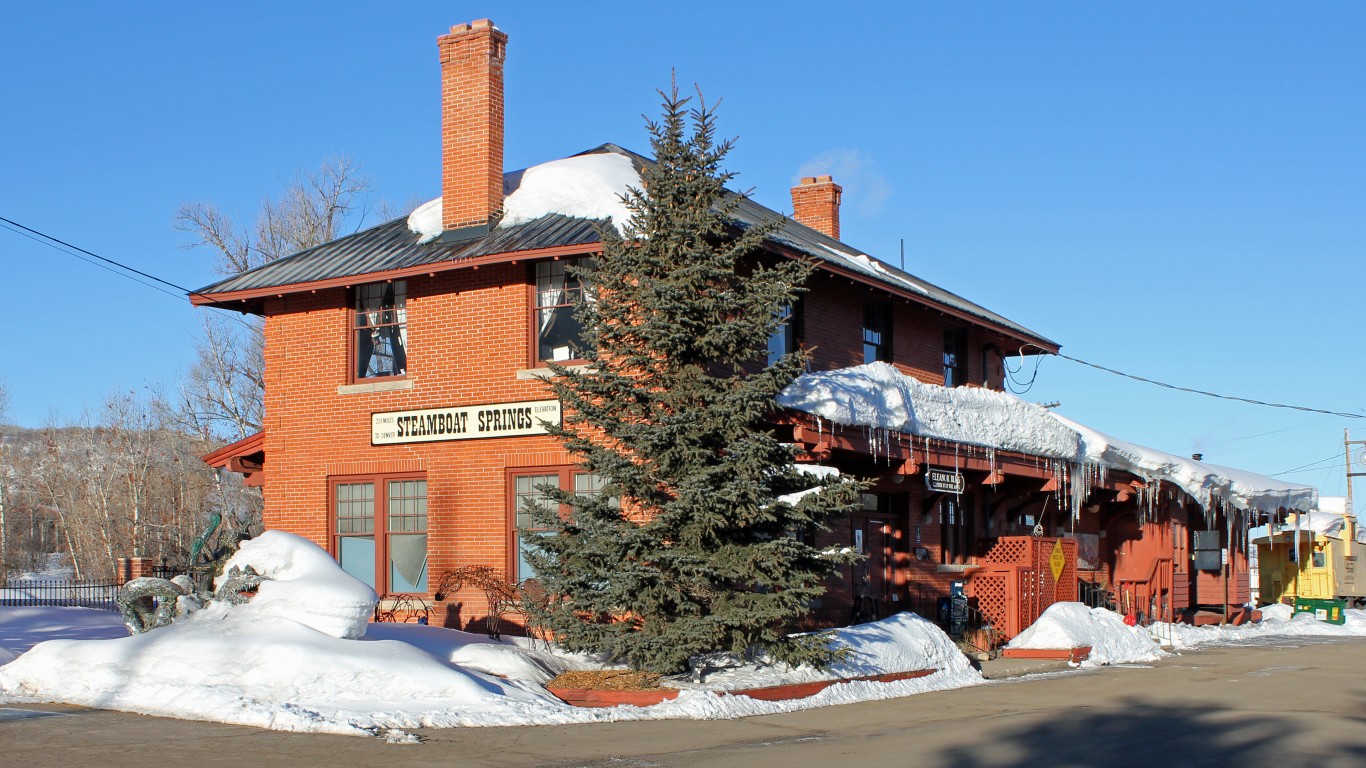
5. Steamboat Springs, Colorado
> Population: 24,874
> Total amount spent dining out in 2017: $76,728,000
> Per capita amount spent dining out in 2017: $3,085
> Full-service restaurants: 74
[in-text-ad]
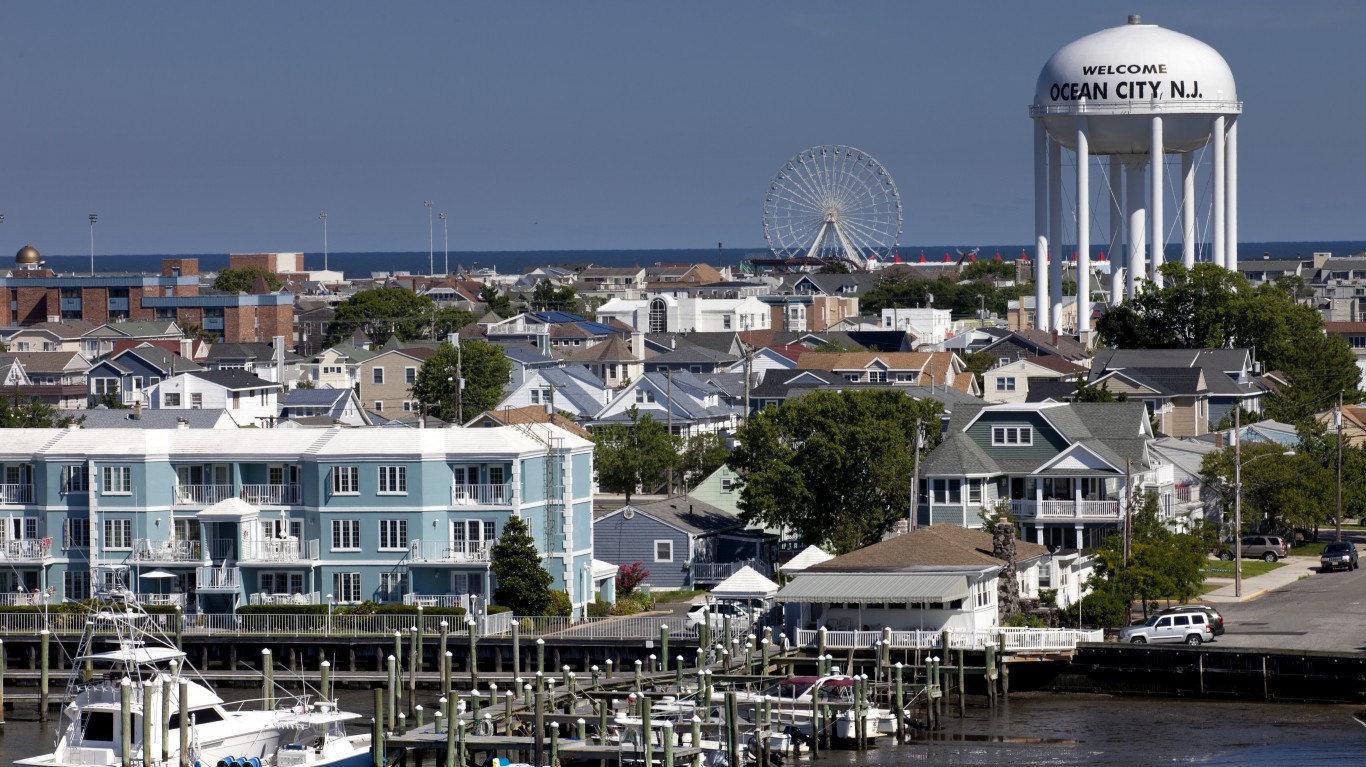
4. Ocean City, New Jersey
> Population: 93,705
> Total amount spent dining out in 2017: $311,948,000
> Per capita amount spent dining out in 2017: $3,329
> Full-service restaurants: 322
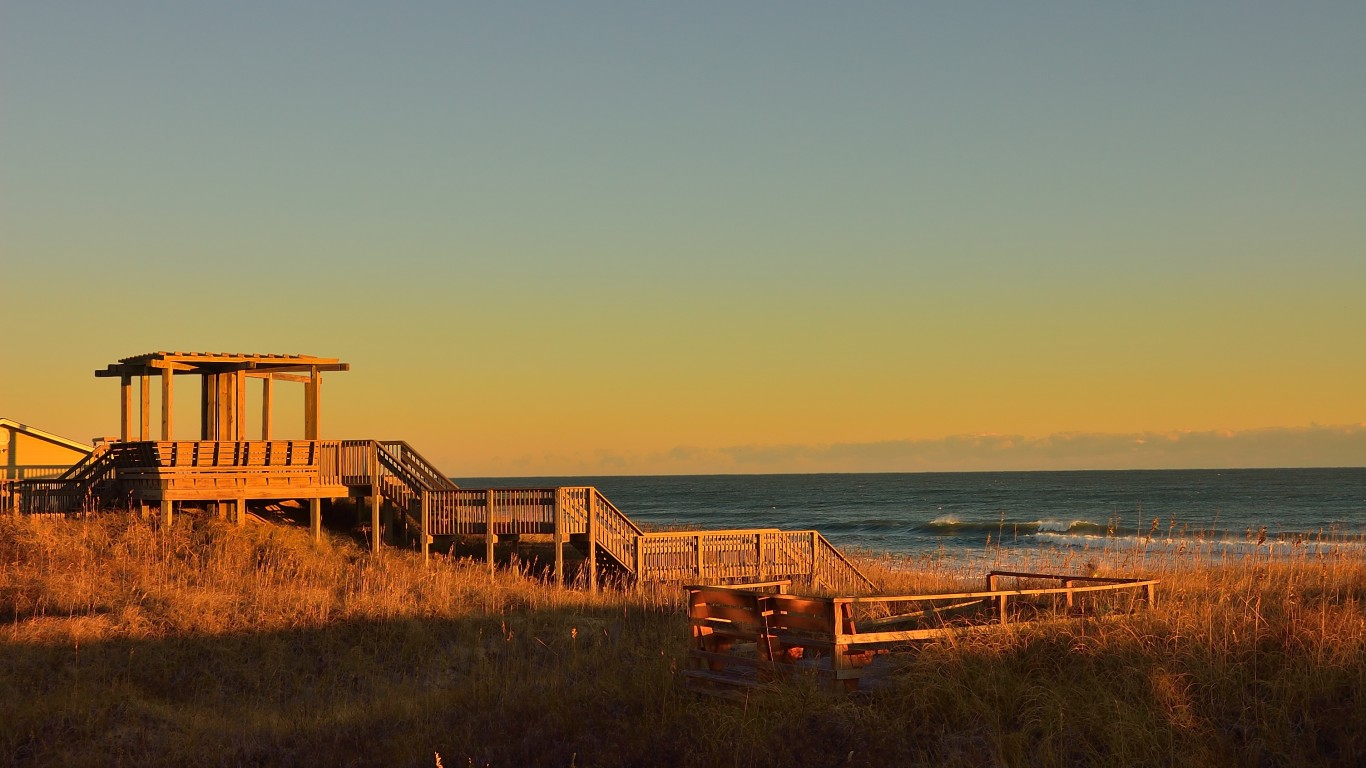
3. Kill Devil Hills, North Carolina
> Population: 39,860
> Total amount spent dining out in 2017: $169,240,000
> Per capita amount spent dining out in 2017: $4,246
> Full-service restaurants: 126

2. Vineyard Haven, Massachusetts
> Population: 17,313
> Total amount spent dining out in 2017: $87,055,000
> Per capita amount spent dining out in 2017: $5,028
> Full-service restaurants: 62
[in-text-ad-2]

1. Breckenridge, Colorado
> Population: 30,429
> Total amount spent dining out in 2017: $164,369,000
> Per capita amount spent dining out in 2017: $5,402
> Full-service restaurants: 128
The Average American Has No Idea How Much Money You Can Make Today (Sponsor)
The last few years made people forget how much banks and CD’s can pay. Meanwhile, interest rates have spiked and many can afford to pay you much more, but most are keeping yields low and hoping you won’t notice.
But there is good news. To win qualified customers, some accounts are paying almost 10x the national average! That’s an incredible way to keep your money safe and earn more at the same time. Our top pick for high yield savings accounts includes other benefits as well. You can earn up to 3.80% with a Checking & Savings Account today Sign up and get up to $300 with direct deposit. No account fees. FDIC Insured.
Click here to see how much more you could be earning on your savings today. It takes just a few minutes to open an account to make your money work for you.
Our top pick for high yield savings accounts includes other benefits as well. You can earn up to 4.00% with a Checking & Savings Account from Sofi. Sign up and get up to $300 with direct deposit. No account fees. FDIC Insured.
Thank you for reading! Have some feedback for us?
Contact the 24/7 Wall St. editorial team.
 24/7 Wall St.
 24/7 Wall St.
 24/7 Wall St.

