
Americans are less likely to move today than at any point in recent history. Over the 12 months ending in March 2019, the share of Americans who moved to a new home dipped below 10% for the first time since the U.S. Census Bureau began keeping track in 1947.
Indeed, in the majority of U.S. metropolitan areas, the greatest driver of population growth is natural increase — the number of births over a given period less the number of deaths. Still, an average of 35 million Americans have moved every year since 2010 — and some destinations are demonstrably more popular than others.
To determine the cities Americans flocking to in every state, 24/7 Wall St. used data from the Census Bureau’s Population Estimates Program and identified the metro area with the largest net-migration increase from April 1, 2010 to July 1, 2018 in every state.
Net migration is the difference between the number of new residents — either from other parts of the country or from abroad — and the number of residents who have moved elsewhere. It is not a measure of total population change, which also includes natural growth.
It is important to note that four states — Delaware, New Hampshire, Rhode Island, and Vermont — have only one metropolitan area each. As a result, these cities rank on this list by default. Additionally, in Alaska, Connecticut, Illinois, and New Jersey, every metro area reported negative net migration.
Some of the most commonly cited reasons for packing up and moving to a new city are related to employment. Last year, more than one in every five moves were prompted by work-related reasons. In the cities Americans are flocking to, job markets appear generally strong as in most of them, unemployment rates are as low or lower than the 3.6% national unemployment rate. Here is a look at the cities that have added the most jobs in the last five years.
Click here to see the cities Americans are flocking to in every state
Click here to see the cities Americans are abandoning in every state

1. Alabama: Daphne-Fairhope-Foley
> Population change due to migration, 2010-2018: +33,655 (+18.5%)
> Overall population change, 2010-2018: +35,758 (+19.6%)
> 2018 population: 218,022
> Median household income: $56,813
> January 2020 unemployment: 2.4%
[in-text-ad]

2. Alaska: None

3. Arizona: Prescott
> Population change due to migration, 2010-2018: +28,757 (+13.6%)
> Overall population change, 2010-2018: +20,979 (+9.9%)
> 2018 population: 231,993
> Median household income: $48,148
> January 2020 unemployment: 4.2%

4. Arkansas: Fayetteville-Springdale-Rogers
> Population change due to migration, 2010-2018: +55,068 (+11.9%)
> Overall population change, 2010-2018: +85,926 (+18.6%)
> 2018 population: 549,128
> Median household income: $57,911
> January 2020 unemployment: 2.5%
[in-text-ad-2]

5. California: Sacramento–Roseville–Arden-Arcade
> Population change due to migration, 2010-2018: +109,665 (+5.1%)
> Overall population change, 2010-2018: +196,059 (+9.1%)
> 2018 population: 2.3 million
> Median household income: $73,142
> January 2020 unemployment: 3.4%

6. Colorado: Greeley
> Population change due to migration, 2010-2018: +41,180 (+16.3%)
> Overall population change, 2010-2018: +61,458 (+24.3%)
> 2018 population: 314,305
> Median household income: $75,938
> January 2020 unemployment: 2.4%
[in-text-ad]

7. Connecticut: None

8. Delaware: Dover
> Population change due to migration, 2010-2018: +10,595 (+6.5%)
> Overall population change, 2010-2018: +16,201 (+10.0%)
> 2018 population: 178,550
> Median household income: $54,419
> January 2020 unemployment: 4.3%
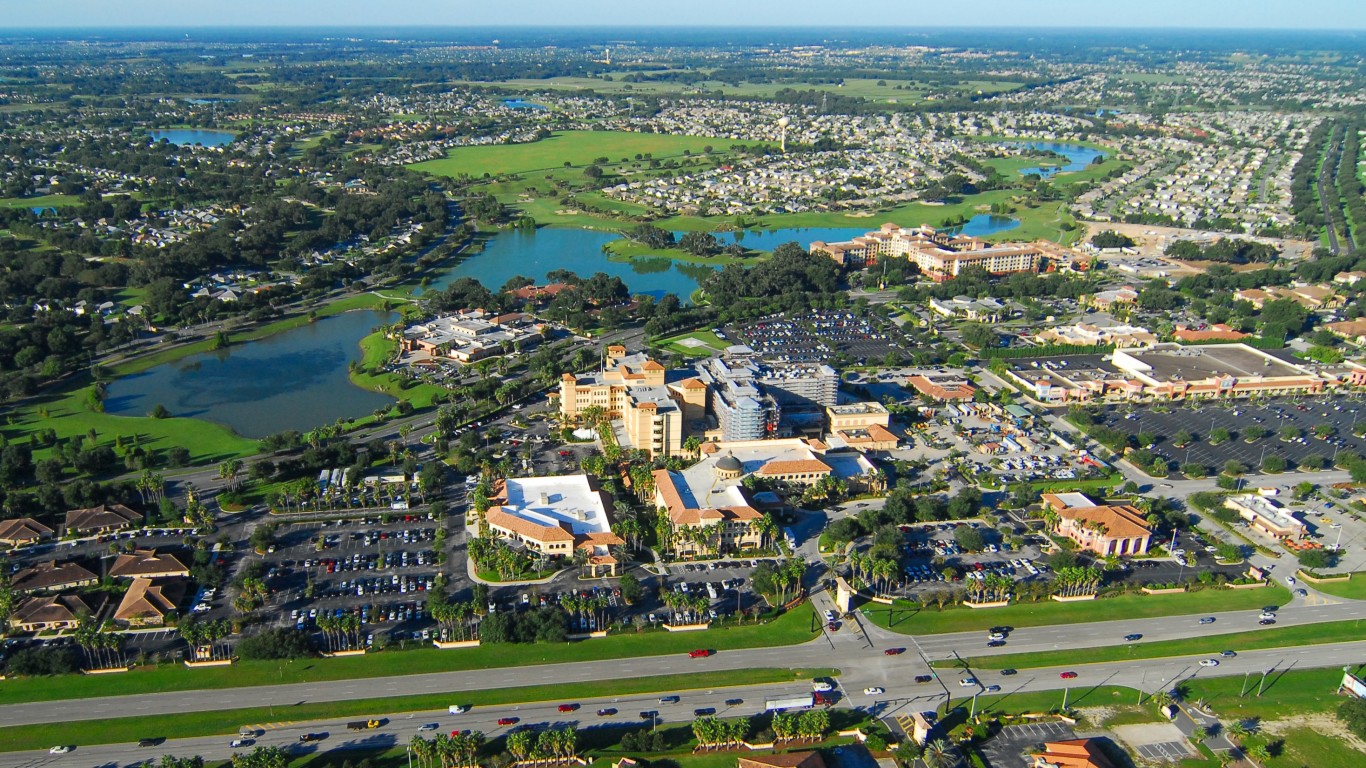
9. Florida: The Villages
> Population change due to migration, 2010-2018: +43,639 (+46.7%)
> Overall population change, 2010-2018: +35,334 (+37.8%)
> 2018 population: 128,754
> Median household income: $53,895
> January 2020 unemployment: 4.2%
[in-text-ad-2]

10. Georgia: Gainesville
> Population change due to migration, 2010-2018: +12,744 (+7.1%)
> Overall population change, 2010-2018: +22,422 (+12.5%)
> 2018 population: 202,148
> Median household income: $61,699
> January 2020 unemployment: 2.4%

11. Hawaii: Kahului-Wailuku-Lahaina
> Population change due to migration, 2010-2018: +5,840 (+3.8%)
> Overall population change, 2010-2018: +12,365 (+8.0%)
> 2018 population: 167,295
> Median household income: $82,917
> January 2020 unemployment: 2.6%
[in-text-ad]

12. Idaho: Coeur d’Alene
> Population change due to migration, 2010-2018: +19,111 (+13.8%)
> Overall population change, 2010-2018: +23,039 (+16.6%)
> 2018 population: 161,505
> Median household income: $55,236
> January 2020 unemployment: 3.5%

13. Illinois: None

14. Indiana: Lafayette-West Lafayette
> Population change due to migration, 2010-2018: +10,197 (+5.1%)
> Overall population change, 2010-2018: +20,034 (+9.9%)
> 2018 population: 221,828
> Median household income: $50,799
> January 2020 unemployment: 2.9%
[in-text-ad-2]

15. Iowa: Des Moines-West Des Moines
> Population change due to migration, 2010-2018: +49,051 (+8.6%)
> Overall population change, 2010-2018: +85,777 (+15.1%)
> 2018 population: 655,409
> Median household income: $71,352
> January 2020 unemployment: 2.6%

16. Kansas: Lawrence
> Population change due to migration, 2010-2018: +5,987 (+5.4%)
> Overall population change, 2010-2018: +10,610 (+9.6%)
> 2018 population: 121,436
> Median household income: $54,668
> January 2020 unemployment: 2.9%
[in-text-ad]

17. Kentucky: Bowling Green
> Population change due to migration, 2010-2018: +13,518 (+8.5%)
> Overall population change, 2010-2018: +18,824 (+11.9%)
> 2018 population: 177,432
> Median household income: $51,365
> January 2020 unemployment: 4.0%

18. Louisiana: Hammond
> Population change due to migration, 2010-2018: +6,704 (+5.5%)
> Overall population change, 2010-2018: +12,670 (+10.5%)
> 2018 population: 133,777
> Median household income: $48,205
> January 2020 unemployment: 5.7%

19. Maine: Portland-South Portland
> Population change due to migration, 2010-2018: +20,096 (+3.9%)
> Overall population change, 2010-2018: +21,316 (+4.1%)
> 2018 population: 535,420
> Median household income: $69,980
> January 2020 unemployment: 2.4%
[in-text-ad-2]

20. Maryland: Salisbury
> Population change due to migration, 2010-2018: +35,981 (+9.6%)
> Overall population change, 2010-2018: +36,219 (+9.7%)
> 2018 population: 409,979
> Median household income: $59,214
> January 2020 unemployment: 4.5%

21. Massachusetts: Boston-Cambridge-Newton
> Population change due to migration, 2010-2018: +197,049 (+4.3%)
> Overall population change, 2010-2018: +322,792 (+7.1%)
> 2018 population: 4.9 million
> Median household income: $88,711
> January 2020 unemployment: 2.6%
[in-text-ad]

22. Michigan: Ann Arbor
> Population change due to migration, 2010-2018: +13,480 (+3.9%)
> Overall population change, 2010-2018: +25,859 (+7.5%)
> 2018 population: 370,963
> Median household income: $71,860
> January 2020 unemployment: 2.7%

23. Minnesota: Minneapolis-St. Paul-Bloomington
> Population change due to migration, 2010-2018: +92,289 (+2.8%)
> Overall population change, 2010-2018: +280,328 (+8.4%)
> 2018 population: 3.6 million
> Median household income: $79,578
> January 2020 unemployment: 3.0%

24. Mississippi: Gulfport-Biloxi-Pascagoula
> Population change due to migration, 2010-2018: +16,855 (+4.5%)
> Overall population change, 2010-2018: +26,474 (+7.1%)
> 2018 population: 397,261
> Median household income: $47,444
> January 2020 unemployment: 5.5%
[in-text-ad-2]

25. Missouri: Columbia
> Population change due to migration, 2010-2018: +8,607 (+5.3%)
> Overall population change, 2010-2018: +17,360 (+10.7%)
> 2018 population: 180,005
> Median household income: $54,356
> January 2020 unemployment: 2.5%

26. Montana: Missoula
> Population change due to migration, 2010-2018: +6,448 (+5.9%)
> Overall population change, 2010-2018: +9,495 (+8.7%)
> 2018 population: 118,791
> Median household income: $56,598
> January 2020 unemployment: 3.1%
[in-text-ad]

27. Nebraska: Lincoln
> Population change due to migration, 2010-2018: +15,816 (+5.2%)
> Overall population change, 2010-2018: +32,433 (+10.7%)
> 2018 population: 334,590
> Median household income: $58,506
> January 2020 unemployment: 2.8%

28. Nevada: Las Vegas-Henderson-Paradise
> Population change due to migration, 2010-2018: +183,271 (+9.4%)
> Overall population change, 2010-2018: +280,376 (+14.4%)
> 2018 population: 2.2 million
> Median household income: $57,076
> January 2020 unemployment: 3.9%

29. New Hampshire: Manchester-Nashua
> Population change due to migration, 2010-2018: +5,493 (+1.4%)
> Overall population change, 2010-2018: +14,548 (+3.6%)
> 2018 population: 415,247
> Median household income: $78,978
> January 2020 unemployment: 2.4%
[in-text-ad-2]

30. New Jersey: None

31. New Mexico: Santa Fe
> Population change due to migration, 2010-2018: +4,218 (+2.9%)
> Overall population change, 2010-2018: +5,829 (+4.0%)
> 2018 population: 150,056
> Median household income: $60,193
> January 2020 unemployment: 3.8%
[in-text-ad]

32. New York: Albany-Schenectady-Troy
> Population change due to migration, 2010-2018: +2,350 (+0.3%)
> Overall population change, 2010-2018: +12,455 (+1.4%)
> 2018 population: 883,169
> Median household income: $71,301
> January 2020 unemployment: 3.6%

33. North Carolina: Raleigh
> Population change due to migration, 2010-2018: +159,756 (+14.1%)
> Overall population change, 2010-2018: +232,052 (+20.5%)
> 2018 population: 1.4 million
> Median household income: $75,165
> January 2020 unemployment: 3.2%

34. North Dakota: Fargo
> Population change due to migration, 2010-2018: +21,211 (+10.2%)
> Overall population change, 2010-2018: +36,694 (+17.6%)
> 2018 population: 245,471
> Median household income: $65,073
> January 2020 unemployment: 2.2%
[in-text-ad-2]

35. Ohio: Columbus
> Population change due to migration, 2010-2018: +106,381 (+5.6%)
> Overall population change, 2010-2018: +204,534 (+10.8%)
> 2018 population: 2.1 million
> Median household income: $64,052
> January 2020 unemployment: 3.7%

36. Oklahoma: Oklahoma City
> Population change due to migration, 2010-2018: +81,389 (+6.5%)
> Overall population change, 2010-2018: +143,455 (+11.4%)
> 2018 population: 1.4 million
> Median household income: $57,485
> January 2020 unemployment: 3.0%
[in-text-ad]

37. Oregon: Bend-Redmond
> Population change due to migration, 2010-2018: +30,773 (+19.5%)
> Overall population change, 2010-2018: +34,266 (+21.7%)
> 2018 population: 191,996
> Median household income: $67,577
> January 2020 unemployment: 3.6%

38. Pennsylvania: Lebanon
> Population change due to migration, 2010-2018: +6,292 (+4.7%)
> Overall population change, 2010-2018: +7,737 (+5.8%)
> 2018 population: 141,314
> Median household income: $61,362
> January 2020 unemployment: 4.1%

39. Rhode Island: Providence-Warwick
> Population change due to migration, 2010-2018: +7,768 (+0.5%)
> Overall population change, 2010-2018: +20,126 (+1.3%)
> 2018 population: 1.6 million
> Median household income: $65,083
> January 2020 unemployment: 3.4%
[in-text-ad-2]

40. South Carolina: Myrtle Beach-Conway-North Myrtle Beach
> Population change due to migration, 2010-2018: +105,460 (+28.0%)
> Overall population change, 2010-2018: +104,336 (+27.7%)
> 2018 population: 480,891
> Median household income: $51,580
> January 2020 unemployment: 3.2%

41. South Dakota: Sioux Falls
> Population change due to migration, 2010-2018: +19,823 (+8.7%)
> Overall population change, 2010-2018: +37,391 (+16.4%)
> 2018 population: 265,653
> Median household income: $61,196
> January 2020 unemployment: 2.7%
[in-text-ad]

42. Tennessee: Nashville-Davidson–Murfreesboro–Franklin
> Population change due to migration, 2010-2018: +178,958 (+10.7%)
> Overall population change, 2010-2018: +260,085 (+15.6%)
> 2018 population: 1.9 million
> Median household income: $65,919
> January 2020 unemployment: 2.6%

43. Texas: Austin-Round Rock
> Population change due to migration, 2010-2018: +310,931 (+18.1%)
> Overall population change, 2010-2018: +451,995 (+26.3%)
> 2018 population: 2.2 million
> Median household income: $76,925
> January 2020 unemployment: 2.6%

44. Utah: St. George
> Population change due to migration, 2010-2018: +24,835 (+18.0%)
> Overall population change, 2010-2018: +33,585 (+24.3%)
> 2018 population: 171,700
> Median household income: $56,333
> January 2020 unemployment: 2.7%
[in-text-ad-2]

45. Vermont: Burlington-South Burlington
> Population change due to migration, 2010-2018: +4,605 (+2.2%)
> Overall population change, 2010-2018: +9,821 (+4.6%)
> 2018 population: 221,083
> Median household income: $71,452
> January 2020 unemployment: 1.8%

46. Virginia: Winchester
> Population change due to migration, 2010-2018: +8,171 (+6.4%)
> Overall population change, 2010-2018: +11,335 (+8.8%)
> 2018 population: 139,810
> Median household income: $65,170
> January 2020 unemployment: 2.5%
[in-text-ad]

47. Washington: Olympia-Tumwater
> Population change due to migration, 2010-2018: +25,634 (+10.2%)
> Overall population change, 2010-2018: +34,159 (+13.5%)
> 2018 population: 286,419
> Median household income: $72,703
> January 2020 unemployment: 4.8%

48. West Virginia: Morgantown
> Population change due to migration, 2010-2018: +7,237 (+5.6%)
> Overall population change, 2010-2018: +10,549 (+8.1%)
> 2018 population: 140,259
> Median household income: $50,574
> January 2020 unemployment: 3.8%

49. Wisconsin: Madison
> Population change due to migration, 2010-2018: +29,185 (+4.8%)
> Overall population change, 2010-2018: +54,973 (+9.1%)
> 2018 population: 660,422
> Median household income: $70,463
> January 2020 unemployment: 2.6%
[in-text-ad-2]

50. Wyoming: Cheyenne
> Population change due to migration, 2010-2018: +3,019 (+3.3%)
> Overall population change, 2010-2018: +7,091 (+7.7%)
> 2018 population: 98,976
> Median household income: $64,306
> January 2020 unemployment: 3.4%
The Average American Has No Idea How Much Money You Can Make Today (Sponsor)
The last few years made people forget how much banks and CD’s can pay. Meanwhile, interest rates have spiked and many can afford to pay you much more, but most are keeping yields low and hoping you won’t notice.
But there is good news. To win qualified customers, some accounts are paying almost 10x the national average! That’s an incredible way to keep your money safe and earn more at the same time. Our top pick for high yield savings accounts includes other benefits as well. You can earn up to 3.80% with a Checking & Savings Account today Sign up and get up to $300 with direct deposit. No account fees. FDIC Insured.
Click here to see how much more you could be earning on your savings today. It takes just a few minutes to open an account to make your money work for you.
Our top pick for high yield savings accounts includes other benefits as well. You can earn up to 4.00% with a Checking & Savings Account from Sofi. Sign up and get up to $300 with direct deposit. No account fees. FDIC Insured.
Thank you for reading! Have some feedback for us?
Contact the 24/7 Wall St. editorial team.
 24/7 Wall St.
 24/7 Wall St.
 24/7 Wall St.