The COVID-19 pandemic has caused major upheaval in virtually every major industry in the United States as Americans have stayed at home and avoided nonessential purchases. One of the industries where the effects are starting to be felt is the real estate market.
According to a recent report released by real estate data analytics company ATTOM data solutions, some of the most vulnerable housing markets most prone to a serious upheaval are in the Northeast and Florida areas. Home price data for March 2020 at the market level is not yet available, but already in February 2020, sales prices in a number of housing markets dipped. And as more alarming economic figures are released every day, these declines may very well be a sign of what is to come.
To determine the cities where home prices are plummeting, 24/7 Wall St. reviewed the change in median sales price from January 2020 to February 2020 using data from ATTOM Data Solutions. The 21 metropolitan areas listed recorded at least a 5% price decline in that period. In a pair of markets, prices fell by well over 20%. Home price sale data in these months is still being collected, but ATTOM expects that the overall trends seen here will continue.
“We are in a period of great uncertainty,” ATTOM Chief Product Officer Todd Teta told 24/7 Wall St. in an email. “If fewer people can afford homes, or even want to go out looking during the pandemic, it reduces the demand for homes. That increases the chance of sellers [reducing] prices, which knocks down values for everyone.”
In the vast majority of major U.S. housing markets, the number of home sales fell by at least 10% between January and February of this year. And those declines in many cases were particularly severe in many of the housing markets on this list. In the Atlantic City metro area, the number of monthly home sales fell by more than 80% in February.
Click here to see the cities where home prices plummeted as early as February

21. Allentown-Bethlehem-Easton, PA-NJ
> Change in median sales price, Jan. 2020 – Feb. 2020 -5.7% ($182,225- $171,900)
> February 2019 home sales: 628
> February 2020 home sales: 494 (-21.3% YoY decline)
> Housing units: 45,443
[in-text-ad]

20. New Haven-Milford, CT
> Change in median sales price, Jan. 2020 – Feb. 2020: -5.7% ($192,500- $181,500)
> February 2019 home sales: 514
> February 2020 home sales: 353 (-31.3% YoY decline)
> Housing units: 366,266
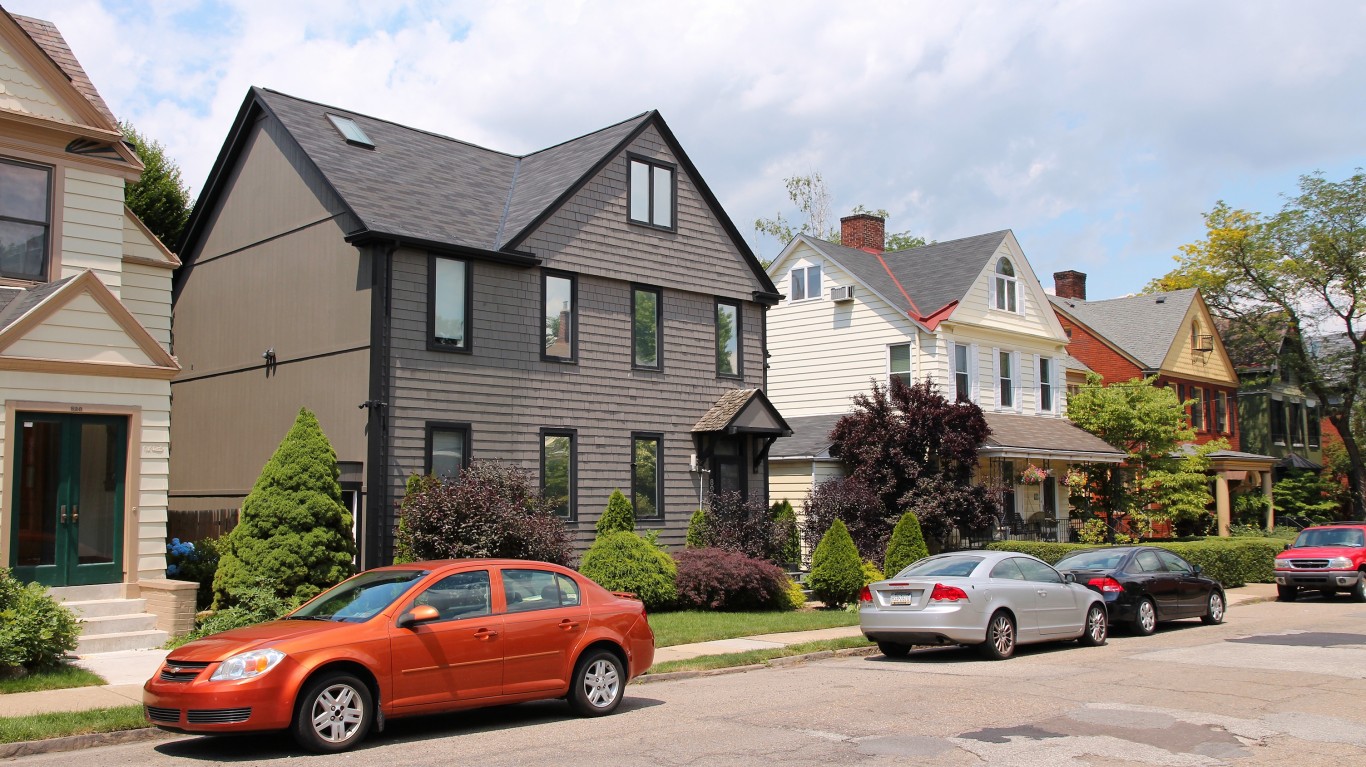
19. Pittsburgh, PA
> Change in median sales price, Jan. 2020 – Feb. 2020: -5.7% ($132,000- $124,450)
> February 2019 home sales: 1,524
> February 2020 home sales: 536 (-64.8% YoY decline)
> Housing units: 598,424

18. Philadelphia-Camden-Wilmington, PA-NJ-DE-MD
> Change in median sales price, Jan. 2020 – Feb. 2020: -6.0% ($210,000- $197,500)
> February 2019 home sales: 4,833
> February 2020 home sales: 3,268 (-32.4% YoY decline)
> Housing units: 222,146
[in-text-ad-2]

17. Hartford-West Hartford-East Hartford, CT
> Change in median sales price, Jan. 2020 – Feb. 2020: -6.2% ($205,000- $192,250)
> February 2019 home sales: 653
> February 2020 home sales: 539 (-17.5% YoY decline)
> Housing units: 378,700

16. Palm Bay-Melbourne-Titusville, FL
> Change in median sales price, Jan. 2020 – Feb. 2020: -7.4% ($205,000- $189,750)
> February 2019 home sales: 857
> February 2020 home sales: 319 (-62.8% YoY decline)
> Housing units: 276,294
[in-text-ad]
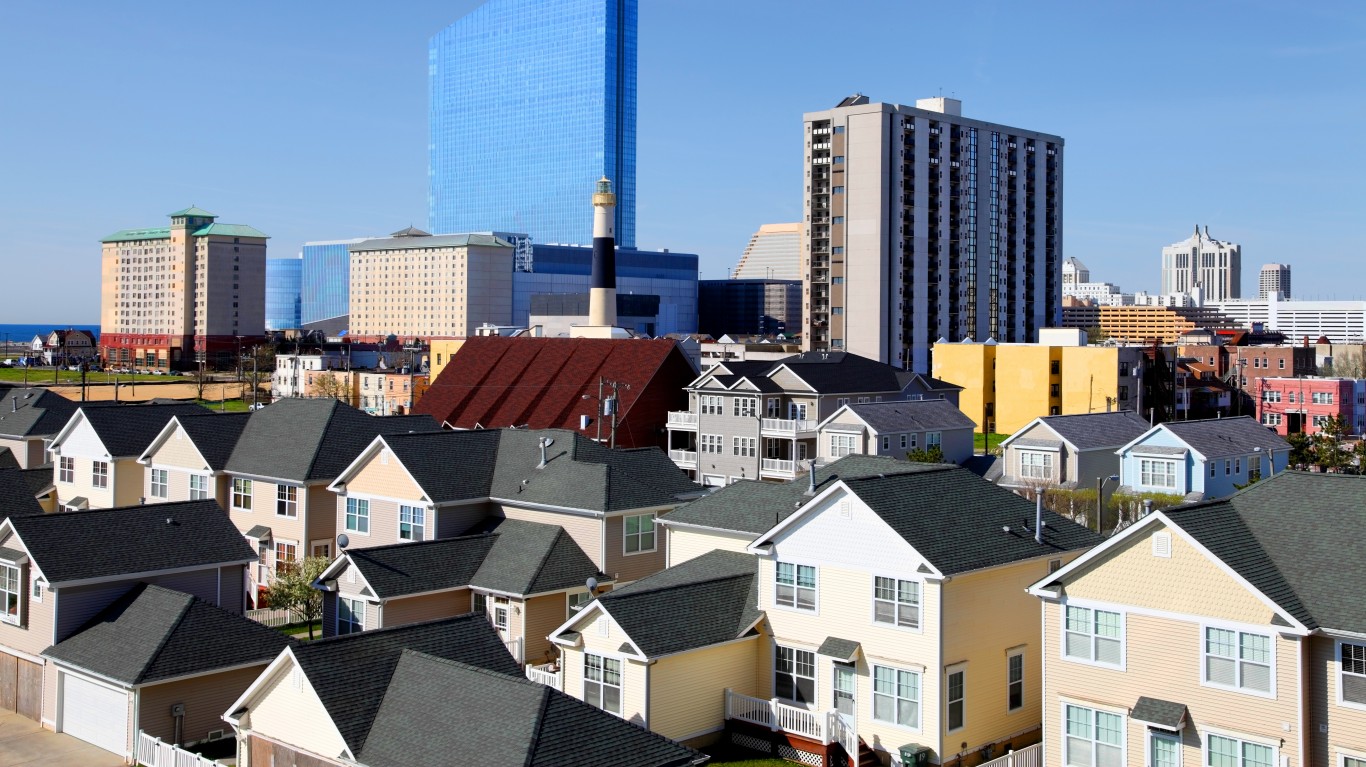
15. Atlantic City-Hammonton, NJ
> Change in median sales price, Jan. 2020 – Feb. 2020: -7.9% ($180,000- $165,750)
> February 2019 home sales: 336
> February 2020 home sales: 58 (-82.7% YoY decline)
> Housing units: 127,987
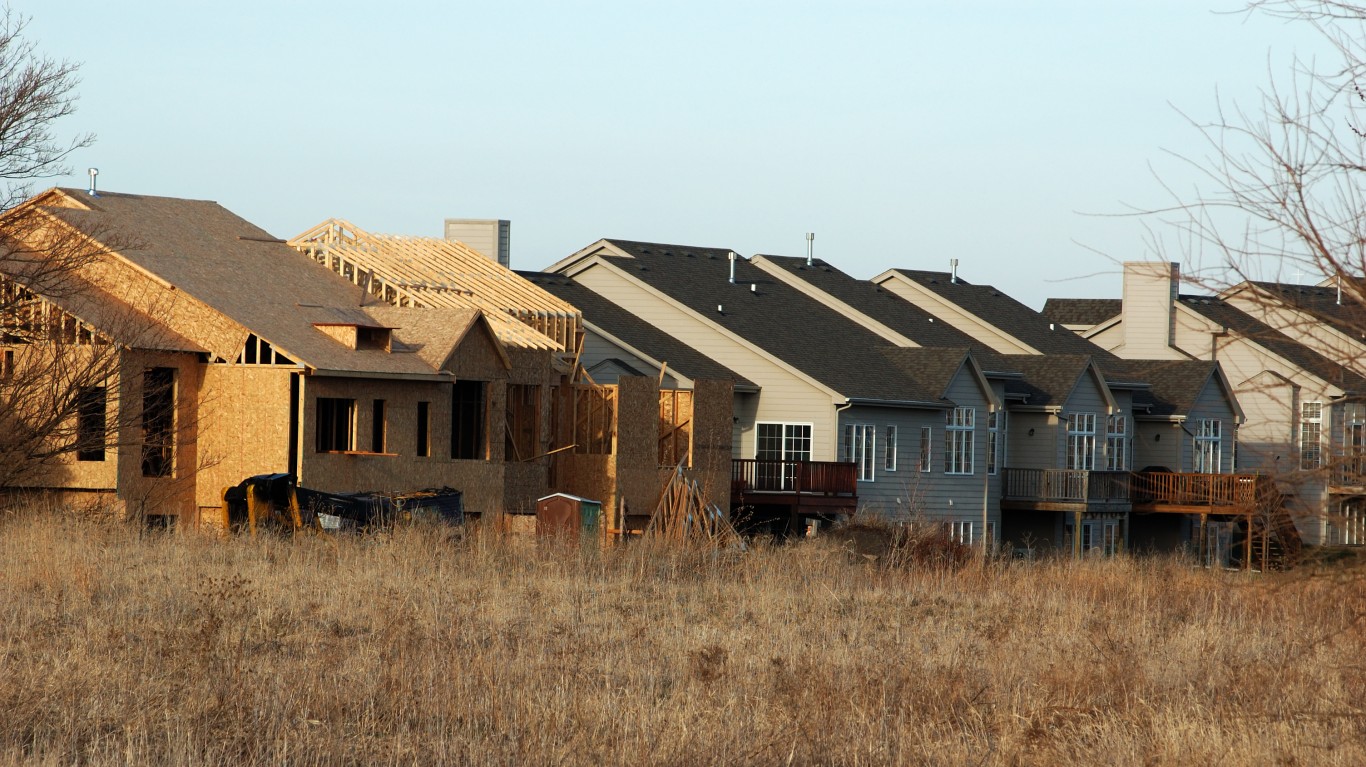
14. Des Moines-West Des Moines, IA
> Change in median sales price, Jan. 2020 – Feb. 2020: -8.9% ($175,000- $159,500)
> February 2019 home sales: 684
> February 2020 home sales: 367 (-46.3% YoY decline)
> Housing units: 34,937

13. Huntsville, AL
> Change in median sales price, Jan. 2020 – Feb. 2020: -9.1% ($165,000- $150,000)
> February 2019 home sales: 588
> February 2020 home sales: 302 (-48.6% YoY decline)
> Housing units: 36,069
[in-text-ad-2]
12. Evansville, IN-KY
> Change in median sales price, Jan. 2020 – Feb. 2020: -9.3% ($142,225- $129,000)
> February 2019 home sales: 375
> February 2020 home sales: 40 (-89.3% YoY decline)
> Housing units: 11,480
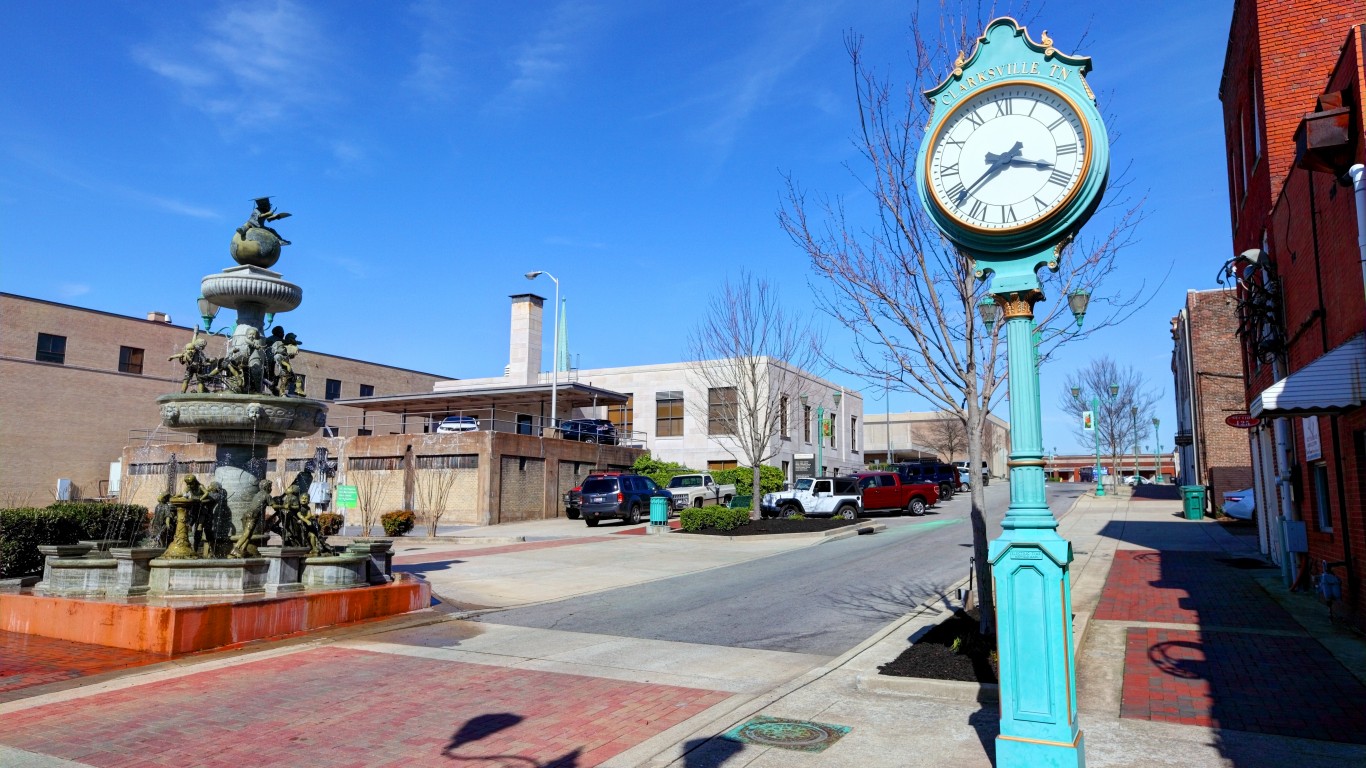
11. Clarksville, TN-KY
> Change in median sales price, Jan. 2020 – Feb. 2020: -9.6% ($171,500- $155,000)
> February 2019 home sales: 434
> February 2020 home sales: 246 (-43.3% YoY decline)
> Housing units: 29,888
[in-text-ad]
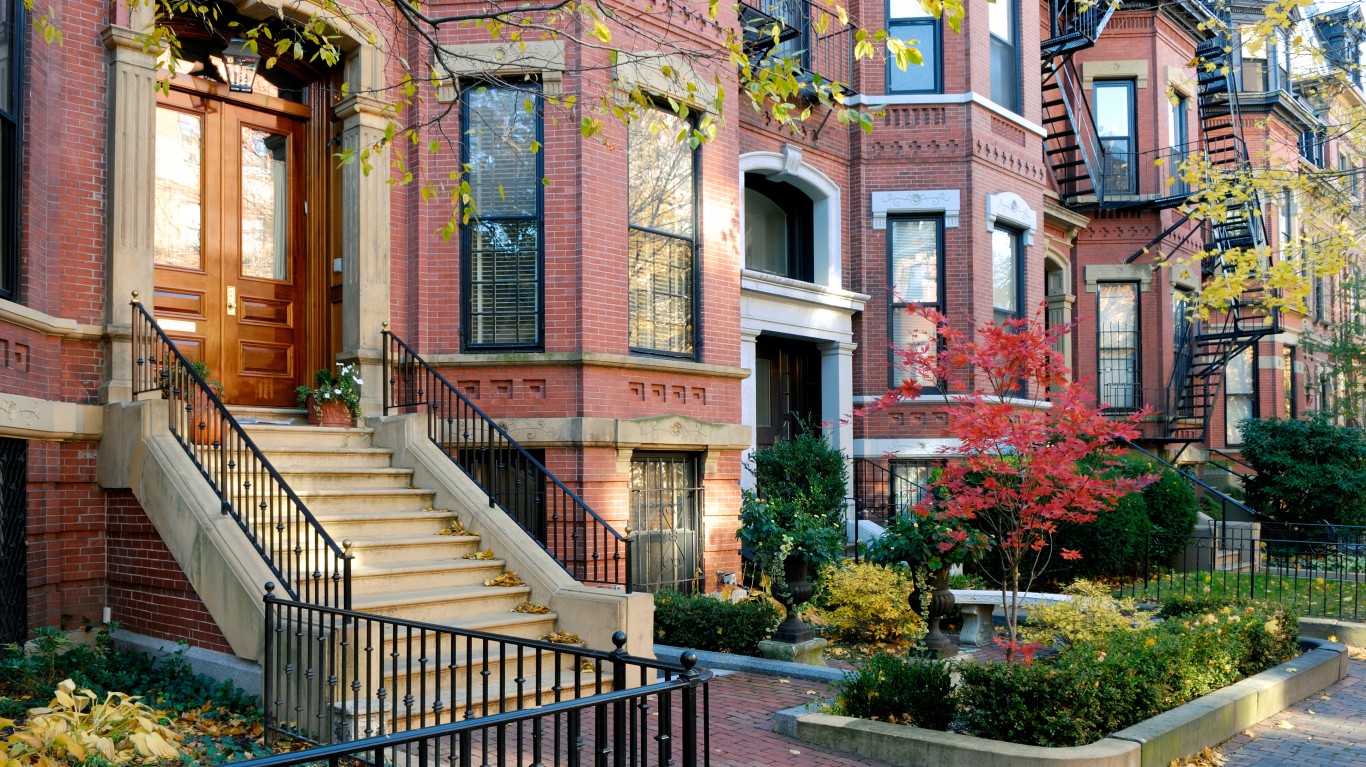
10. Boston-Cambridge-Newton, MA-NH
> Change in median sales price, Jan. 2020 – Feb. 2020: -10.3% ($438,000- $393,000)
> February 2019 home sales: 1,340
> February 2020 home sales: 1,013 (-24.4% YoY decline)
> Housing units: 312,013
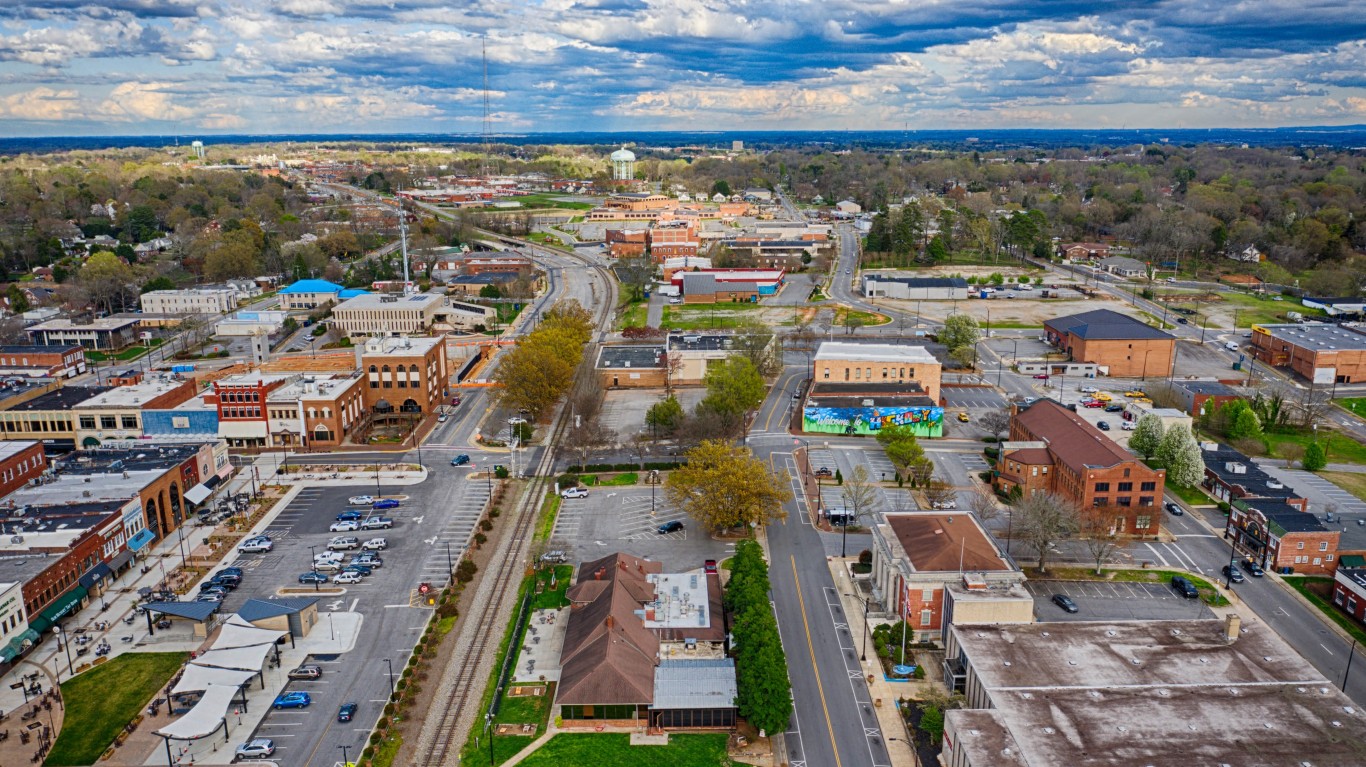
9. Hickory-Lenoir-Morganton, NC
> Change in median sales price, Jan. 2020 – Feb. 2020: -10.4% ($125,000- $112,000)
> February 2019 home sales: 347
> February 2020 home sales: 214 (-38.3% YoY decline)
> Housing units: 16,399
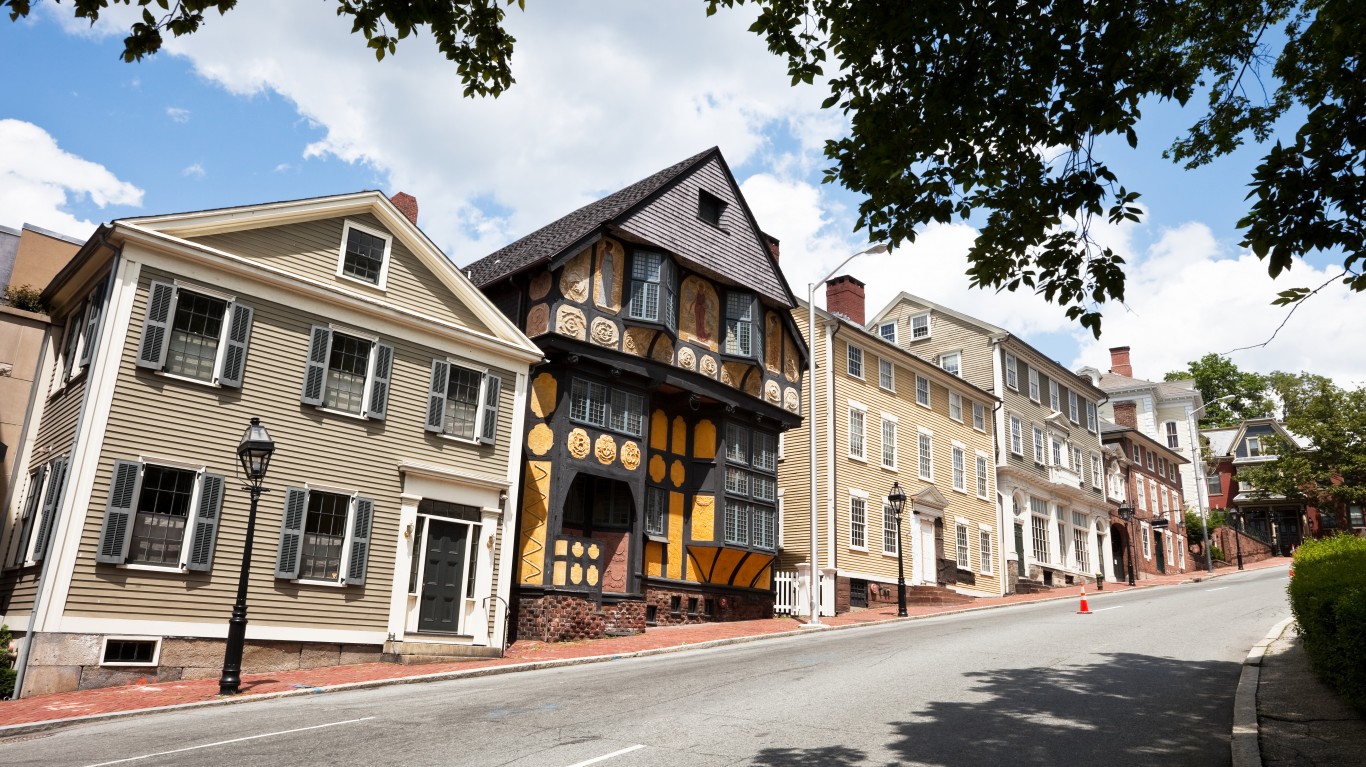
8. Providence-Warwick, RI-MA
> Change in median sales price, Jan. 2020 – Feb. 2020: -10.7% ($280,000- $249,950)
> February 2019 home sales: 754
> February 2020 home sales: 615 (-18.4% YoY decline)
> Housing units: 234,458
[in-text-ad-2]
7. Buffalo-Cheektowaga-Niagara Falls, NY
> Change in median sales price, Jan. 2020 – Feb. 2020: -11.5% ($151,000- $133,700)
> February 2019 home sales: 610
> February 2020 home sales: 413 (-32.3% YoY decline)
> Housing units: 427,147
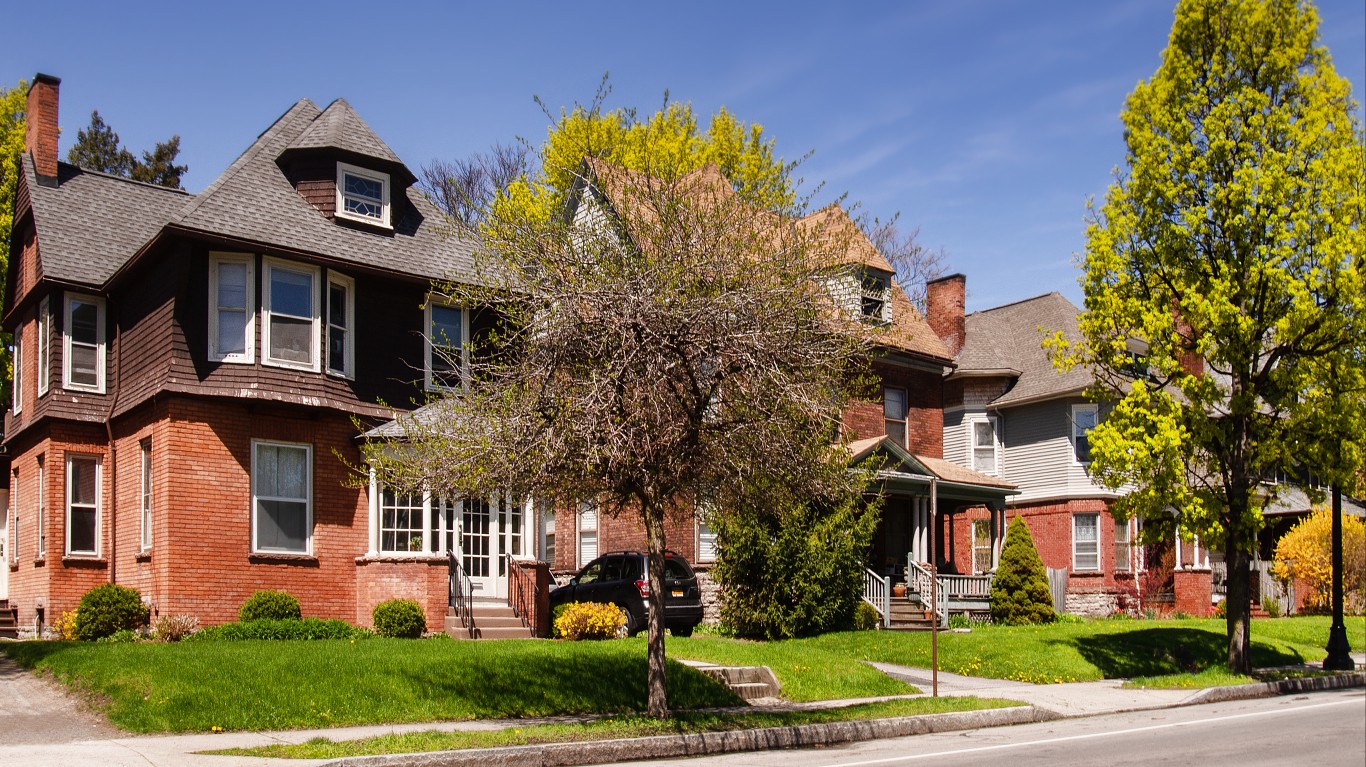
6. Rochester, NY
> Change in median sales price, Jan. 2020 – Feb. 2020: -12.1% ($142,250- $125,000)
> February 2019 home sales: 722
> February 2020 home sales: 255 (-64.7% YoY decline)
> Housing units: 27,455
[in-text-ad]

5. Worcester, MA-CT
> Change in median sales price, Jan. 2020 – Feb. 2020: -15.3% ($258,500- $219,000)
> February 2019 home sales: 301
> February 2020 home sales: 267 (-11.3% YoY decline)
> Housing units: 49,644

4. Scranton–Wilkes-Barre–Hazleton, PA
> Change in median sales price, Jan. 2020 – Feb. 2020: -15.8% ($104,390- $87,900)
> February 2019 home sales: 339
> February 2020 home sales: 253 (-25.4% YoY decline)
> Housing units: 99,659

3. Hilton Head Island-Bluffton-Beaufort, SC
> Change in median sales price, Jan. 2020 – Feb. 2020: -17.6% ($327,500- $270,000)
> February 2019 home sales: 350
> February 2020 home sales: 205 (-41.4% YoY decline)
> Housing units: 97,831
[in-text-ad-2]
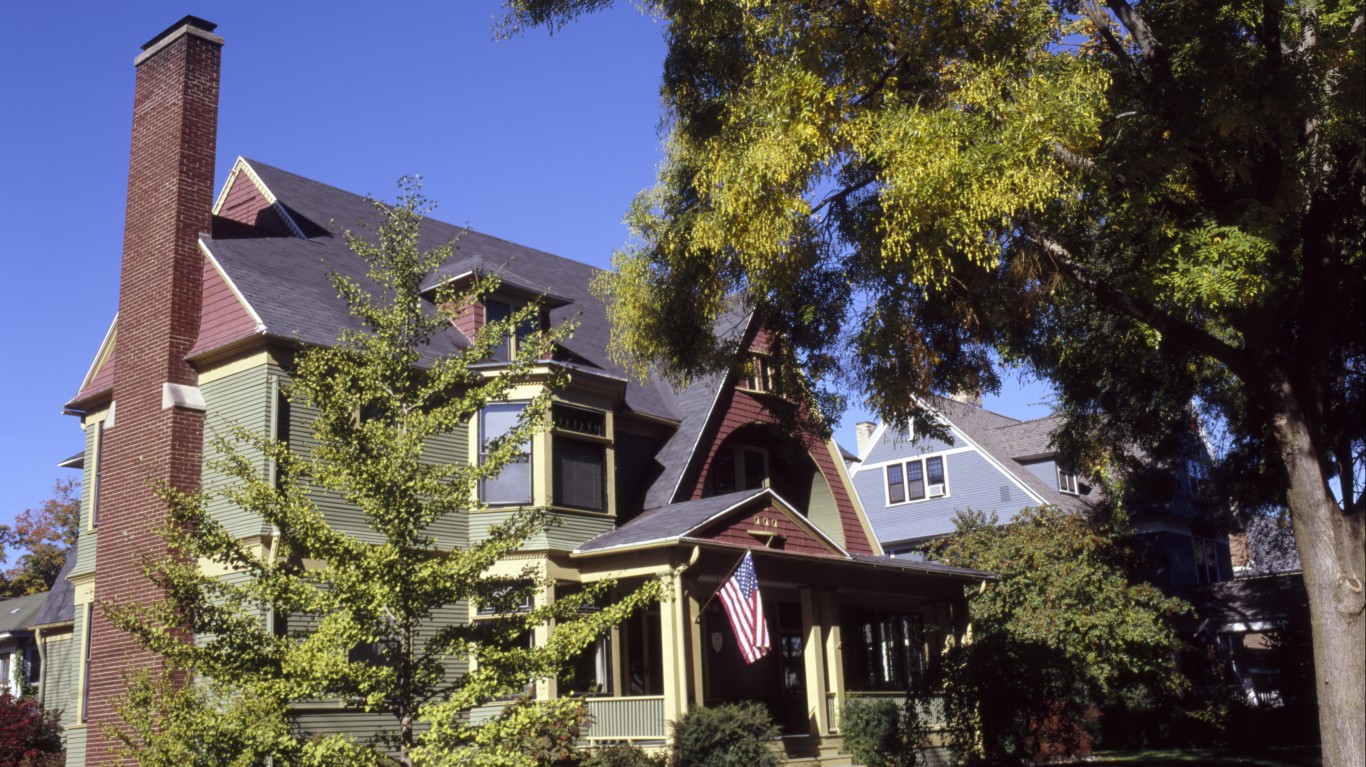
2. Grand Rapids-Wyoming, MI
> Change in median sales price, Jan. 2020 – Feb. 2020: -24.3% ($185,000- $140,000)
> February 2019 home sales: 1,009
> February 2020 home sales: 03 (-99.7% YoY decline)
> Housing units: 27,468
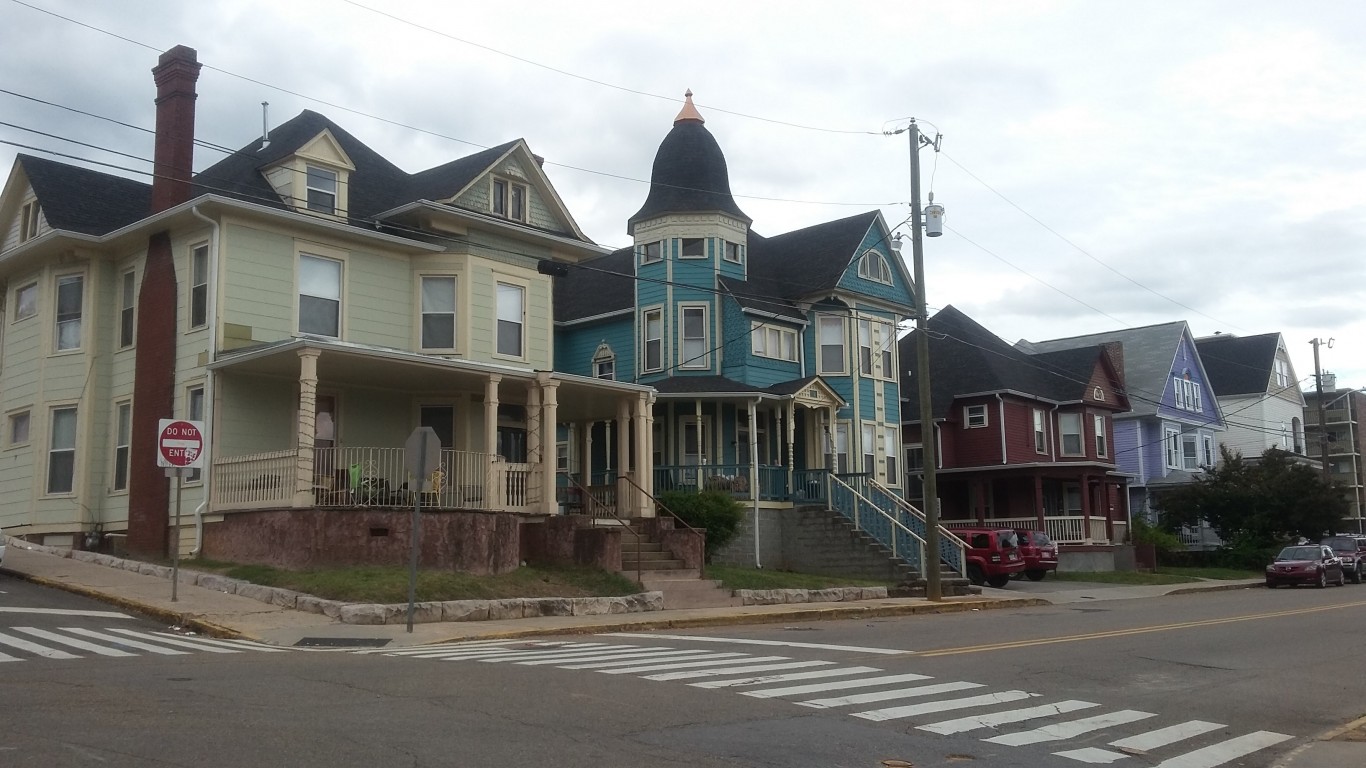
1. Knoxville, TN
> Change in median sales price, Jan. 2020 – Feb. 2020: -27.9% ($163,000- $117,500)
> February 2019 home sales: 1,054
> February 2020 home sales: 359 (-65.9% YoY decline)
> Housing units: 34,932
100 Million Americans Are Missing This Crucial Retirement Tool
The thought of burdening your family with a financial disaster is most Americans’ nightmare. However, recent studies show that over 100 million Americans still don’t have proper life insurance in the event they pass away.
Life insurance can bring peace of mind – ensuring your loved ones are safeguarded against unforeseen expenses and debts. With premiums often lower than expected and a variety of plans tailored to different life stages and health conditions, securing a policy is more accessible than ever.
A quick, no-obligation quote can provide valuable insight into what’s available and what might best suit your family’s needs. Life insurance is a simple step you can take today to help secure peace of mind for your loved ones tomorrow.
Click here to learn how to get a quote in just a few minutes.
Thank you for reading! Have some feedback for us?
Contact the 24/7 Wall St. editorial team.
 24/7 Wall St.
 24/7 Wall St.
 24/7 Wall St.
