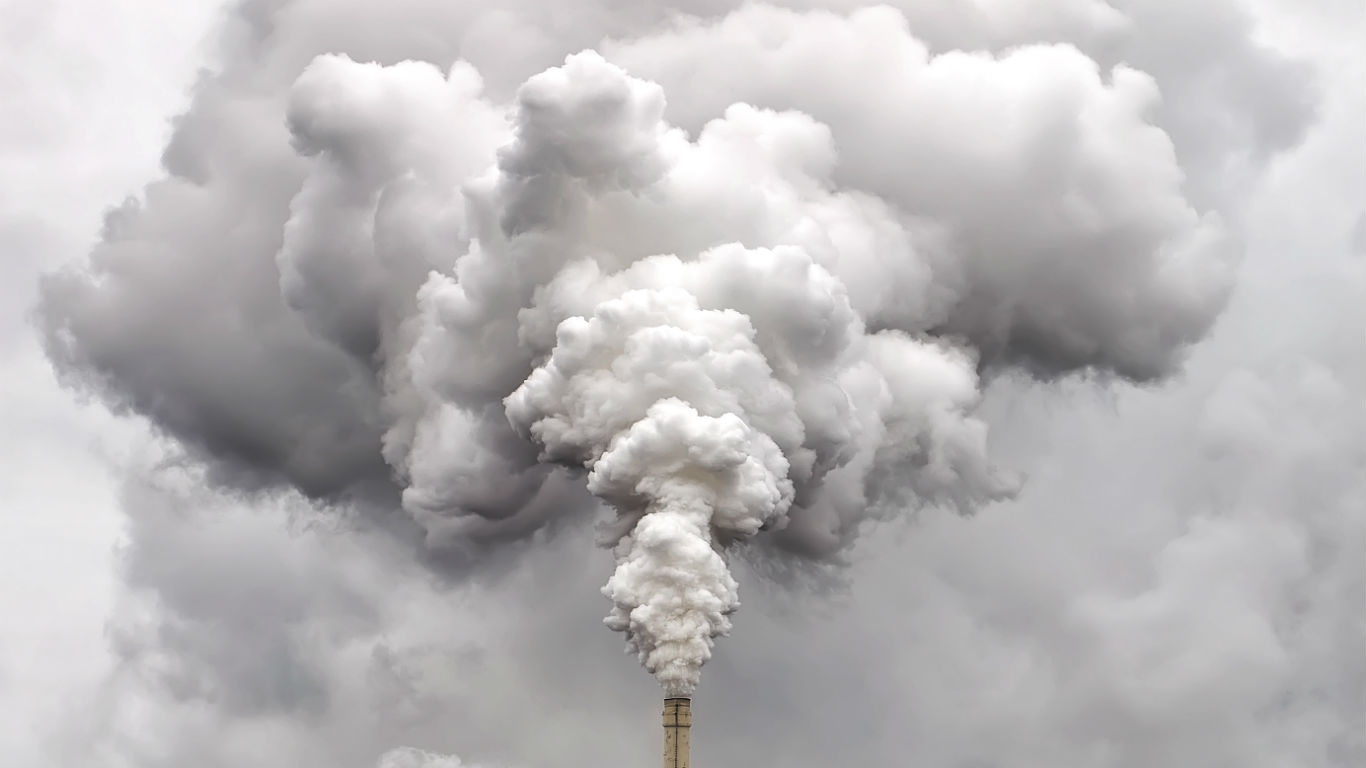
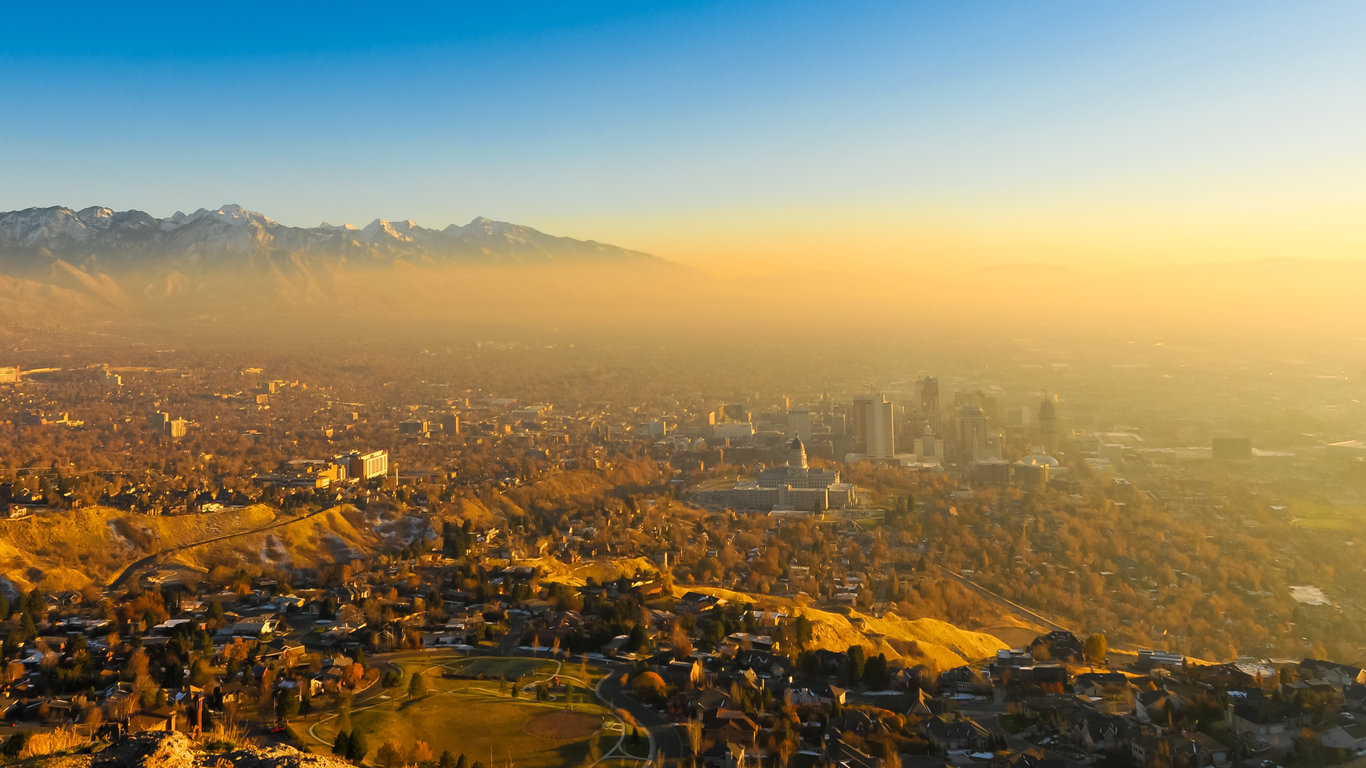
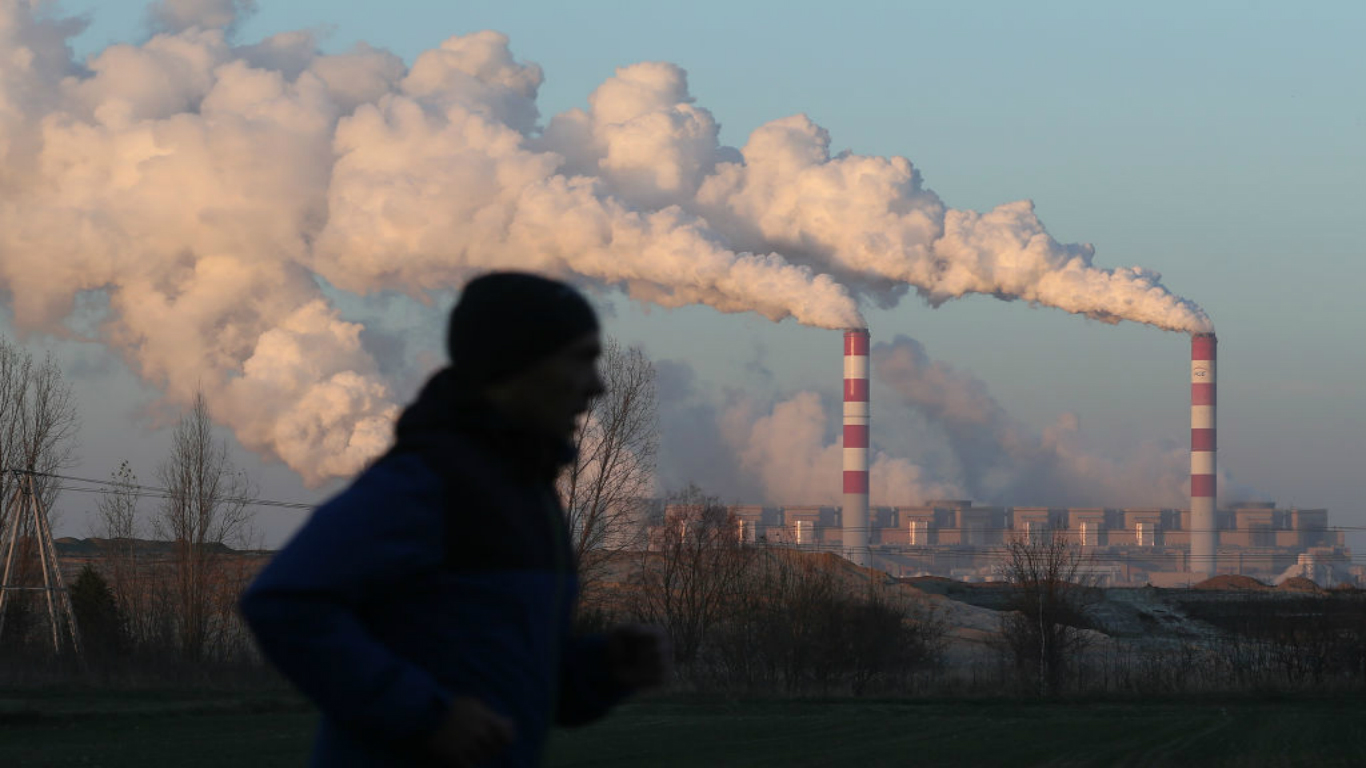
The worldwide travel restrictions and numerous lockdowns instituted to combat the spread of COVID-19 have massively reduced greenhouse gas emissions, contributing to cleaner skies — even in some of the most polluted cities on Earth. The planet seems to be getting a much needed break amid a worrying climate change trend. Oceans are hotter than ever, the average global temperature has never been higher, and heatwaves are triggering unprecedented numbers of wildfires in regions such as the Arctic Circle, which includes Alaska.
While many countries have made aggressive commitments to reduce emissions, the United States, which is the world’s second largest greenhouse gas emitter, is falling behind. The U.S. is now one of only three countries in the world not participating in the Paris Climate Accord, an international landmark deal aiming to keep the increase in global average temperature to below 2°C, or 3.6 degrees Fahrenheit, above pre-industrial levels.
Some states, however, have taken steps to address climate change and protect the environment compared to the country as a whole. 24/7 Tempo created an index of air pollution levels, state energy generation and efficiency policy, and employment in green jobs to identify the 20 most eco-friendly states.
Environmentally-friendly states enact more aggressive local restrictions on energy use for their businesses and transportation systems; they use more renewable energy sources and less fossil fuels; and they generally have less pollution. Some 23 states and the District of Columbia have set their own greenhouse gas targets to reduce emissions in line with the Paris Agreement.
The burning of fossil fuels is one of the primary contributors to not just of greenhouse gas emissions, but also other forms of air pollution and environmental harm. While some U.S. states generate over 90% of electricity by burning coal, oil, or natural gas, other states’ electricity generation is mostly from renewable sources.
PM2.5 is shorthand for particulate matter that is 2.5 micrometers in diameter or smaller and that can be inhaled by humans and animals. These fine particles are produced by the burning of fuel in car engines, factories, domestic heating or by chemical reactions that take place in the atmosphere. The 24-hour concentration of PM2.5, the most harmful type of air pollution, is considered unhealthy when it rises above 35.4 μg/m3, but the annual average should not come out to more than 12 μg/m3.
Click here to read about the most eco-friendly states in America.
Click here to read about our methodology.

50. Mississippi
> Energy generated from renewable sources in 2018: 2.8% — 12th lowest
> Energy generated from fossil fuels: 8.4% — 14th lowest
> Green industry employment: 11.6% — 5th lowest (total green jobs: 131,236)
> Avg. annual particle pollution (PM2.5): 9.9 ug/m3 — 11th highest
> Share of pop. with a long commute and driving alone: 31.9% — 23rd lowest
> Share of pop. carpooling and using public transit: 13.2% — 2nd lowest
[in-text-ad]

49. West Virginia
> Energy generated from renewable sources in 2018: 2.7% — 11th lowest
> Energy generated from fossil fuels: 92.5% — the highest
> Green industry employment: 13.2% — 10th lowest (total green jobs: 91,364)
> Avg. annual particle pollution (PM2.5): 9.6 ug/m3 — 15th highest
> Share of pop. with a long commute and driving alone: 33.4% — 22nd highest
> Share of pop. carpooling and using public transit: 15.5% — 3rd lowest
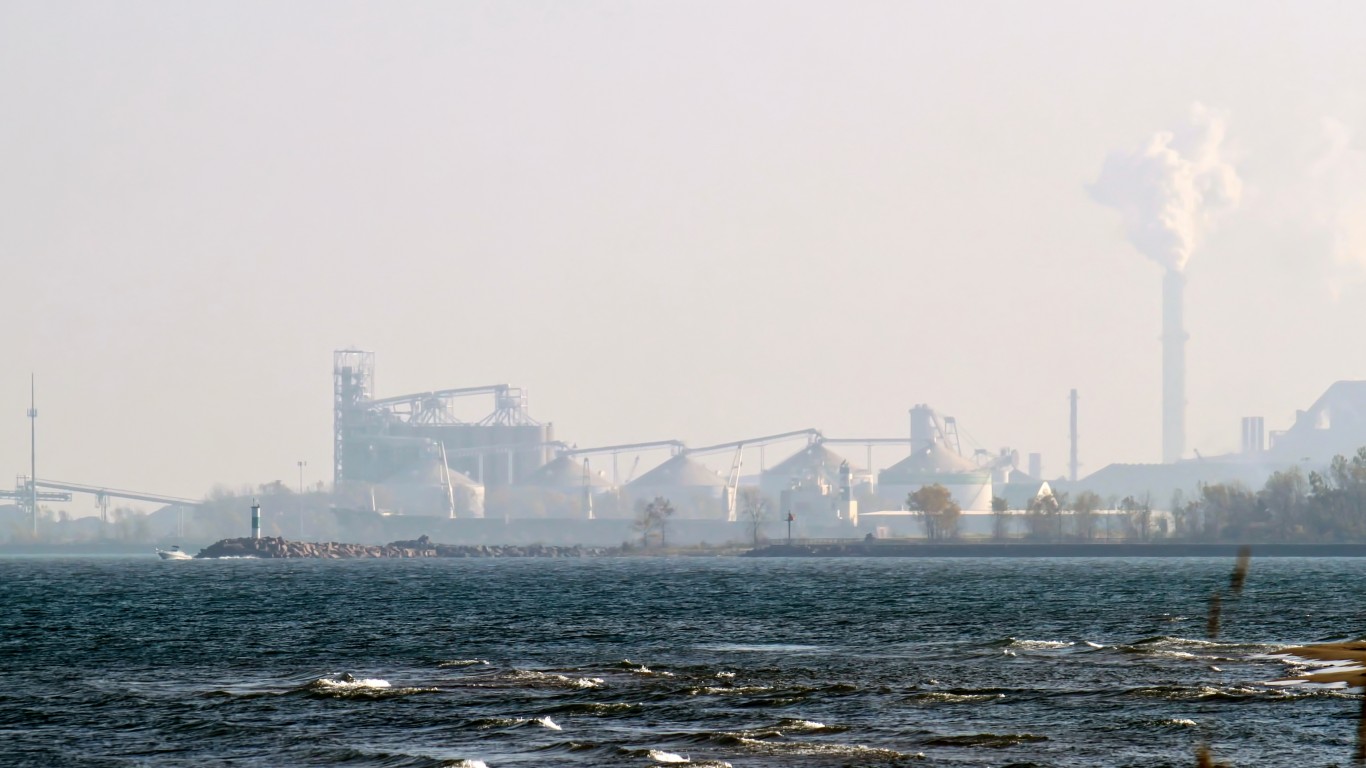
48. Indiana
> Energy generated from renewable sources in 2018: 0.9% — 4th lowest
> Energy generated from fossil fuels: 70.4% — 6th highest
> Green industry employment: 16.5% — 13th highest (total green jobs: 504,337)
> Avg. annual particle pollution (PM2.5): 11.8 ug/m3 — the highest
> Share of pop. with a long commute and driving alone: 31.1% — 21st lowest
> Share of pop. carpooling and using public transit: 16.0% — 6th lowest
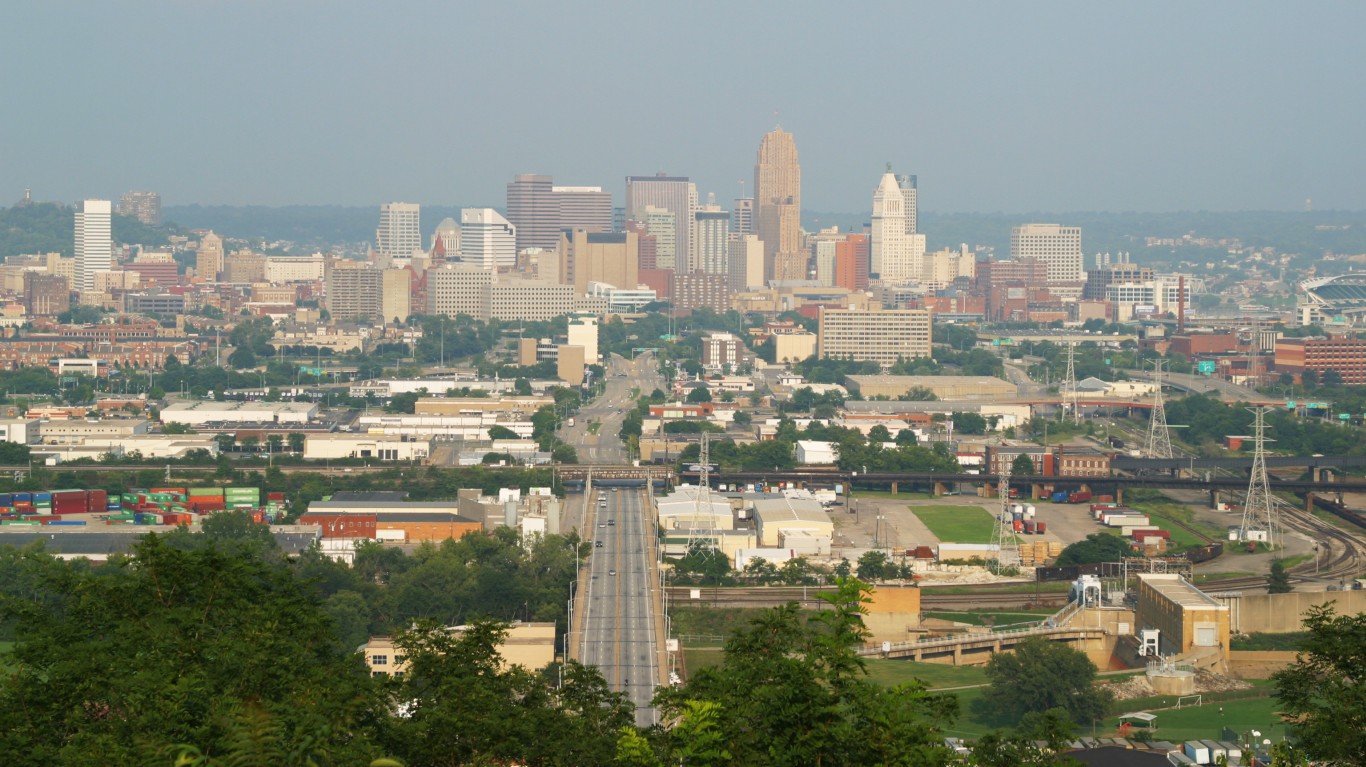
47. Ohio
> Energy generated from renewable sources in 2018: 0.8% — 3rd lowest
> Energy generated from fossil fuels: 48.2% — 12th highest
> Green industry employment: 15.3% — 24th highest (total green jobs: 828,194)
> Avg. annual particle pollution (PM2.5): 11.5 ug/m3 — 2nd highest
> Share of pop. with a long commute and driving alone: 30.5% — 17th lowest
> Share of pop. carpooling and using public transit: 16.8% — 12th lowest
[in-text-ad-2]

46. Kentucky
> Energy generated from renewable sources in 2018: 6.2% — 25th highest
> Energy generated from fossil fuels: 75.2% — 4th highest
> Green industry employment: 13.5% — 12th lowest (total green jobs: 254,507)
> Avg. annual particle pollution (PM2.5): 10.7 ug/m3 — 6th highest
> Share of pop. with a long commute and driving alone: 30.0% — 16th lowest
> Share of pop. carpooling and using public transit: 16.6% — 9th lowest
45. Oklahoma
> Energy generated from renewable sources in 2018: 2.8% — 13th lowest
> Energy generated from fossil fuels: 17.3% — 18th lowest
> Green industry employment: 12.3% — 7th lowest (total green jobs: 197,345)
> Avg. annual particle pollution (PM2.5): 9.4 ug/m3 — 18th highest
> Share of pop. with a long commute and driving alone: 26.5% — 12th lowest
> Share of pop. carpooling and using public transit: 16.4% — 8th lowest
[in-text-ad]

44. Delaware
> Energy generated from renewable sources in 2018: 1.7% — 7th lowest
> Energy generated from fossil fuels: 11.6% — 16th lowest
> Green industry employment: 10.4% — 3rd lowest (total green jobs: 46,576)
> Avg. annual particle pollution (PM2.5): 9.3 ug/m3 — 20th highest
> Share of pop. with a long commute and driving alone: 34.4% — 19th highest
> Share of pop. carpooling and using public transit: 19.7% — 23rd highest
43. Kansas
> Energy generated from renewable sources in 2018: 0.2% — the lowest
> Energy generated from fossil fuels: 39.7% — 17th highest
> Green industry employment: 13.5% — 13th lowest (total green jobs: 187,220)
> Avg. annual particle pollution (PM2.5): 8.1 ug/m3 — 23rd lowest
> Share of pop. with a long commute and driving alone: 20.9% — 8th lowest
> Share of pop. carpooling and using public transit: 17.1% — 13th lowest

42. Louisiana
> Energy generated from renewable sources in 2018: 3.7% — 19th lowest
> Energy generated from fossil fuels: 18.4% — 19th lowest
> Green industry employment: 15.2% — 25th lowest (total green jobs: 292,169)
> Avg. annual particle pollution (PM2.5): 9.4 ug/m3 — 18th highest
> Share of pop. with a long commute and driving alone: 33.3% — 23rd highest
> Share of pop. carpooling and using public transit: 15.9% — 5th lowest
[in-text-ad-2]
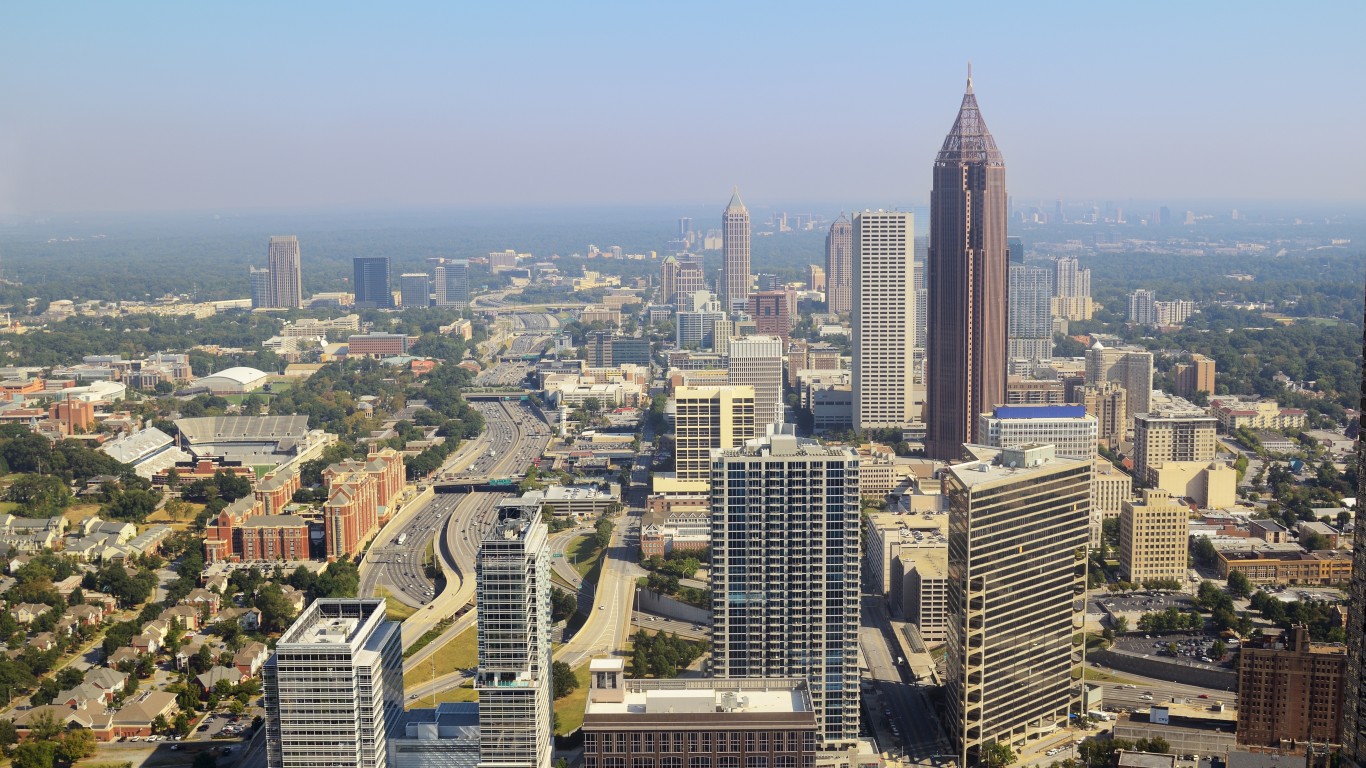
41. Georgia
> Energy generated from renewable sources in 2018: 8.3% — 20th highest
> Energy generated from fossil fuels: 25.2% — 23rd highest
> Green industry employment: 15.6% — 21st highest (total green jobs: 689,230)
> Avg. annual particle pollution (PM2.5): 10.9 ug/m3 — 5th highest
> Share of pop. with a long commute and driving alone: 41.6% — 4th highest
> Share of pop. carpooling and using public transit: 19.0% — 24th lowest
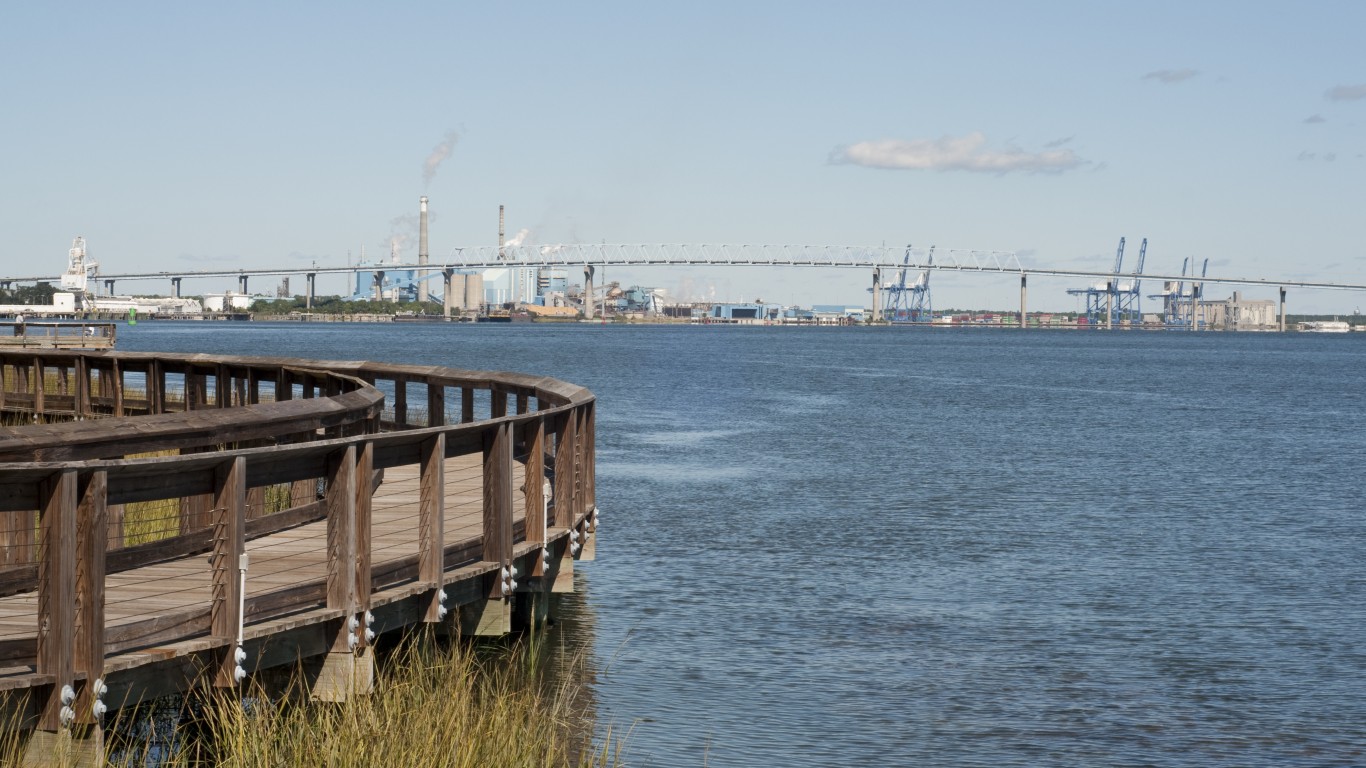
40. South Carolina
> Energy generated from renewable sources in 2018: 5.9% — 23rd lowest
> Energy generated from fossil fuels: 20.0% — 21st lowest
> Green industry employment: 15.4% — 23rd highest (total green jobs: 322,324)
> Avg. annual particle pollution (PM2.5): 10.2 ug/m3 — 8th highest
> Share of pop. with a long commute and driving alone: 34.7% — 18th highest
> Share of pop. carpooling and using public transit: 17.3% — 16th lowest
[in-text-ad]
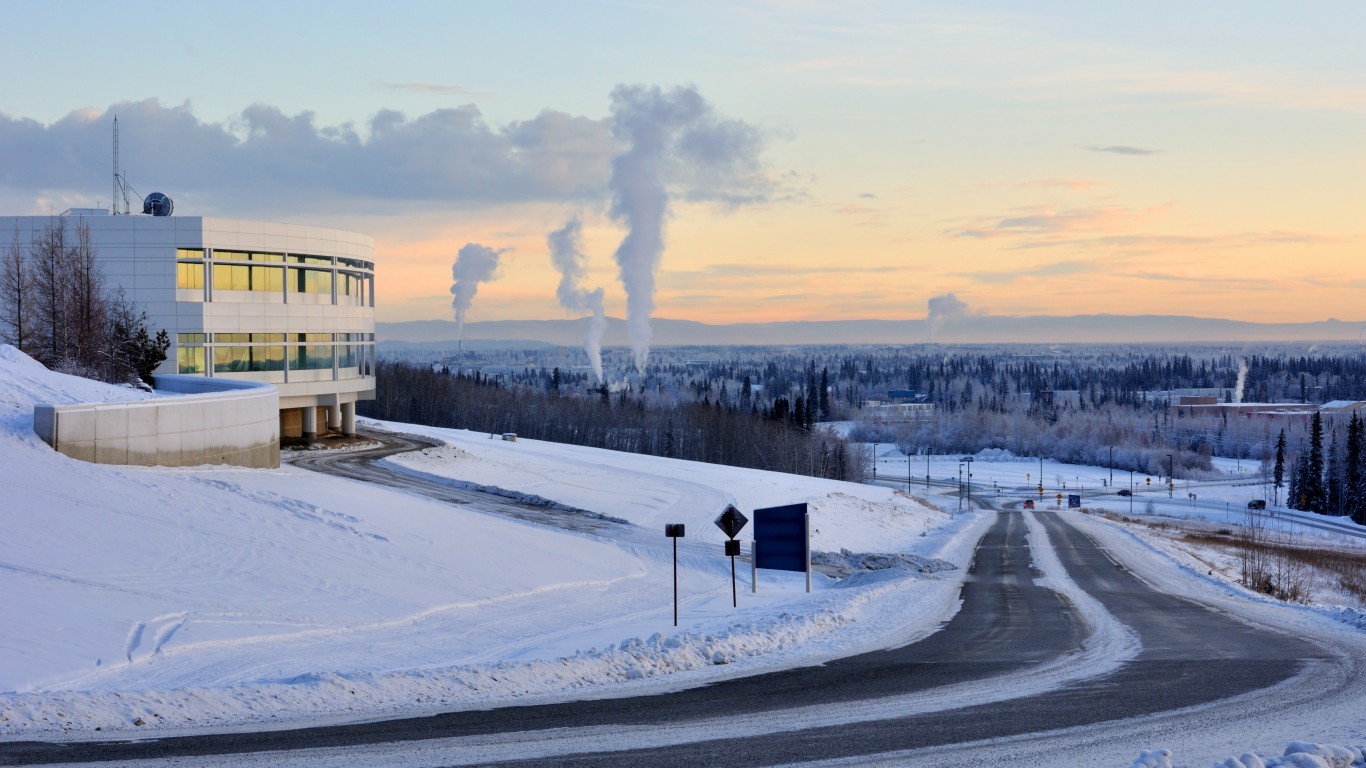
39. Alaska
> Energy generated from renewable sources in 2018: 27.4% — 9th highest
> Energy generated from fossil fuels: 23.0% — 24th lowest
> Green industry employment: 10.0% — the lowest (total green jobs: 32,002)
> Avg. annual particle pollution (PM2.5): 0.0 ug/m3 —
> Share of pop. with a long commute and driving alone: 16.1% — 5th lowest
> Share of pop. carpooling and using public transit: 27.8% — 4th highest
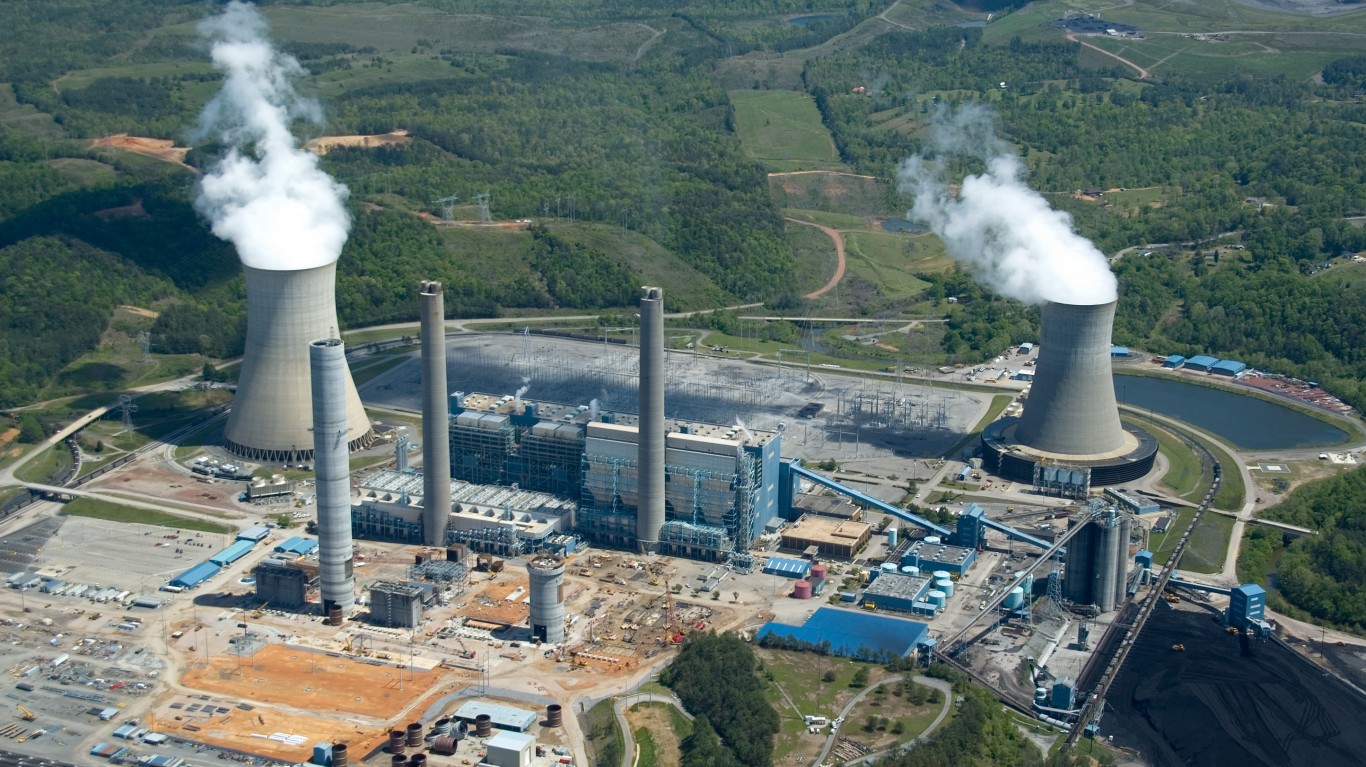
38. Alabama
> Energy generated from renewable sources in 2018: 10.3% — 17th highest
> Energy generated from fossil fuels: 22.0% — 23rd lowest
> Green industry employment: 16.0% — 15th highest (total green jobs: 312,949)
> Avg. annual particle pollution (PM2.5): 11.0 ug/m3 — 4th highest
> Share of pop. with a long commute and driving alone: 34.3% — 20th highest
> Share of pop. carpooling and using public transit: 12.9% — the lowest

37. Hawaii
> Energy generated from renewable sources in 2018: 7.1% — 22nd highest
> Energy generated from fossil fuels: 82.8% — 3rd highest
> Green industry employment: 11.5% — 4th lowest (total green jobs: 75,684)
> Avg. annual particle pollution (PM2.5): 0.0 ug/m3 —
> Share of pop. with a long commute and driving alone: 41.4% — 6th highest
> Share of pop. carpooling and using public transit: 30.2% — 2nd highest
[in-text-ad-2]
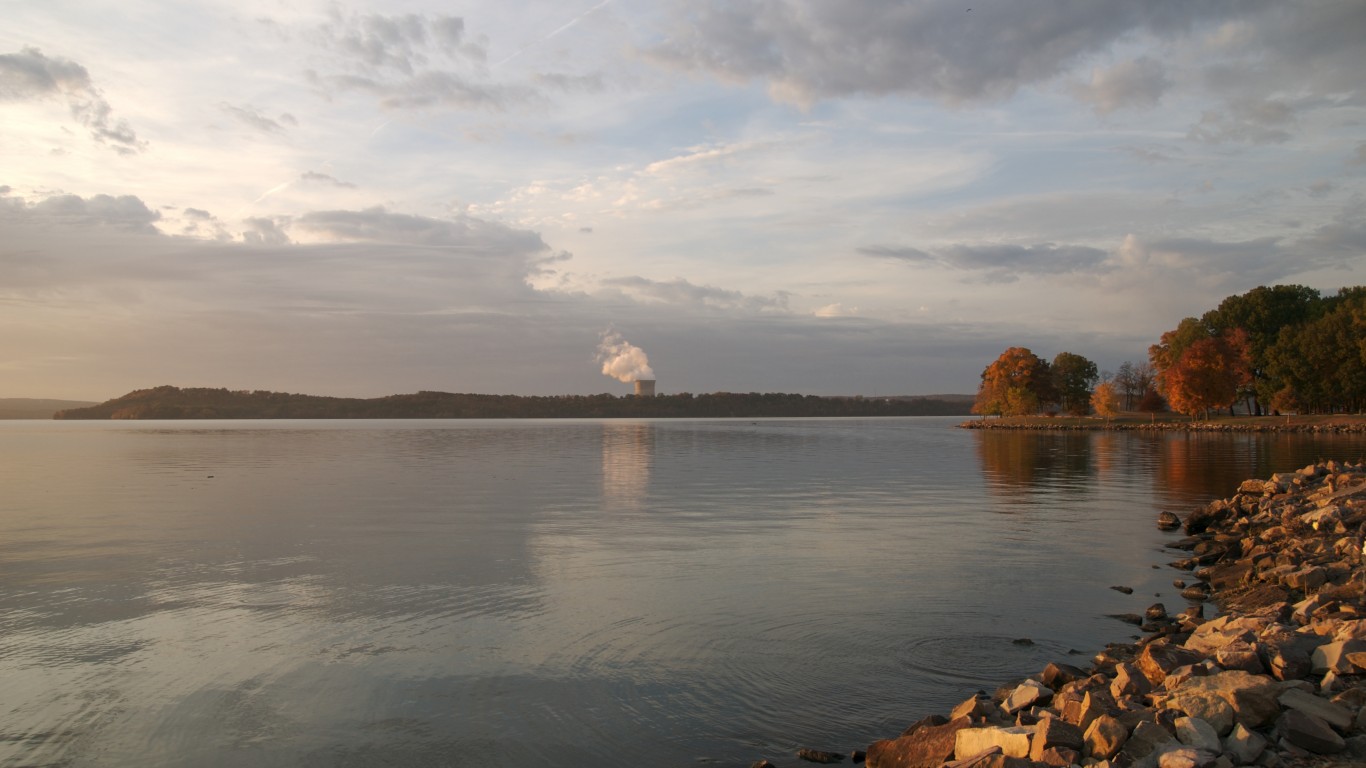
36. Arkansas
> Energy generated from renewable sources in 2018: 6.7% — 24th highest
> Energy generated from fossil fuels: 44.2% — 15th highest
> Green industry employment: 14.5% — 19th lowest (total green jobs: 175,271)
> Avg. annual particle pollution (PM2.5): 10.0 ug/m3 — 9th highest
> Share of pop. with a long commute and driving alone: 26.6% — 13th lowest
> Share of pop. carpooling and using public transit: 16.3% — 7th lowest
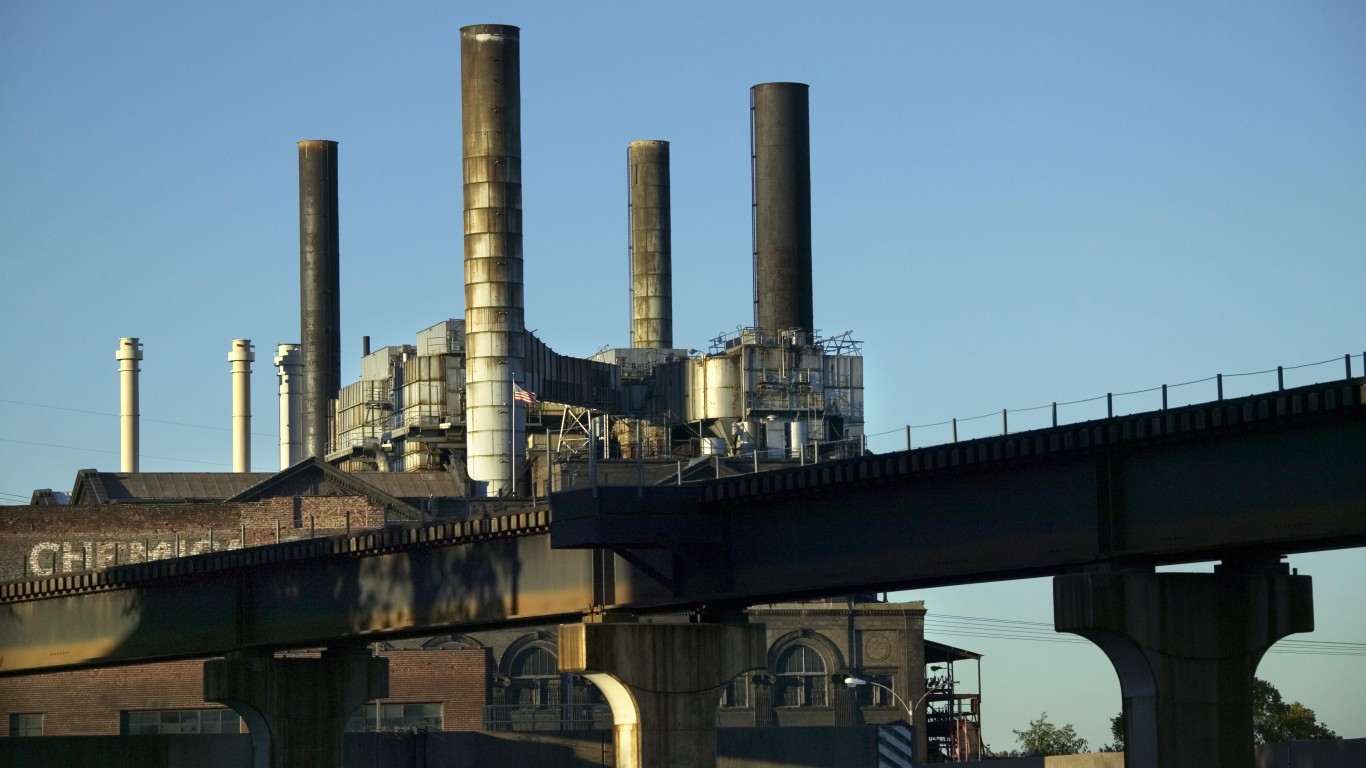
35. Missouri
> Energy generated from renewable sources in 2018: 1.2% — 5th lowest
> Energy generated from fossil fuels: 74.6% — 5th highest
> Green industry employment: 15.7% — 18th highest (total green jobs: 438,745)
> Avg. annual particle pollution (PM2.5): 9.7 ug/m3 — 14th highest
> Share of pop. with a long commute and driving alone: 31.8% — 22nd lowest
> Share of pop. carpooling and using public transit: 16.8% — 11th lowest
[in-text-ad]

34. Illinois
> Energy generated from renewable sources in 2018: 0.3% — 2nd lowest
> Energy generated from fossil fuels: 31.9% — 20th highest
> Green industry employment: 15.8% — 17th highest (total green jobs: 944,514)
> Avg. annual particle pollution (PM2.5): 11.5 ug/m3 — 2nd highest
> Share of pop. with a long commute and driving alone: 41.3% — 7th highest
> Share of pop. carpooling and using public transit: 26.1% — 8th highest
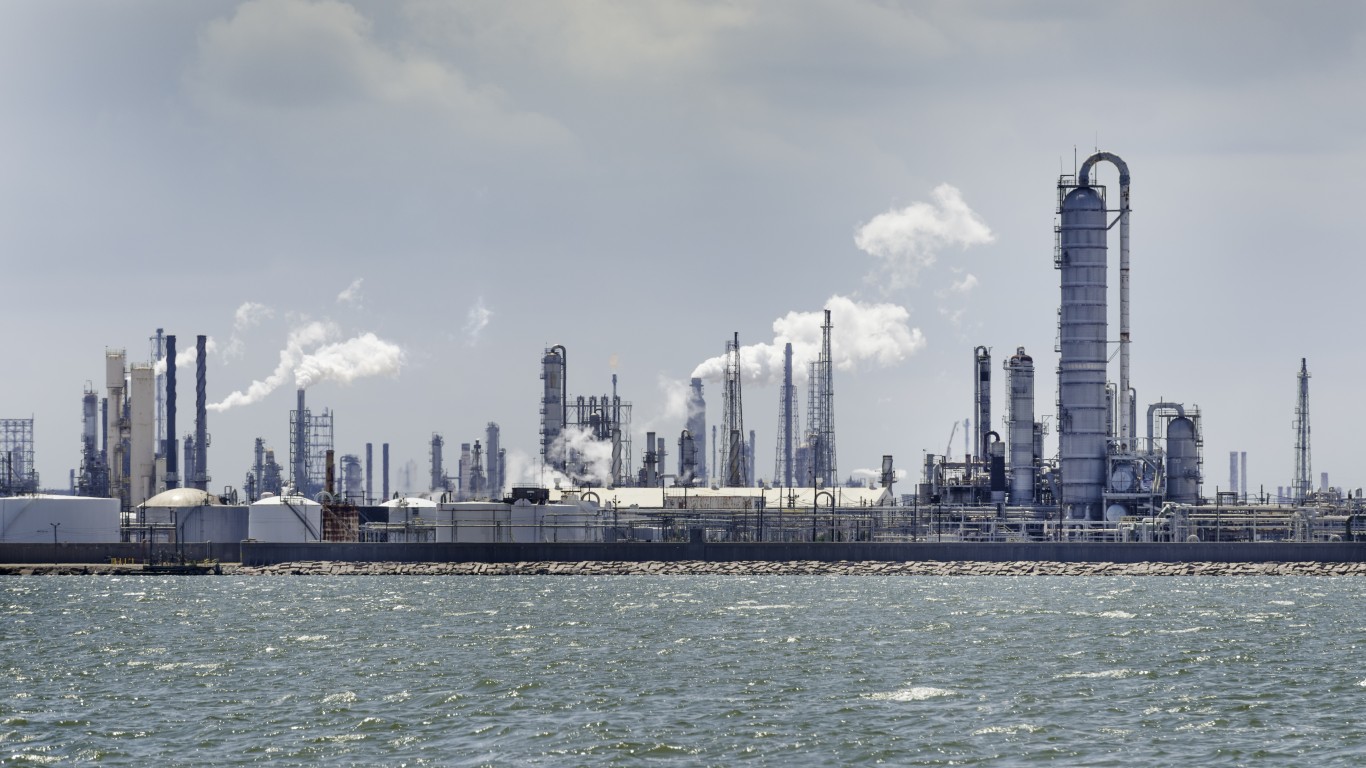
33. Texas
> Energy generated from renewable sources in 2018: 1.2% — 6th lowest
> Energy generated from fossil fuels: 24.0% — 25th highest
> Green industry employment: 15.2% — 24th lowest (total green jobs: 1,869,243)
> Avg. annual particle pollution (PM2.5): 8.8 ug/m3 — 23rd highest
> Share of pop. with a long commute and driving alone: 38.2% — 11th highest
> Share of pop. carpooling and using public transit: 17.9% — 20th lowest

32. New Jersey
> Energy generated from renewable sources in 2018: 2.6% — 10th lowest
> Energy generated from fossil fuels: 2.4% — 10th lowest
> Green industry employment: 14.3% — 18th lowest (total green jobs: 579,858)
> Avg. annual particle pollution (PM2.5): 9.9 ug/m3 — 11th highest
> Share of pop. with a long commute and driving alone: 42.5% — 3rd highest
> Share of pop. carpooling and using public transit: 27.5% — 6th highest
[in-text-ad-2]

31. Florida
> Energy generated from renewable sources in 2018: 3.2% — 16th lowest
> Energy generated from fossil fuels: 13.2% — 17th lowest
> Green industry employment: 13.7% — 14th lowest (total green jobs: 1,189,702)
> Avg. annual particle pollution (PM2.5): 8.2 ug/m3 — 24th lowest
> Share of pop. with a long commute and driving alone: 41.5% — 5th highest
> Share of pop. carpooling and using public transit: 19.3% — 25th highest
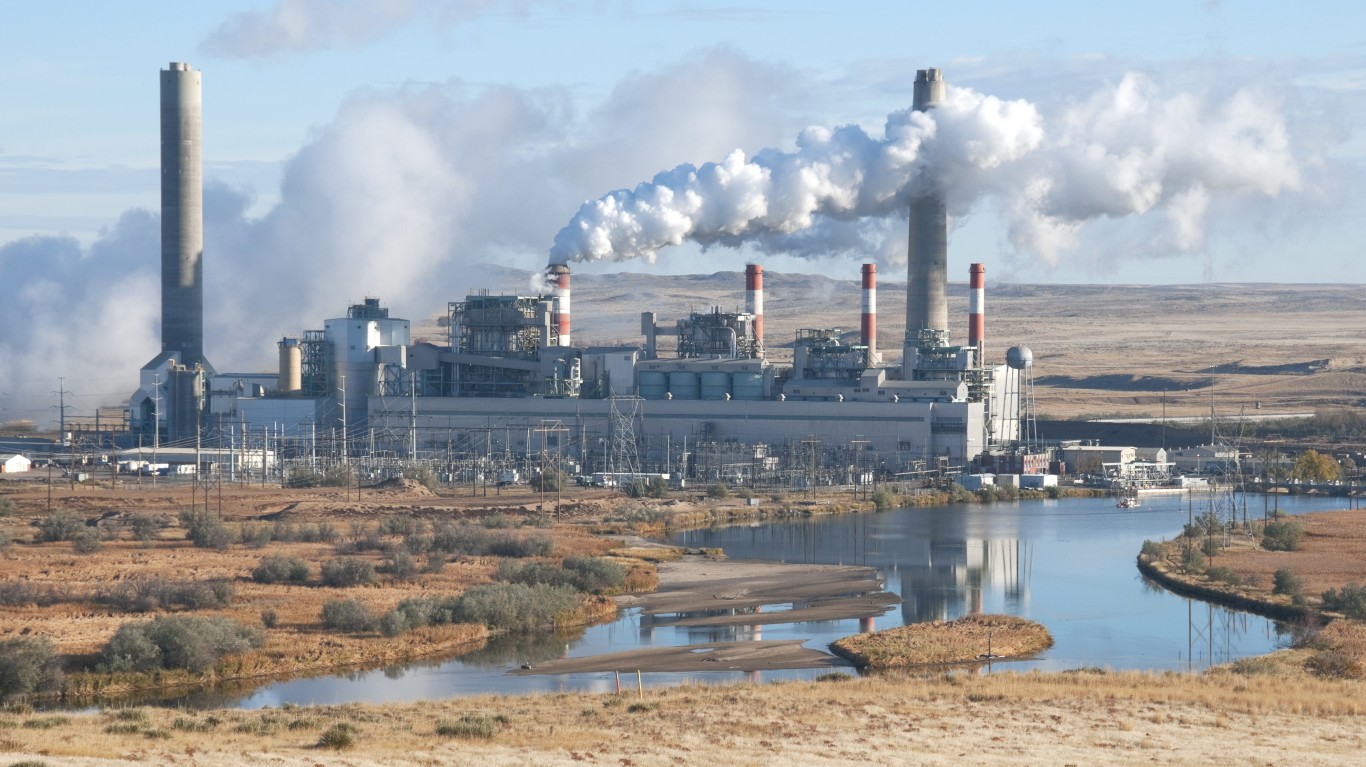
30. Wyoming
> Energy generated from renewable sources in 2018: 2.1% — 9th lowest
> Energy generated from fossil fuels: 87.0% — 2nd highest
> Green industry employment: 12.0% — 6th lowest (total green jobs: 32,700)
> Avg. annual particle pollution (PM2.5): 4.8 ug/m3 — 3rd lowest
> Share of pop. with a long commute and driving alone: 14.7% — 2nd lowest
> Share of pop. carpooling and using public transit: 22.9% — 16th highest
[in-text-ad]
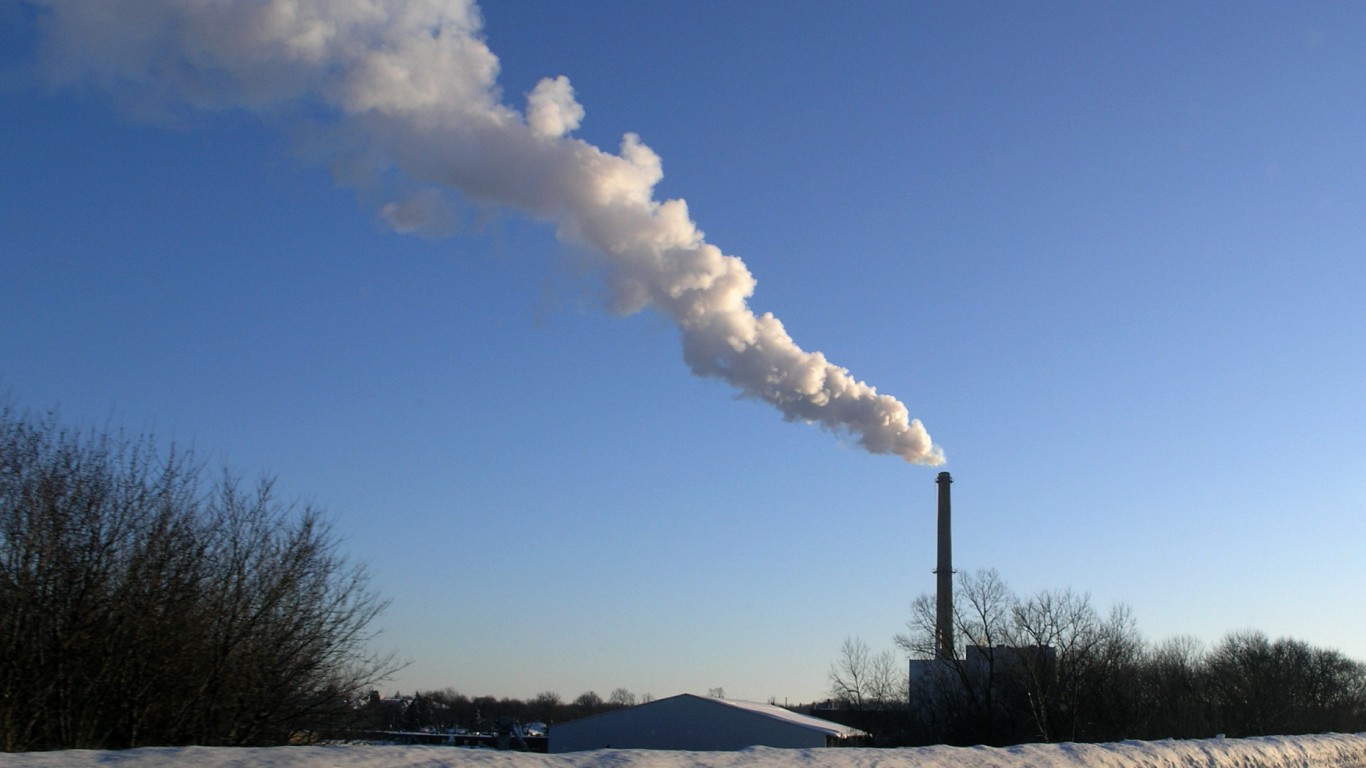
29. Iowa
> Energy generated from renewable sources in 2018: 1.8% — 8th lowest
> Energy generated from fossil fuels: 45.2% — 14th highest
> Green industry employment: 15.0% — 22nd lowest (total green jobs: 232,643)
> Avg. annual particle pollution (PM2.5): 9.0 ug/m3 — 21st highest
> Share of pop. with a long commute and driving alone: 20.2% — 7th lowest
> Share of pop. carpooling and using public transit: 17.6% — 18th lowest

28. Tennessee
> Energy generated from renewable sources in 2018: 14.0% — 13th highest
> Energy generated from fossil fuels: 25.9% — 22nd highest
> Green industry employment: 14.7% — 20th lowest (total green jobs: 438,590)
> Avg. annual particle pollution (PM2.5): 10.0 ug/m3 — 9th highest
> Share of pop. with a long commute and driving alone: 34.8% — 17th highest
> Share of pop. carpooling and using public transit: 15.7% — 4th lowest
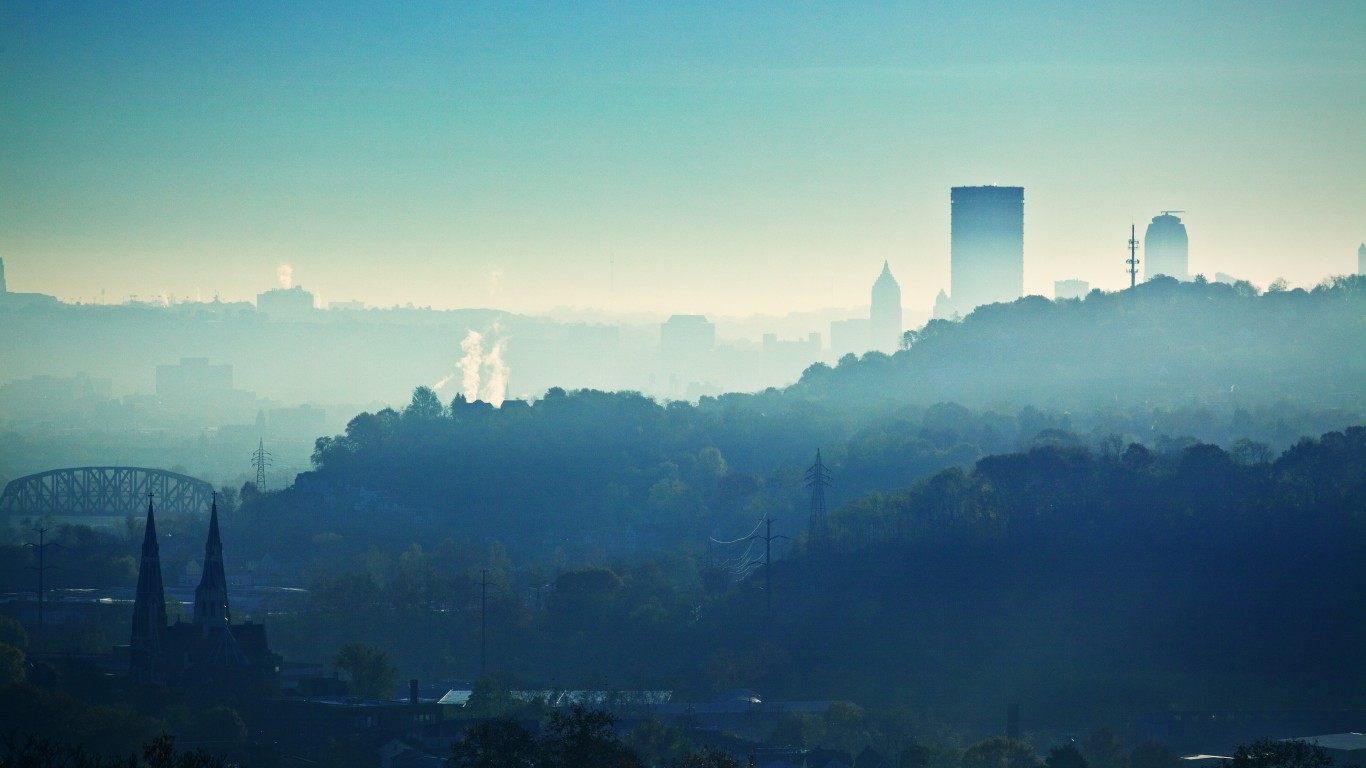
27. Pennsylvania
> Energy generated from renewable sources in 2018: 3.1% — 15th lowest
> Energy generated from fossil fuels: 21.0% — 22nd lowest
> Green industry employment: 16.6% — 11th highest (total green jobs: 976,133)
> Avg. annual particle pollution (PM2.5): 10.6 ug/m3 — 7th highest
> Share of pop. with a long commute and driving alone: 36.9% — 13th highest
> Share of pop. carpooling and using public transit: 23.2% — 15th highest
[in-text-ad-2]
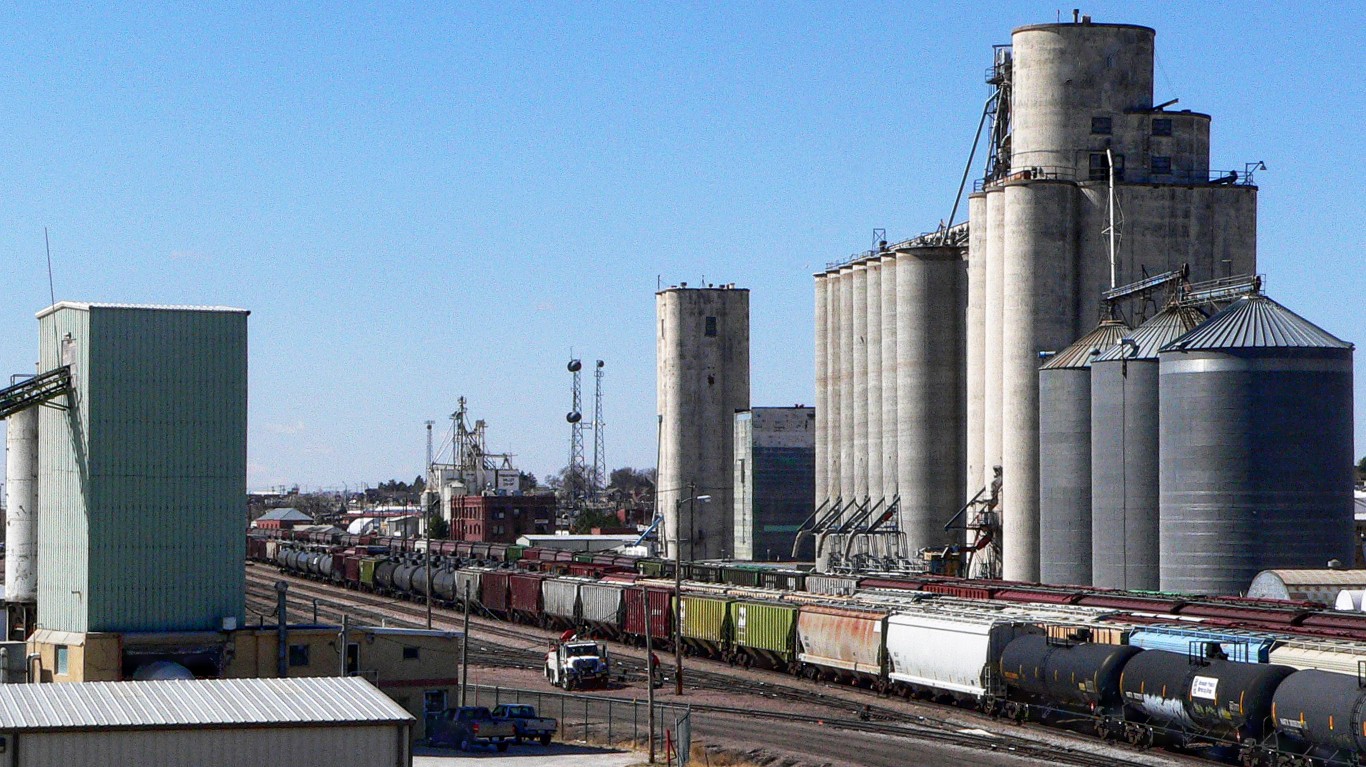
26. Nebraska
> Energy generated from renewable sources in 2018: 4.1% — 20th lowest
> Energy generated from fossil fuels: 63.1% — 9th highest
> Green industry employment: 15.6% — 20th highest (total green jobs: 152,347)
> Avg. annual particle pollution (PM2.5): 7.5 ug/m3 — 19th lowest
> Share of pop. with a long commute and driving alone: 18.4% — 6th lowest
> Share of pop. carpooling and using public transit: 17.2% — 15th lowest

25. North Dakota
> Energy generated from renewable sources in 2018: 7.5% — 21st highest
> Energy generated from fossil fuels: 64.8% — 8th highest
> Green industry employment: 12.7% — 9th lowest (total green jobs: 52,865)
> Avg. annual particle pollution (PM2.5): 5.4 ug/m3 — 5th lowest
> Share of pop. with a long commute and driving alone: 13.5% — the lowest
> Share of pop. carpooling and using public transit: 16.7% — 10th lowest
[in-text-ad]
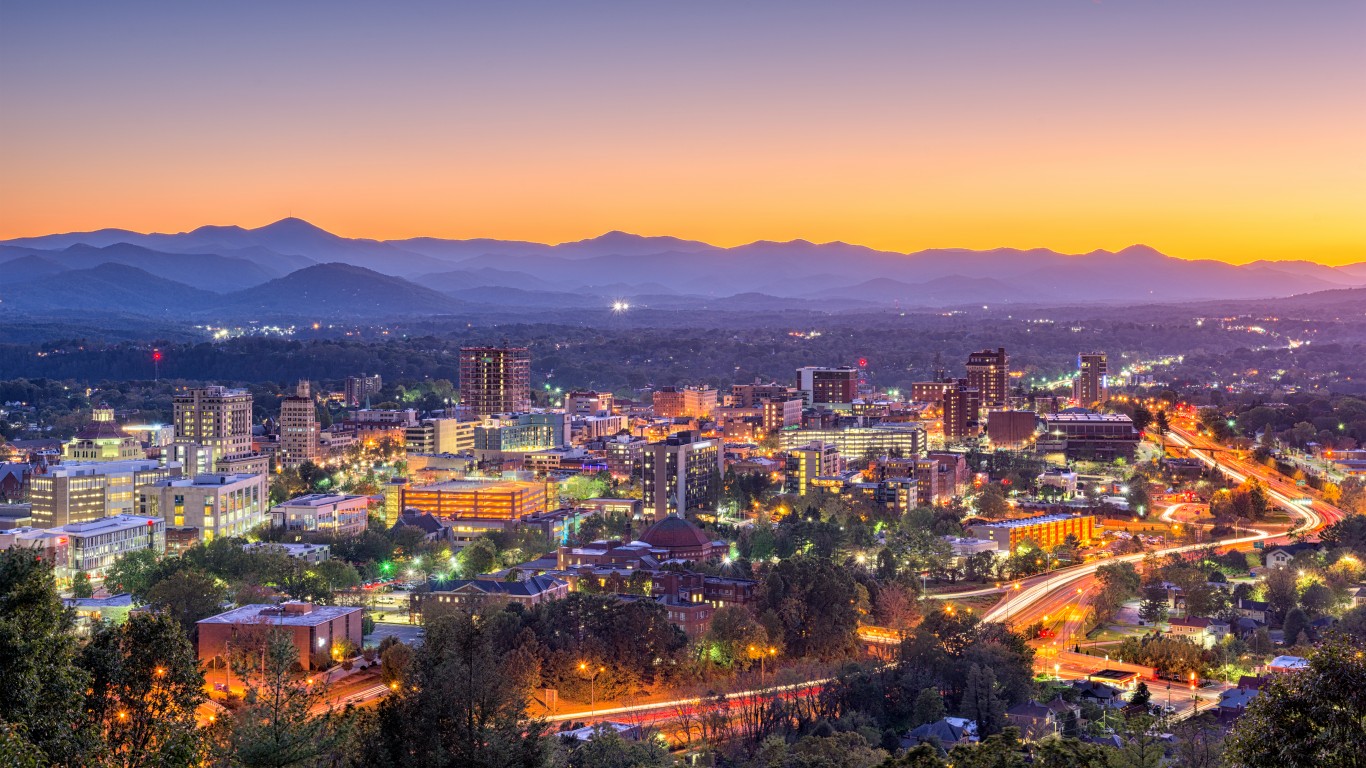
24. North Carolina
> Energy generated from renewable sources in 2018: 11.4% — 15th highest
> Energy generated from fossil fuels: 24.1% — 24th highest
> Green industry employment: 16.3% — 14th highest (total green jobs: 717,828)
> Avg. annual particle pollution (PM2.5): 9.8 ug/m3 — 13th highest
> Share of pop. with a long commute and driving alone: 32.8% — 25th lowest
> Share of pop. carpooling and using public transit: 18.3% — 23rd lowest

23. Wisconsin
> Energy generated from renewable sources in 2018: 5.9% — 24th lowest
> Energy generated from fossil fuels: 50.7% — 10th highest
> Green industry employment: 16.8% — 8th highest (total green jobs: 483,977)
> Avg. annual particle pollution (PM2.5): 8.6 ug/m3 — 24th highest
> Share of pop. with a long commute and driving alone: 27.0% — 14th lowest
> Share of pop. carpooling and using public transit: 17.4% — 17th lowest

22. New Mexico
> Energy generated from renewable sources in 2018: 4.7% — 21st lowest
> Energy generated from fossil fuels: 41.1% — 16th highest
> Green industry employment: 13.4% — 11th lowest (total green jobs: 110,454)
> Avg. annual particle pollution (PM2.5): 5.9 ug/m3 — 9th lowest
> Share of pop. with a long commute and driving alone: 26.1% — 11th lowest
> Share of pop. carpooling and using public transit: 19.8% — 22nd highest
[in-text-ad-2]

21. Nevada
> Energy generated from renewable sources in 2018: 25.5% — 10th highest
> Energy generated from fossil fuels: 6.3% — 13th lowest
> Green industry employment: 10.3% — 2nd lowest (total green jobs: 141,602)
> Avg. annual particle pollution (PM2.5): 6.5 ug/m3 — 12th lowest
> Share of pop. with a long commute and driving alone: 30.6% — 18th lowest
> Share of pop. carpooling and using public transit: 19.6% — 24th highest

20. Virginia
> Energy generated from renewable sources in 2018: 7.0% — 23rd highest
> Energy generated from fossil fuels: 10.7% — 15th lowest
> Green industry employment: 19.7% — 3rd highest (total green jobs: 766,854)
> Avg. annual particle pollution (PM2.5): 8.9 ug/m3 — 22nd highest
> Share of pop. with a long commute and driving alone: 40.2% — 9th highest
> Share of pop. carpooling and using public transit: 21.8% — 18th highest
[in-text-ad]

19. Michigan
> Energy generated from renewable sources in 2018: 3.6% — 18th lowest
> Energy generated from fossil fuels: 39.0% — 18th highest
> Green industry employment: 16.9% — 7th highest (total green jobs: 732,420)
> Avg. annual particle pollution (PM2.5): 8.4 ug/m3 — 25th lowest
> Share of pop. with a long commute and driving alone: 33.3% — 23rd highest
> Share of pop. carpooling and using public transit: 17.2% — 15th lowest

18. New Hampshire
> Energy generated from renewable sources in 2018: 16.0% — 12th highest
> Energy generated from fossil fuels: 4.9% — 11th lowest
> Green industry employment: 15.0% — 21st lowest (total green jobs: 98,665)
> Avg. annual particle pollution (PM2.5): 7.5 ug/m3 — 18th lowest
> Share of pop. with a long commute and driving alone: 38.9% — 10th highest
> Share of pop. carpooling and using public transit: 18.1% — 21st lowest

17. Maryland
> Energy generated from renewable sources in 2018: 8.6% — 19th highest
> Energy generated from fossil fuels: 23.6% — 25th lowest
> Green industry employment: 16.7% — 10th highest (total green jobs: 446,678)
> Avg. annual particle pollution (PM2.5): 9.6 ug/m3 — 15th highest
> Share of pop. with a long commute and driving alone: 49.5% — the highest
> Share of pop. carpooling and using public transit: 24.3% — 9th highest
[in-text-ad-2]

16. Arizona
> Energy generated from renewable sources in 2018: 11.0% — 16th highest
> Energy generated from fossil fuels: 27.5% — 21st highest
> Green industry employment: 13.8% — 15th lowest (total green jobs: 388,623)
> Avg. annual particle pollution (PM2.5): 5.8 ug/m3 — 8th lowest
> Share of pop. with a long commute and driving alone: 35.5% — 15th highest
> Share of pop. carpooling and using public transit: 21.9% — 17th highest

15. Connecticut
> Energy generated from renewable sources in 2018: 3.6% — 17th lowest
> Energy generated from fossil fuels: 1.7% — 5th lowest
> Green industry employment: 15.4% — 22nd highest (total green jobs: 258,460)
> Avg. annual particle pollution (PM2.5): 8.0 ug/m3 — 22nd lowest
> Share of pop. with a long commute and driving alone: 33.7% — 21st highest
> Share of pop. carpooling and using public transit: 21.1% — 21st highest
[in-text-ad]

14. Utah
> Energy generated from renewable sources in 2018: 9.3% — 18th highest
> Energy generated from fossil fuels: 65.9% — 7th highest
> Green industry employment: 15.9% — 16th highest (total green jobs: 235,851)
> Avg. annual particle pollution (PM2.5): 5.6 ug/m3 — 7th lowest
> Share of pop. with a long commute and driving alone: 24.2% — 10th lowest
> Share of pop. carpooling and using public transit: 23.4% — 14th highest

13. Minnesota
> Energy generated from renewable sources in 2018: 6.1% — 25th lowest
> Energy generated from fossil fuels: 38.2% — 19th highest
> Green industry employment: 15.7% — 19th highest (total green jobs: 452,455)
> Avg. annual particle pollution (PM2.5): 6.9 ug/m3 — 14th lowest
> Share of pop. with a long commute and driving alone: 30.9% — 20th lowest
> Share of pop. carpooling and using public transit: 21.4% — 19th highest

12. Rhode Island
> Energy generated from renewable sources in 2018: 2.9% — 14th lowest
> Energy generated from fossil fuels: 0.9% — 3rd lowest
> Green industry employment: 15.3% — 25th highest (total green jobs: 73,794)
> Avg. annual particle pollution (PM2.5): 6.6 ug/m3 — 13th lowest
> Share of pop. with a long commute and driving alone: 32.9% — 25th highest
> Share of pop. carpooling and using public transit: 17.8% — 19th lowest
[in-text-ad-2]

11. Colorado
> Energy generated from renewable sources in 2018: 5.5% — 22nd lowest
> Energy generated from fossil fuels: 47.7% — 13th highest
> Green industry employment: 17.1% — 6th highest (total green jobs: 456,009)
> Avg. annual particle pollution (PM2.5): 5.0 ug/m3 — 4th lowest
> Share of pop. with a long commute and driving alone: 35.5% — 15th highest
> Share of pop. carpooling and using public transit: 24.1% — 12th highest

10. Montana
> Energy generated from renewable sources in 2018: 40.6% — 7th highest
> Energy generated from fossil fuels: 49.0% — 11th highest
> Green industry employment: 14.1% — 17th lowest (total green jobs: 65,451)
> Avg. annual particle pollution (PM2.5): 6.0 ug/m3 — 10th lowest
> Share of pop. with a long commute and driving alone: 15.9% — 4th lowest
> Share of pop. carpooling and using public transit: 24.2% — 11th highest
[in-text-ad]

9. South Dakota
> Energy generated from renewable sources in 2018: 49.7% — 6th highest
> Energy generated from fossil fuels: 18.6% — 20th lowest
> Green industry employment: 12.6% — 8th lowest (total green jobs: 53,941)
> Avg. annual particle pollution (PM2.5): 5.6 ug/m3 — 7th lowest
> Share of pop. with a long commute and driving alone: 14.8% — 3rd lowest
> Share of pop. carpooling and using public transit: 18.2% — 22nd lowest

8. New York
> Energy generated from renewable sources in 2018: 24.2% — 11th highest
> Energy generated from fossil fuels: 1.7% — 7th lowest
> Green industry employment: 16.8% — 9th highest (total green jobs: 1,583,522)
> Avg. annual particle pollution (PM2.5): 8.5 ug/m3 — 25th highest
> Share of pop. with a long commute and driving alone: 38.1% — 12th highest
> Share of pop. carpooling and using public transit: 45.5% — the highest

7. Massachusetts
> Energy generated from renewable sources in 2018: 12.1% — 14th highest
> Energy generated from fossil fuels: 1.7% — 6th lowest
> Green industry employment: 18.0% — 5th highest (total green jobs: 645,736)
> Avg. annual particle pollution (PM2.5): 7.7 ug/m3 — 20th lowest
> Share of pop. with a long commute and driving alone: 43.3% — 2nd highest
> Share of pop. carpooling and using public transit: 29.0% — 3rd highest
[in-text-ad-2]

6. Maine
> Energy generated from renewable sources in 2018: 52.6% — 5th highest
> Energy generated from fossil fuels: 2.3% — 8th lowest
> Green industry employment: 15.2% — 23rd lowest (total green jobs: 93,348)
> Avg. annual particle pollution (PM2.5): 7.4 ug/m3 — 15th lowest
> Share of pop. with a long commute and driving alone: 32.7% — 24th lowest
> Share of pop. carpooling and using public transit: 21.1% — 20th highest

5. California
> Energy generated from renewable sources in 2018: 36.3% — 8th highest
> Energy generated from fossil fuels: 0.9% — 4th lowest
> Green industry employment: 18.7% — 4th highest (total green jobs: 3,249,193)
> Avg. annual particle pollution (PM2.5): 9.5 ug/m3 — 17th highest
> Share of pop. with a long commute and driving alone: 41.2% — 8th highest
> Share of pop. carpooling and using public transit: 24.3% — 10th highest
[in-text-ad]

4. Idaho
> Energy generated from renewable sources in 2018: 66.9% — 3rd highest
> Energy generated from fossil fuels: 0.1% — the lowest
> Green industry employment: 16.6% — 12th highest (total green jobs: 121,100)
> Avg. annual particle pollution (PM2.5): 7.4 ug/m3 — 17th lowest
> Share of pop. with a long commute and driving alone: 22.9% — 9th lowest
> Share of pop. carpooling and using public transit: 19.3% — 25th highest

3. Oregon
> Energy generated from renewable sources in 2018: 58.1% — 4th highest
> Energy generated from fossil fuels: 2.3% — 9th lowest
> Green industry employment: 20.9% — the highest (total green jobs: 401,577)
> Avg. annual particle pollution (PM2.5): 7.9 ug/m3 — 21st lowest
> Share of pop. with a long commute and driving alone: 29.2% — 15th lowest
> Share of pop. carpooling and using public transit: 27.0% — 7th highest

2. Washington
> Energy generated from renewable sources in 2018: 70.8% — 2nd highest
> Energy generated from fossil fuels: 5.0% — 12th lowest
> Green industry employment: 19.7% — 2nd highest (total green jobs: 666,453)
> Avg. annual particle pollution (PM2.5): 7.4 ug/m3 — 17th lowest
> Share of pop. with a long commute and driving alone: 36.6% — 14th highest
> Share of pop. carpooling and using public transit: 27.8% — 5th highest
[in-text-ad-2]

1. Vermont
> Energy generated from renewable sources in 2018: 82.7% — the highest
> Energy generated from fossil fuels: 0.1% — 2nd lowest
> Green industry employment: 13.8% — 16th lowest (total green jobs: 42,941)
> Avg. annual particle pollution (PM2.5): 6.5 ug/m3 — 12th lowest
> Share of pop. with a long commute and driving alone: 30.8% — 19th lowest
> Share of pop. carpooling and using public transit: 23.9% — 13th highest
Methodology
To determine the most eco-friendly states, 24/7 Tempo created an index consisting of measures of energy use and pollution. States rank as more eco-friendly if a larger share of electricity generated in the state comes from renewable sources, if the state has a relatively strict set of policies related to energy efficiency, if air pollution levels are relatively low, and if a relatively high share of jobs are in industries considered to be green. States were penalized for having a high share of total electricity generated from oil, coal, or natural gas combustion.
Electricity generation by source is for 2018 and comes from the U.S. Energy Information Administration.
Each state’s energy efficiency policy score came from the 2019 State Energy Efficiency Scorecard by the American Council for an Energy-Efficient Economy, a nonprofit advocacy group. The scoreboard measures state and regional policy on transportation, utility, buildings, and other energy efficiency standards.
Average daily density of fine particulate matter data, measured in micrograms per cubic meter, is from County Health Rankings & Roadmaps, a Robert Wood Johnson Foundation and University of Wisconsin Population Health Institute joint program, and is for 2018.
The share of jobs in green industry employment by state comes from the U.S. Bureau of Labor Statistics’ Quarterly Census of Employment and Wages, and is for 2018.
Data on the most polluted county in every state is from American Lung Association’s “State of the Air 2020” report, which was released on April 21, 2020 and covers the period of 2016-2018.
Thank you for reading! Have some feedback for us?
Contact the 24/7 Wall St. editorial team.
 24/7 Wall St.
 24/7 Wall St.
 24/7 Wall St.
 24/7 Wall St.
 24/7 Wall St.
 24/7 Wall St.
