Social distancing, shelter-in-place orders, and the shuttering of nonessential businesses across the country have changed day-to-day realities for millions of Americans. In the effort to contain the spread of the coronavirus, few aspects of life in the United States remained untouched — and consumer behavior is no exception.
24/7 Wall St. reviewed media reports and press releases related to consumer spending to determine how the COVID-19 pandemic is changing what Americans are buying. To illustrate the significance of these changes, we attempted to calculate what they could mean at an individual level.
Our research encompasses varying levels of specificity — from particular companies to entire product categories and industries. While broad in scope, this list is by no means exhaustive.
Consumer spending comprises a staggering 70% of U.S. GDP, and not surprisingly, virus containment efforts have devastated many sectors of the economy. Companies in travel and food services have been hit especially hard, with several industries and well-known companies ranking on this list with double-digit year-over-year sales declines. Here is a list of the U.S. industries being devastated by the coronavirus.
However, not all businesses have suffered in recent weeks. As many are effectively confined to their homes, products and services designed to pass the time have seen sales skyrocket. Here is a look at what you can do to make staying at home easier.
Click here to see how coronavirus is changing what Americans are buying
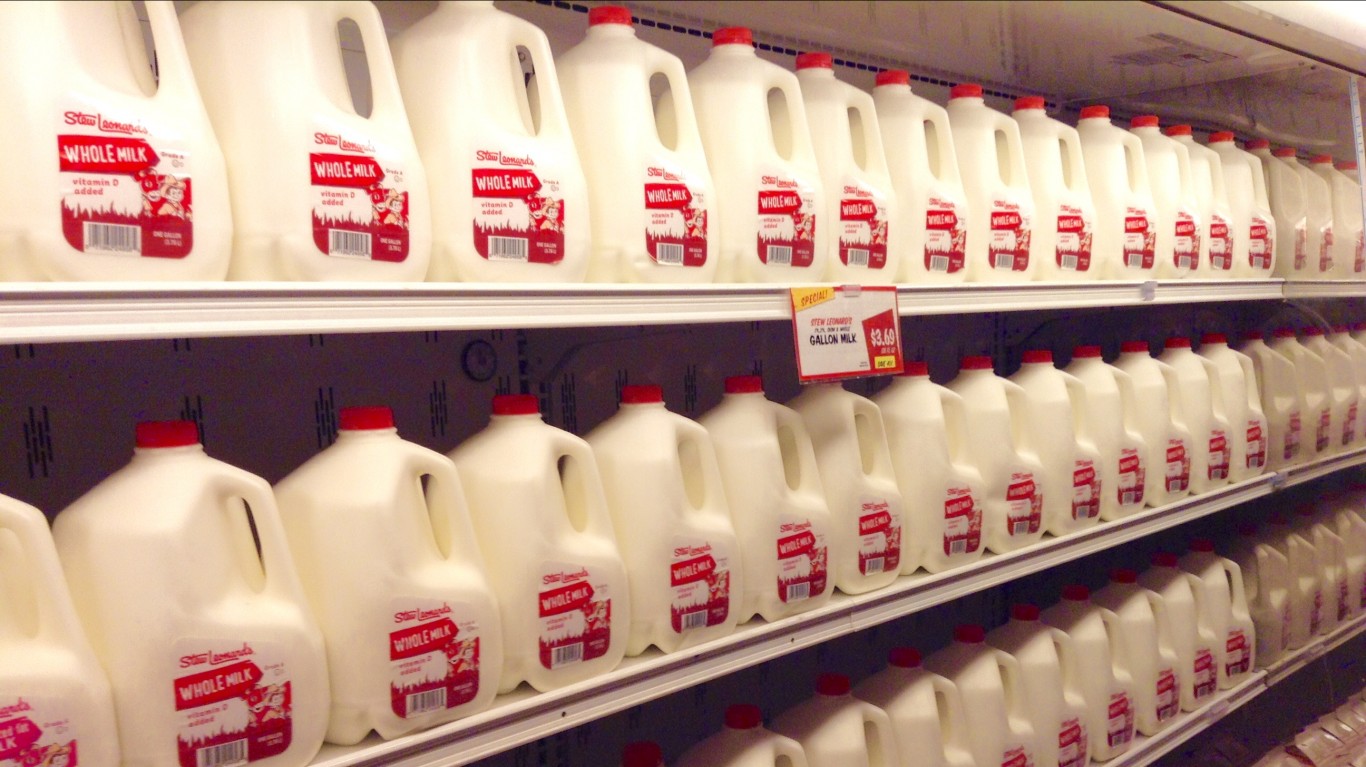
1. Milk
> Change in sales: 47.5% increase
> Period: YoY, final week of March
> What it means: 3 more glasses of milk weekly per capita
According to the U.S. Department of Agriculture, Americans consume 146 pounds of milk per capita annually, or about 275 cups of milk per year, or about five cups of milk per week. If sustained, the recent surge in demand for milk would mean Americans have increased their consumption of milk to about eight cups per week.
[in-text-ad]

2. McDonald’s
> Change in sales: 13.4% decline
> Period: YoY, March
> What it means: 6 fewer hamburgers per fast-food fan annually
In a given year, Americans consume an estimated 1 billion pounds of beef from McDonalds — the equivalent of 4 billion quarter-pounder hamburgers. Spread across the 91.4 million American adults who eat fast-food on a daily basis, this comes out to about 44 quarter-pounder sandwiches per year.
McDonald’s reported a 13.4% decline in sales at American restaurants in March 2020 compared to March 2019. Applied to the amount of beef McDonald’s dishes out annually, this is equivalent to about 6 fewer quarter pounder hamburgers per fast-food fan annually.

3. Walmart
> Change in sales: 20% increase
> Period: YoY, March
> What it means: 2.6 more visits to Walmart per American annually
An estimated 140 million Americans shop at Walmart every week. According to one estimate, Wal Mart gets 4.4 billion visits per year — or about 13 visits per American every year. According to a Wall Street Journal report, Walmart sales surged by 20% year over year in March as Americans stocked up on household items, groceries, and appliances — items in these categories are also on this list. The surge, applied to per capita annual visits, means Americans will shop at Walmart 15.6 times per year on average.

4. Video games
> Change in sales: 65% increase
> Period: YoY, mid-March
> What it means: 5 new video games purchased per gamer
As the vast majority of Americans are confined to their homes in an effort to contain the coronavirus, video game sales have soared. Consumer spending on video games jumped 65% in mid-March from the same period last year. The U.S. video game industry generates over $40 billion per year, which, assuming an average cost of about $30 per game, comes to 1.3 billion titles sold, or roughly 8 for each of the over 164 million adults in the United States who play video games.
If video game title sales increased proportionally to the money spent on games, the higher spending would translate to roughly five new games purchased per year per gamer.
[in-text-ad-2]

5. Gasoline
> Change in sales: 30% decline
> Period: YoY, last week in March
> What it means: 10 fewer trips to the pump each year
There were nearly 227.6 million licensed drivers in the United States in 2018, and they drove a total of over 3.2 trillion miles that year, or about 14,200 miles per driver. Assuming a fuel economy of 30 miles per gallon and a 15 gallon gas tank, that amounts to approximately 31 trips to the pump per driver per year.
As the country shut down in an effort to contain the coronavirus, demand for gasoline tanked by 30% year over year in the week ending on March 27. At an annualized rate, this translates to about 4,300 fewer vehicle miles traveled per driver, or roughly 10 fewer trips to the pump.

6. Puzzles
> Change in sales: 370% increase
> Period: YoY, last two weeks in March
> What it means: Puzzle lovers are doing 4 more puzzles than usual annually
As hundreds of millions of Americans are being urged or ordered to shelter in place, jigsaw puzzle sales have skyrocketed. One company, Ravensburger, the world’s largest maker of puzzles, reported a 370% increase in year-over-year sales in the last two weeks of March. Last year, the company reportedly sold puzzles at a rate of seven games per minute in North America. So far this year, the average rate is just shy of 20 puzzles per minute.
A recent survey revealed that about half of all American adults complete at least one jigsaw puzzle per year. If concentrated among puzzle lovers, this sales increase could suggest that about 122 million American adults are now doing almost five puzzles per year rather than one.
[in-text-ad]

7. Beer
> Change in sales: 42% increase
> Period: YoY, third week of March
> What it means: 6 more pints per week among beer drinkers
Nearly 160 million Americans adults drink alcohol, and beer is the beverage of choice for 43% of them. Americans consumed an estimated 6.3 billion gallons of beer in 2018, or about 14 pints a week for every adult who prefers beer. According to data from Nielsen, a research company, beer sales jumped a staggering 42% in the third week of March, right after stay-at-home orders went in effect across much of the country. This would suggest that beer lovers are drinking the equivalent of six additional pints of beer per week, a total of 20.
It is important to note, however, that the following week, beer sales growth leveled somewhat, climbing by only about 13% over the same week in 2019.

8. Fitness equipment
> Change in sales: 535% increase
> Period: February 2020 to March 2020
> What it means: $170 more in home fitness equipment spending per household
Americans spend $3.86 billion on home fitness equipment in a year — that’s about $32 per household every year. From February to March 2020, online sales of home fitness equipment jumped by a staggering 535%. At an annual rate, this comes out to $24.51 billion on fitness equipment, or $202 per American household — about $170 more than usual.

9. Airline tickets
> Change in sales: 96% decline
> Period: YoY, April 8
> What it means: About 3 fewer flights per person annually on avg.
Under normal circumstances, every day in the United States, some 2.7 million airline passengers board more than 44,000 flights, according to FAA data. In total, nearly 986 million tickets are sold per year, or about three per American citizen. However, as nonessential travel has all but ground to a halt in the United States, the Transportation Security Administration reported a 96% decline in security screenings at American airports in early April compared to the previous year. At an annualized rate, this reduces airline ticket sales per capita from about three to just 0.1.
[in-text-ad-2]

10. Hand sanitizer
> Change in sales: 470% increase
> Period: YoY, first week of March
> What it means: 5 additional bottles of hand sanitizer per household annually
The parent company of Purell, the most popular brand of hand sanitizer in the United States, reported $370 million in sales in 2018. With an eight ounce bottle of Purell hand sanitizer selling for about $2.99, this is equal to about 123.7 million bottles of hand sanitizer per year — or about one per household.
As the coronavirus spread across the country, hand sanitizer sales spiked by 470%. This increase, applied to annual Purell sales, means Americans are buying 705 million bottles of hand sanitizer annually — or 6 about per household.

11. Television and streaming services
> Change in sales: 20% increase
> Period: Mid-March over previous 4-week avg.
> What it means: Americans are watching an avg. of 71 min. more per day
According to a 2018 report from Neilsen, American adults spend an average of five hours and 57 minutes watching TV and video content. As Americans have become increasingly confined to their homes in the wake of the coronavirus pandemic, TV and video streaming have predictably gone up — by some estimates, by over 20% in the four weeks starting in mid-March compared to the previous four-week average. Applying this increase to the average time spent watching TV means American adults are now glued to their screens for over seven hours a day.
Increases vary by platform. HBO NOW is reporting a 40% increase in mid-March compared to its four week average. Roku has also reported a 49% increase in steaming on its platform in Q1.
[in-text-ad]

12. Starbucks
> Change in sales: 60%-70% decline
> Period: YoY, last week in March
> What it means: 2 fewer cups for coffee drinkers
In normal circumstances, an estimated 60% of American coffee drinkers go to a branded coffee shop, like Starbucks, at least once a month. These are not normal times, however. Starbucks reported a 60% to 70% decline in sales in the final week of March 2020 compared to the same week the previous year.
The average American consumes 3.1 cups of coffee per day. Applied to the average coffee consumption per capita, Starbucks sales decline translates to about two fewer cups per coffee drinker, on average.

13. Frozen cookie dough
> Change in sales: 454% increase
> Period: YoY, first week of April
> What it means: 1,094 more cookies eaten per person in 2020
Sales of frozen cookie dough spiked in the United States by a staggering 454% year over year in the week ending April 5. According to a 2015 poll, Americans consume an average of 18,928 cookies over the course of their lifetime. Applying the sales increase in frozen cookie dough to lifetime cookie consumption in the United States, this means American adults now eat a total of 104,681 cookies — or an additional 85,933 cookies — over the course of their life, equal to 1,094 more cookies per year, based on average life expectancy at birth.

14. Frozen pizza
> Change in sales: 92% increase
> Period: YoY, March
> What it means: 8 more frozen pizzas annually per household
In a typical year, Americans consume about 1 billion frozen pizzas — or about eight pizzas per household. But 2020 is not a typical year. Americans have been stocking up on nonperishable foods, and frozen pizza has proved to be particularly popular, with sales climbing 92% year over year in March. At an annualized rate, this means each household is consuming about 16 frozen pizzas per year — eight more than usual.
[in-text-ad-2]

15. Subway
> Change in sales: 40%-80% decline
> Period: YoY, in March
> What it means: 2 to 4 fewer footlong subs per capita annually
The Subway restaurant franchise reported about $11.3 billion in sales in the United States in 2016 — equal to about $32 per person. Recently, store owners have had trouble selling sandwiches, with franchisees reporting anywhere from a 40% to 80% decline in sales over several days at the end of March 2020.
At an annualized per capita rate, this means Americans are spending about $14 to $27 less per year on Subway sandwiches — or anywhere from about two to four fewer footlongs per year.

16. Firearms
> Change in sales: 80% increase
> Period: YoY, March
> What it means: 14.4 million more gun-owners over a year
Last year, an estimated 30% of American adults — or nearly 98.9 million people — owned a gun. As the coronavirus spread across the United States, gun and ammunition sales surged. Sales were driven largely by fears of social breakdown in the wake of the virus. By some estimates, Americans bought 2.4 million firearms in March 2020 alone, an 80% increase from the previous year.
Anecdotally, many of those sales were to first time buyers. Assuming a conservative estimate, that half of all March gun sales were to first time buyers, there are now about 1.2 million new gun owners in the United States. At an annualized rate, this means 14.4 million more gun owners — which would drive up the national gun ownership rate by nearly 15%.
[in-text-ad]

17. Freezers
> Change in sales: As high as 500% increase
> Period: YoY, Q1
> What it means: 1-in-10 households purchase a freezer in 2020
As Americans are trying to reduce social interaction and going to public spaces, it has become prudent to reduce the frequency of trips to the grocery store — and freezers are a great way to lengthen the shelf life of perishable products like bread, meat, and vegetables. Big box retailers like Best Buy, Home Depot, and Lowe’s have noted the spike in demand for freezers, with some local operations reporting sales surges as high as 500%.
Annualizing this increase and applying it to the 2 million freezers sold in the United States in 2019 would mean freezer sales would exceed 12 million in 2020 — or about one for every 10 households. Last year, freezer sales totaled about one for every 60 households. According to a Consumer Reports survey of major retailers, freezers could be out of stock until late as August.

18. Amazon
> Change in sales: 23% increase
> Period: YoY, Q1
> What it means: 13 more items sold annually per Amazon Prime customer
Amazon reported $170 billion in sales in North America in 2019, which, assuming a $30 average item cost, amounts to 57 packages sold per year for each of the 100 million Amazon Prime customers in the U.S.
According to some analyst projections, Amazon sales are expected to spike 23% in the first quarter of 2020 as Americans are more leery of venturing out of their home to shop. That comes to roughly 13 new packages sold per prime customer per year.
[in-text-ad-2]

19. Toilet paper
> Change in sales: 123% increase
> Period: YoY, last week of march
> What it means: 3 to 5 more rolls of toilet paper every 2 weeks per person
Toilet paper sales received more press coverage than sales of perhaps every other consumer product ahead of COVID-19-related shelter-in-place orders. Americans bought a staggering $1.4 billion worth of toilet paper in the first three weeks of March. In the last week of March, toilet paper sales were up 123% from the previous year.
According to some estimates, a two-person household uses anywhere from five to nine rolls of toilet paper every two weeks. This increase in sales suggests that a two-person household is buying the equivalent of anywhere from 11 to 20 rolls for a two week period, equal to 3 to 5 more rolls per person every two weeks. Assuming usage rates are remaining somewhat steady, anywhere from six to 11 of those rolls are being stockpiled.
100 Million Americans Are Missing This Crucial Retirement Tool
The thought of burdening your family with a financial disaster is most Americans’ nightmare. However, recent studies show that over 100 million Americans still don’t have proper life insurance in the event they pass away.
Life insurance can bring peace of mind – ensuring your loved ones are safeguarded against unforeseen expenses and debts. With premiums often lower than expected and a variety of plans tailored to different life stages and health conditions, securing a policy is more accessible than ever.
A quick, no-obligation quote can provide valuable insight into what’s available and what might best suit your family’s needs. Life insurance is a simple step you can take today to help secure peace of mind for your loved ones tomorrow.
Click here to learn how to get a quote in just a few minutes.
Thank you for reading! Have some feedback for us?
Contact the 24/7 Wall St. editorial team.

 24/7 Wall St.


