Special Report
How COVID-19 Is Being Underreported in Most States

Published:
Last Updated:

The United States is approaching 100,000 confirmed COVID-19 deaths, which is by far the most of any nation and more than one-quarter of all confirmed global deaths from the disease. As steep as the U.S. death toll is, it is likely under reported, and the actual COVID-19 death toll is estimated to be much higher.
To assess the impact the pandemic has had so far on mortality nationwide, The Centers for Disease Control and Prevention released a report on the number of excess deaths nationwide and in each state. The report compares the observed numbers of deaths each week this year to the numbers of expected deaths for that week based on historical trends. Nationwide, 88,400 more Americans than expected died from March 1, 2020, through May 9 — about 12,100 more than the COVID-19 reported death toll during that period.
The medical community has several plausible explanations for this discrepancy, including under testing, the failure to attribute some home deaths to COVID-19, and misdiagnosis of COVID-19 as other respiratory diseases such as pneumonia and the flu. It is also likely that in the hardest-hit states more Americans than expected are dying from other causes. The additional stresses on the population, the medical system, and the economy caused by the pandemic are likely also contributing to higher than expected deaths from non-COVID-19 causes.
24/7 Wall St. reviewed the number of excess deaths as reported by the CDC that occurred from Mar. 1 to May 9, 2020, in each state (except for Connecticut and North Carolina, where data is more limited) and compared it to the state’s reported number of COVID-19 deaths over the same period.
In some states there have been no excess deaths once confirmed COVID-19 deaths are accounted for. In many states, however, the number of excess deaths surpasses the reported number of COVID-19 deaths by hundreds, and in some cases, thousands.
Generally, the states with the most excess deaths since March 1 after accounting for confirmed COVID-19 deaths already have among the highest reported COVID-19 cases and deaths per capita. States like New York, Pennsylvania, and New Jersey, which are among the top 10 states with the highest number of COVID-19 cases, have thousands of unaccounted for excess deaths each.
However, there are also states with high numbers of excess deaths above the COVID-19 reported deaths that do not rank among the top 10 states for reported COVID-19 deaths, including Texas, Virginia, and South Carolina. All three of those states had among the fewest COVID-19 tests performed per capita as of mid-May.
“COVID-19 is massively under reported in the country and all around the world,” Mark Siedner, associate professor of infectious diseases at Harvard University told 24/7 Wall St. Siedner attributed this underreporting to the ongoing shortage in testing as well as to the fact that many people are asymptomatic but have the disease. While most of the under reporting occurs among people who recover, Siedner explained, there is also a significant number of unreported cases in patients who die. Those who die without getting tested are generally not counted as COVID-19 related deaths.
Click here to see how COVID-19 is being underreported in most states
Click here to read our methodology
Alabama
> Total excess deaths, Mar. 1 to May 9: 468 — 24th most (4.3% more than expected)
> Confirmed COVID-19 deaths, Mar. 1 to May 9: 385 — 25th most (82.3% of excess deaths)
> Excess deaths excluding confirmed COVID-19 deaths, Mar. 1 to May 9: 83 — 20th fewest (17.7% of excess deaths)
> Testing rate as of May 18: 3,199 per 100,000 residents — 24th fewest
> Positive test rate as of May 18: 7.7% — 25th highest
> Population density: 93.2 persons per square mile — 25th most
[in-text-ad]
Alaska
> Total excess deaths, Mar. 1 to May 9: 56 — 4th fewest (6.5% more than expected)
> Confirmed COVID-19 deaths, Mar. 1 to May 9: 10 — 2nd fewest (17.9% of excess deaths)
> Excess deaths excluding confirmed COVID-19 deaths, Mar. 1 to May 9: 46 — 6th fewest (82.1% of excess deaths)
> Testing rate as of May 18: 4,829 per 100,000 residents — 11th most
> Positive test rate as of May 18: 1.1% — the lowest
> Population density: 1.1 persons per square mile — the fewest
Arizona
> Total excess deaths, Mar. 1 to May 9: 1,201 — 17th most (8.7% more than expected)
> Confirmed COVID-19 deaths, Mar. 1 to May 9: 532 — 20th most (44.3% of excess deaths)
> Excess deaths excluding confirmed COVID-19 deaths, Mar. 1 to May 9: 669 — 12th most (55.7% of excess deaths)
> Testing rate as of May 18: 2,831 per 100,000 residents — 19th fewest
> Positive test rate as of May 18: 6.9% — 22nd lowest
> Population density: 62.9 persons per square mile — 19th fewest
Arkansas
> Total excess deaths, Mar. 1 to May 9: 223 — 18th fewest (3.4% more than expected)
> Confirmed COVID-19 deaths, Mar. 1 to May 9: 88 — 12th fewest (39.5% of excess deaths)
> Excess deaths excluding confirmed COVID-19 deaths, Mar. 1 to May 9: 135 — 27th most (60.5% of excess deaths)
> Testing rate as of May 18: 2,907 per 100,000 residents — 20th fewest
> Positive test rate as of May 18: 5.5% — 15th lowest
> Population density: 56.7 persons per square mile — 17th fewest
[in-text-ad-2]

California
> Total excess deaths, Mar. 1 to May 9: 3,307 — 8th most (5.9% more than expected)
> Confirmed COVID-19 deaths, Mar. 1 to May 9: 2,630 — 7th most (79.5% of excess deaths)
> Excess deaths excluding confirmed COVID-19 deaths, Mar. 1 to May 9: 677 — 11th most (20.5% of excess deaths)
> Testing rate as of May 18: 3,123 per 100,000 residents — 22nd fewest
> Positive test rate as of May 18: 6.4% — 16th lowest
> Population density: 241.7 persons per square mile — 11th most

Colorado
> Total excess deaths, Mar. 1 to May 9: 1,568 — 15th most (16.4% more than expected)
> Confirmed COVID-19 deaths, Mar. 1 to May 9: 967 — 16th most (61.7% of excess deaths)
> Excess deaths excluding confirmed COVID-19 deaths, Mar. 1 to May 9: 601 — 13th most (38.3% of excess deaths)
> Testing rate as of May 18: 2,268 per 100,000 residents — 2nd fewest
> Positive test rate as of May 18: 17.2% — 8th highest
> Population density: 54.7 persons per square mile — 14th fewest
[in-text-ad]
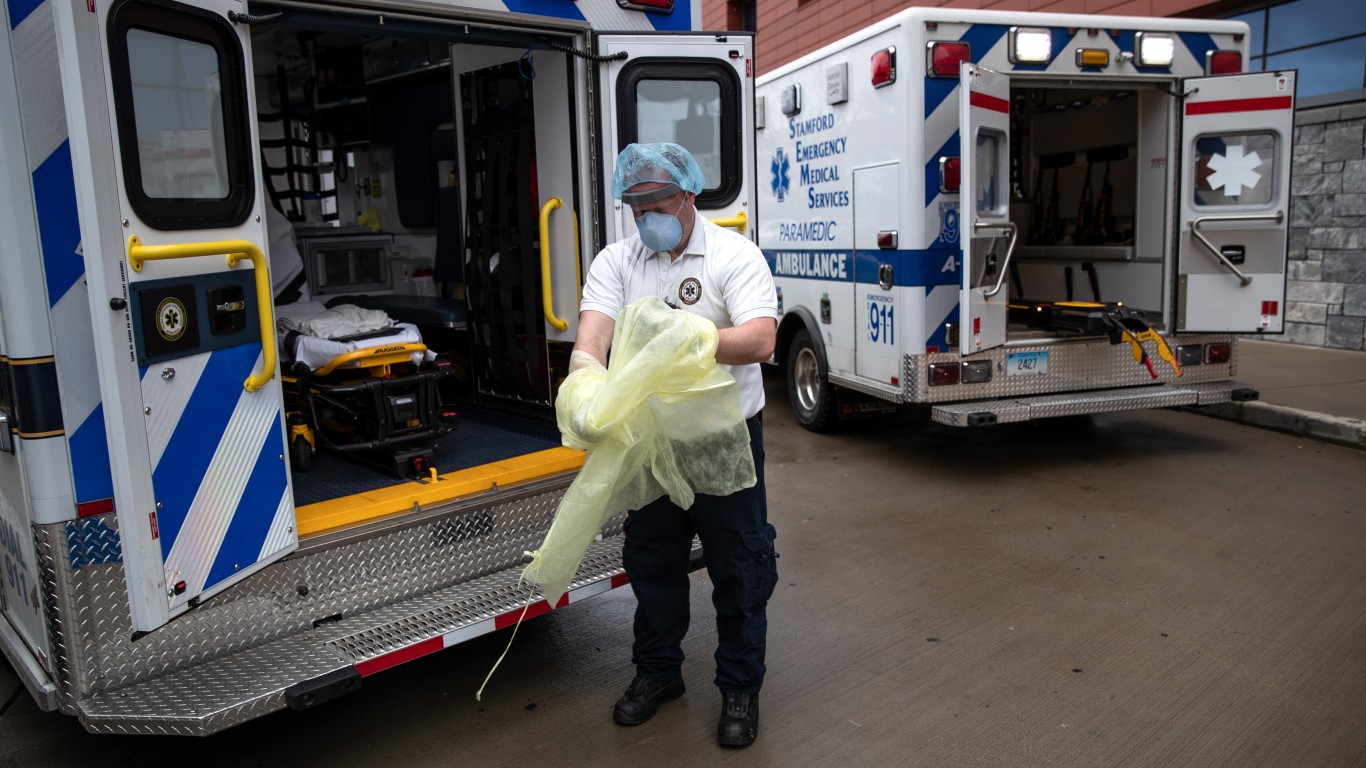
Connecticut
> Total excess deaths, Apr. 5 to Apr. 25: none
> Confirmed COVID-19 deaths, Apr. 5 to Apr. 25: 1,673 — 10th most
> Excess deaths excluding confirmed COVID-19 deaths, Apr. 5 to Apr. 25: none
> Testing rate as of May 18: 4,973 per 100,000 residents — 10th most
> Positive test rate as of May 18: 21.5 — 3rd highest
> Population density: 644.5 persons per square mile — 4th most
Delaware
> Total excess deaths, Mar. 1 to May 9: 260 — 22nd fewest (12.4% more than expected)
> Confirmed COVID-19 deaths, Mar. 1 to May 9: 221 — 18th fewest (85.0% of excess deaths)
> Excess deaths excluding confirmed COVID-19 deaths, Mar. 1 to May 9: 39 — 3rd fewest (15.0% of excess deaths)
> Testing rate as of May 18: 4,390 per 100,000 residents — 13th most
> Positive test rate as of May 18: 18.5% — 6th highest
> Population density: 388.6 persons per square mile — 6th most

Florida
> Total excess deaths, Mar. 1 to May 9: 2,132 — 11th most (4.8% more than expected)
> Confirmed COVID-19 deaths, Mar. 1 to May 9: 1,715 — 9th most (80.4% of excess deaths)
> Excess deaths excluding confirmed COVID-19 deaths, Mar. 1 to May 9: 417 — 16th most (19.6% of excess deaths)
> Testing rate as of May 18: 3,182 per 100,000 residents — 23rd fewest
> Positive test rate as of May 18: 6.9% — 21st lowest
> Population density: 323.9 persons per square mile — 8th most
[in-text-ad-2]
Georgia
> Total excess deaths, Mar. 1 to May 9: 1,527 — 16th most (8.3% more than expected)
> Confirmed COVID-19 deaths, Mar. 1 to May 9: 1,401 — 12th most (91.7% of excess deaths)
> Excess deaths excluding confirmed COVID-19 deaths, Mar. 1 to May 9: 126 — 28th most (8.3% of excess deaths)
> Testing rate as of May 18: 3,463 per 100,000 residents — 22nd most
> Positive test rate as of May 18: 10.5% — 20th highest
> Population density: 177.0 persons per square mile — 16th most
Hawaii
> Total excess deaths, Mar. 1 to May 9: 11 — 2nd fewest (0.5% more than expected)
> Confirmed COVID-19 deaths, Mar. 1 to May 9: 17 — 4th fewest (154.5% of excess deaths)
> Excess deaths excluding confirmed COVID-19 deaths, Mar. 1 to May 9: none
> Testing rate as of May 18: 2,968 per 100,000 residents — 21st fewest
> Positive test rate as of May 18: 1.5% — 2nd lowest
> Population density: 129.9 persons per square mile — 20th most
[in-text-ad]
Idaho
> Total excess deaths, Mar. 1 to May 9: 110 — 11th fewest (3.8% more than expected)
> Confirmed COVID-19 deaths, Mar. 1 to May 9: 67 — 11th fewest (60.9% of excess deaths)
> Excess deaths excluding confirmed COVID-19 deaths, Mar. 1 to May 9: 43 — 5th fewest (39.1% of excess deaths)
> Testing rate as of May 18: 2,078 per 100,000 residents — the fewest
> Positive test rate as of May 18: 6.6% — 18th lowest
> Population density: 21.0 persons per square mile — 7th fewest
Illinois
> Total excess deaths, Mar. 1 to May 9: 4,843 — 6th most (19.0% more than expected)
> Confirmed COVID-19 deaths, Mar. 1 to May 9: 3,349 — 6th most (69.2% of excess deaths)
> Excess deaths excluding confirmed COVID-19 deaths, Mar. 1 to May 9: 1,494 — 6th most (30.8% of excess deaths)
> Testing rate as of May 18: 4,735 per 100,000 residents — 12th most
> Positive test rate as of May 18: 16.0% — 9th highest
> Population density: 220.0 persons per square mile — 12th most
Indiana
> Total excess deaths, Mar. 1 to May 9: 1,637 — 14th most (11.1% more than expected)
> Confirmed COVID-19 deaths, Mar. 1 to May 9: 1,362 — 13th most (83.2% of excess deaths)
> Excess deaths excluding confirmed COVID-19 deaths, Mar. 1 to May 9: 275 — 19th most (16.8% of excess deaths)
> Testing rate as of May 18: 2,748 per 100,000 residents — 16th fewest
> Positive test rate as of May 18: 15.4% — 10th highest
> Population density: 183.7 persons per square mile — 15th most
[in-text-ad-2]

Iowa
> Total excess deaths, Mar. 1 to May 9: 188 — 14th fewest (3.1% more than expected)
> Confirmed COVID-19 deaths, Mar. 1 to May 9: 252 — 20th fewest (134.0% of excess deaths)
> Excess deaths excluding confirmed COVID-19 deaths, Mar. 1 to May 9: none
> Testing rate as of May 18: 3,268 per 100,000 residents — 25th most
> Positive test rate as of May 18: 14.5% — 13th highest
> Population density: 56.1 persons per square mile — 15th fewest
Kansas
> Total excess deaths, Mar. 1 to May 9: 190 — 15th fewest (3.6% more than expected)
> Confirmed COVID-19 deaths, Mar. 1 to May 9: 172 — 16th fewest (90.5% of excess deaths)
> Excess deaths excluding confirmed COVID-19 deaths, Mar. 1 to May 9: 18 — 2nd fewest (9.5% of excess deaths)
> Testing rate as of May 18: 2,301 per 100,000 residents — 4th fewest
> Positive test rate as of May 18: 12.4% — 16th highest
> Population density: 35.4 persons per square mile — 10th fewest
[in-text-ad]
Kentucky
> Total excess deaths, Mar. 1 to May 9: 384 — 25th fewest (3.9% more than expected)
> Confirmed COVID-19 deaths, Mar. 1 to May 9: 304 — 24th fewest (79.2% of excess deaths)
> Excess deaths excluding confirmed COVID-19 deaths, Mar. 1 to May 9: 80 — 19th fewest (20.8% of excess deaths)
> Testing rate as of May 18: 3,250 per 100,000 residents — 25th fewest
> Positive test rate as of May 18: 5.5% — 14th lowest
> Population density: 110.6 persons per square mile — 21st most

Louisiana
> Total excess deaths, Mar. 1 to May 9: 2,524 — 10th most (22.0% more than expected)
> Confirmed COVID-19 deaths, Mar. 1 to May 9: 2,194 — 8th most (86.9% of excess deaths)
> Excess deaths excluding confirmed COVID-19 deaths, Mar. 1 to May 9: 330 — 17th most (13.1% of excess deaths)
> Testing rate as of May 18: 5,789 per 100,000 residents — 6th most
> Positive test rate as of May 18: 12.9% — 15th highest
> Population density: 89.0 persons per square mile — 25th fewest

Maine
> Total excess deaths, Mar. 1 to May 9: 62 — 5th fewest (2.1% more than expected)
> Confirmed COVID-19 deaths, Mar. 1 to May 9: 64 — 9th fewest (103.2% of excess deaths)
> Excess deaths excluding confirmed COVID-19 deaths, Mar. 1 to May 9: none
> Testing rate as of May 18: 2,596 per 100,000 residents — 11th fewest
> Positive test rate as of May 18: 4.9% — 12th lowest
> Population density: 37.8 persons per square mile — 12th fewest
[in-text-ad-2]
Maryland
> Total excess deaths, Mar. 1 to May 9: 2,698 — 9th most (21.5% more than expected)
> Confirmed COVID-19 deaths, Mar. 1 to May 9: 1,510 — 11th most (56.0% of excess deaths)
> Excess deaths excluding confirmed COVID-19 deaths, Mar. 1 to May 9: 1,188 — 8th most (44.0% of excess deaths)
> Testing rate as of May 18: 3,426 per 100,000 residents — 23rd most
> Positive test rate as of May 18: 19.3% — 4th highest
> Population density: 487.1 persons per square mile — 5th most

Massachusetts
> Total excess deaths, Mar. 1 to May 9: 5,895 — 5th most (33.4% more than expected)
> Confirmed COVID-19 deaths, Mar. 1 to May 9: 4,840 — 3rd most (82.1% of excess deaths)
> Excess deaths excluding confirmed COVID-19 deaths, Mar. 1 to May 9: 1,055 — 9th most (17.9% of excess deaths)
> Testing rate as of May 18: 6,798 per 100,000 residents — 4th most
> Positive test rate as of May 18: 18.6% — 5th highest
> Population density: 654.0 persons per square mile — 3rd most
[in-text-ad]

Michigan
> Total excess deaths, Mar. 1 to May 9: 6,597 — 4th most (25.7% more than expected)
> Confirmed COVID-19 deaths, Mar. 1 to May 9: 4,526 — 4th most (68.6% of excess deaths)
> Excess deaths excluding confirmed COVID-19 deaths, Mar. 1 to May 9: 2,071 — 5th most (31.4% of excess deaths)
> Testing rate as of May 18: 4,252 per 100,000 residents — 14th most
> Positive test rate as of May 18: 12.2% — 17th highest
> Population density: 103.4 persons per square mile — 24th most
Minnesota
> Total excess deaths, Mar. 1 to May 9: 760 — 20th most (7.9% more than expected)
> Confirmed COVID-19 deaths, Mar. 1 to May 9: 558 — 19th most (73.4% of excess deaths)
> Excess deaths excluding confirmed COVID-19 deaths, Mar. 1 to May 9: 202 — 22nd most (26.6% of excess deaths)
> Testing rate as of May 18: 2,791 per 100,000 residents — 17th fewest
> Positive test rate as of May 18: 10.5% — 21st highest
> Population density: 64.5 persons per square mile — 20th fewest
Mississippi
> Total excess deaths, Mar. 1 to May 9: 877 — 19th most (12.4% more than expected)
> Confirmed COVID-19 deaths, Mar. 1 to May 9: 421 — 22nd most (48.0% of excess deaths)
> Excess deaths excluding confirmed COVID-19 deaths, Mar. 1 to May 9: 456 — 14th most (52.0% of excess deaths)
> Testing rate as of May 18: 3,876 per 100,000 residents — 16th most
> Positive test rate as of May 18: 9.9% — 22nd highest
> Population density: 61.7 persons per square mile — 18th fewest
[in-text-ad-2]
Missouri
> Total excess deaths, Mar. 1 to May 9: 738 — 21st most (5.5% more than expected)
> Confirmed COVID-19 deaths, Mar. 1 to May 9: 472 — 21st most (64.0% of excess deaths)
> Excess deaths excluding confirmed COVID-19 deaths, Mar. 1 to May 9: 266 — 20th most (36.0% of excess deaths)
> Testing rate as of May 18: 2,515 per 100,000 residents — 8th fewest
> Positive test rate as of May 18: 7.1% — 23rd lowest
> Population density: 87.9 persons per square mile — 23rd fewest

Montana
> Total excess deaths, Mar. 1 to May 9: 83 — 9th fewest (4.1% more than expected)
> Confirmed COVID-19 deaths, Mar. 1 to May 9: 16 — 3rd fewest (19.3% of excess deaths)
> Excess deaths excluding confirmed COVID-19 deaths, Mar. 1 to May 9: 67 — 7th fewest (80.7% of excess deaths)
> Testing rate as of May 18: 2,651 per 100,000 residents — 12th fewest
> Positive test rate as of May 18: 1.7% — 3rd lowest
> Population density: 7.2 persons per square mile — 3rd fewest
[in-text-ad]
Nebraska
> Total excess deaths, Mar. 1 to May 9: 82 — 7th fewest (2.4% more than expected)
> Confirmed COVID-19 deaths, Mar. 1 to May 9: 96 — 13th fewest (117.1% of excess deaths)
> Excess deaths excluding confirmed COVID-19 deaths, Mar. 1 to May 9: none
> Testing rate as of May 18: 3,636 per 100,000 residents — 20th most
> Positive test rate as of May 18: 15.1% — 12th highest
> Population density: 24.9 persons per square mile — 8th fewest

Nevada
> Total excess deaths, Mar. 1 to May 9: 197 — 16th fewest (3.7% more than expected)
> Confirmed COVID-19 deaths, Mar. 1 to May 9: 301 — 23rd fewest (152.8% of excess deaths)
> Excess deaths excluding confirmed COVID-19 deaths, Mar. 1 to May 9: none
> Testing rate as of May 18: 2,661 per 100,000 residents — 14th fewest
> Positive test rate as of May 18: 8.6% — 23rd highest
> Population density: 27.4 persons per square mile — 9th fewest
New Hampshire
> Total excess deaths, Mar. 1 to May 9: 240 — 21st fewest (9.0% more than expected)
> Confirmed COVID-19 deaths, Mar. 1 to May 9: 131 — 15th fewest (54.6% of excess deaths)
> Excess deaths excluding confirmed COVID-19 deaths, Mar. 1 to May 9: 109 — 29th most (45.4% of excess deaths)
> Testing rate as of May 18: 3,647 per 100,000 residents — 19th most
> Positive test rate as of May 18: 7.4% — 24th lowest
> Population density: 145.1 persons per square mile — 19th most
[in-text-ad-2]

New Jersey
> Total excess deaths, Mar. 1 to May 9: 13,370 — 2nd most (48.0% more than expected)
> Confirmed COVID-19 deaths, Mar. 1 to May 9: 9,116 — 2nd most (68.2% of excess deaths)
> Excess deaths excluding confirmed COVID-19 deaths, Mar. 1 to May 9: 4,254 — 3rd most (31.8% of excess deaths)
> Testing rate as of May 18: 5,675 per 100,000 residents — 7th most
> Positive test rate as of May 18: 29.3% — the highest
> Population density: 1021.3 persons per square mile — the most
New Mexico
> Total excess deaths, Mar. 1 to May 9: 373 — 24th fewest (9.0% more than expected)
> Confirmed COVID-19 deaths, Mar. 1 to May 9: 191 — 17th fewest (51.2% of excess deaths)
> Excess deaths excluding confirmed COVID-19 deaths, Mar. 1 to May 9: 182 — 24th most (48.8% of excess deaths)
> Testing rate as of May 18: 6,568 per 100,000 residents — 5th most
> Positive test rate as of May 18: 4.4% — 11th lowest
> Population density: 17.2 persons per square mile — 6th fewest
[in-text-ad]
New York
> Total excess deaths, Mar. 1 to May 9: 35,641 — the most (54.3% more than expected)
> Confirmed COVID-19 deaths, Mar. 1 to May 9: 26,584 — the most (74.6% of excess deaths)
> Excess deaths excluding confirmed COVID-19 deaths, Mar. 1 to May 9: 9,057 — the most (25.4% of excess deaths)
> Testing rate as of May 18: 7,233 per 100,000 residents — 3rd most
> Positive test rate as of May 18: 24.8% — 2nd highest
> Population density: 358.2 persons per square mile — 7th most
North Carolina
> Total excess deaths, Mar. 1 to Apr. 25: 88 — 10th fewest (1.1% more than expected)
> Confirmed COVID-19 deaths, Mar. 1 to Apr. 25: 300 — 22nd fewest (340.9% of excess deaths)
> Excess deaths excluding confirmed COVID-19 deaths, Mar. 1 to Apr. 25: none
> Testing rate as of May 18: 2,463 per 100,000 residents — 7th fewest
> Positive test rate as of May 18: 7.4% — 25th lowest
> Population density: 192.9 persons per square mile — 14th most

North Dakota
> Total excess deaths, Mar. 1 to May 9: 24 — 3rd fewest (1.8% more than expected)
> Confirmed COVID-19 deaths, Mar. 1 to May 9: 35 — 6th fewest (145.8% of excess deaths)
> Excess deaths excluding confirmed COVID-19 deaths, Mar. 1 to May 9: none
> Testing rate as of May 18: 7,441 per 100,000 residents — 2nd most
> Positive test rate as of May 18: 3.4% — 5th lowest
> Population density: 10.8 persons per square mile — 4th fewest
[in-text-ad-2]
Ohio
> Total excess deaths, Mar. 1 to May 9: 1,765 — 13th most (6.7% more than expected)
> Confirmed COVID-19 deaths, Mar. 1 to May 9: 1,331 — 14th most (75.4% of excess deaths)
> Excess deaths excluding confirmed COVID-19 deaths, Mar. 1 to May 9: 434 — 15th most (24.6% of excess deaths)
> Testing rate as of May 18: 2,310 per 100,000 residents — 5th fewest
> Positive test rate as of May 18: 10.5 — 19th highest
> Population density: 260.8 persons per square mile — 10th most
Oklahoma
> Total excess deaths, Mar. 1 to May 9: 129 — 12th fewest (1.9% more than expected)
> Confirmed COVID-19 deaths, Mar. 1 to May 9: 266 — 21st fewest (206.2% of excess deaths)
> Excess deaths excluding confirmed COVID-19 deaths, Mar. 1 to May 9: none
> Testing rate as of May 18: 3,557 per 100,000 residents — 21st most
> Positive test rate as of May 18: 3.8% — 7th lowest
> Population density: 56.4 persons per square mile — 16th fewest
[in-text-ad]

Oregon
> Total excess deaths, Mar. 1 to May 9: 234 — 20th fewest (3.1% more than expected)
> Confirmed COVID-19 deaths, Mar. 1 to May 9: 127 — 14th fewest (54.3% of excess deaths)
> Excess deaths excluding confirmed COVID-19 deaths, Mar. 1 to May 9: 107 — 30th most (45.7% of excess deaths)
> Testing rate as of May 18: 2,320 per 100,000 residents — 6th fewest
> Positive test rate as of May 18: 3.8% — 8th lowest
> Population density: 42.6 persons per square mile — 13th fewest
Pennsylvania
> Total excess deaths, Mar. 1 to May 9: 8,884 — 3rd most (26.2% more than expected)
> Confirmed COVID-19 deaths, Mar. 1 to May 9: 3,688 — 5th most (41.5% of excess deaths)
> Excess deaths excluding confirmed COVID-19 deaths, Mar. 1 to May 9: 5,196 — 2nd most (58.5% of excess deaths)
> Testing rate as of May 18: 2,660 per 100,000 residents — 13th fewest
> Positive test rate as of May 18: 18.5% — 7th highest
> Population density: 278.1 persons per square mile — 9th most
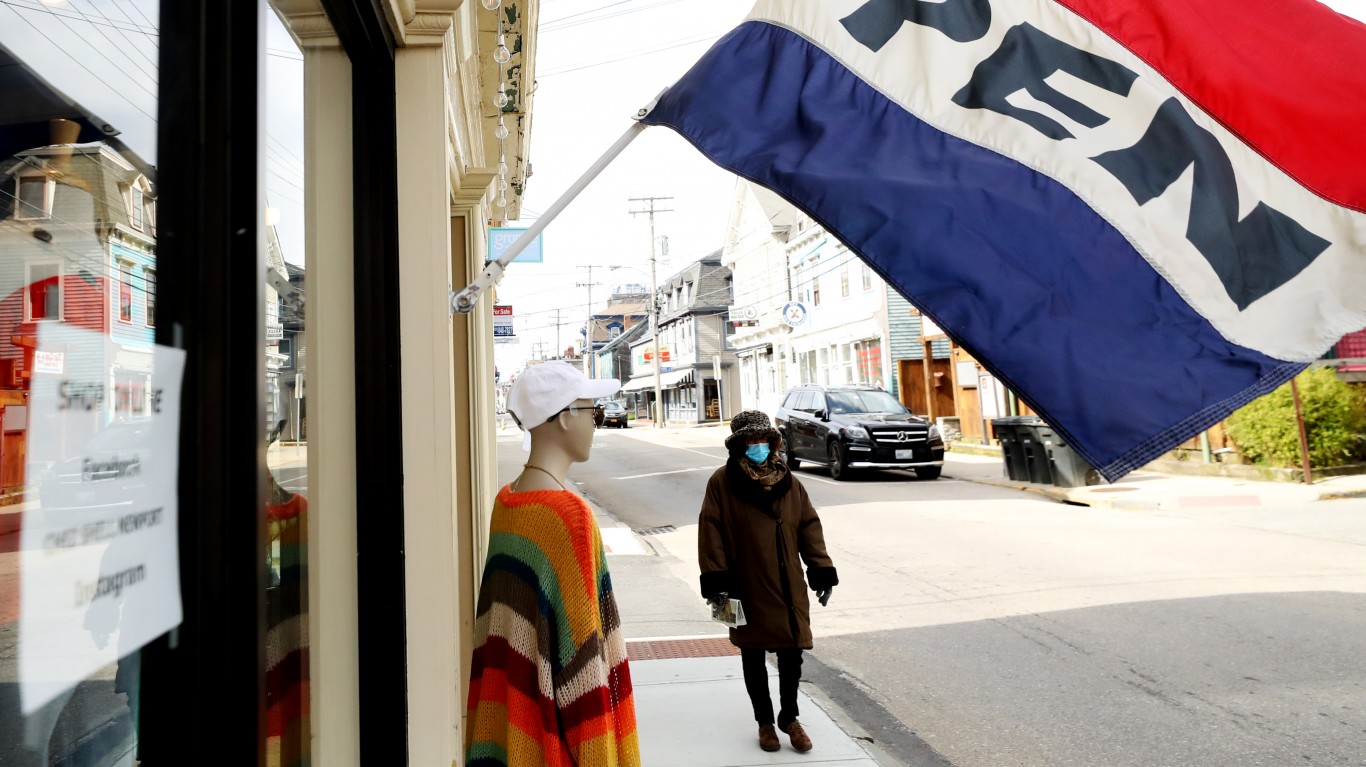
Rhode Island
> Total excess deaths, Mar. 1 to May 9: 175 — 13th fewest (7.7% more than expected)
> Confirmed COVID-19 deaths, Mar. 1 to May 9: 418 — 23rd most (238.9% of excess deaths)
> Excess deaths excluding confirmed COVID-19 deaths, Mar. 1 to May 9: none
> Testing rate as of May 18: 10,913 per 100,000 residents — the most
> Positive test rate as of May 18: 11.1% — 18th highest
> Population density: 684.3 persons per square mile — 2nd most
[in-text-ad-2]

South Carolina
> Total excess deaths, Mar. 1 to May 9: 1,154 — 18th most (10.5% more than expected)
> Confirmed COVID-19 deaths, Mar. 1 to May 9: 330 — 25th fewest (28.6% of excess deaths)
> Excess deaths excluding confirmed COVID-19 deaths, Mar. 1 to May 9: 824 — 10th most (71.4% of excess deaths)
> Testing rate as of May 18: 2,588 per 100,000 residents — 10th fewest
> Positive test rate as of May 18: 6.8% — 20th lowest
> Population density: 158.8 persons per square mile — 18th most

South Dakota
> Total excess deaths, Mar. 1 to May 9: 70 — 6th fewest (4.2% more than expected)
> Confirmed COVID-19 deaths, Mar. 1 to May 9: 31 — 5th fewest (44.3% of excess deaths)
> Excess deaths excluding confirmed COVID-19 deaths, Mar. 1 to May 9: 39 — 3rd fewest (55.7% of excess deaths)
> Testing rate as of May 18: 3,292 per 100,000 residents — 24th most
> Positive test rate as of May 18: 13.9% — 14th highest
> Population density: 11.4 persons per square mile — 5th fewest
[in-text-ad]
Tennessee
> Total excess deaths, Mar. 1 to May 9: 430 — 25th most (2.8% more than expected)
> Confirmed COVID-19 deaths, Mar. 1 to May 9: 241 — 19th fewest (56.0% of excess deaths)
> Excess deaths excluding confirmed COVID-19 deaths, Mar. 1 to May 9: 189 — 23rd most (44.0% of excess deaths)
> Testing rate as of May 18: 4,984 per 100,000 residents — 9th most
> Positive test rate as of May 18: 5.3% — 13th lowest
> Population density: 160.6 persons per square mile — 17th most
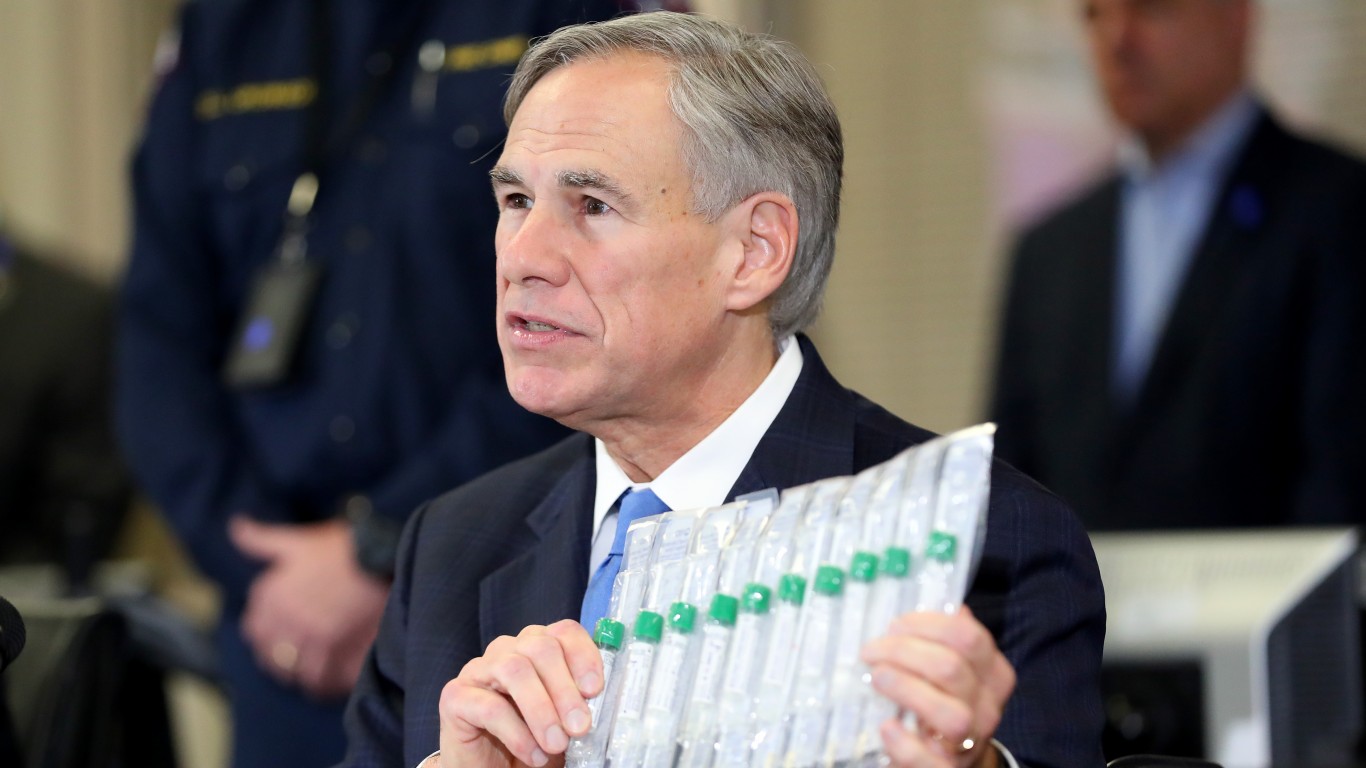
Texas
> Total excess deaths, Mar. 1 to May 9: 3,616 — 7th most (8.3% more than expected)
> Confirmed COVID-19 deaths, Mar. 1 to May 9: 1,086 — 15th most (30.0% of excess deaths)
> Excess deaths excluding confirmed COVID-19 deaths, Mar. 1 to May 9: 2,530 — 4th most (70.0% of excess deaths)
> Testing rate as of May 18: 2,519 per 100,000 residents — 9th fewest
> Positive test rate as of May 18: 6.7% — 19th lowest
> Population density: 106.9 persons per square mile — 22nd most

Utah
> Total excess deaths, Mar. 1 to May 9: 204 — 17th fewest (5.0% more than expected)
> Confirmed COVID-19 deaths, Mar. 1 to May 9: 66 — 10th fewest (32.4% of excess deaths)
> Excess deaths excluding confirmed COVID-19 deaths, Mar. 1 to May 9: 138 — 26th most (67.6% of excess deaths)
> Testing rate as of May 18: 5,402 per 100,000 residents — 8th most
> Positive test rate as of May 18: 4.2% — 10th lowest
> Population density: 37.2 persons per square mile — 11th fewest
[in-text-ad-2]
Vermont
> Total excess deaths, Mar. 1 to May 9: 232 — 19th fewest (17.3% more than expected)
> Confirmed COVID-19 deaths, Mar. 1 to May 9: 53 — 8th fewest (22.8% of excess deaths)
> Excess deaths excluding confirmed COVID-19 deaths, Mar. 1 to May 9: 179 — 25th most (77.2% of excess deaths)
> Testing rate as of May 18: 3,804 per 100,000 residents — 17th most
> Positive test rate as of May 18: 3.9% — 9th lowest
> Population density: 65.1 persons per square mile — 21st fewest

Virginia
> Total excess deaths, Mar. 1 to May 9: 2,063 — 12th most (13.0% more than expected)
> Confirmed COVID-19 deaths, Mar. 1 to May 9: 827 — 18th most (40.1% of excess deaths)
> Excess deaths excluding confirmed COVID-19 deaths, Mar. 1 to May 9: 1,236 — 7th most (59.9% of excess deaths)
> Testing rate as of May 18: 2,286 per 100,000 residents — 3rd fewest
> Positive test rate as of May 18: 15.2% — 11th highest
> Population density: 199.1 persons per square mile — 13th most
[in-text-ad]

Washington
> Total excess deaths, Mar. 1 to May 9: 710 — 22nd most (5.9% more than expected)
> Confirmed COVID-19 deaths, Mar. 1 to May 9: 902 — 17th most (127.0% of excess deaths)
> Excess deaths excluding confirmed COVID-19 deaths, Mar. 1 to May 9: none
> Testing rate as of May 18: 3,785 per 100,000 residents — 18th most
> Positive test rate as of May 18: 6.5% — 17th lowest
> Population density: 105.7 persons per square mile — 23rd most
West Virginia
> Total excess deaths, Mar. 1 to May 9: 360 — 23rd fewest (9.5% more than expected)
> Confirmed COVID-19 deaths, Mar. 1 to May 9: 53 — 8th fewest (14.7% of excess deaths)
> Excess deaths excluding confirmed COVID-19 deaths, Mar. 1 to May 9: 307 — 18th most (85.3% of excess deaths)
> Testing rate as of May 18: 4,211 per 100,000 residents — 15th most
> Positive test rate as of May 18: 2.0% — 4th lowest
> Population density: 74.5 persons per square mile — 22nd fewest

Wisconsin
> Total excess deaths, Mar. 1 to May 9: 650 — 23rd most (5.7% more than expected)
> Confirmed COVID-19 deaths, Mar. 1 to May 9: 398 — 24th most (61.2% of excess deaths)
> Excess deaths excluding confirmed COVID-19 deaths, Mar. 1 to May 9: 252 — 21st most (38.8% of excess deaths)
> Testing rate as of May 18: 2,704 per 100,000 residents — 15th fewest
> Positive test rate as of May 18: 8.1% — 24th highest
> Population density: 88.8 persons per square mile — 24th fewest
[in-text-ad-2]

Wyoming
> Total excess deaths, Mar. 1 to May 9: 83 — 9th fewest (8.7% more than expected)
> Confirmed COVID-19 deaths, Mar. 1 to May 9: 7 — the fewest (8.4% of excess deaths)
> Excess deaths excluding confirmed COVID-19 deaths, Mar. 1 to May 9: 76 — 18th fewest (91.6% of excess deaths)
> Testing rate as of May 18: 2,807 per 100,000 residents — 18th fewest
> Positive test rate as of May 18: 3.5% — 6th lowest
> Population density: 5.9 persons per square mile — 2nd fewest
Methodology
To determine how COVID-19 is being underreported in every state, 24/7 Wall St. calculated the total number of reported COVID-19 deaths as a percentage of excess deaths from all causes using data from the Centers for Disease Control & Prevention. The CDC uses historical data from 2013 to the present to estimated excess deaths, which represent the difference between the observed number of deaths in a given week and the expected number of deaths for that week based on CDC projections. The CDC weighs data on observed deaths to account for reporting lags and potential underreporting of deaths from all causes by jurisdiction.
24/7 Wall St. reviewed the number of excess deaths that occurred from Mar. 1 to May 9, 2020, in each state and compared it to the state’s reported number of COVID-19 deaths over the same period. Assuming that every COVID-19 death in 2020 is an unexpected excess death, we considered the difference between excess deaths and reported COVID-19 deaths to be not accounted for deaths, and the potential result of underreporting of COVID-19-related deaths. Due to data limitations, we looked at the period Mar. 1, 2020 to Apr. 25, 2020, for North Carolina and Apr. 5, 2020 to Apr. 25, 2020, for Connecticut.
Data on reported COVD-19 deaths, as well as positive, negative, and total test counts as of May 18, 2020, came from various state and local health departments and were adjusted for population using data from the Census Bureau’s 2018 American Community Survey. Data on land area by state used to calculate population density also came from the Census Bureau.
Credit card companies are at war. The biggest issuers are handing out free rewards and benefits to win the best customers.
It’s possible to find cards paying unlimited 1.5%, 2%, and even more today. That’s free money for qualified borrowers, and the type of thing that would be crazy to pass up. Those rewards can add up to thousands of dollars every year in free money, and include other benefits as well.
We’ve assembled some of the best credit cards for users today. Don’t miss these offers because they won’t be this good forever.
Flywheel Publishing has partnered with CardRatings for our coverage of credit card products. Flywheel Publishing and CardRatings may receive a commission from card issuers.
Thank you for reading! Have some feedback for us?
Contact the 24/7 Wall St. editorial team.