Special Report
How Often and Where People Are Going Is Changing Dramatically in Every State

Published:
Last Updated:

The scale of the coronavirus pandemic in the United States is reshaping society in many ways — from how we work and buy groceries to the level of movement we are becoming accustomed to. With most states in various stages of reopening their economies, where people are going and how they are spending their time outside has changed significantly.
24/7 Tempo analyzed population mobility data from Google to determine how the geographic movement of people has changed in every state.
In the five weeks from May 8 through June 12, during which most states had already reopened to some extent, Americans were staying at home on average 12.1% more than during Google’s baseline period. The baseline period is what Google determined was a typical amount of travel for a region over the five weeks between Jan 3 and Feb 6, 2020, a time before social distancing measures and stay-at-home orders were issued.
In our review, we included mobility data in several categories, including recreation and retail mobility (restaurants, shopping centers, and movie theaters); grocery and pharmacy mobility; parks mobility (public parks and beaches); and transit stations mobility (subways, busses, and train stations).
The changes in movement vary greatly from state to state. The restrictiveness of each state’s reopening plan and stay-at-home rules appears to play a role in how people’s movement has changed — these are every state’s latest rules for reopening and social distancing.
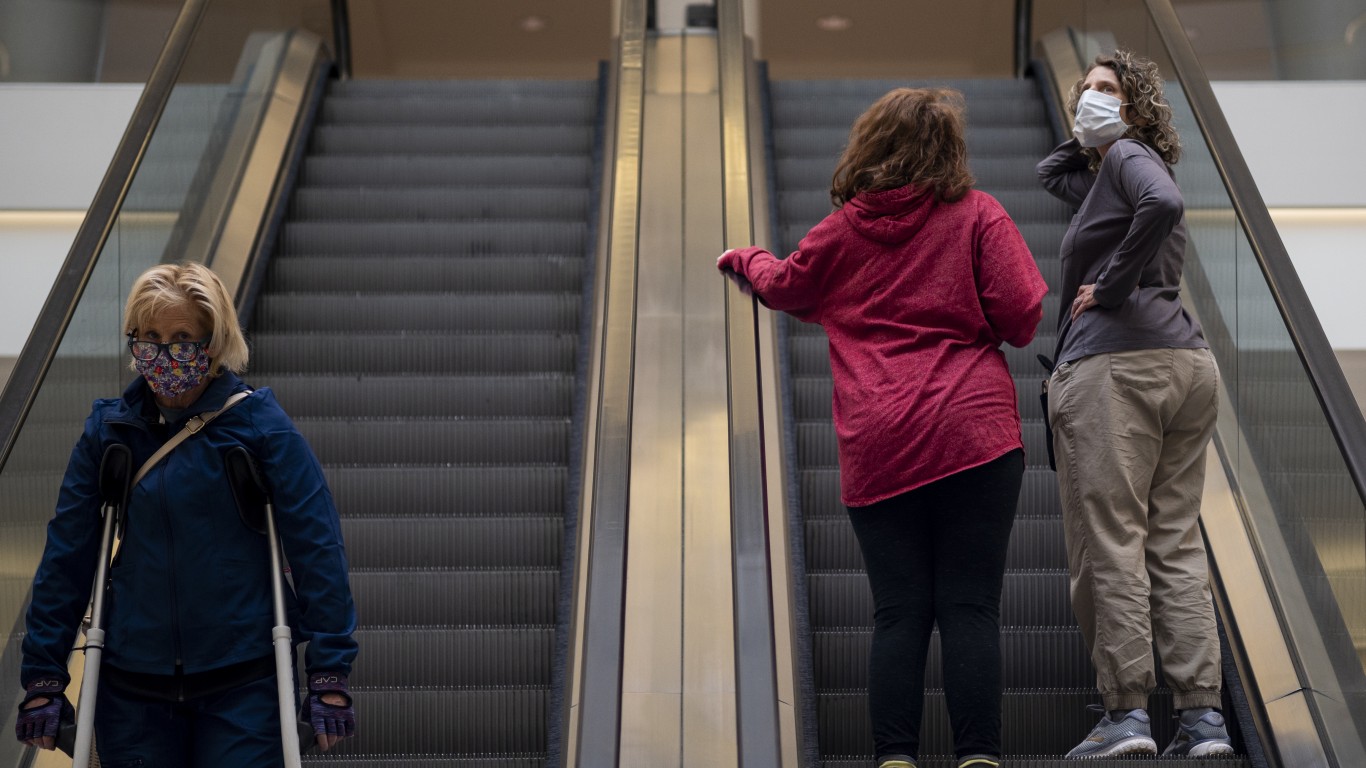
The biggest change across the country has been in using public transportation. There was a 36.0% decline between the May 8 to June 12 period from the Jan. 3 and Feb. 6 period in people using subways, buses, and train stations. This is to be expected as mostly people are being strongly encouraged to avoid public transit as much as possible, even in places where they are allowed to return to the office.
The public transit use trend was negative in all but four states — Idaho, Oklahoma, South Dakota, Wyoming (the latter three never issued stay-at-home orders).
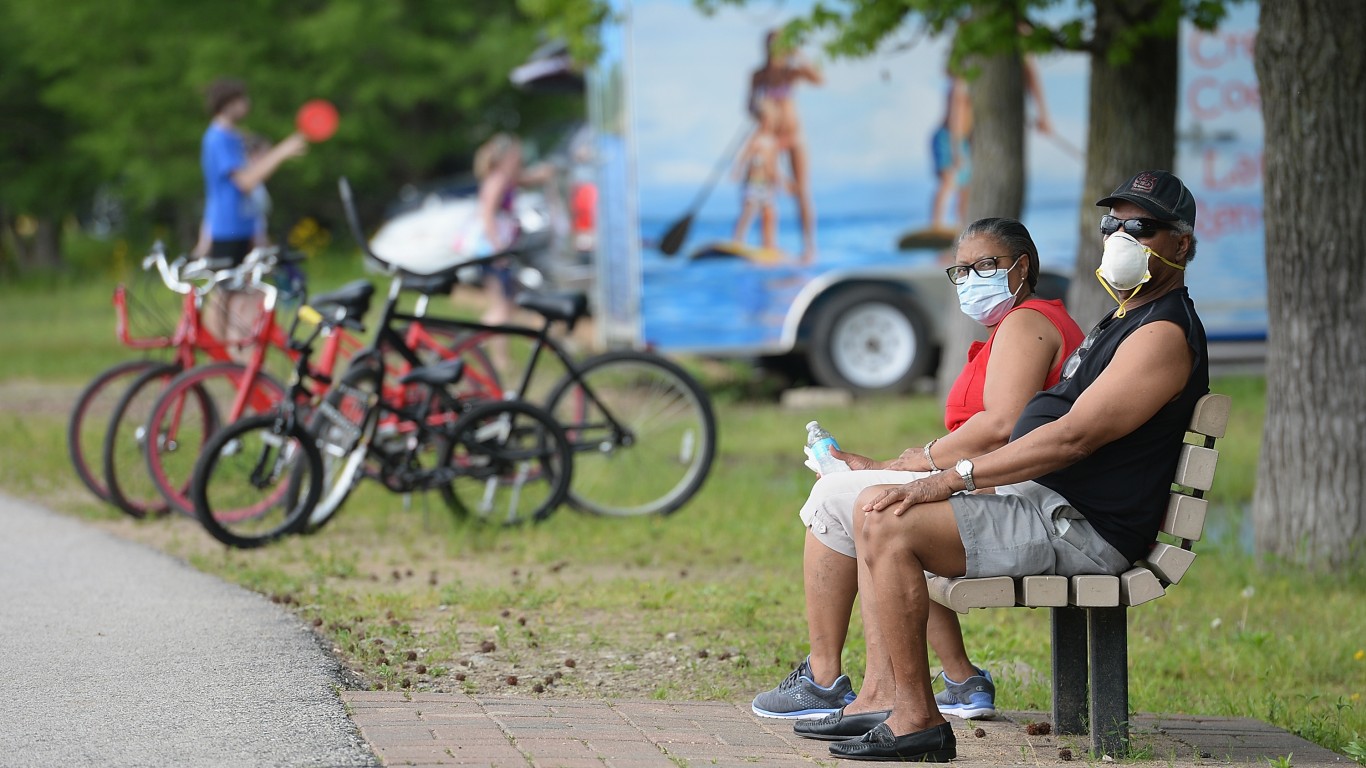
In states with the biggest increases in visits to public parks, public parks were allowed to remain open. For example, in Wisconsin, where gyms were closed, parks mobility increased by 155.9%, the second highest increase in the country. State residents were encouraged to use parks and exercise outdoors. In contrast, Hawaii, the state with the largest decline in park visits — 39.8% between May 8 and June 12 — had state parks, historical sites, and recreation areas closed until June 5 (some even later).
As of June 17, the number of recorded cases of COVID-19 in the United States is nearly 2.2 million. Although the acceleration of the coronavirus’ spread in the U.S. has slowed, some states and major cities are reporting a second wave of new coronavirus cases after reopening their economies — these are the cities where the coronavirus is spreading the fastest right now.
Click here to read about how people’s movements are changing in every state.
Click here for our detailed methodology.
Alabama
> Change in time spent at home during 5 weeks through June 12 (compared to pre-pandemic): 8.5% — 14th smallest increase
> Change in trips to workplaces: -26.4% — 8th smallest decline
> Change in retail and recreation visits: -9.6% — 14th smallest decline
> Change in grocery and pharmacy visits: 5.1% — 13th smallest increase
> Change in park visits: 42.5% — 13th smallest increase
> Change in public transit use: -5.3% — 9th smallest decline
> Confirmed COVID-19 cases as of June 17: 551 per 100,000 people — 19th highest (total: 26,914)
> Change in trailing 7-day avg. daily cases, June 9 – June 16: 106% — 3rd largest increase (378 to 779)
> Population: 4,887,871
[in-text-ad]
Alaska
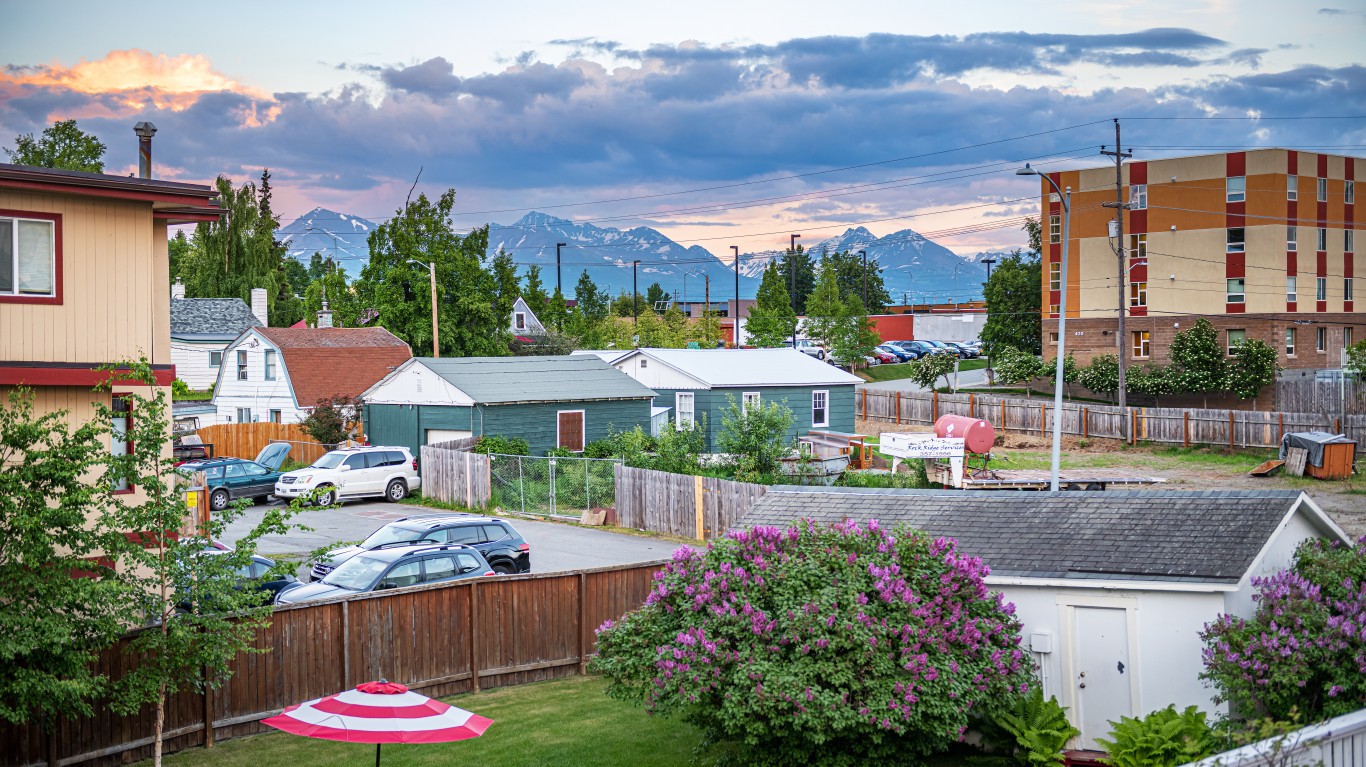
> Change in time spent at home during 5 weeks through June 12 (compared to pre-pandemic): 6.5% — 4th smallest increase
> Change in trips to workplaces: -24.6% — 5th smallest decline
> Change in retail and recreation visits: 1.3% — the largest (and only) increase
> Change in grocery and pharmacy visits: 12.0% — 6th largest increase
> Change in park visits: 129.9% — 8th largest increase
> Change in public transit use: -21.8% — 18th smallest decline
> Confirmed COVID-19 cases as of June 17: 92 per 100,000 people — 3rd lowest (total: 676)
> Change in trailing 7-day avg. daily cases, June 9 – June 16: 20% — 8th smallest increase (12 to 15)
> Population: 737,438
Arizona
> Change in time spent at home during 5 weeks through June 12 (compared to pre-pandemic): 11.0% — 25th largest increase
> Change in trips to workplaces: -33.7% — 22nd largest decline
> Change in retail and recreation visits: -21.2% — 19th largest decline
> Change in grocery and pharmacy visits: -5.2% — 11th largest decline
> Change in park visits: -8.8% — 4th largest decline
> Change in public transit use: -29.9% — 21st largest decline
> Confirmed COVID-19 cases as of June 17: 545 per 100,000 people — 21st highest (total: 39,097)
> Change in trailing 7-day avg. daily cases, June 9 – June 16: 53% — 10th largest increase (1,007 to 1,543)
> Population: 7,171,646
Arkansas
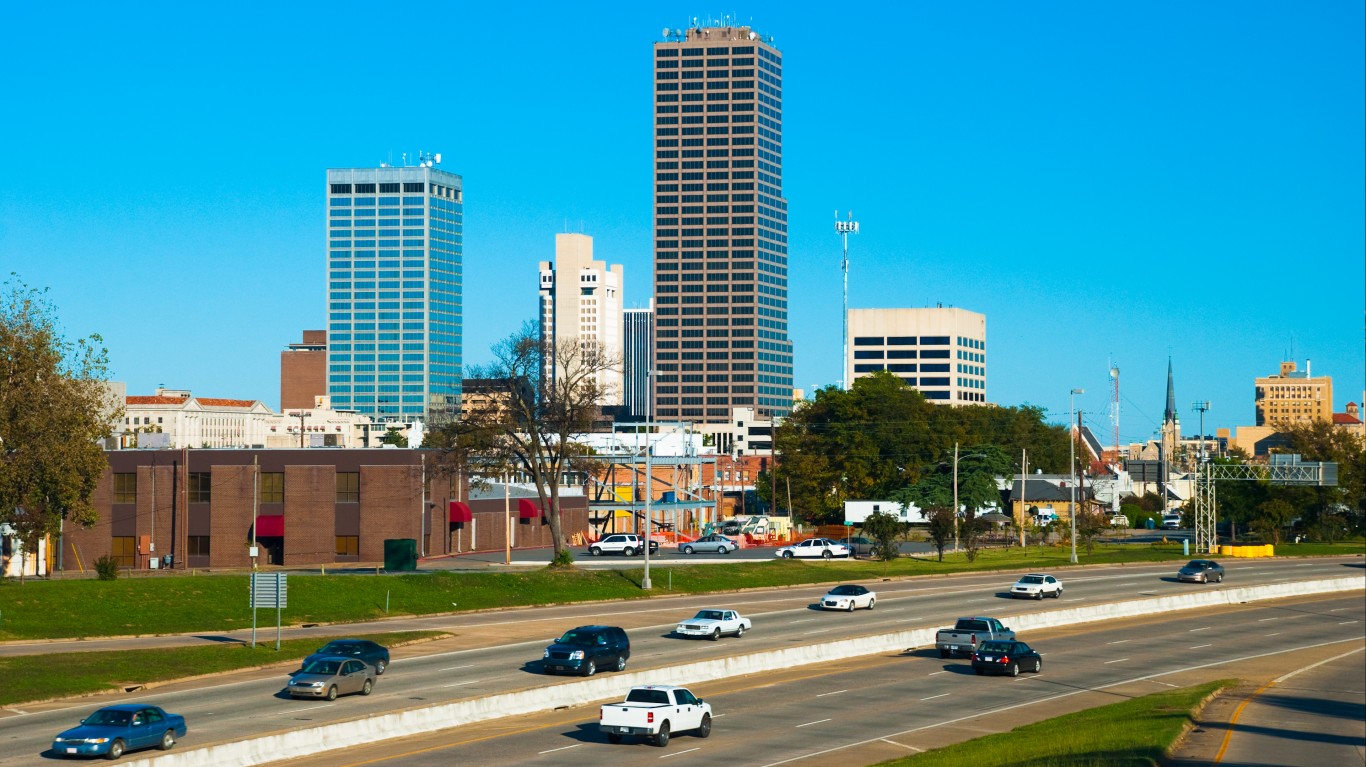
> Change in time spent at home during 5 weeks through June 12 (compared to pre-pandemic): 7.1% — 5th smallest increase
> Change in trips to workplaces: -25.6% — 7th smallest decline
> Change in retail and recreation visits: -5.4% — 7th smallest decline
> Change in grocery and pharmacy visits: 9.5% — 7th largest increase
> Change in park visits: 83.7% — 21st largest increase
> Change in public transit use: -6.4% — 10th smallest decline
> Confirmed COVID-19 cases as of June 17: 438 per 100,000 people — 24th lowest (total: 13,191)
> Change in trailing 7-day avg. daily cases, June 9 – June 16: 38% — 12th smallest increase (323 to 444)
> Population: 3,013,825
[in-text-ad-2]

California
> Change in time spent at home during 5 weeks through June 12 (compared to pre-pandemic): 15.2% — 6th largest increase
> Change in trips to workplaces: -38.5% — 8th largest decline
> Change in retail and recreation visits: -40.4% — 4th largest decline
> Change in grocery and pharmacy visits: -6.9% — 9th largest decline
> Change in park visits: -6.6% — 5th largest decline
> Change in public transit use: -42.8% — 8th largest decline
> Confirmed COVID-19 cases as of June 17: 388 per 100,000 people — 17th lowest (total: 153,560)
> Change in trailing 7-day avg. daily cases, June 9 – June 16: 10% — 4th smallest increase (2,597 to 2,867)
> Population: 39,557,045

Colorado
> Change in time spent at home during 5 weeks through June 12 (compared to pre-pandemic): 11.7% — 21st largest increase
> Change in trips to workplaces: -36.5% — 16th largest decline
> Change in retail and recreation visits: -21.4% — 18th largest decline
> Change in grocery and pharmacy visits: -1.4% — 4th smallest decline
> Change in park visits: 60.0% — 21st smallest increase
> Change in public transit use: -37.1% — 15th largest decline
> Confirmed COVID-19 cases as of June 17: 517 per 100,000 people — 22nd highest (total: 29,442)
> Change in trailing 7-day avg. daily cases, June 9 – June 16: -30% — 7th largest decline (223 to 156)
> Population: 5,695,564
[in-text-ad]

Connecticut
> Change in time spent at home during 5 weeks through June 12 (compared to pre-pandemic): 14.0% — 7th largest increase
> Change in trips to workplaces: -36.7% — 14th largest decline
> Change in retail and recreation visits: -22.8% — 17th largest decline
> Change in grocery and pharmacy visits: -7.6% — 8th largest decline
> Change in park visits: 78.2% — 25th largest increase
> Change in public transit use: -36.1% — 18th largest decline
> Confirmed COVID-19 cases as of June 17: 1269 per 100,000 people — 5th highest (total: 45,349)
> 7-day change in avg. daily new COVID-19 through June 15: -7% — 4th smallest decline (179 to 167)
> Population: 3,572,665

Delaware
> Change in time spent at home during 5 weeks through June 12 (compared to pre-pandemic): 12.8% — 13th largest increase
> Change in trips to workplaces: -35.2% — 19th largest decline
> Change in retail and recreation visits: -21.0% — 20th largest decline
> Change in grocery and pharmacy visits: -4.8% — 11th smallest decline
> Change in park visits: 46.6% — 15th smallest increase
> Change in public transit use: -33.3% — 19th largest decline
> Confirmed COVID-19 cases as of June 17: 1,080 per 100,000 people — 6th highest (total: 10,444)
> 7-day change in avg. daily new COVID-19 through June 15: 1% — the smallest increase (54 to 54)
> Population: 967,171

Florida
> Change in time spent at home during 5 weeks through June 12 (compared to pre-pandemic): 12.1% — 18th largest increase
> Change in trips to workplaces: -33.0% — 24th largest decline
> Change in retail and recreation visits: -26.8% — 9th largest decline
> Change in grocery and pharmacy visits: -11.6% — 3rd largest decline
> Change in park visits: -25.8% — 2nd largest decline
> Change in public transit use: -45.9% — 6th largest decline
> Confirmed COVID-19 cases as of June 17: 388 per 100,000 people — 18th lowest (total: 82,719)
> Change in trailing 7-day avg. daily cases, June 9 – June 16: 65% — 9th largest increase (1,222 to 2,016)
> Population: 21,299,325
[in-text-ad-2]

Georgia
> Change in time spent at home during 5 weeks through June 12 (compared to pre-pandemic): 11.1% — 23rd largest increase
> Change in trips to workplaces: -33.2% — 23rd largest decline
> Change in retail and recreation visits: -15.6% — 22nd smallest decline
> Change in grocery and pharmacy visits: -1.3% — 3rd smallest decline
> Change in park visits: 35.9% — 11th smallest increase
> Change in public transit use: -38.2% — 14th largest decline
> Confirmed COVID-19 cases as of June 17: 563 per 100,000 people — 18th highest (total: 59,240)
> Change in trailing 7-day avg. daily cases, June 9 – June 16: 15% — 6th smallest increase (717 to 827)
> Population: 10,519,475
Hawaii
> Change in time spent at home during 5 weeks through June 12 (compared to pre-pandemic): 15.4% — 5th largest increase
> Change in trips to workplaces: -37.5% — 11th largest decline
> Change in retail and recreation visits: -40.9% — 3rd largest decline
> Change in grocery and pharmacy visits: -19.6% — the largest decline
> Change in park visits: -39.8% — the largest decline
> Change in public transit use: -63.3% — the largest decline
> Confirmed COVID-19 cases as of June 17: 52 per 100,000 people — the lowest (total: 736)
> Change in trailing 7-day avg. daily cases, June 9 – June 16: 86% — 6th largest increase (4 to 8)
> Population: 1,420,491
[in-text-ad]
Idaho
> Change in time spent at home during 5 weeks through June 12 (compared to pre-pandemic): 6.2% — 3rd smallest increase
> Change in trips to workplaces: -27.3% — 10th smallest decline
> Change in retail and recreation visits: -3.8% — 4th smallest decline
> Change in grocery and pharmacy visits: 12.2% — 5th largest increase
> Change in park visits: 154.8% — 3rd largest increase
> Change in public transit use: 2.8% — 3rd largest increase
> Confirmed COVID-19 cases as of June 17: 202 per 100,000 people — 8th lowest (total: 3,540)
> Change in trailing 7-day avg. daily cases, June 9 – June 16: -4% — 3rd smallest decline (40 to 39)
> Population: 1,754,208

Illinois
> Change in time spent at home during 5 weeks through June 12 (compared to pre-pandemic): 13.6% — 9th largest increase
> Change in trips to workplaces: -38.1% — 9th largest decline
> Change in retail and recreation visits: -28.3% — 6th largest decline
> Change in grocery and pharmacy visits: -3.3% — 7th smallest decline
> Change in park visits: 45.1% — 14th smallest increase
> Change in public transit use: -38.9% — 13th largest decline
> Confirmed COVID-19 cases as of June 17: 1,049 per 100,000 people — 7th highest (total: 133,639)
> Change in trailing 7-day avg. daily cases, June 9 – June 16: -30% — 6th largest decline (909 to 632)
> Population: 12,741,080
Indiana
> Change in time spent at home during 5 weeks through June 12 (compared to pre-pandemic): 9.3% — 17th smallest increase
> Change in trips to workplaces: -29.8% — 19th smallest decline
> Change in retail and recreation visits: -9.0% — 13th smallest decline
> Change in grocery and pharmacy visits: 4.7% — 12th smallest increase
> Change in park visits: 121.5% — 11th largest increase
> Change in public transit use: -5.1% — 8th smallest decline
> Confirmed COVID-19 cases as of June 17: 609 per 100,000 people — 17th highest (total: 40,786)
> Change in trailing 7-day avg. daily cases, June 9 – June 16: -2% — the smallest decline (399 to 393)
> Population: 6,691,878
[in-text-ad-2]
Iowa
> Change in time spent at home during 5 weeks through June 12 (compared to pre-pandemic): 9.2% — 16th smallest increase
> Change in trips to workplaces: -28.1% — 13th smallest decline
> Change in retail and recreation visits: -13.4% — 17th smallest decline
> Change in grocery and pharmacy visits: 16.3% — 2nd largest increase
> Change in park visits: 153.4% — 4th largest increase
> Change in public transit use: -4.6% — 7th smallest decline
> Confirmed COVID-19 cases as of June 17: 766 per 100,000 people — 11th highest (total: 24,168)
> Change in trailing 7-day avg. daily cases, June 9 – June 16: -10% — 6th smallest decline (317 to 284)
> Population: 3,156,145

Kansas
> Change in time spent at home during 5 weeks through June 12 (compared to pre-pandemic): 8.3% — 12th smallest increase
> Change in trips to workplaces: -28.7% — 16th smallest decline
> Change in retail and recreation visits: -11.4% — 15th smallest decline
> Change in grocery and pharmacy visits: 2.0% — 3rd smallest increase
> Change in park visits: 123.1% — 9th largest increase
> Change in public transit use: -0.8% — 2nd smallest decline
> Confirmed COVID-19 cases as of June 17: 392 per 100,000 people — 19th lowest (total: 11,419)
> Change in trailing 7-day avg. daily cases, June 9 – June 16: 20% — 9th smallest increase (91 to 110)
> Population: 2,911,510
[in-text-ad]

Kentucky
> Change in time spent at home during 5 weeks through June 12 (compared to pre-pandemic): 9.3% — 19th smallest increase
> Change in trips to workplaces: -31.3% — 22nd smallest decline
> Change in retail and recreation visits: -13.7% — 18th smallest decline
> Change in grocery and pharmacy visits: 7.8% — 10th largest increase
> Change in park visits: 86.9% — 20th largest increase
> Change in public transit use: -13.4% — 14th smallest decline
> Confirmed COVID-19 cases as of June 17: 287 per 100,000 people — 12th lowest (total: 12,829)
> Change in trailing 7-day avg. daily cases, June 9 – June 16: -26% — 9th largest decline (218 to 160)
> Population: 4,468,402

> Change in time spent at home during 5 weeks through June 12 (compared to pre-pandemic): 9.8% — 21st smallest increase
> Change in trips to workplaces: -28.8% — 17th smallest decline
> Change in retail and recreation visits: -17.3% — 24th largest decline
> Change in grocery and pharmacy visits: 1.7% — 2nd smallest increase
> Change in park visits: -2.8% — 6th largest decline
> Change in public transit use: -26.6% — 21st smallest decline
> Confirmed COVID-19 cases as of June 17: 1,024 per 100,000 people — 9th highest (total: 47,706)
> Change in trailing 7-day avg. daily cases, June 9 – June 16: 43% — 12th largest increase (409 to 585)
> Population: 4,659,978

Maine
> Change in time spent at home during 5 weeks through June 12 (compared to pre-pandemic): 9.3% — 19th smallest increase
> Change in trips to workplaces: -30.1% — 20th smallest decline
> Change in retail and recreation visits: -16.6% — 23rd smallest decline
> Change in grocery and pharmacy visits: 2.6% — 5th smallest increase
> Change in park visits: 118.5% — 14th largest increase
> Change in public transit use: -24.2% — 20th smallest decline
> Confirmed COVID-19 cases as of June 17: 211 per 100,000 people — 9th lowest (total: 2,819)
> Change in trailing 7-day avg. daily cases, June 9 – June 16: -92% — the largest decline (378 to 30)
> Population: 1,338,404
[in-text-ad-2]

Maryland
> Change in time spent at home during 5 weeks through June 12 (compared to pre-pandemic): 16.6% — 3rd largest increase
> Change in trips to workplaces: -41.8% — 4th largest decline
> Change in retail and recreation visits: -26.9% — 8th largest decline
> Change in grocery and pharmacy visits: -8.6% — 5th largest decline
> Change in park visits: 82.1% — 23rd largest increase
> Change in public transit use: -40.8% — 11th largest decline
> Confirmed COVID-19 cases as of June 17: 1,042 per 100,000 people — 8th highest (total: 62,969)
> Change in trailing 7-day avg. daily cases, June 9 – June 16: -26% — 10th largest decline (676 to 501)
> Population: 6,042,718

Massachusetts
> Change in time spent at home during 5 weeks through June 12 (compared to pre-pandemic): 16.5% — 4th largest increase
> Change in trips to workplaces: -43.6% — 2nd largest decline
> Change in retail and recreation visits: -32.7% — 5th largest decline
> Change in grocery and pharmacy visits: -12.6% — 2nd largest decline
> Change in park visits: 57.1% — 19th smallest increase
> Change in public transit use: -57.5% — 2nd largest decline
> Confirmed COVID-19 cases as of June 17: 1534 per 100,000 people — 3rd highest (total: 105,885)
> Change in trailing 7-day avg. daily cases, June 9 – June 16: -27% — 8th largest decline (389 to 285)
> Population: 6,902,149
[in-text-ad]

Michigan
> Change in time spent at home during 5 weeks through June 12 (compared to pre-pandemic): 12.7% — 16th largest increase
> Change in trips to workplaces: -38.6% — 7th largest decline
> Change in retail and recreation visits: -24.2% — 13th largest decline
> Change in grocery and pharmacy visits: -3.1% — 6th smallest decline
> Change in park visits: 134.3% — 6th largest increase
> Change in public transit use: -28.8% — 22nd smallest decline
> Confirmed COVID-19 cases as of June 17: 663 per 100,000 people — 14th highest (total: 66,269)
> Change in trailing 7-day avg. daily cases, June 9 – June 16: -83% — 2nd largest decline (1,067 to 182)
> Population: 9,995,915
Minnesota
> Change in time spent at home during 5 weeks through June 12 (compared to pre-pandemic): 12.7% — 15th largest increase
> Change in trips to workplaces: -37.1% — 13th largest decline
> Change in retail and recreation visits: -23.7% — 14th largest decline
> Change in grocery and pharmacy visits: 2.7% — 6th smallest increase
> Change in park visits: 121.0% — 12th largest increase
> Change in public transit use: -45.3% — 7th largest decline
> Confirmed COVID-19 cases as of June 17: 550 per 100,000 people — 20th highest (total: 30,882)
> Change in trailing 7-day avg. daily cases, June 9 – June 16: -22% — 13th smallest decline (431 to 337)
> Population: 5,611,179
Mississippi
> Change in time spent at home during 5 weeks through June 12 (compared to pre-pandemic): 7.7% — 9th smallest increase
> Change in trips to workplaces: -25.5% — 6th smallest decline
> Change in retail and recreation visits: -4.1% — 5th smallest decline
> Change in grocery and pharmacy visits: 5.7% — 13th largest increase
> Change in park visits: 31.3% — 10th smallest increase
> Change in public transit use: -4.3% — 6th smallest decline
> Confirmed COVID-19 cases as of June 17: 675 per 100,000 people — 13th highest (total: 20,152)
> Change in trailing 7-day avg. daily cases, June 9 – June 16: -2% — 2nd smallest decline (298 to 292)
> Population: 2,986,530
[in-text-ad-2]
Missouri
> Change in time spent at home during 5 weeks through June 12 (compared to pre-pandemic): 8.4% — 13th smallest increase
> Change in trips to workplaces: -28.4% — 15th smallest decline
> Change in retail and recreation visits: -8.9% — 12th smallest decline
> Change in grocery and pharmacy visits: 6.1% — 12th largest increase
> Change in park visits: 80.6% — 24th largest increase
> Change in public transit use: -15.3% — 15th smallest decline
> Confirmed COVID-19 cases as of June 17: 268 per 100,000 people — 11th lowest (total: 16,414)
> Change in trailing 7-day avg. daily cases, June 9 – June 16: 12% — 5th smallest increase (191 to 214)
> Population: 6,126,452

Montana
> Change in time spent at home during 5 weeks through June 12 (compared to pre-pandemic): 4.8% — the smallest increase
> Change in trips to workplaces: -23.1% — 2nd smallest decline
> Change in retail and recreation visits: -3.3% — 2nd smallest decline
> Change in grocery and pharmacy visits: 15.6% — 3rd largest increase
> Change in park visits: 106.1% — 17th largest increase
> Change in public transit use: -2.8% — 4th smallest decline
> Confirmed COVID-19 cases as of June 17: 58 per 100,000 people — 2nd lowest (total: 614)
> Change in trailing 7-day avg. daily cases, June 9 – June 16: 87% — 5th largest increase (5 to 9)
> Population: 1,062,305
[in-text-ad]
Nebraska
> Change in time spent at home during 5 weeks through June 12 (compared to pre-pandemic): 10.4% — 24th smallest increase
> Change in trips to workplaces: -28.9% — 18th smallest decline
> Change in retail and recreation visits: -13.8% — 19th smallest decline
> Change in grocery and pharmacy visits: 4.6% — 9th smallest increase
> Change in park visits: 101.3% — 18th largest increase
> Change in public transit use: -1.6% — 3rd smallest decline
> Confirmed COVID-19 cases as of June 17: 883 per 100,000 people — 10th highest (total: 17,031)
> Change in trailing 7-day avg. daily cases, June 9 – June 16: -24% — 12th largest decline (182 to 138)
> Population: 1,929,268

Nevada
> Change in time spent at home during 5 weeks through June 12 (compared to pre-pandemic): 13.0% — 12th largest increase
> Change in trips to workplaces: -40.8% — 5th largest decline
> Change in retail and recreation visits: -25.5% — 11th largest decline
> Change in grocery and pharmacy visits: -4.3% — 10th smallest decline
> Change in park visits: -21.9% — 3rd largest decline
> Change in public transit use: -41.2% — 9th largest decline
> Confirmed COVID-19 cases as of June 17: 384 per 100,000 people — 16th lowest (total: 11,658)
> Change in trailing 7-day avg. daily cases, June 9 – June 16: 205% — the largest increase (171 to 523)
> Population: 3,034,392

New Hampshire
> Change in time spent at home during 5 weeks through June 12 (compared to pre-pandemic): 12.4% — 17th largest increase
> Change in trips to workplaces: -34.4% — 21st largest decline
> Change in retail and recreation visits: -13.9% — 21st smallest decline
> Change in grocery and pharmacy visits: -1.2% — 2nd smallest decline
> Change in park visits: 110.2% — 16th largest increase
> Change in public transit use: -22.3% — 19th smallest decline
> Confirmed COVID-19 cases as of June 17: 395 per 100,000 people — 21st lowest (total: 5,364)
> Change in trailing 7-day avg. daily cases, June 9 – June 16: -36% — 5th largest decline (52 to 33)
> Population: 1,356,458
[in-text-ad-2]

New Jersey
> Change in time spent at home during 5 weeks through June 12 (compared to pre-pandemic): 17.8% — the largest increase
> Change in trips to workplaces: -43.1% — 3rd largest decline
> Change in retail and recreation visits: -41.5% — 2nd largest decline
> Change in grocery and pharmacy visits: -9.1% — 4th largest decline
> Change in park visits: 83.1% — 22nd largest increase
> Change in public transit use: -53.7% — 4th largest decline
> Confirmed COVID-19 cases as of June 17: 1879 per 100,000 people — 2nd highest (total: 167,426)
> Change in trailing 7-day avg. daily cases, June 9 – June 16: -19% — 10th smallest decline (464 to 376)
> Population: 8,908,520

New Mexico
> Change in time spent at home during 5 weeks through June 12 (compared to pre-pandemic): 11.4% — 22nd largest increase
> Change in trips to workplaces: -32.9% — 25th largest decline
> Change in retail and recreation visits: -19.6% — 21st largest decline
> Change in grocery and pharmacy visits: 4.6% — 10th smallest increase
> Change in park visits: 24.9% — 8th smallest increase
> Change in public transit use: -17.0% — 17th smallest decline
> Confirmed COVID-19 cases as of June 17: 474 per 100,000 people — 23rd highest (total: 9,933)
> Change in trailing 7-day avg. daily cases, June 9 – June 16: -23% — 13th largest decline (154 to 118)
> Population: 2,095,428
[in-text-ad]
New York
> Change in time spent at home during 5 weeks through June 12 (compared to pre-pandemic): 17.0% — 2nd largest increase
> Change in trips to workplaces: -43.6% — the largest decline
> Change in retail and recreation visits: -44.4% — the largest decline
> Change in grocery and pharmacy visits: -8.5% — 6th largest decline
> Change in park visits: 30.6% — 9th smallest increase
> Change in public transit use: -56.4% — 3rd largest decline
> Confirmed COVID-19 cases as of June 17: 1968 per 100,000 people — the highest (total: 384,575)
> Change in trailing 7-day avg. daily cases, June 9 – June 16: -21% — 11th smallest decline (920 to 728)
> Population: 19,542,209

North Carolina
> Change in time spent at home during 5 weeks through June 12 (compared to pre-pandemic): 10.4% — 24th smallest increase
> Change in trips to workplaces: -31.7% — 23rd smallest decline
> Change in retail and recreation visits: -17.3% — 23rd largest decline
> Change in grocery and pharmacy visits: 0.9% — the smallest increase
> Change in park visits: 48.7% — 16th smallest increase
> Change in public transit use: -28.9% — 23rd smallest decline
> Confirmed COVID-19 cases as of June 17: 442 per 100,000 people — 25th lowest (total: 45,853)
> Change in trailing 7-day avg. daily cases, June 9 – June 16: 20% — 7th smallest increase (1,039 to 1,242)
> Population: 10,383,620
North Dakota
> Change in time spent at home during 5 weeks through June 12 (compared to pre-pandemic): 7.4% — 7th smallest increase
> Change in trips to workplaces: -23.7% — 3rd smallest decline
> Change in retail and recreation visits: -7.7% — 10th smallest decline
> Change in grocery and pharmacy visits: 3.0% — 7th smallest increase
> Change in park visits: 122.8% — 10th largest increase
> Change in public transit use: -10.6% — 11th smallest decline
> Confirmed COVID-19 cases as of June 17: 411 per 100,000 people — 23rd lowest (total: 3,124)
> Change in trailing 7-day avg. daily cases, June 9 – June 16: -13% — 7th smallest decline (36 to 32)
> Population: 760,077
[in-text-ad-2]

Ohio
> Change in time spent at home during 5 weeks through June 12 (compared to pre-pandemic): 9.9% — 22nd smallest increase
> Change in trips to workplaces: -31.8% — 24th smallest decline
> Change in retail and recreation visits: -13.9% — 20th smallest decline
> Change in grocery and pharmacy visits: 2.1% — 4th smallest increase
> Change in park visits: 132.0% — 7th largest increase
> Change in public transit use: -11.6% — 12th smallest decline
> Confirmed COVID-19 cases as of June 17: 359 per 100,000 people — 15th lowest (total: 42,010)
> Change in trailing 7-day avg. daily cases, June 9 – June 16: 1% — 3rd smallest increase (402 to 407)
> Population: 11,689,442
Oklahoma
> Change in time spent at home during 5 weeks through June 12 (compared to pre-pandemic): 7.3% — 6th smallest increase
> Change in trips to workplaces: -26.7% — 9th smallest decline
> Change in retail and recreation visits: -3.6% — 3rd smallest decline
> Change in grocery and pharmacy visits: 9.3% — 8th largest increase
> Change in park visits: 70.4% — 24th smallest increase
> Change in public transit use: 0.4% — 4th largest increase
> Confirmed COVID-19 cases as of June 17: 219 per 100,000 people — 10th lowest (total: 8,645)
> Change in trailing 7-day avg. daily cases, June 9 – June 16: 91% — 4th largest increase (96 to 183)
> Population: 3,943,079
[in-text-ad]

Oregon
> Change in time spent at home during 5 weeks through June 12 (compared to pre-pandemic): 11.0% — 24th largest increase
> Change in trips to workplaces: -35.8% — 18th largest decline
> Change in retail and recreation visits: -22.8% — 16th largest decline
> Change in grocery and pharmacy visits: -0.7% — the smallest decline
> Change in park visits: 51.9% — 17th smallest increase
> Change in public transit use: -29.1% — 23rd largest decline
> Confirmed COVID-19 cases as of June 17: 146 per 100,000 people — 5th lowest (total: 6,098)
> Change in trailing 7-day avg. daily cases, June 9 – June 16: 138% — 2nd largest increase (93 to 222)
> Population: 4,190,713

Pennsylvania
> Change in time spent at home during 5 weeks through June 12 (compared to pre-pandemic): 12.8% — 14th largest increase
> Change in trips to workplaces: -36.7% — 15th largest decline
> Change in retail and recreation visits: -26.3% — 10th largest decline
> Change in grocery and pharmacy visits: -5.0% — 12th smallest decline
> Change in park visits: 71.6% — 25th smallest increase
> Change in public transit use: -40.4% — 12th largest decline
> Confirmed COVID-19 cases as of June 17: 621 per 100,000 people — 16th highest (total: 79,483)
> Change in trailing 7-day avg. daily cases, June 9 – June 16: -14% — 8th smallest decline (506 to 435)
> Population: 12,807,060

Rhode Island
> Change in time spent at home during 5 weeks through June 12 (compared to pre-pandemic): 13.1% — 11th largest increase
> Change in trips to workplaces: -36.4% — 17th largest decline
> Change in retail and recreation visits: -17.8% — 22nd largest decline
> Change in grocery and pharmacy visits: -5.9% — 10th largest decline
> Change in park visits: 136.4% — 5th largest increase
> Change in public transit use: -46.1% — 5th largest decline
> Confirmed COVID-19 cases as of June 17: 1529 per 100,000 people — 4th highest (total: 16,164)
> Change in trailing 7-day avg. daily cases, June 9 – June 16: -18% — 9th smallest decline (83 to 68)
> Population: 1,057,315
[in-text-ad-2]
South Carolina
> Change in time spent at home during 5 weeks through June 12 (compared to pre-pandemic): 8.6% — 15th smallest increase
> Change in trips to workplaces: -27.8% — 12th smallest decline
> Change in retail and recreation visits: -8.3% — 11th smallest decline
> Change in grocery and pharmacy visits: 4.7% — 11th smallest increase
> Change in park visits: 38.6% — 12th smallest increase
> Change in public transit use: -2.8% — 5th smallest decline
> Confirmed COVID-19 cases as of June 17: 393 per 100,000 people — 20th lowest (total: 19,990)
> Change in trailing 7-day avg. daily cases, June 9 – June 16: 69% — 8th largest increase (402 to 680)
> Population: 5,084,127
South Dakota
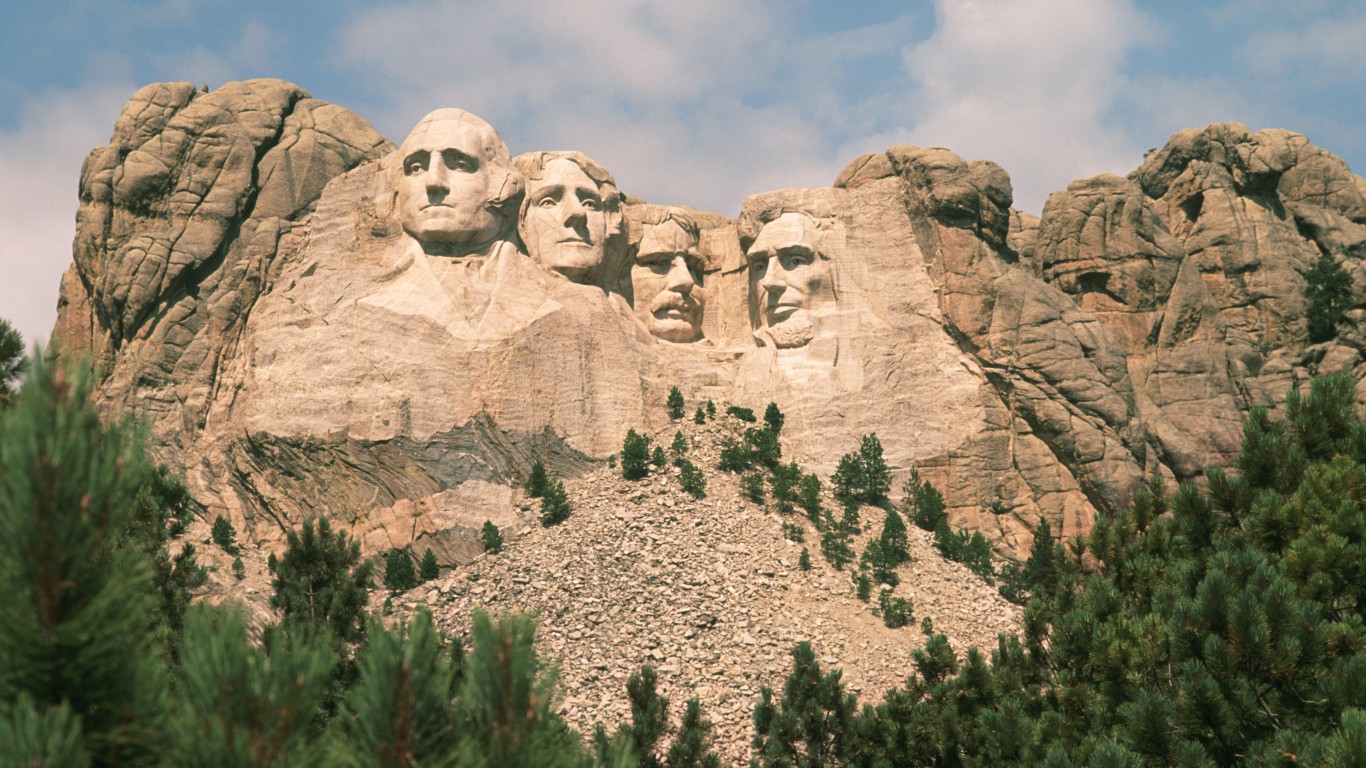
> Change in time spent at home during 5 weeks through June 12 (compared to pre-pandemic): 7.9% — 10th smallest increase
> Change in trips to workplaces: -24.6% — 4th smallest decline
> Change in retail and recreation visits: -4.1% — 6th smallest decline
> Change in grocery and pharmacy visits: 18.6% — the largest increase
> Change in park visits: 193.7% — the largest increase
> Change in public transit use: 7.8% — 2nd largest increase
> Confirmed COVID-19 cases as of June 17: 676 per 100,000 people — 12th highest (total: 5,966)
> Change in trailing 7-day avg. daily cases, June 9 – June 16: -9% — 5th smallest decline (70 to 63)
> Population: 882,235
[in-text-ad]
Tennessee
> Change in time spent at home during 5 weeks through June 12 (compared to pre-pandemic): 8.0% — 11th smallest increase
> Change in trips to workplaces: -28.2% — 14th smallest decline
> Change in retail and recreation visits: -7.6% — 9th smallest decline
> Change in grocery and pharmacy visits: 5.3% — 14th largest increase
> Change in park visits: 67.4% — 23rd smallest increase
> Change in public transit use: -15.6% — 16th smallest decline
> Confirmed COVID-19 cases as of June 17: 470 per 100,000 people — 25th highest (total: 31,830)
> Change in trailing 7-day avg. daily cases, June 9 – June 16: 33% — 11th smallest increase (457 to 608)
> Population: 6,770,010

Texas
> Change in time spent at home during 5 weeks through June 12 (compared to pre-pandemic): 11.9% — 19th largest increase
> Change in trips to workplaces: -32.6% — 25th smallest decline
> Change in retail and recreation visits: -16.9% — 25th largest decline
> Change in grocery and pharmacy visits: -2.7% — 5th smallest decline
> Change in park visits: 7.1% — 7th smallest increase
> Change in public transit use: -30.0% — 20th largest decline
> Confirmed COVID-19 cases as of June 17: 325 per 100,000 people — 13th lowest (total: 93,206)
> Change in trailing 7-day avg. daily cases, June 9 – June 16: 49% — 11th largest increase (1,526 to 2,279)
> Population: 28,701,845

Utah
> Change in time spent at home during 5 weeks through June 12 (compared to pre-pandemic): 9.6% — 20th smallest increase
> Change in trips to workplaces: -34.5% — 20th largest decline
> Change in retail and recreation visits: -12.8% — 16th smallest decline
> Change in grocery and pharmacy visits: 8.7% — 9th largest increase
> Change in park visits: 118.5% — 13th largest increase
> Change in public transit use: -29.1% — 22nd largest decline
> Confirmed COVID-19 cases as of June 17: 473 per 100,000 people — 24th highest (total: 14,937)
> Change in trailing 7-day avg. daily cases, June 9 – June 16: 1% — 2nd smallest increase (337 to 340)
> Population: 3,161,105
[in-text-ad-2]

Vermont
> Change in time spent at home during 5 weeks through June 12 (compared to pre-pandemic): 11.8% — 20th largest increase
> Change in trips to workplaces: -37.5% — 12th largest decline
> Change in retail and recreation visits: -23.2% — 15th largest decline
> Change in grocery and pharmacy visits: -7.9% — 7th largest decline
> Change in park visits: 92.0% — 19th largest increase
> Change in public transit use: -36.9% — 17th largest decline
> Confirmed COVID-19 cases as of June 17: 180 per 100,000 people — 6th lowest (total: 1,130)
> Change in trailing 7-day avg. daily cases, June 9 – June 16: -51% — 4th largest decline (14 to 7)
> Population: 626,299

Virginia
> Change in time spent at home during 5 weeks through June 12 (compared to pre-pandemic): 13.7% — 8th largest increase
> Change in trips to workplaces: -37.6% — 10th largest decline
> Change in retail and recreation visits: -24.4% — 12th largest decline
> Change in grocery and pharmacy visits: -3.5% — 9th smallest decline
> Change in park visits: 53.0% — 18th smallest increase
> Change in public transit use: -36.9% — 16th largest decline
> Confirmed COVID-19 cases as of June 17: 655 per 100,000 people — 15th highest (total: 55,775)
> Change in trailing 7-day avg. daily cases, June 9 – June 16: -58% — 3rd largest decline (1,227 to 513)
> Population: 8,517,685
[in-text-ad]

Washington
> Change in time spent at home during 5 weeks through June 12 (compared to pre-pandemic): 13.2% — 10th largest increase
> Change in trips to workplaces: -40.1% — 6th largest decline
> Change in retail and recreation visits: -27.9% — 7th largest decline
> Change in grocery and pharmacy visits: -3.3% — 8th smallest decline
> Change in park visits: 63.0% — 22nd smallest increase
> Change in public transit use: -41.2% — 10th largest decline
> Confirmed COVID-19 cases as of June 17: 352 per 100,000 people — 14th lowest (total: 26,531)
> Change in trailing 7-day avg. daily cases, June 9 – June 16: -24% — 11th largest decline (340 to 258)
> Population: 7,535,591

West Virginia
> Change in time spent at home during 5 weeks through June 12 (compared to pre-pandemic): 7.5% — 8th smallest increase
> Change in trips to workplaces: -27.4% — 11th smallest decline
> Change in retail and recreation visits: -6.5% — 8th smallest decline
> Change in grocery and pharmacy visits: 6.3% — 11th largest increase
> Change in park visits: 57.3% — 20th smallest increase
> Change in public transit use: -0.4% — the smallest decline
> Confirmed COVID-19 cases as of June 17: 130 per 100,000 people — 4th lowest (total: 2,341)
> Change in trailing 7-day avg. daily cases, June 9 – June 16: 28% — 10th smallest increase (25 to 32)
> Population: 1,805,832
Wisconsin
> Change in time spent at home during 5 weeks through June 12 (compared to pre-pandemic): 10.7% — 25th smallest increase
> Change in trips to workplaces: -30.2% — 21st smallest decline
> Change in retail and recreation visits: -16.8% — 24th smallest decline
> Change in grocery and pharmacy visits: 3.5% — 8th smallest increase
> Change in park visits: 155.9% — 2nd largest increase
> Change in public transit use: -13.4% — 13th smallest decline
> Confirmed COVID-19 cases as of June 17: 399 per 100,000 people — 22nd lowest (total: 23,198)
> Change in trailing 7-day avg. daily cases, June 9 – June 16: -21% — 12th smallest decline (342 to 270)
> Population: 5,813,568
[in-text-ad-2]
Wyoming
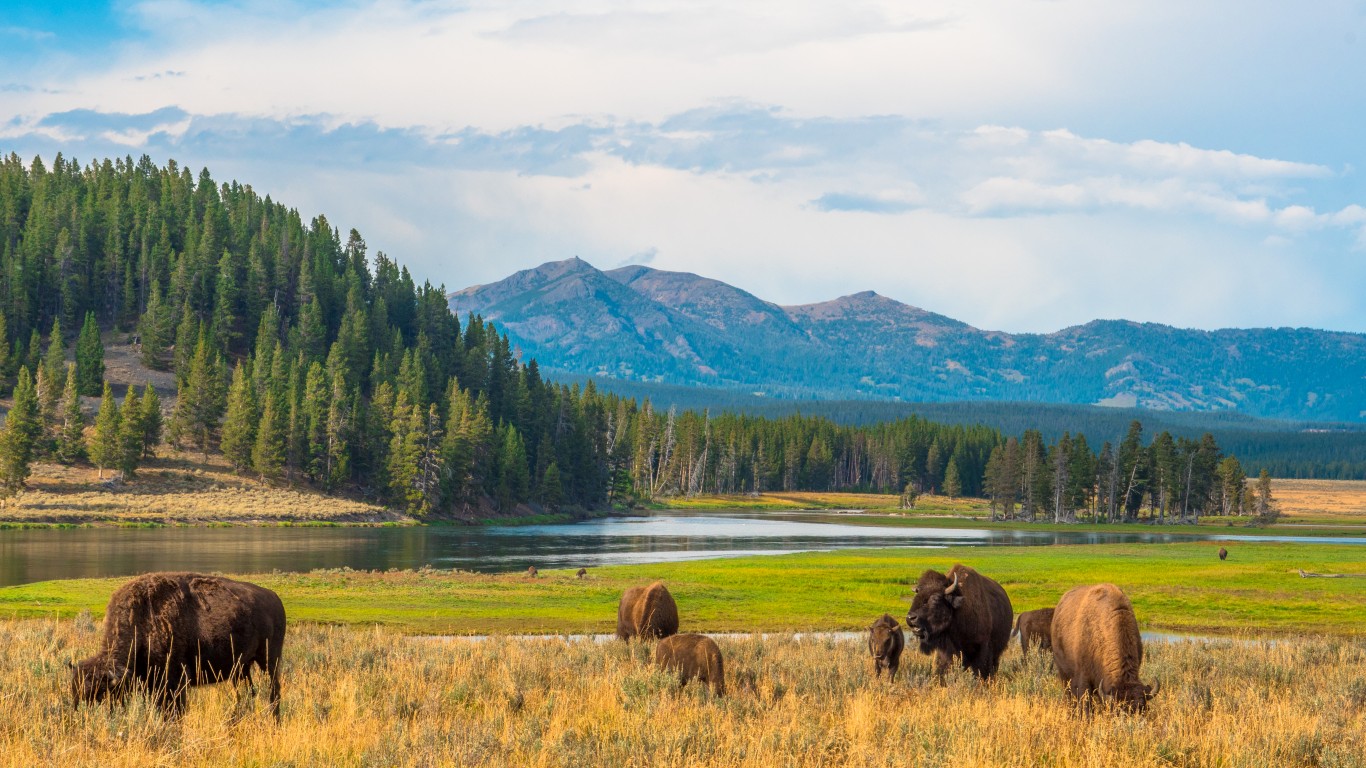
> Change in time spent at home during 5 weeks through June 12 (compared to pre-pandemic): 5.8% — 2nd smallest increase
> Change in trips to workplaces: -22.8% — the smallest decline
> Change in retail and recreation visits: -2.5% — the smallest decline
> Change in grocery and pharmacy visits: 13.8% — 4th largest increase
> Change in park visits: 112.6% — 15th largest increase
> Change in public transit use: 16.3% — the largest increase
> Confirmed COVID-19 cases as of June 17: 188 per 100,000 people — 7th lowest (total: 1,089)
> Change in trailing 7-day avg. daily cases, June 9 – June 16: 82% — 7th largest increase (9 to 16)
> Population: 577,737
Methodology
To determine how social distancing has influenced where people go in every state, 24/7 Wall St. analyzed mobility data from Google. Google’s mobility database covers for every state changes in mobility from Google’s baseline for every day between Feb 15 and June 15. This data is updated every 2 to 3 days. The baseline is the median value, for the corresponding day of the week, during the 5-week period Jan 3 – Feb 6, 2020. The baseline represents a typical amount of travel for a region over the five weeks between Jan 3 and Feb 6, 2020.
We calculated for every state average changes in daily mobility in six categories — residential, retail and recreation, grocery and pharmacy, parks, transit stations, and workplaces — over the five weeks ending June 12, 2020.
Google does not share absolute visitor numbers. Google’s calculations are based on data from Google users who have opted-in to Location History for their Google Account. Because the data represents a sample of Google users, the calculations may or may not represent the exact behavior of a wider population.
Data on COVID-19 case counts came from state and local health departments and was adjusted for population using data from the U.S. Census Bureau’s American Community Survey.
The Average American Is Losing Momentum On Their Savings Every Day (Sponsor)
If you’re like many Americans and keep your money ‘safe’ in a checking or savings account, think again. The average yield on a savings account is a paltry .4%1 today. Checking accounts are even worse.
But there is good news. To win qualified customers, some accounts are paying more than 7x the national average. That’s an incredible way to keep your money safe and earn more at the same time. Our top pick for high yield savings accounts includes other benefits as well. You can earn up to 4.00% with a Checking & Savings Account today Sign up and get up to $300 with direct deposit. No account fees. FDIC Insured.
Click here to see how much more you could be earning on your savings today. It takes just a few minutes to open an account to make your money work for you.
Thank you for reading! Have some feedback for us?
Contact the 24/7 Wall St. editorial team.