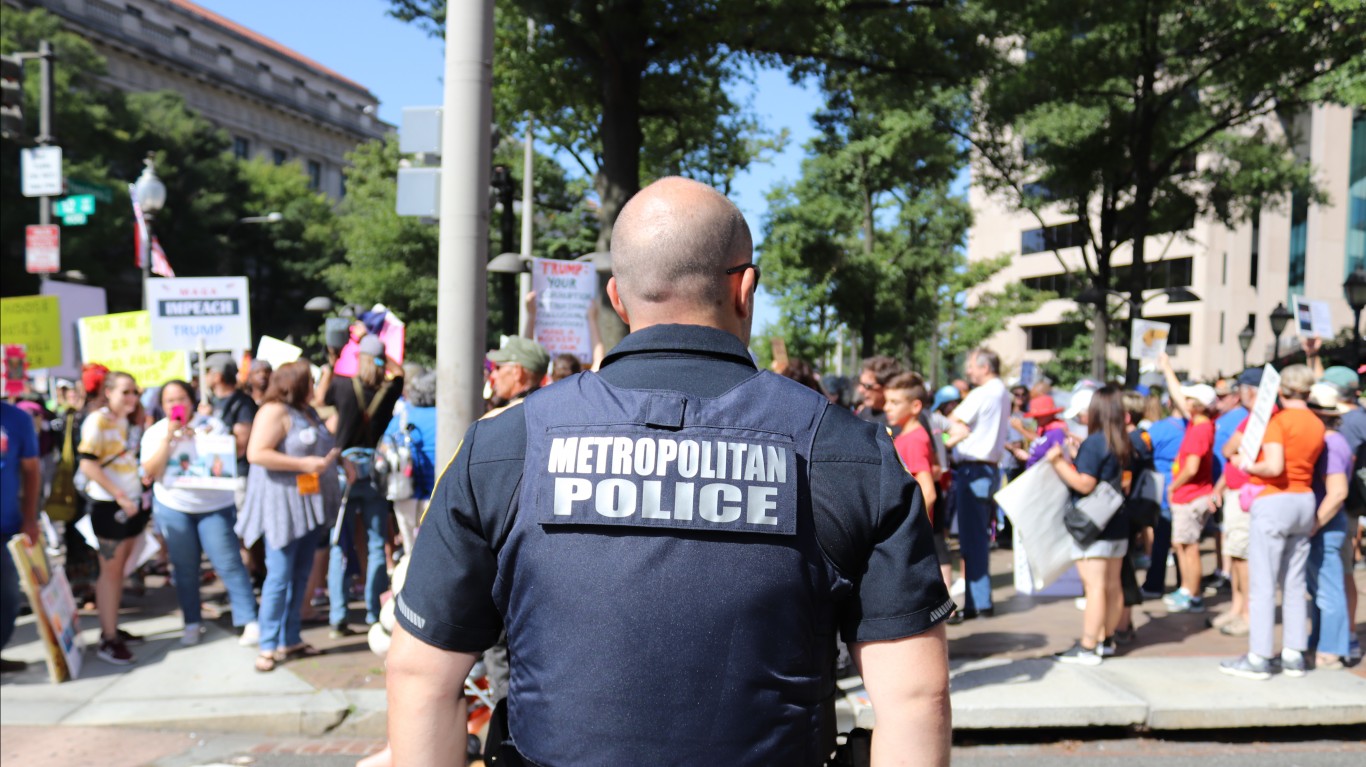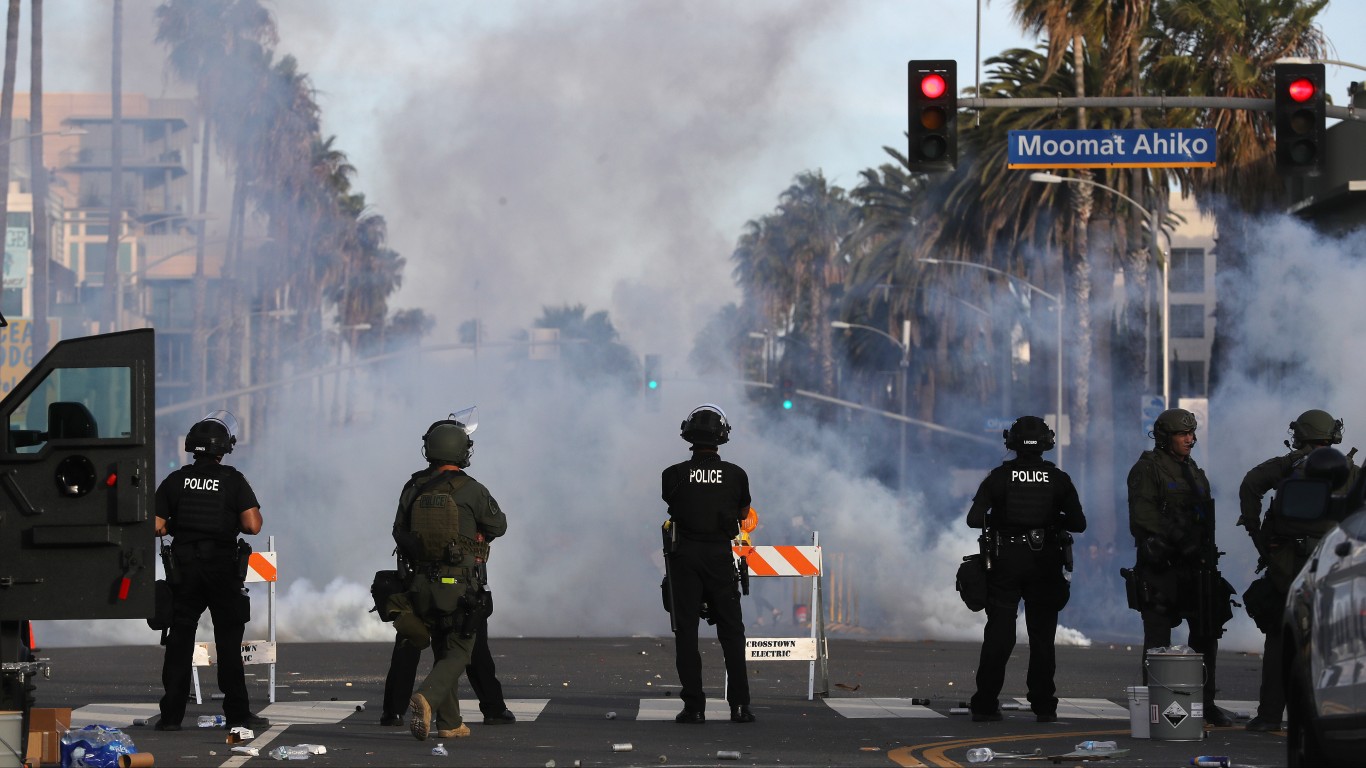
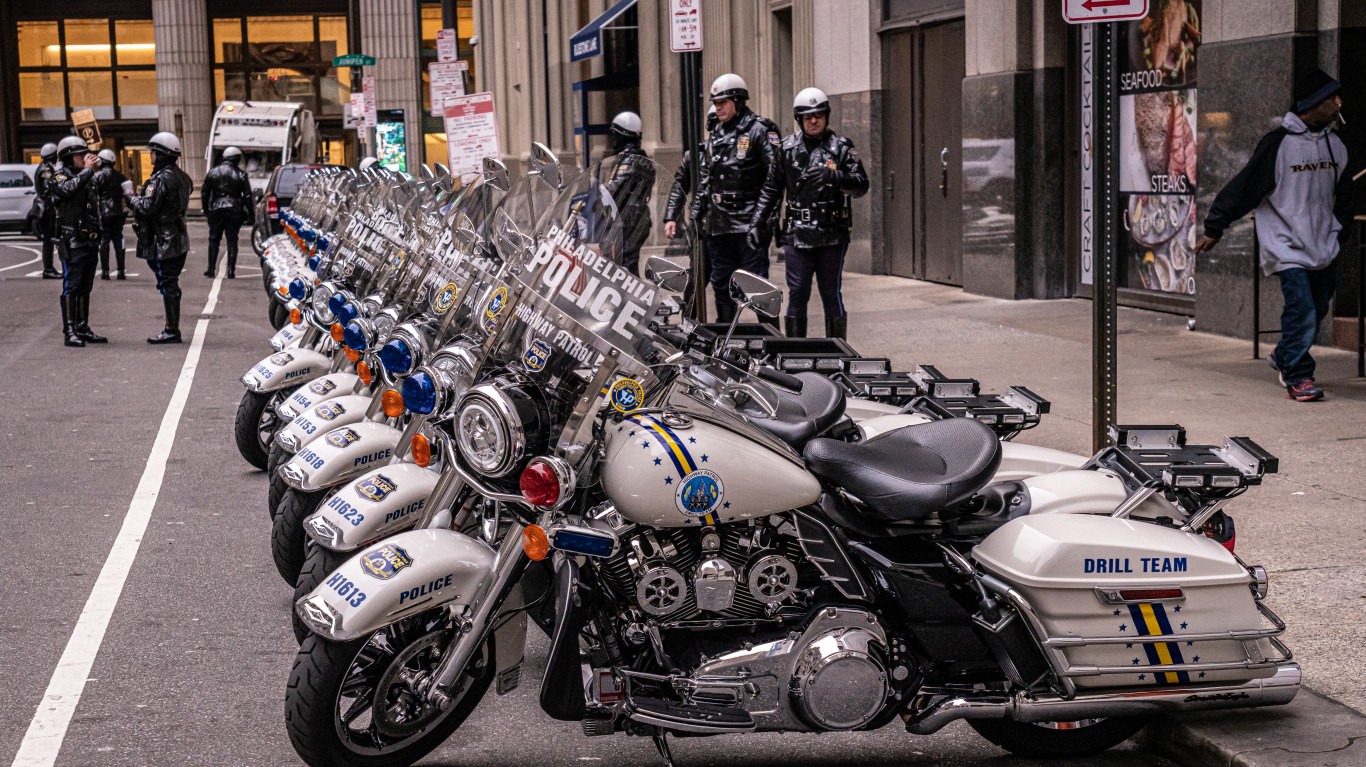
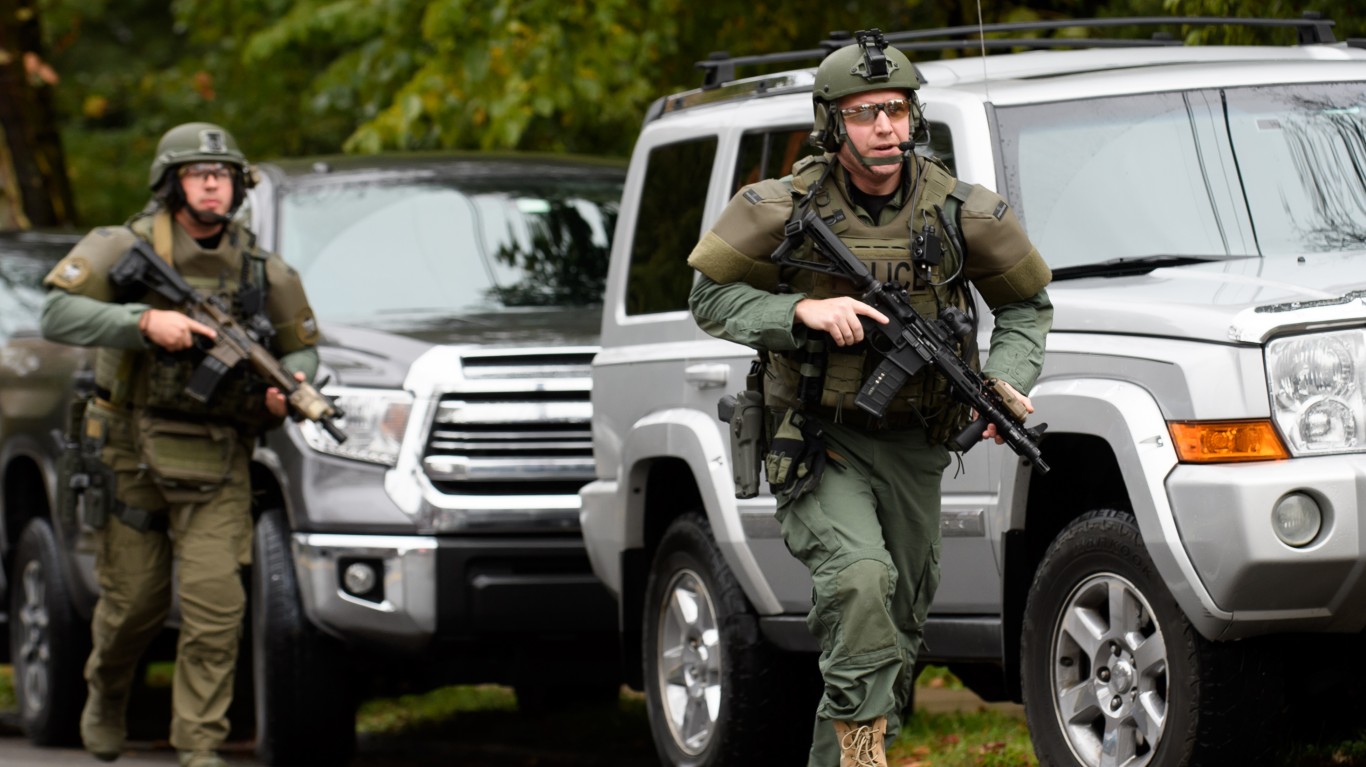
Public outcry over the killing of Black Americans by police and the protests that followed have called for an overhaul of law enforcement tactics and training, as well as the demilitarization of police departments around the country.
24/7 Wall St. reviewed the number of police department employees for every 100,000 people in the 1,843 U.S. cities with populations of 20,000 or more from the FBI’s 2018 Uniform Crime Report (UCR).
Click here to read about the cities with most police per capita.
Click here to read our methodology.
While many of the nation’s largest cities are on this list, there are also relatively small cities with large police forces. For example, two cities on our list have populations of fewer than 35,000 people but more police per capita than New York City — the city with the nation’s largest police force. For reference, there are about 282 law enforcement employees per 100,000 people nationwide.
Relatively high numbers of violent crimes are reported in the majority of the cities with the largest police forces. Thirty-five of the 50 cities on this list have a higher reported violent crime rate than the national average.
According to a report in 2019 from USA Today done in collaboration with the Marshall Project and the Memphis Commercial Appeal, there is scant evidence that deploying more police correlates to less crime. Alexander Weiss, a police staffing consultant, said in the story that most police departments have more issues about how law enforcement resources are deployed and scheduled, and fewer concerns about their actual staffing numbers.
Across the nation, majority Black communities are more likely to have relatively large police departments than areas with relatively fewer Black residents. In roughly 4 out of every 5 cities on this list, Black residents make up a greater share of the population than the national share of 12.7%. (Here are the worst cities for Black Americans.)
Relatedly, poor communities are considerably more likely than more affluent ones to have among the largest police departments. Of the 50 cities on this list, 37 have higher poverty rates than the national 14.1% rate, and many have among the highest poverty rates of any U.S. city.

50. Mount Vernon, New York
> Total population: 68,889
> Law enforcement employees per 100K: 390
> Total law enforcement employees: 269 (207 officers, 62 civilian employees)
> Violent crimes reported per 100K in 2018: 510 (332nd highest of 1,843 cities with pop. of 20K or more)
> Property crime reported per 100K in 2018: 1,415 (1,122nd highest of 1,843 cities with pop. of 20K or more)
> % of people below poverty level: 14.7% (676th highest of 1,843 cities with pop. of 20K or more)
> Pct. black: 65.8% (25th highest of 1,843 cities with pop. of 20K or more)
[in-text-ad]
49. Boston, Massachusetts
> Total population: 694,673
> Law enforcement employees per 100K: 391
> Total law enforcement employees: 2,715 (2,122 officers, 593 civilian employees)
> Violent crimes reported per 100K in 2018: 622 (231st highest of 1,843 cities with pop. of 20K or more)
> Property crime reported per 100K in 2018: 2,016 (834th highest of 1,843 cities with pop. of 20K or more)
> % of people below poverty level: 20.2% (350th highest of 1,843 cities with pop. of 20K or more)
> Pct. black: 25.3% (233rd highest of 1,843 cities with pop. of 20K or more)
48. Galveston, Texas
> Total population: 50,896
> Law enforcement employees per 100K: 393
> Total law enforcement employees: 200 (142 officers, 58 civilian employees)
> Violent crimes reported per 100K in 2018: 521 (317th highest of 1,843 cities with pop. of 20K or more)
> Property crime reported per 100K in 2018: 3,024 (406th highest of 1,843 cities with pop. of 20K or more)
> % of people below poverty level: 20.8% (319th highest of 1,843 cities with pop. of 20K or more)
> Pct. black: 18.3% (361st highest of 1,843 cities with pop. of 20K or more)
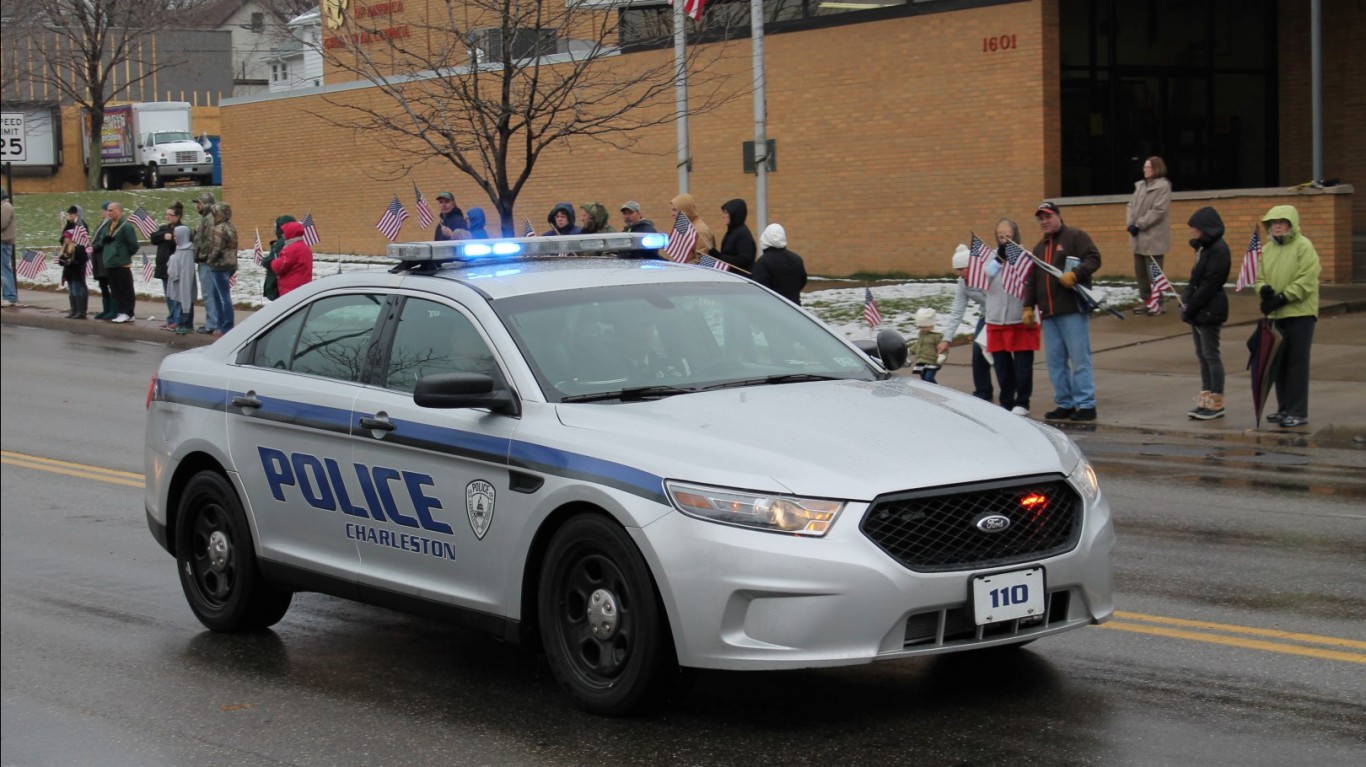
47. Charleston, West Virginia
> Total population: 47,470
> Law enforcement employees per 100K: 394
> Total law enforcement employees: 187 (163 officers, 24 civilian employees)
> Violent crimes reported per 100K in 2018: 697 (183rd highest of 1,843 cities with pop. of 20K or more)
> Property crime reported per 100K in 2018: 6,010 (25th highest of 1,843 cities with pop. of 20K or more)
> % of people below poverty level: 20.6% (330th highest of 1,843 cities with pop. of 20K or more)
> Pct. black: 15.4% (417th highest of 1,843 cities with pop. of 20K or more)
[in-text-ad-2]
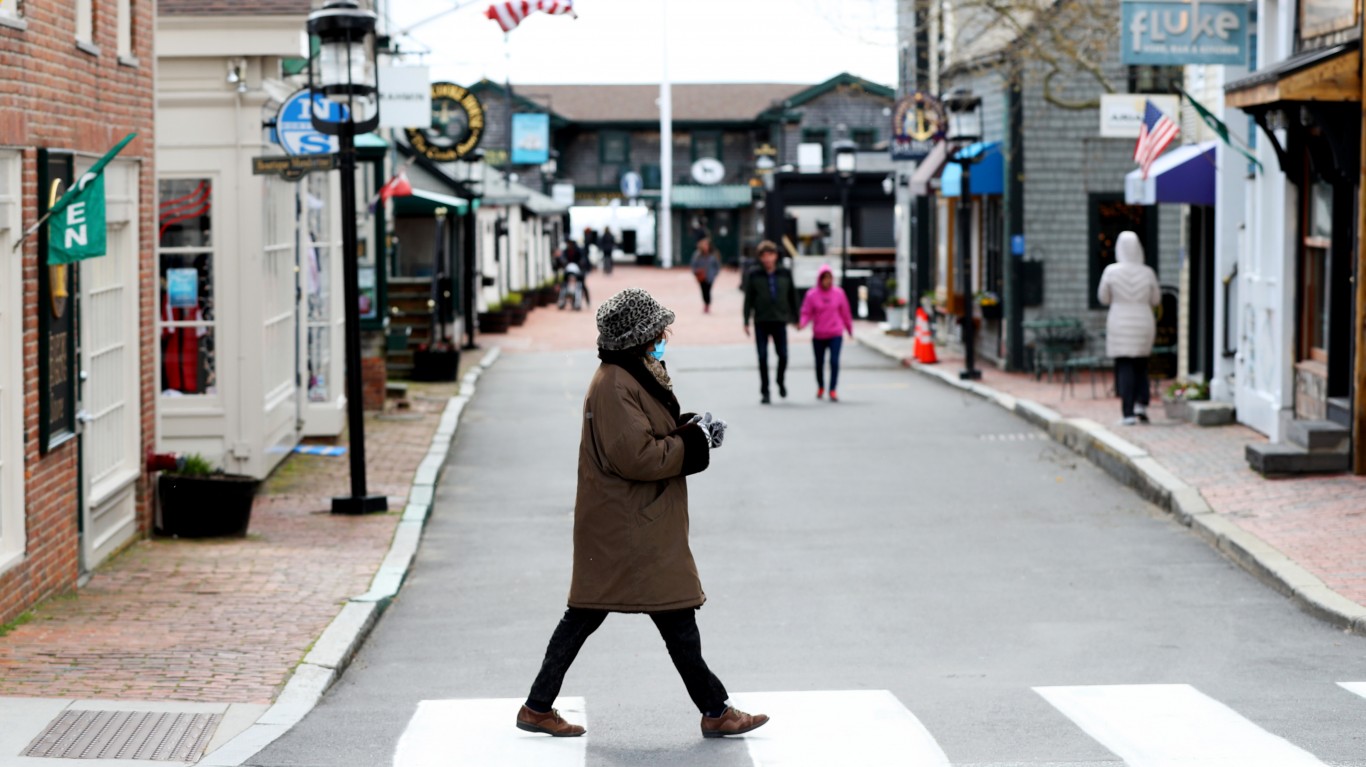
46. Newport, Rhode Island
> Total population: 24,863
> Law enforcement employees per 100K: 394
> Total law enforcement employees: 98 (80 officers, 18 civilian employees)
> Violent crimes reported per 100K in 2018: 342 (584th highest of 1,843 cities with pop. of 20K or more)
> Property crime reported per 100K in 2018: 2,413 (651st highest of 1,843 cities with pop. of 20K or more)
> % of people below poverty level: 14.4% (702nd highest of 1,843 cities with pop. of 20K or more)
> Pct. black: 6.4% (769th highest of 1,843 cities with pop. of 20K or more)
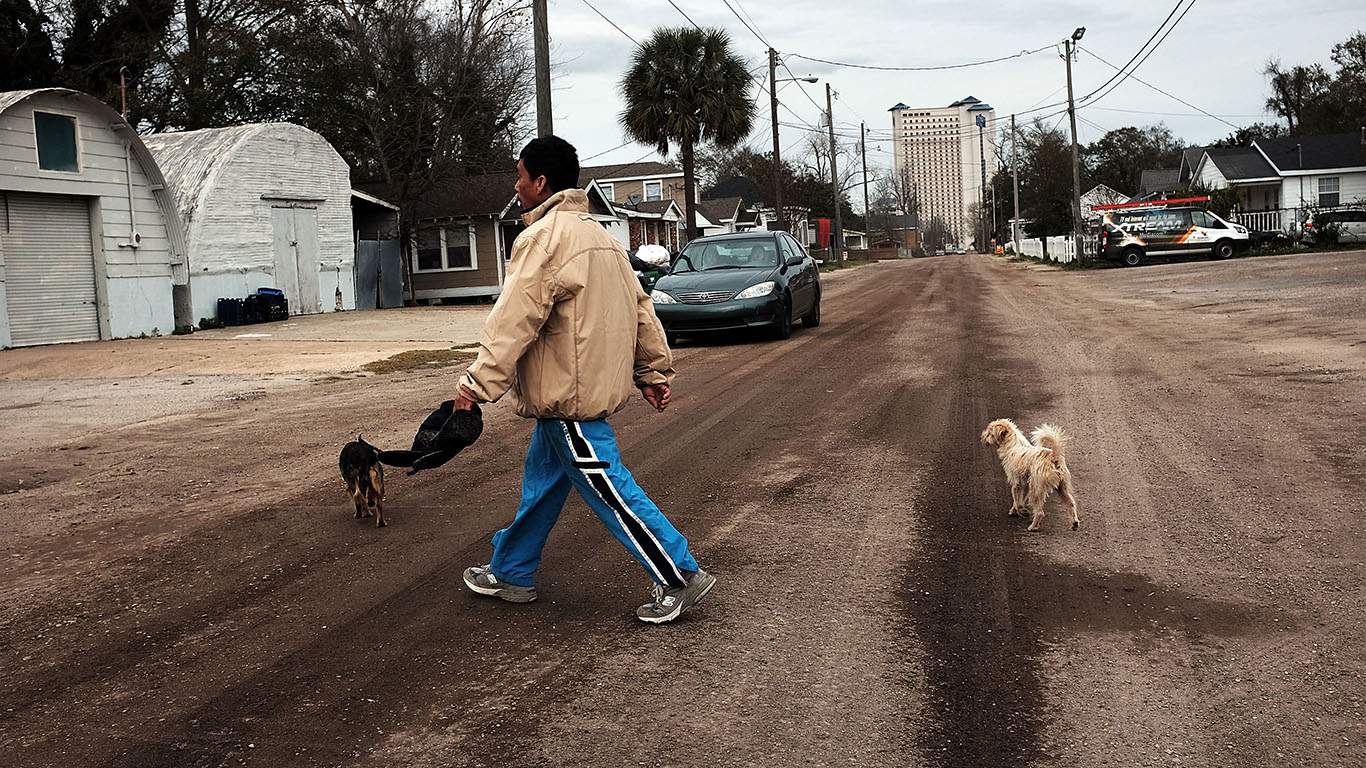
45. Biloxi, Mississippi
> Total population: 46,148
> Law enforcement employees per 100K: 397
> Total law enforcement employees: 183 (130 officers, 53 civilian employees)
> Violent crimes reported per 100K in 2018: 323 (616th highest of 1,843 cities with pop. of 20K or more)
> Property crime reported per 100K in 2018: 5,584 (34th highest of 1,843 cities with pop. of 20K or more)
> % of people below poverty level: 20.0% (361st highest of 1,843 cities with pop. of 20K or more)
> Pct. black: 21.4% (288th highest of 1,843 cities with pop. of 20K or more)
[in-text-ad]

44. Memphis, Tennessee
> Total population: 652,226
> Law enforcement employees per 100K: 399
> Total law enforcement employees: 2,605 (1,995 officers, 610 civilian employees)
> Violent crimes reported per 100K in 2018: 1,943 (4th highest of 1,843 cities with pop. of 20K or more)
> Property crime reported per 100K in 2018: 6,406 (18th highest of 1,843 cities with pop. of 20K or more)
> % of people below poverty level: 26.8% (133rd highest of 1,843 cities with pop. of 20K or more)
> Pct. black: 64.2% (27th highest of 1,843 cities with pop. of 20K or more)
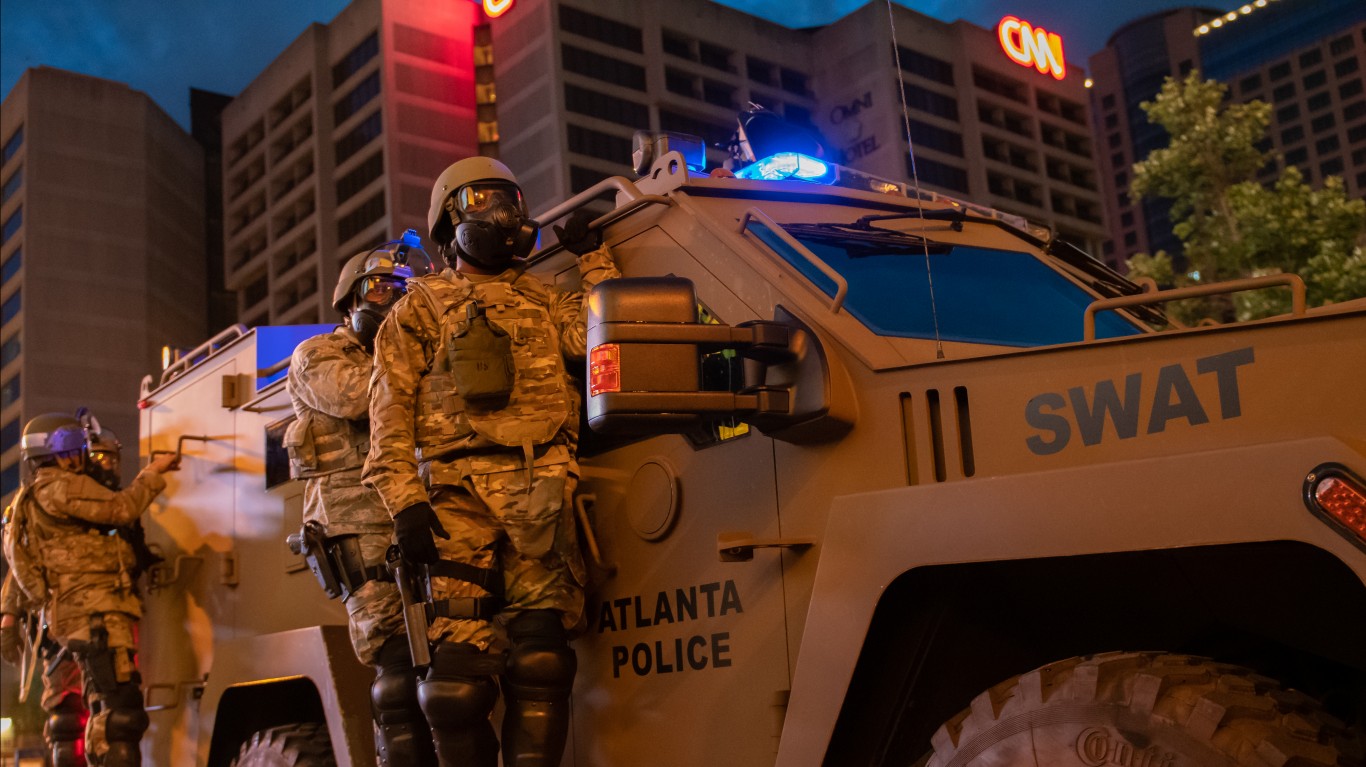
43. Atlanta, Georgia
> Total population: 496,106
> Law enforcement employees per 100K: 401
> Total law enforcement employees: 1,987 (1,535 officers, 452 civilian employees)
> Violent crimes reported per 100K in 2018: 769 (137th highest of 1,843 cities with pop. of 20K or more)
> Property crime reported per 100K in 2018: 4,654 (97th highest of 1,843 cities with pop. of 20K or more)
> % of people below poverty level: 21.6% (289th highest of 1,843 cities with pop. of 20K or more)
> Pct. black: 51.8% (54th highest of 1,843 cities with pop. of 20K or more)

42. East Orange, New Jersey
> Total population: 64,625
> Law enforcement employees per 100K: 404
> Total law enforcement employees: 261 (202 officers, 59 civilian employees)
> Violent crimes reported per 100K in 2018: 515 (327th highest of 1,843 cities with pop. of 20K or more)
> Property crime reported per 100K in 2018: 1,399 (1,132nd highest of 1,843 cities with pop. of 20K or more)
> % of people below poverty level: 19.1% (410th highest of 1,843 cities with pop. of 20K or more)
> Pct. black: 85.3% (3rd highest of 1,843 cities with pop. of 20K or more)
[in-text-ad-2]
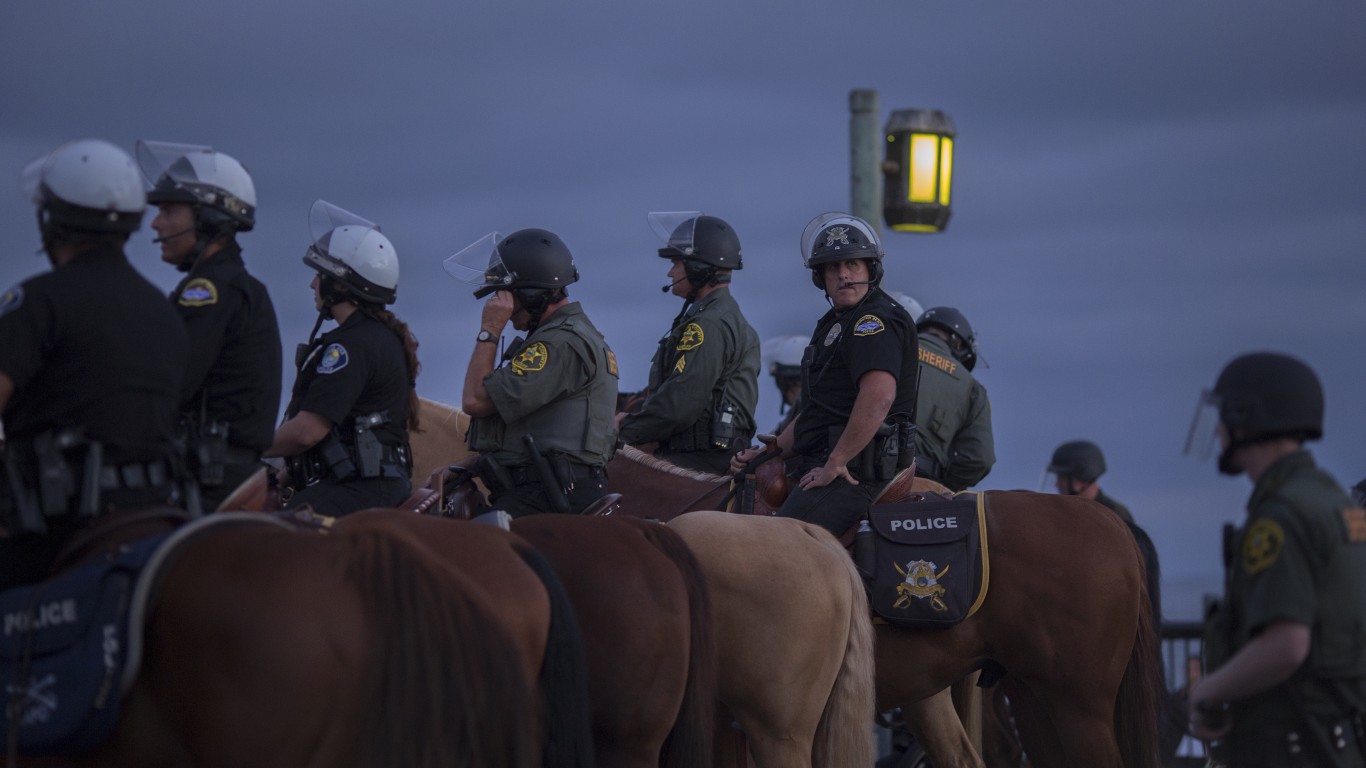
41. Laguna Beach, California
> Total population: 23,202
> Law enforcement employees per 100K: 405
> Total law enforcement employees: 94 (55 officers, 39 civilian employees)
> Violent crimes reported per 100K in 2018: 388 (498th highest of 1,843 cities with pop. of 20K or more)
> Property crime reported per 100K in 2018: 1,909 (880th highest of 1,843 cities with pop. of 20K or more)
> % of people below poverty level: 6.8% (1,269th highest of 1,843 cities with pop. of 20K or more)
> Pct. black: 0.8% (1,482nd highest of 1,843 cities with pop. of 20K or more)
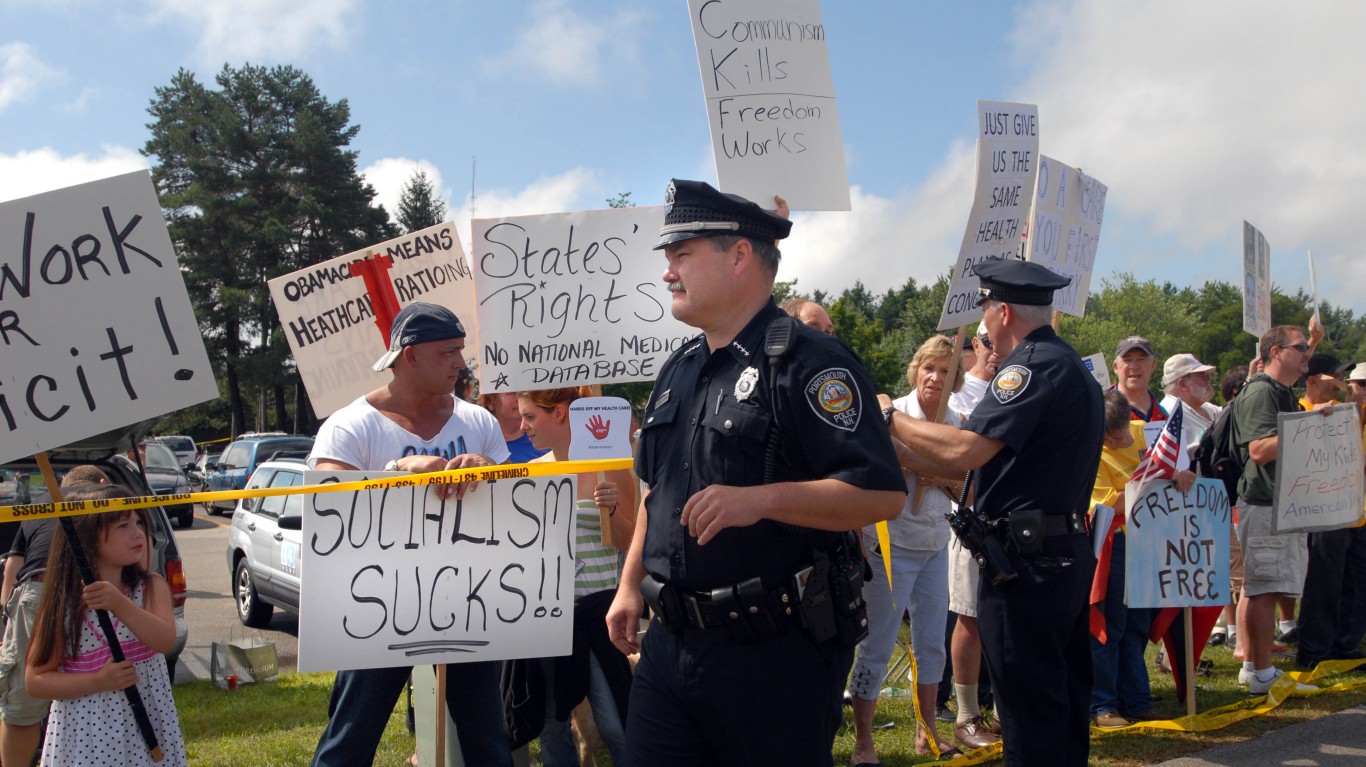
40. Portsmouth, New Hampshire
> Total population: 22,038
> Law enforcement employees per 100K: 408
> Total law enforcement employees: 90 (69 officers, 21 civilian employees)
> Violent crimes reported per 100K in 2018: 163 (1,274th highest of 1,843 cities with pop. of 20K or more)
> Property crime reported per 100K in 2018: 1,547 (1,046th highest of 1,843 cities with pop. of 20K or more)
> % of people below poverty level: 6.1% (1,324th highest of 1,843 cities with pop. of 20K or more)
> Pct. black: 2.6% (1,146th highest of 1,843 cities with pop. of 20K or more)
[in-text-ad]

39. Forest Park, Georgia
> Total population: 20,024
> Law enforcement employees per 100K: 410
> Total law enforcement employees: 82 (60 officers, 22 civilian employees)
> Violent crimes reported per 100K in 2018: 669 (198th highest of 1,843 cities with pop. of 20K or more)
> Property crime reported per 100K in 2018: 4,804 (86th highest of 1,843 cities with pop. of 20K or more)
> % of people below poverty level: 28.1% (109th highest of 1,843 cities with pop. of 20K or more)
> Pct. black: 45.5% (81st highest of 1,843 cities with pop. of 20K or more)

38. Albany, New York
> Total population: 98,322
> Law enforcement employees per 100K: 411
> Total law enforcement employees: 404 (316 officers, 88 civilian employees)
> Violent crimes reported per 100K in 2018: 837 (115th highest of 1,843 cities with pop. of 20K or more)
> Property crime reported per 100K in 2018: 3,201 (349th highest of 1,843 cities with pop. of 20K or more)
> % of people below poverty level: 23.8% (216th highest of 1,843 cities with pop. of 20K or more)
> Pct. black: 29.9% (184th highest of 1,843 cities with pop. of 20K or more)
37. Irvington, New Jersey
> Total population: 54,220
> Law enforcement employees per 100K: 411
> Total law enforcement employees: 223 (168 officers, 55 civilian employees)
> Violent crimes reported per 100K in 2018: 300 (662nd highest of 1,843 cities with pop. of 20K or more)
> Property crime reported per 100K in 2018: 999 (1,281st highest of 1,843 cities with pop. of 20K or more)
> % of people below poverty level: N/A
> Pct. black: N/A
[in-text-ad-2]
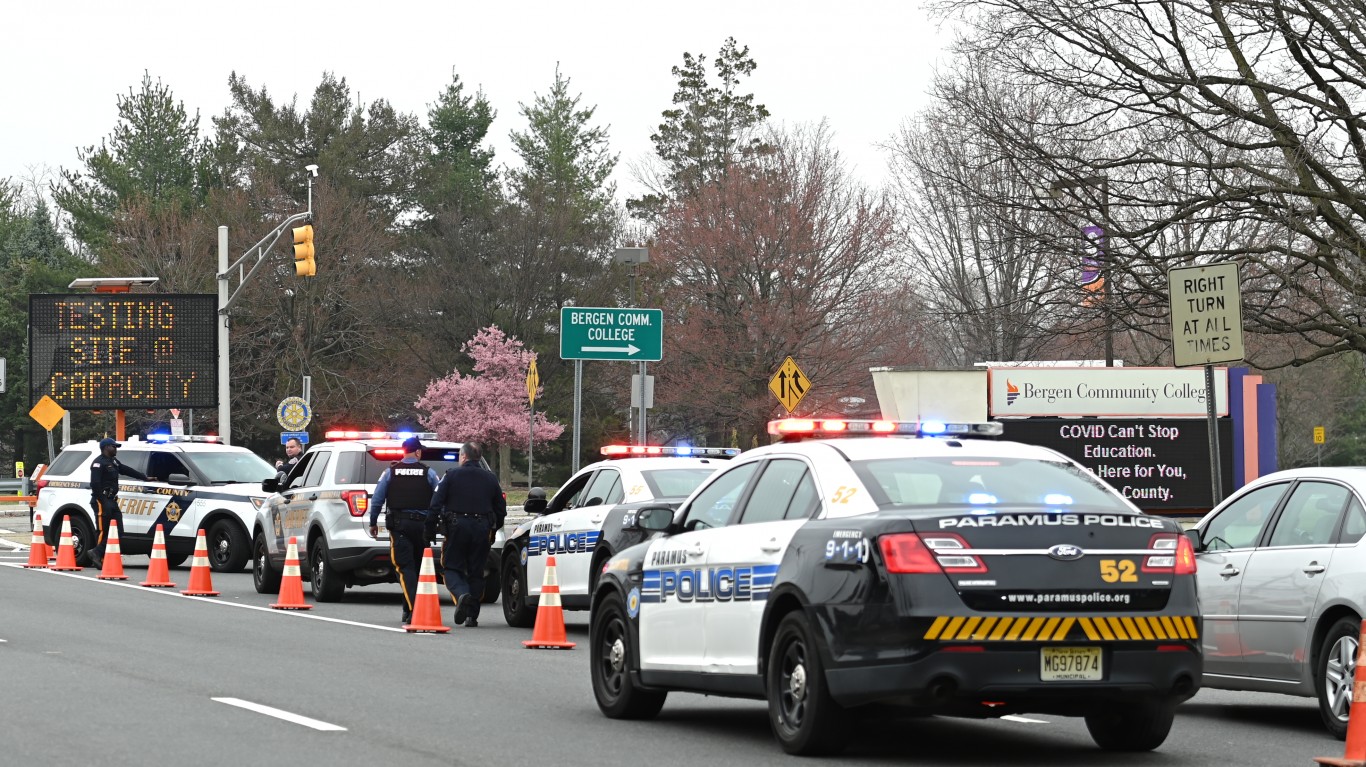
36. Paramus, New Jersey
> Total population: 26,744
> Law enforcement employees per 100K: 411
> Total law enforcement employees: 110 (91 officers, 19 civilian employees)
> Violent crimes reported per 100K in 2018: 90 (1,517th highest of 1,843 cities with pop. of 20K or more)
> Property crime reported per 100K in 2018: 3,990 (187th highest of 1,843 cities with pop. of 20K or more)
> % of people below poverty level: 2.4% (1,564th highest of 1,843 cities with pop. of 20K or more)
> Pct. black: 3.0% (1,095th highest of 1,843 cities with pop. of 20K or more)
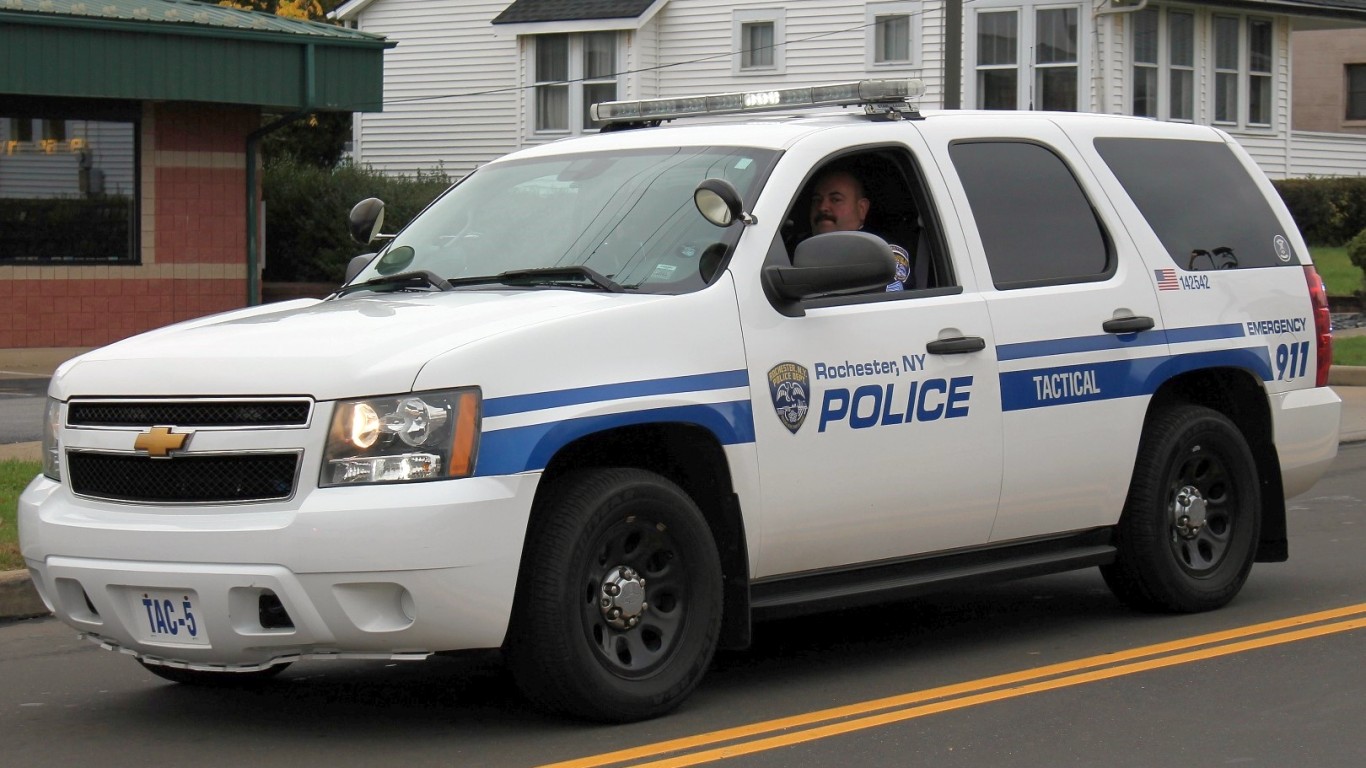
35. Rochester, New York
> Total population: 207,701
> Law enforcement employees per 100K: 416
> Total law enforcement employees: 863 (747 officers, 116 civilian employees)
> Violent crimes reported per 100K in 2018: 778 (135th highest of 1,843 cities with pop. of 20K or more)
> Property crime reported per 100K in 2018: 3,388 (297th highest of 1,843 cities with pop. of 20K or more)
> % of people below poverty level: 32.6% (43rd highest of 1,843 cities with pop. of 20K or more)
> Pct. black: 40.3% (112nd highest of 1,843 cities with pop. of 20K or more)
[in-text-ad]
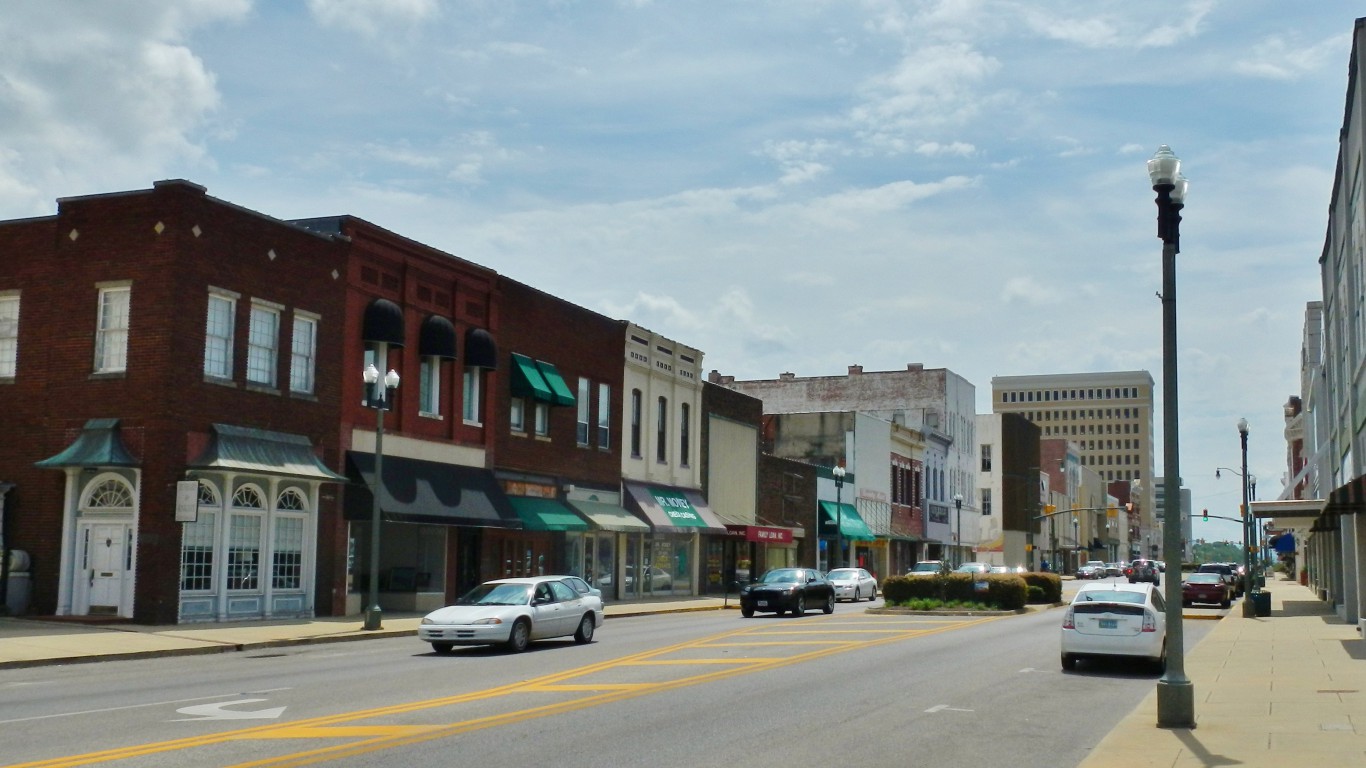
34. Anniston, Alabama
> Total population: 21,592
> Law enforcement employees per 100K: 417
> Total law enforcement employees: 90 (85 officers, 5 civilian employees)
> Violent crimes reported per 100K in 2018: 2,992 (1st highest of 1,843 cities with pop. of 20K or more)
> Property crime reported per 100K in 2018: 7,855 (6th highest of 1,843 cities with pop. of 20K or more)
> % of people below poverty level: 29.1% (96th highest of 1,843 cities with pop. of 20K or more)
> Pct. black: 52.1% (52nd highest of 1,843 cities with pop. of 20K or more)
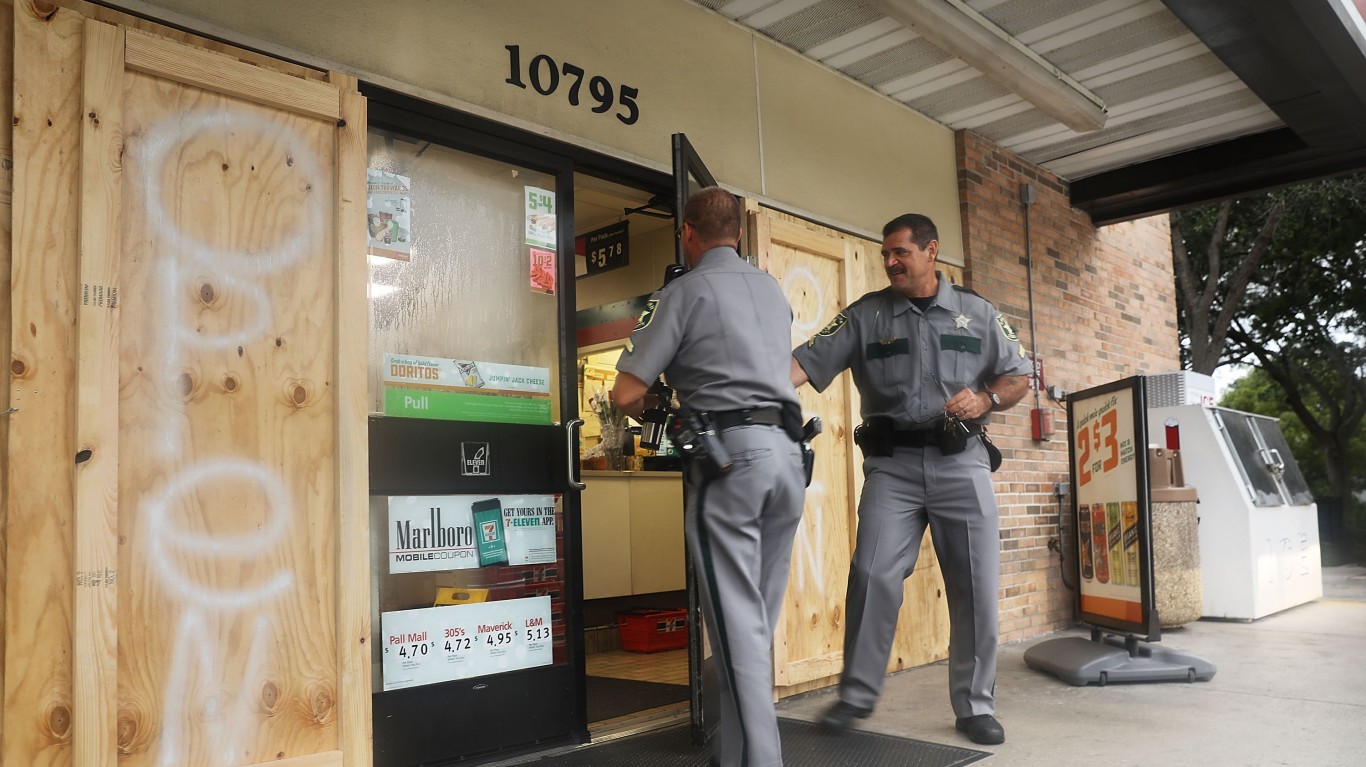
33. Naples, Florida
> Total population: 22,308
> Law enforcement employees per 100K: 417
> Total law enforcement employees: 93 (66 officers, 27 civilian employees)
> Violent crimes reported per 100K in 2018: 40 (1,648th highest of 1,843 cities with pop. of 20K or more)
> Property crime reported per 100K in 2018: 1,434 (1,112nd highest of 1,843 cities with pop. of 20K or more)
> % of people below poverty level: 9.0% (1,096th highest of 1,843 cities with pop. of 20K or more)
> Pct. black: 4.8% (903rd highest of 1,843 cities with pop. of 20K or more)
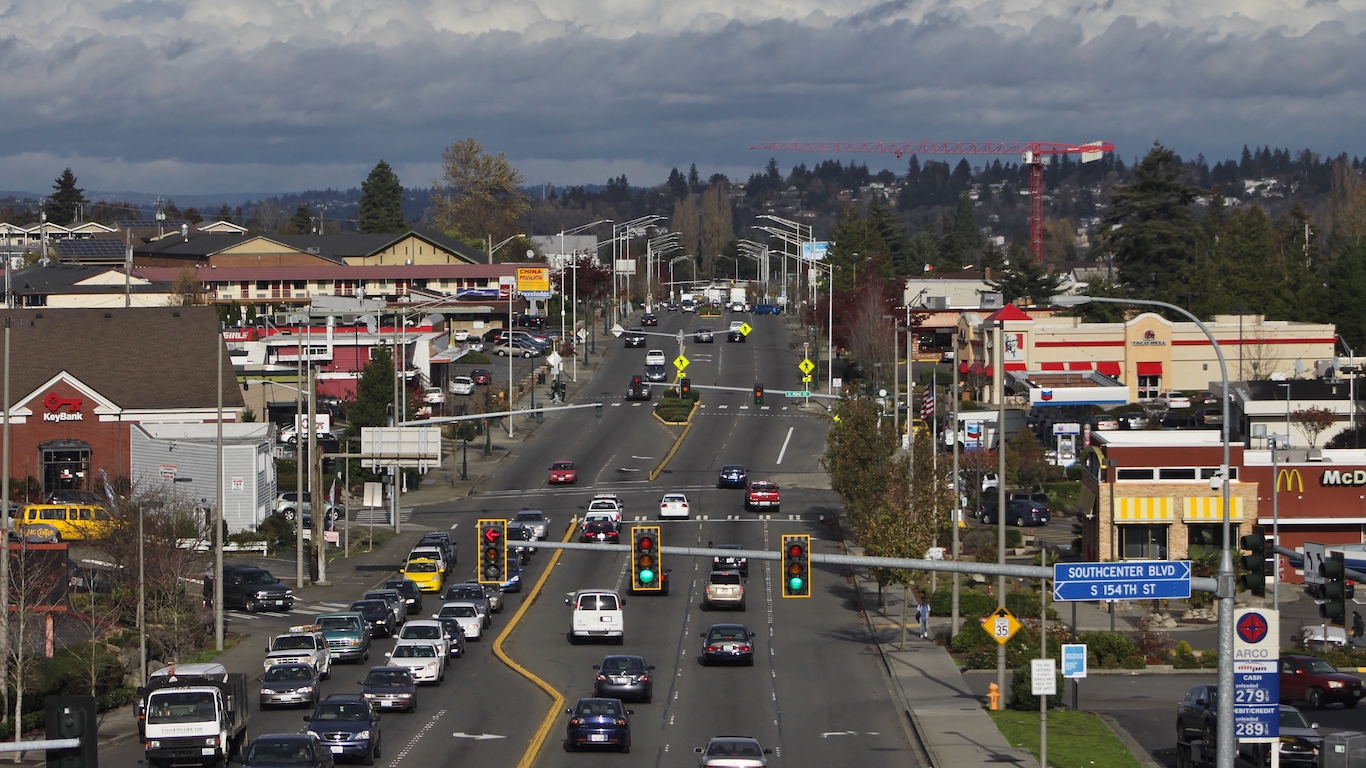
32. Tukwila, Washington
> Total population: 20,288
> Law enforcement employees per 100K: 419
> Total law enforcement employees: 85 (67 officers, 18 civilian employees)
> Violent crimes reported per 100K in 2018: 729 (159th highest of 1,843 cities with pop. of 20K or more)
> Property crime reported per 100K in 2018: 16,764 (1st highest of 1,843 cities with pop. of 20K or more)
> % of people below poverty level: 19.1% (410th highest of 1,843 cities with pop. of 20K or more)
> Pct. black: 17.0% (390th highest of 1,843 cities with pop. of 20K or more)
[in-text-ad-2]
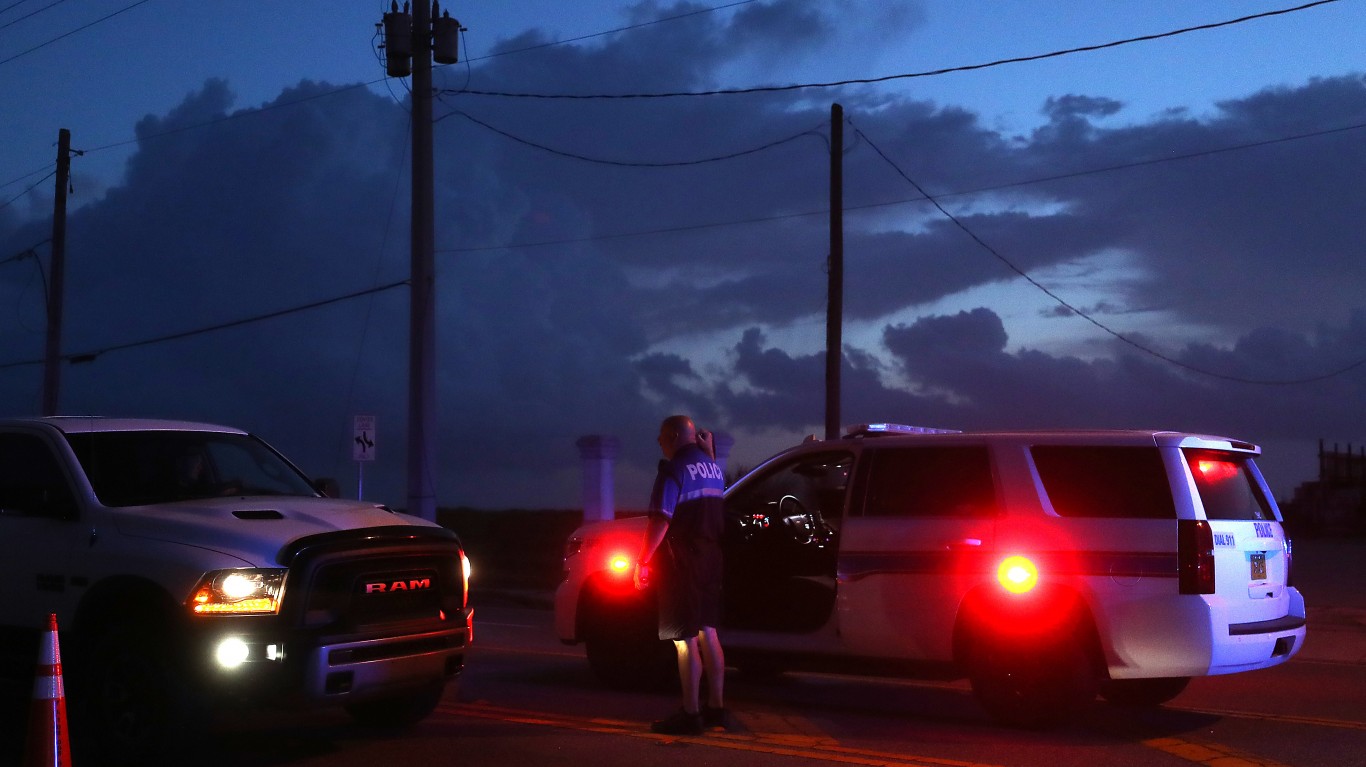
31. Daytona Beach, Florida
> Total population: 69,030
> Law enforcement employees per 100K: 423
> Total law enforcement employees: 292 (245 officers, 47 civilian employees)
> Violent crimes reported per 100K in 2018: 1,107 (55th highest of 1,843 cities with pop. of 20K or more)
> Property crime reported per 100K in 2018: 4,865 (78th highest of 1,843 cities with pop. of 20K or more)
> % of people below poverty level: 26.3% (143rd highest of 1,843 cities with pop. of 20K or more)
> Pct. black: 35.0% (148th highest of 1,843 cities with pop. of 20K or more)
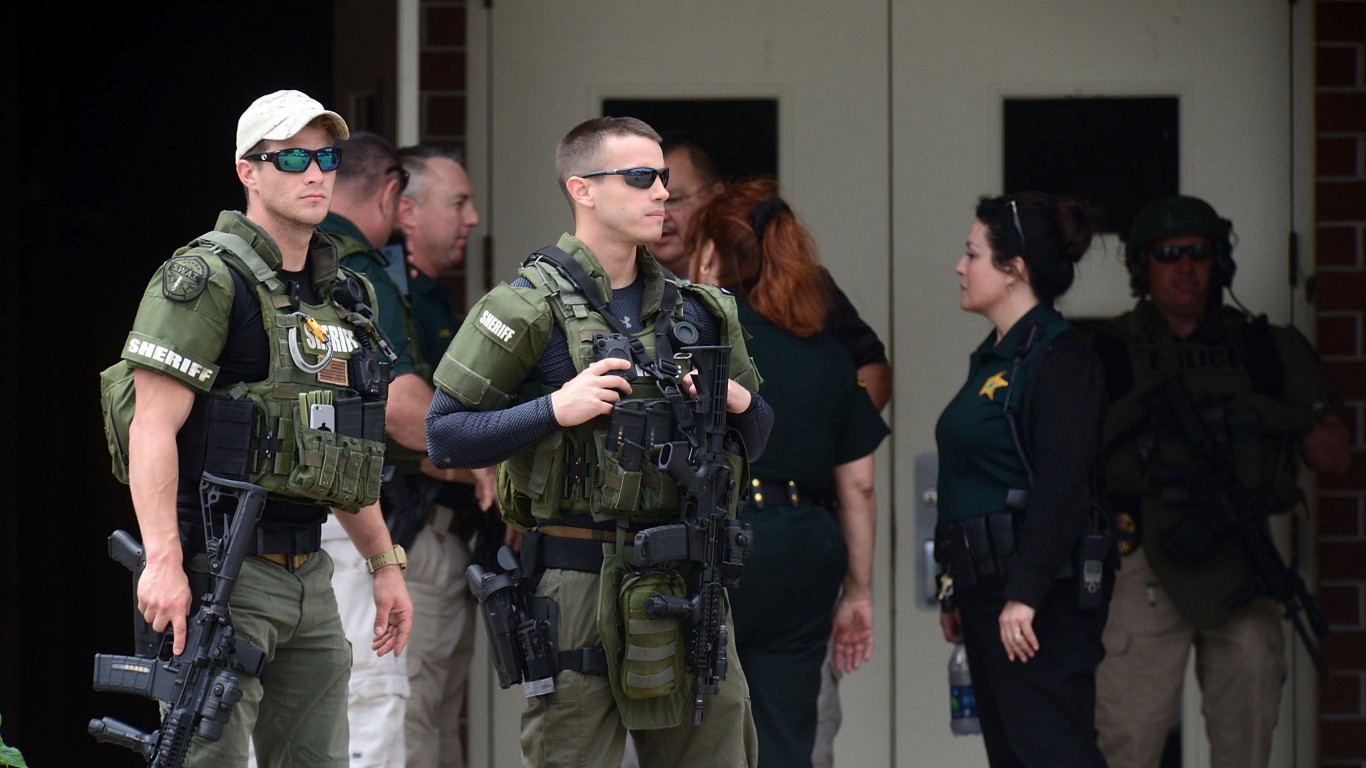
30. Ocala, Florida
> Total population: 59,505
> Law enforcement employees per 100K: 425
> Total law enforcement employees: 253 (172 officers, 81 civilian employees)
> Violent crimes reported per 100K in 2018: 681 (191st highest of 1,843 cities with pop. of 20K or more)
> Property crime reported per 100K in 2018: 4,825 (84th highest of 1,843 cities with pop. of 20K or more)
> % of people below poverty level: 20.3% (347th highest of 1,843 cities with pop. of 20K or more)
> Pct. black: 20.1% (324th highest of 1,843 cities with pop. of 20K or more)
[in-text-ad]

29. Santa Monica, California
> Total population: 92,674
> Law enforcement employees per 100K: 428
> Total law enforcement employees: 397 (218 officers, 179 civilian employees)
> Violent crimes reported per 100K in 2018: 860 (106th highest of 1,843 cities with pop. of 20K or more)
> Property crime reported per 100K in 2018: 5,106 (61st highest of 1,843 cities with pop. of 20K or more)
> % of people below poverty level: 10.4% (987th highest of 1,843 cities with pop. of 20K or more)
> Pct. black: 4.4% (946th highest of 1,843 cities with pop. of 20K or more)

28. Trenton, New Jersey
> Total population: 83,753
> Law enforcement employees per 100K: 429
> Total law enforcement employees: 359 (287 officers, 72 civilian employees)
> Violent crimes reported per 100K in 2018: 1,162 (47th highest of 1,843 cities with pop. of 20K or more)
> Property crime reported per 100K in 2018: 2,946 (430th highest of 1,843 cities with pop. of 20K or more)
> % of people below poverty level: 28.4% (104th highest of 1,843 cities with pop. of 20K or more)
> Pct. black: 50.7% (57th highest of 1,843 cities with pop. of 20K or more)
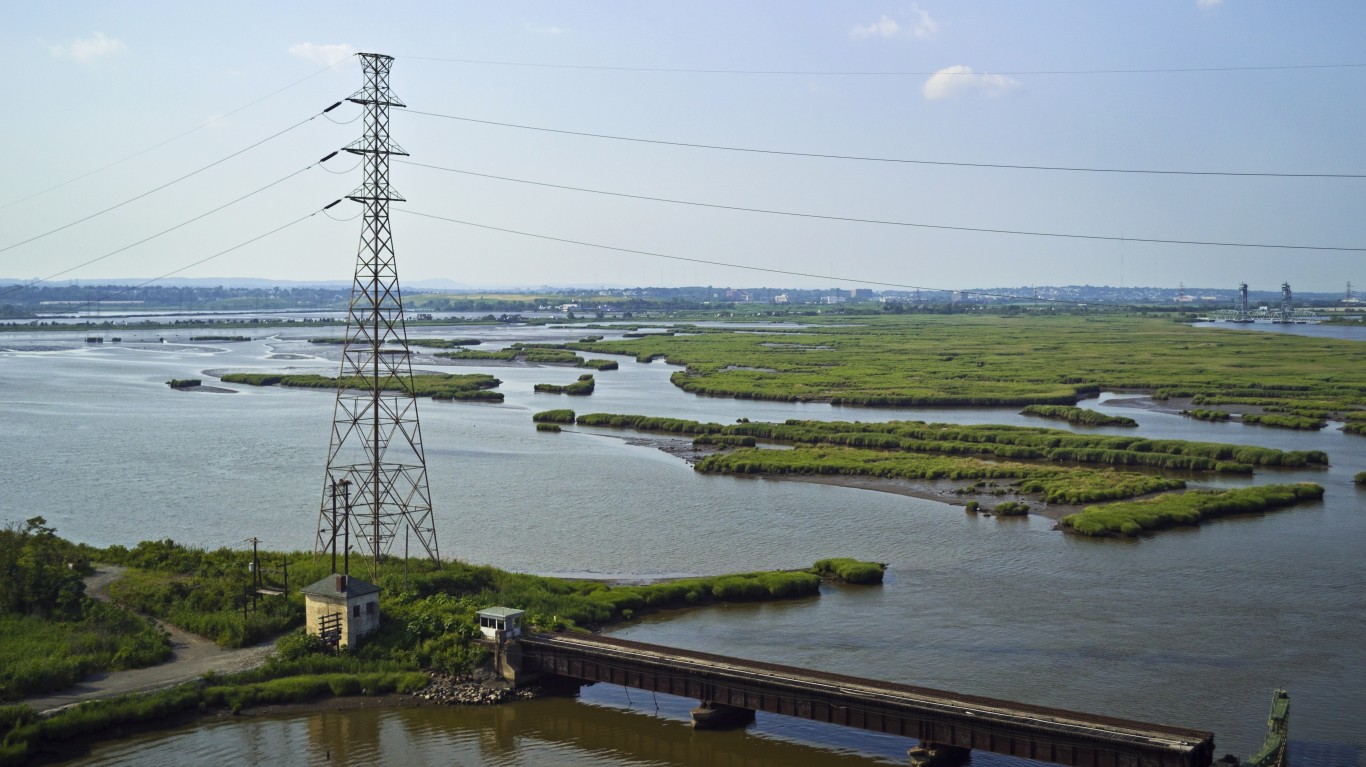
27. Secaucus, New Jersey
> Total population: 20,482
> Law enforcement employees per 100K: 430
> Total law enforcement employees: 88 (73 officers, 15 civilian employees)
> Violent crimes reported per 100K in 2018: 146 (1,328th highest of 1,843 cities with pop. of 20K or more)
> Property crime reported per 100K in 2018: 2,568 (578th highest of 1,843 cities with pop. of 20K or more)
> % of people below poverty level: 6.7% (1,277th highest of 1,843 cities with pop. of 20K or more)
> Pct. black: 3.6% (1,031st highest of 1,843 cities with pop. of 20K or more)
[in-text-ad-2]
26. Cleveland, Ohio
> Total population: 384,666
> Law enforcement employees per 100K: 435
> Total law enforcement employees: 1,675 (1,462 officers, 213 civilian employees)
> Violent crimes reported per 100K in 2018: 1,450 (21st highest of 1,843 cities with pop. of 20K or more)
> Property crime reported per 100K in 2018: 4,412 (124th highest of 1,843 cities with pop. of 20K or more)
> % of people below poverty level: 34.6% (26th highest of 1,843 cities with pop. of 20K or more)
> Pct. black: 49.6% (62nd highest of 1,843 cities with pop. of 20K or more)
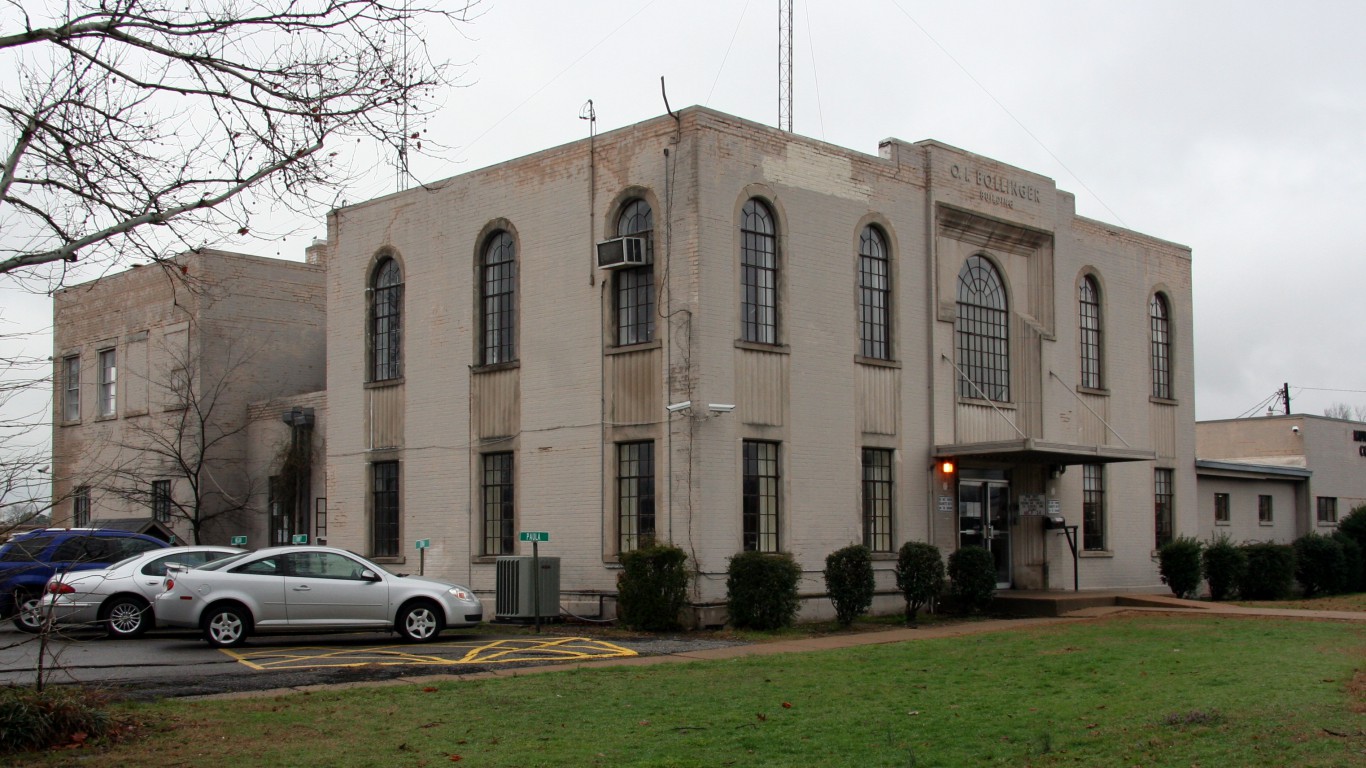
25. West Memphis, Arkansas
> Total population: 24,668
> Law enforcement employees per 100K: 438
> Total law enforcement employees: 108 (87 officers, 21 civilian employees)
> Violent crimes reported per 100K in 2018: 1,970 (3rd highest of 1,843 cities with pop. of 20K or more)
> Property crime reported per 100K in 2018: 5,116 (58th highest of 1,843 cities with pop. of 20K or more)
> % of people below poverty level: 27.8% (114th highest of 1,843 cities with pop. of 20K or more)
> Pct. black: 59.9% (34th highest of 1,843 cities with pop. of 20K or more)
[in-text-ad]
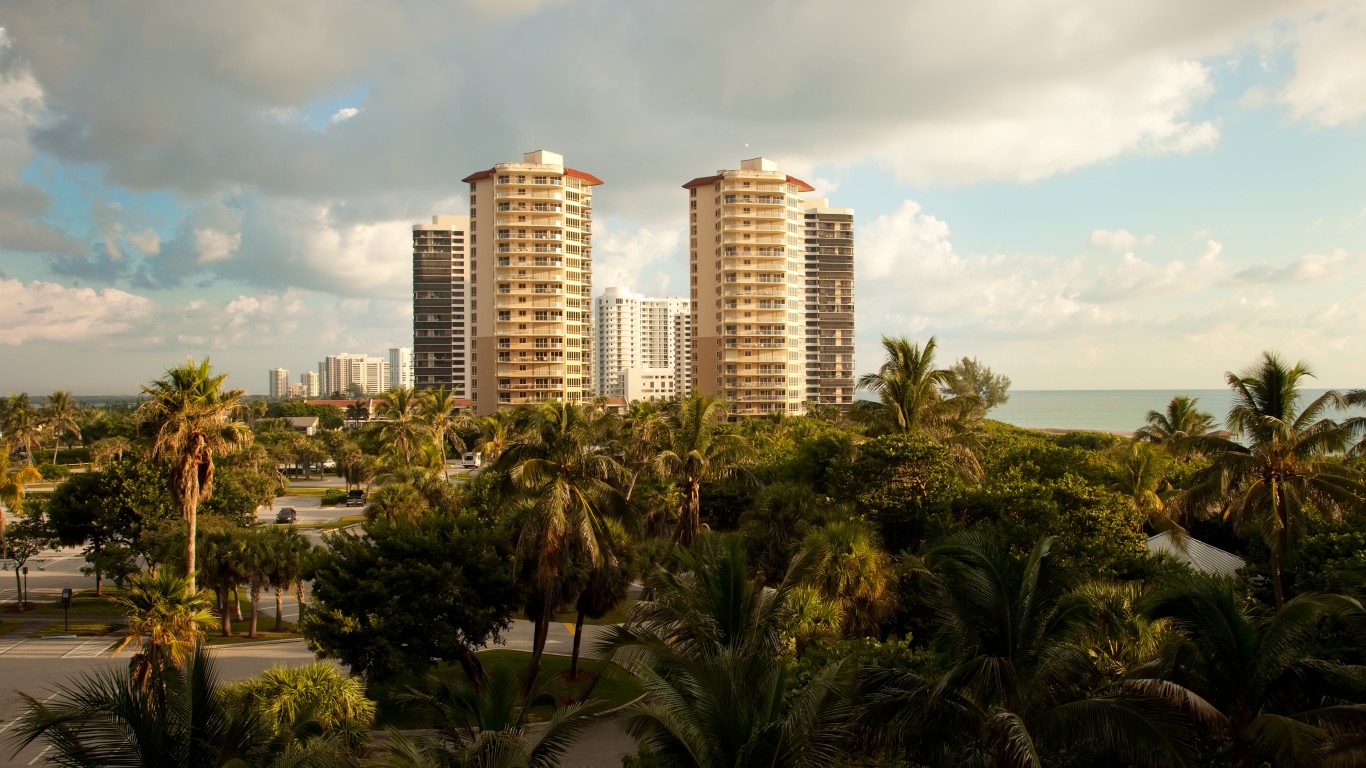
24. Riviera Beach, Florida
> Total population: 34,991
> Law enforcement employees per 100K: 449
> Total law enforcement employees: 157 (119 officers, 38 civilian employees)
> Violent crimes reported per 100K in 2018: 1,180 (42nd highest of 1,843 cities with pop. of 20K or more)
> Property crime reported per 100K in 2018: 3,810 (215th highest of 1,843 cities with pop. of 20K or more)
> % of people below poverty level: 22.8% (246th highest of 1,843 cities with pop. of 20K or more)
> Pct. black: 69.5% (19th highest of 1,843 cities with pop. of 20K or more)
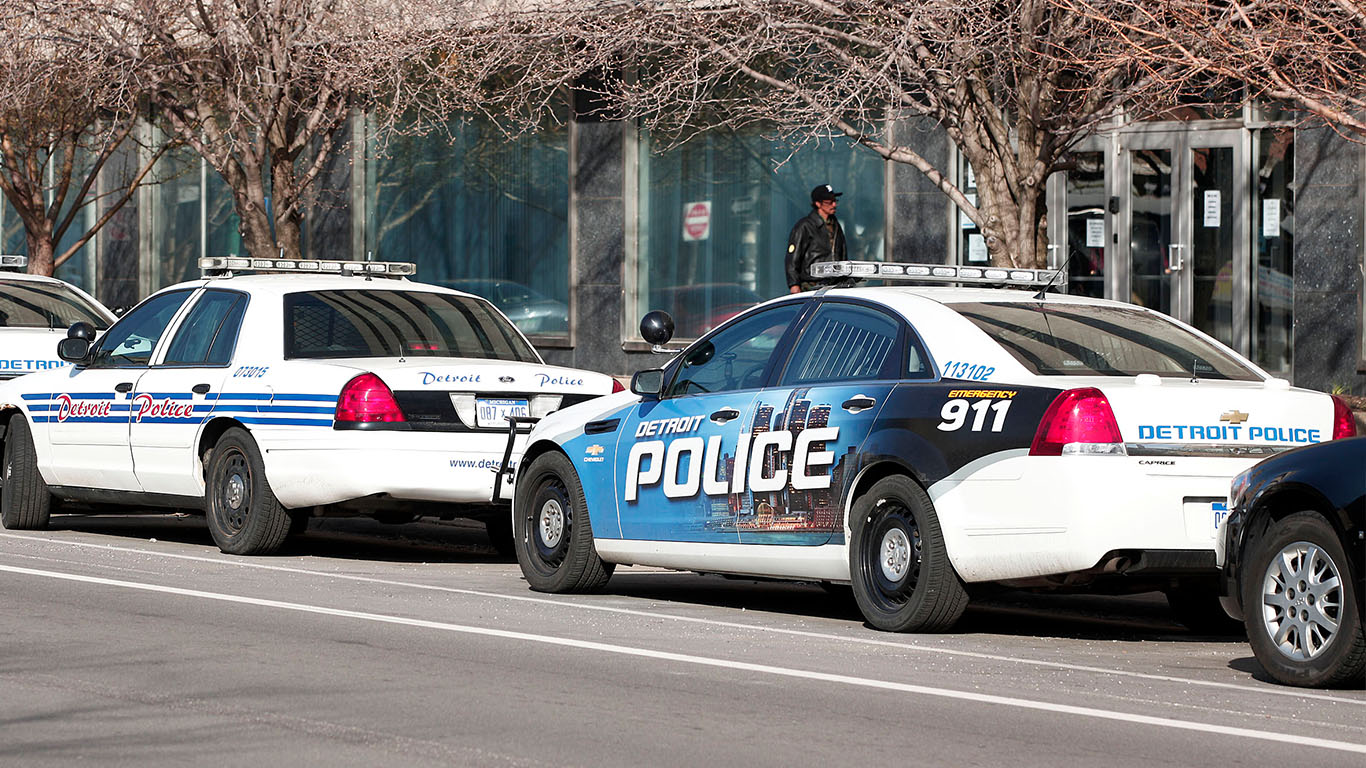
23. Detroit, Michigan
> Total population: 671,275
> Law enforcement employees per 100K: 450
> Total law enforcement employees: 3,019 (2,398 officers, 621 civilian employees)
> Violent crimes reported per 100K in 2018: 2,008 (2nd highest of 1,843 cities with pop. of 20K or more)
> Property crime reported per 100K in 2018: 4,305 (137th highest of 1,843 cities with pop. of 20K or more)
> % of people below poverty level: 36.4% (17th highest of 1,843 cities with pop. of 20K or more)
> Pct. black: 78.6% (6th highest of 1,843 cities with pop. of 20K or more)

22. Orange City, New Jersey
> Total population: 30,449
> Law enforcement employees per 100K: 460
> Total law enforcement employees: 140 (114 officers, 26 civilian employees)
> Violent crimes reported per 100K in 2018: 300 (662nd highest of 1,843 cities with pop. of 20K or more)
> Property crime reported per 100K in 2018: 999 (1,281st highest of 1,843 cities with pop. of 20K or more)
> % of people below poverty level: N/A
> Pct. black: N/A
[in-text-ad-2]
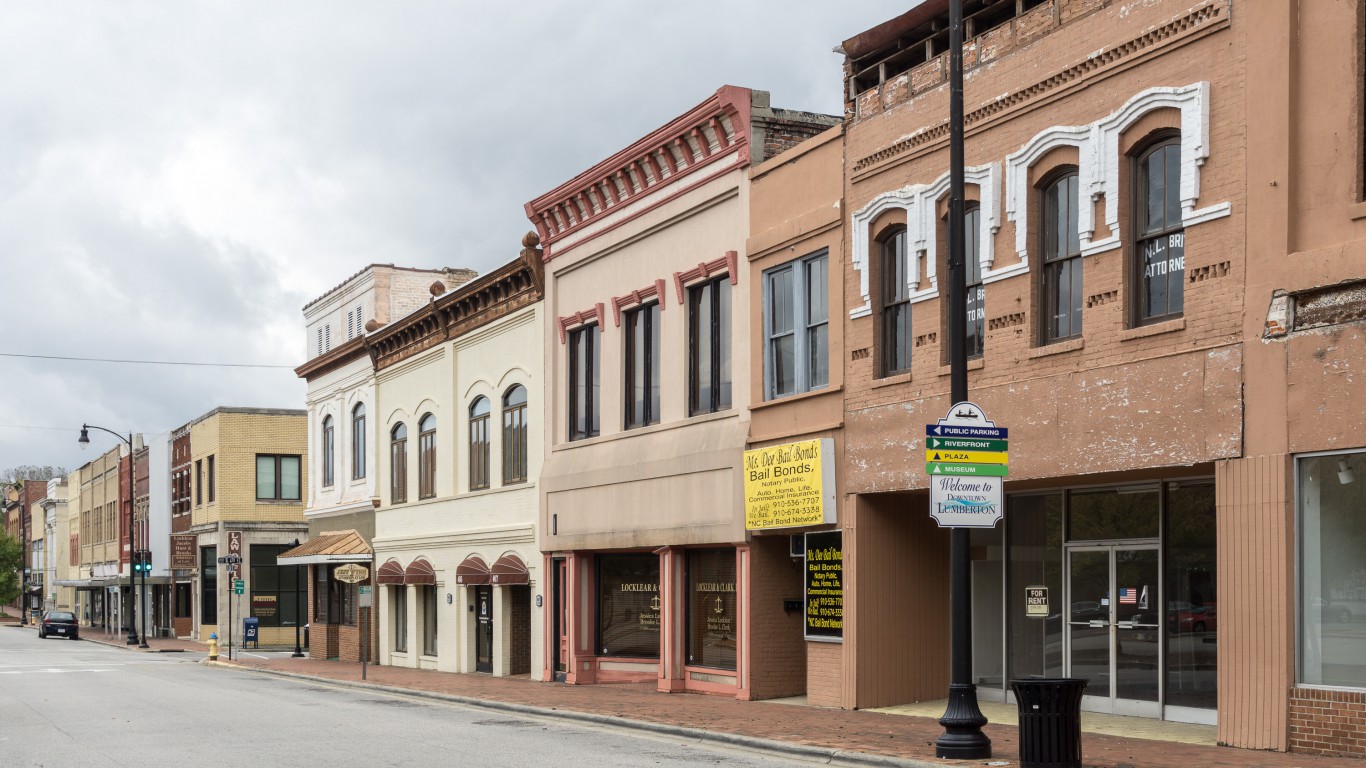
21. Lumberton, North Carolina
> Total population: 20,966
> Law enforcement employees per 100K: 463
> Total law enforcement employees: 97 (88 officers, 9 civilian employees)
> Violent crimes reported per 100K in 2018: N/A
> Property crime reported per 100K in 2018: N/A
> % of people below poverty level: 33.5% (32nd highest of 1,843 cities with pop. of 20K or more)
> Pct. black: 35.2% (146th highest of 1,843 cities with pop. of 20K or more)

20. Birmingham, Alabama
> Total population: 210,564
> Law enforcement employees per 100K: 464
> Total law enforcement employees: 977 (762 officers, 215 civilian employees)
> Violent crimes reported per 100K in 2018: 1,912 (5th highest of 1,843 cities with pop. of 20K or more)
> Property crime reported per 100K in 2018: 6,314 (19th highest of 1,843 cities with pop. of 20K or more)
> % of people below poverty level: 27.2% (126th highest of 1,843 cities with pop. of 20K or more)
> Pct. black: 70.5% (15th highest of 1,843 cities with pop. of 20K or more)
[in-text-ad]
19. Philadelphia, Pennsylvania
> Total population: 1,586,916
> Law enforcement employees per 100K: 464
> Total law enforcement employees: 7,366 (6,577 officers, 789 civilian employees)
> Violent crimes reported per 100K in 2018: 909 (95th highest of 1,843 cities with pop. of 20K or more)
> Property crime reported per 100K in 2018: 3,097 (377th highest of 1,843 cities with pop. of 20K or more)
> % of people below poverty level: 24.9% (176th highest of 1,843 cities with pop. of 20K or more)
> Pct. black: 42.3% (97th highest of 1,843 cities with pop. of 20K or more)
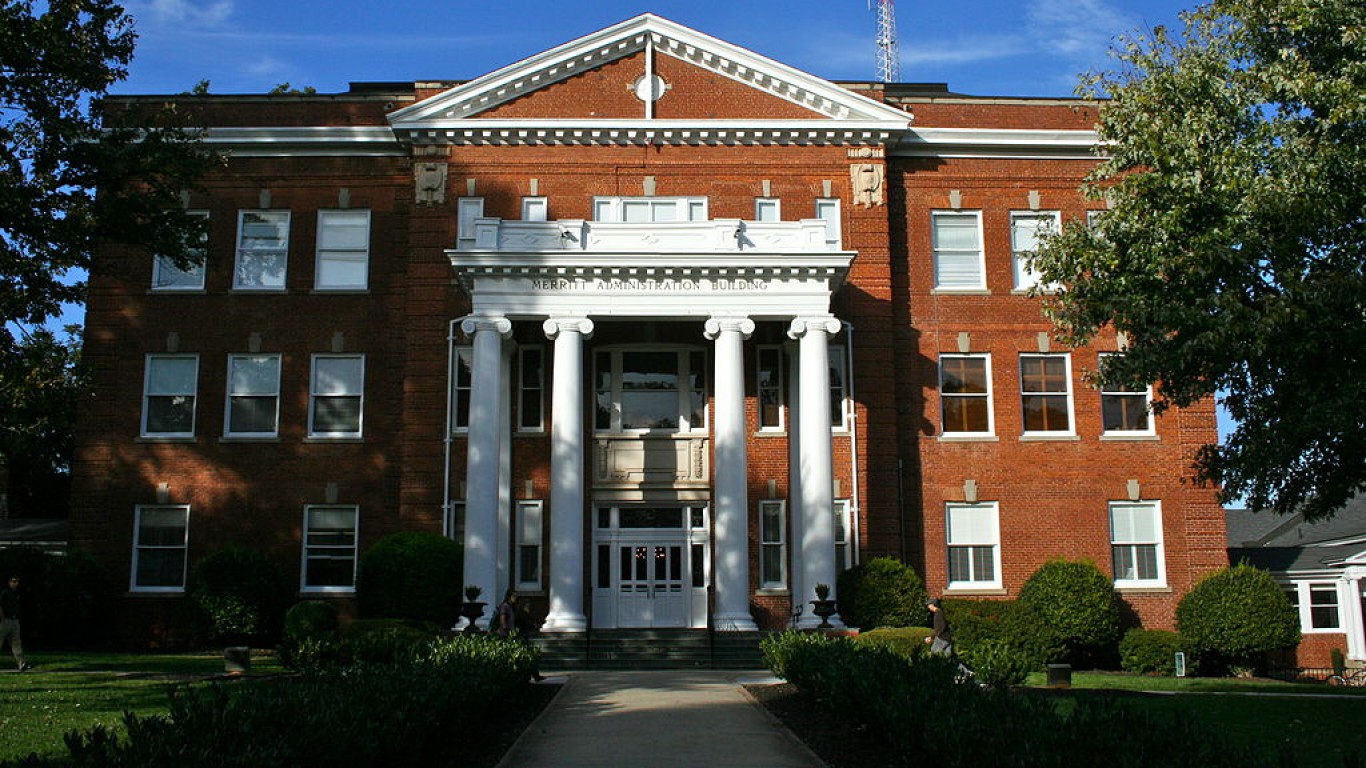
18. Anderson, South Carolina
> Total population: 27,415
> Law enforcement employees per 100K: 471
> Total law enforcement employees: 129 (93 officers, 36 civilian employees)
> Violent crimes reported per 100K in 2018: N/A
> Property crime reported per 100K in 2018: N/A
> % of people below poverty level: 23.1% (237th highest of 1,843 cities with pop. of 20K or more)
> Pct. black: 31.5% (165th highest of 1,843 cities with pop. of 20K or more)
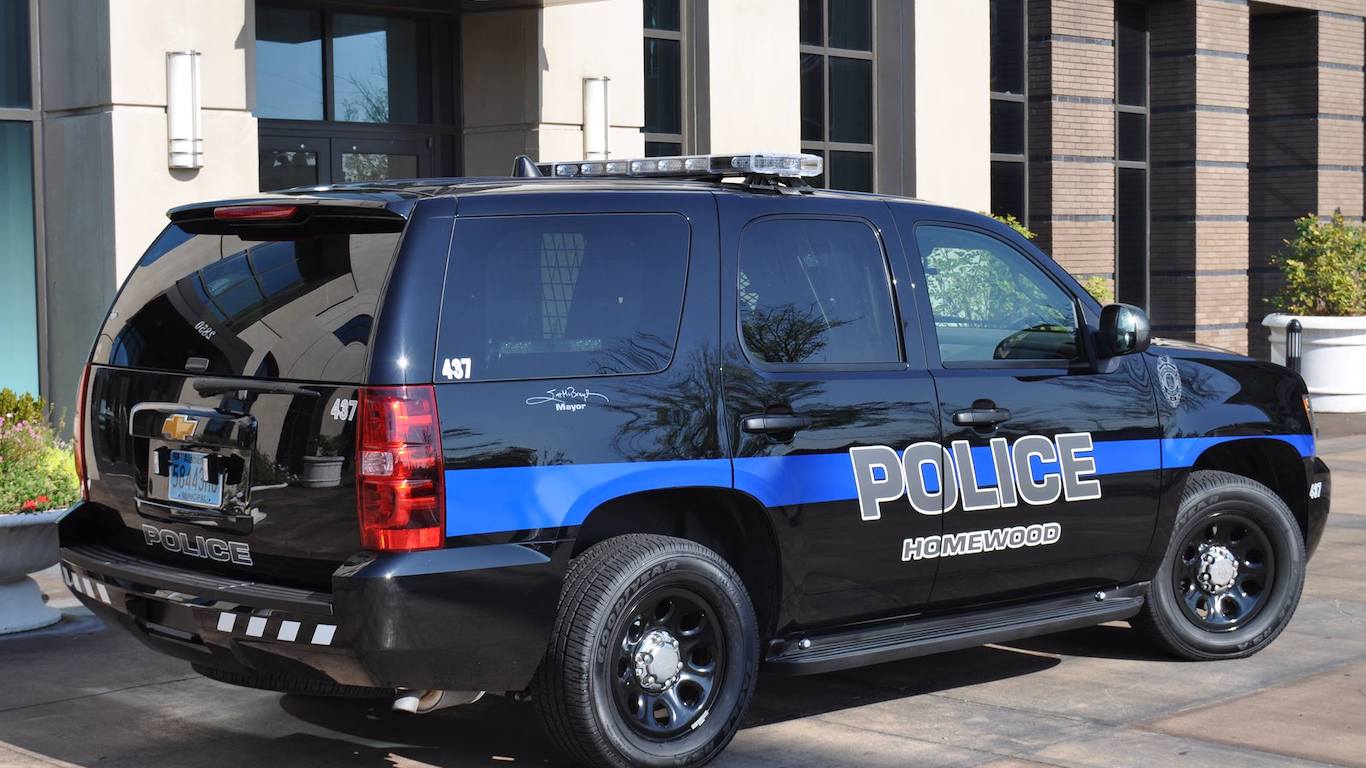
17. Homewood, Alabama
> Total population: 25,523
> Law enforcement employees per 100K: 474
> Total law enforcement employees: 121 (82 officers, 39 civilian employees)
> Violent crimes reported per 100K in 2018: 294 (940th highest of 1,843 cities with pop. of 20K or more)
> Property crime reported per 100K in 2018: 3,746 (227th highest of 1,843 cities with pop. of 20K or more)
> % of people below poverty level: 9.8% (1,036th highest of 1,843 cities with pop. of 20K or more)
> Pct. black: 12.9% (495th highest of 1,843 cities with pop. of 20K or more)
[in-text-ad-2]
16. Wilmington, Delaware
> Total population: 71,157
> Law enforcement employees per 100K: 475
> Total law enforcement employees: 338 (292 officers, 46 civilian employees)
> Violent crimes reported per 100K in 2018: 1,544 (16th highest of 1,843 cities with pop. of 20K or more)
> Property crime reported per 100K in 2018: 4,922 (76th highest of 1,843 cities with pop. of 20K or more)
> % of people below poverty level: 25.1% (173rd highest of 1,843 cities with pop. of 20K or more)
> Pct. black: 58.3% (36th highest of 1,843 cities with pop. of 20K or more)
15. Key West, Florida
> Total population: 25,286
> Law enforcement employees per 100K: 482
> Total law enforcement employees: 122 (94 officers, 28 civilian employees)
> Violent crimes reported per 100K in 2018: 395 (481st highest of 1,843 cities with pop. of 20K or more)
> Property crime reported per 100K in 2018: 3,195 (353rd highest of 1,843 cities with pop. of 20K or more)
> % of people below poverty level: 12.0% (856th highest of 1,843 cities with pop. of 20K or more)
> Pct. black: 13.4% (480th highest of 1,843 cities with pop. of 20K or more)
[in-text-ad]
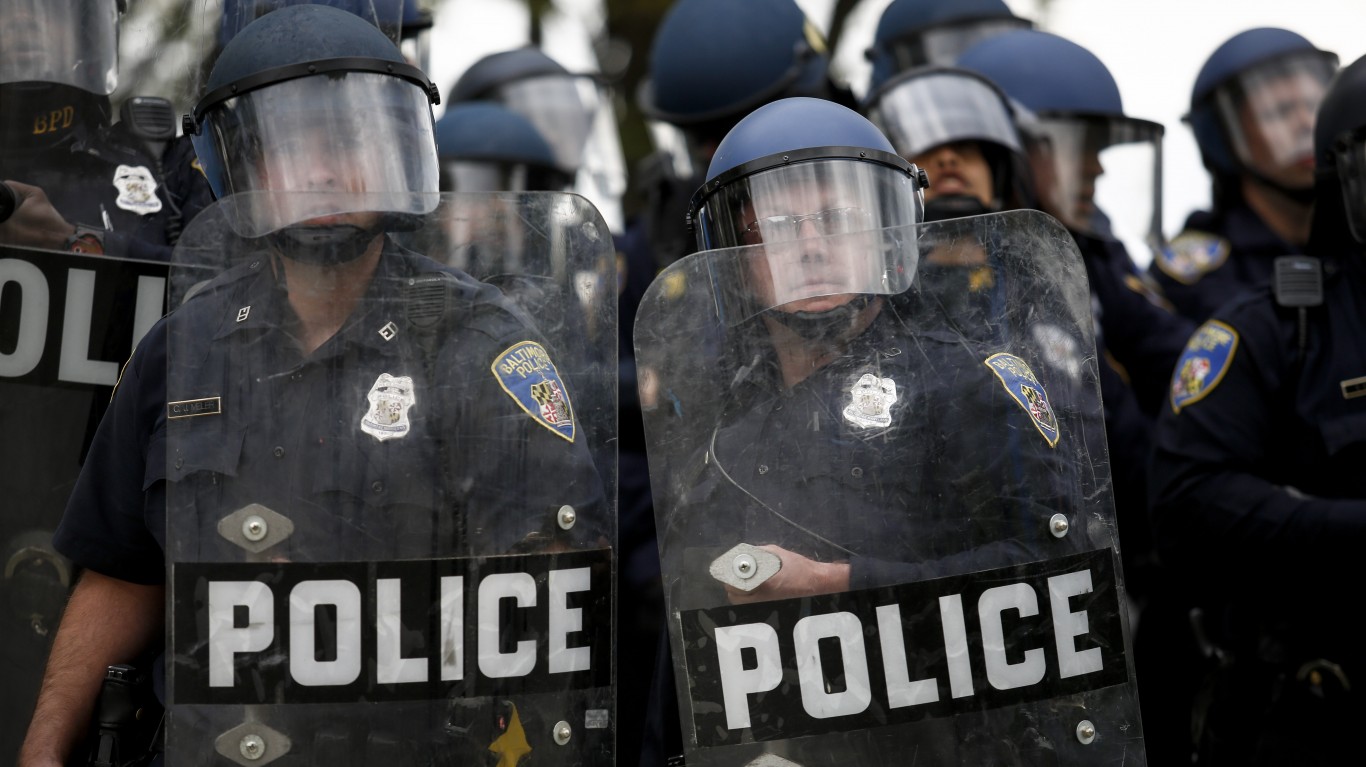
14. Baltimore, Maryland
> Total population: 605,436
> Law enforcement employees per 100K: 485
> Total law enforcement employees: 2,935 (2,488 officers, 447 civilian employees)
> Violent crimes reported per 100K in 2018: 1,833 (6th highest of 1,843 cities with pop. of 20K or more)
> Property crime reported per 100K in 2018: 4,495 (116th highest of 1,843 cities with pop. of 20K or more)
> % of people below poverty level: 21.8% (278th highest of 1,843 cities with pop. of 20K or more)
> Pct. black: 62.5% (32nd highest of 1,843 cities with pop. of 20K or more)
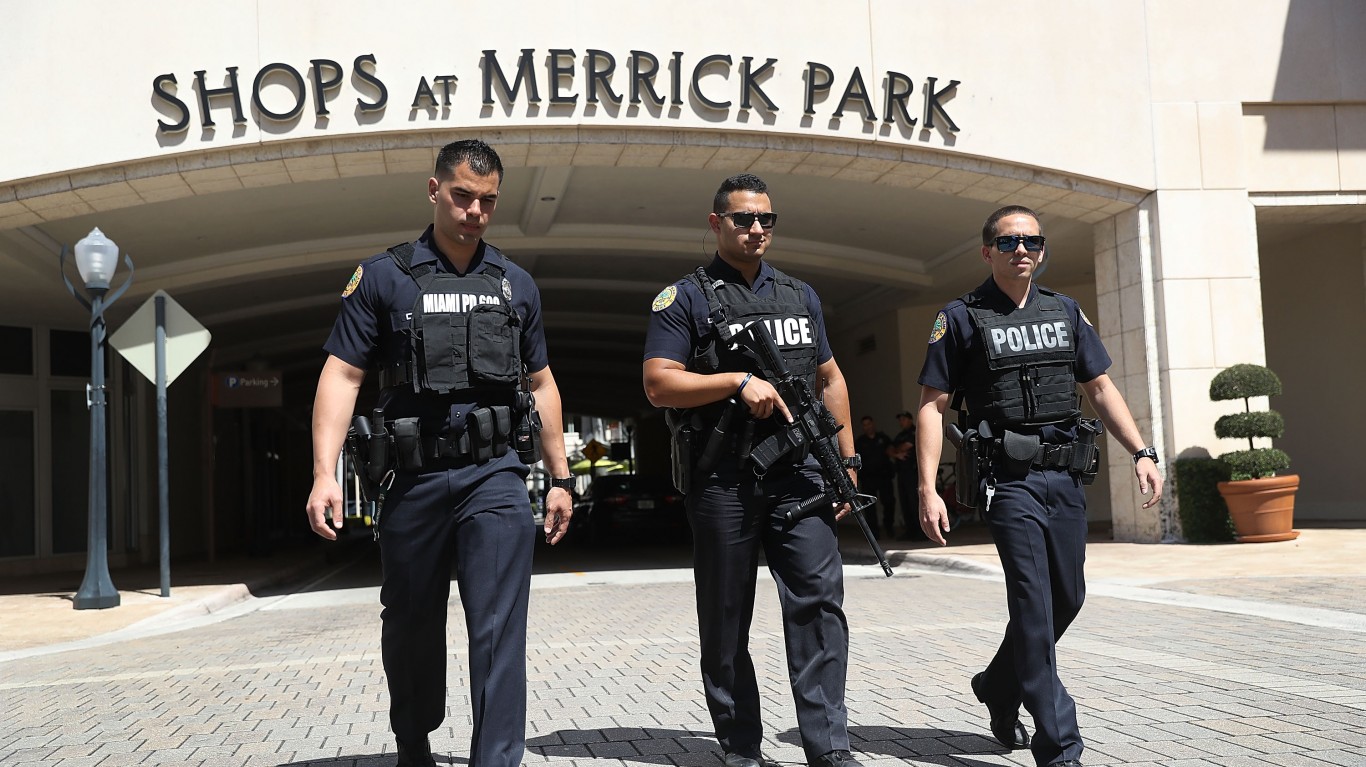
13. Coral Gables, Florida
> Total population: 51,716
> Law enforcement employees per 100K: 493
> Total law enforcement employees: 255 (182 officers, 73 civilian employees)
> Violent crimes reported per 100K in 2018: 131 (1,378th highest of 1,843 cities with pop. of 20K or more)
> Property crime reported per 100K in 2018: 2,369 (666th highest of 1,843 cities with pop. of 20K or more)
> % of people below poverty level: 7.5% (1,214th highest of 1,843 cities with pop. of 20K or more)
> Pct. black: 3.4% (1042nd highest of 1,843 cities with pop. of 20K or more)
12. Hammond, Louisiana
> Total population: 20,550
> Law enforcement employees per 100K: 496
> Total law enforcement employees: 102 (77 officers, 25 civilian employees)
> Violent crimes reported per 100K in 2018: 1,455 (19th highest of 1,843 cities with pop. of 20K or more)
> Property crime reported per 100K in 2018: 10,336 (4th highest of 1,843 cities with pop. of 20K or more)
> % of people below poverty level: 31.6% (60th highest of 1,843 cities with pop. of 20K or more)
> Pct. black: 45.3% (82nd highest of 1,843 cities with pop. of 20K or more)
[in-text-ad-2]
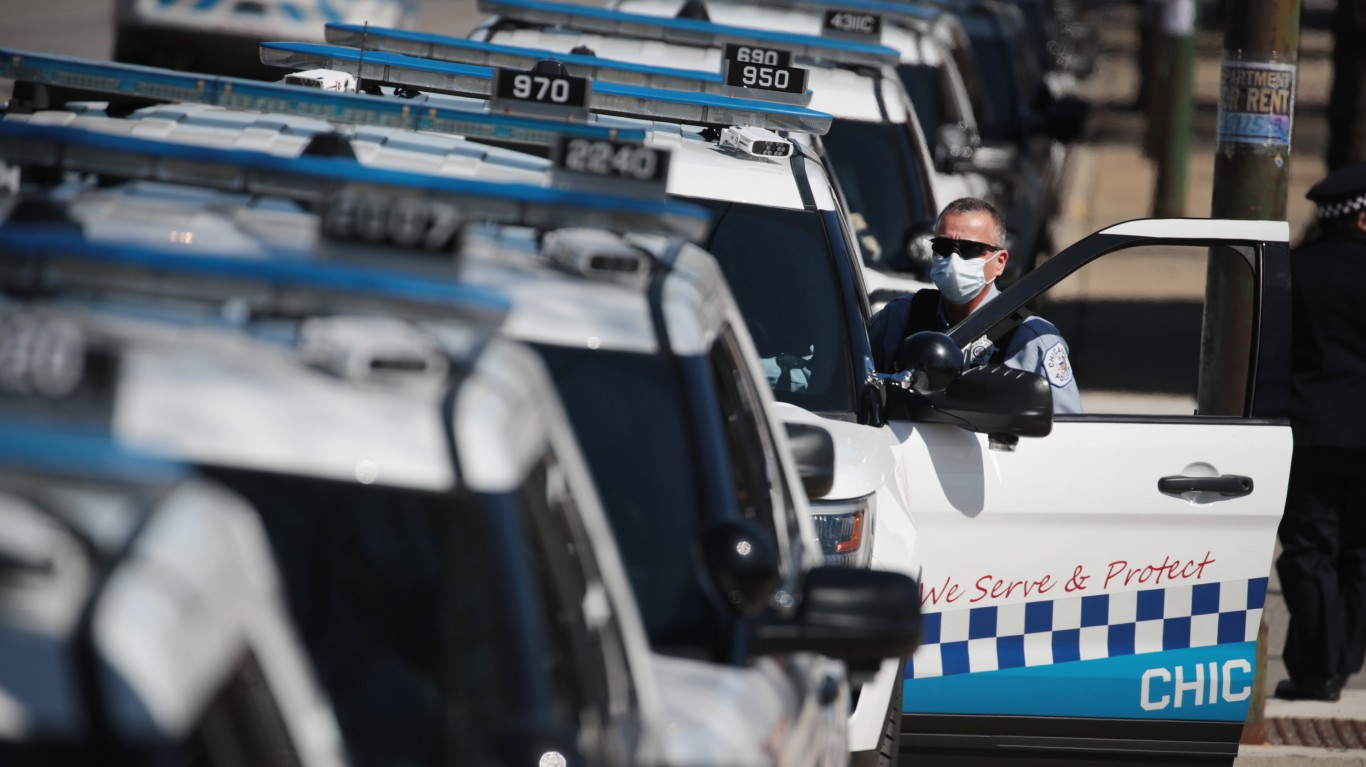
11. Chicago, Illinois
> Total population: 2,719,151
> Law enforcement employees per 100K: 518
> Total law enforcement employees: 14,086 (13,138 officers, 948 civilian employees)
> Violent crimes reported per 100K in 2018: 1,006 (69th highest of 1,843 cities with pop. of 20K or more)
> Property crime reported per 100K in 2018: 3,182 (357th highest of 1,843 cities with pop. of 20K or more)
> % of people below poverty level: 19.5% (386th highest of 1,843 cities with pop. of 20K or more)
> Pct. black: 30.1% (180th highest of 1,843 cities with pop. of 20K or more)
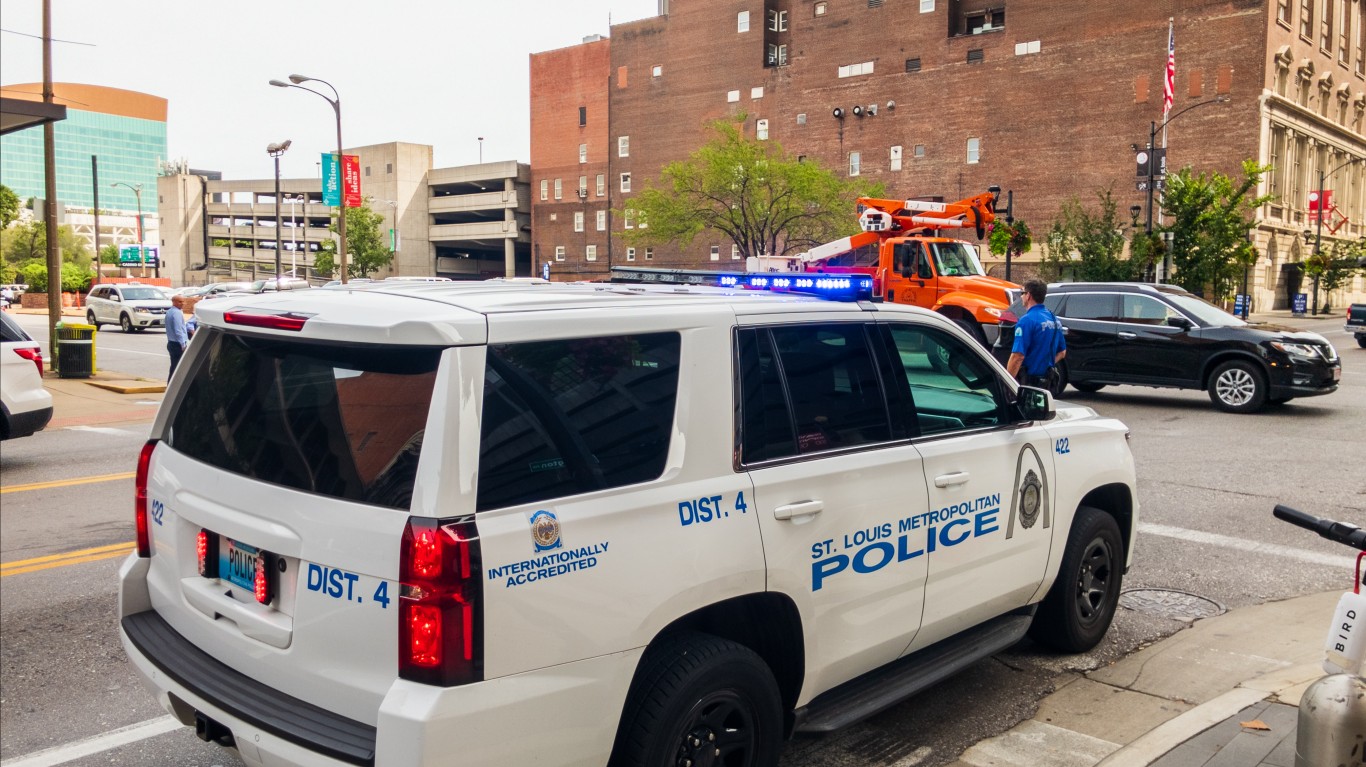
10. St. Louis, Missouri
> Total population: 306,875
> Law enforcement employees per 100K: 524
> Total law enforcement employees: 1,608 (1,189 officers, 419 civilian employees)
> Violent crimes reported per 100K in 2018: 1,800 (9th highest of 1,843 cities with pop. of 20K or more)
> Property crime reported per 100K in 2018: 5,912 (28th highest of 1,843 cities with pop. of 20K or more)
> % of people below poverty level: 24.2% (202nd highest of 1,843 cities with pop. of 20K or more)
> Pct. black: 46.9% (73rd highest of 1,843 cities with pop. of 20K or more)
[in-text-ad]
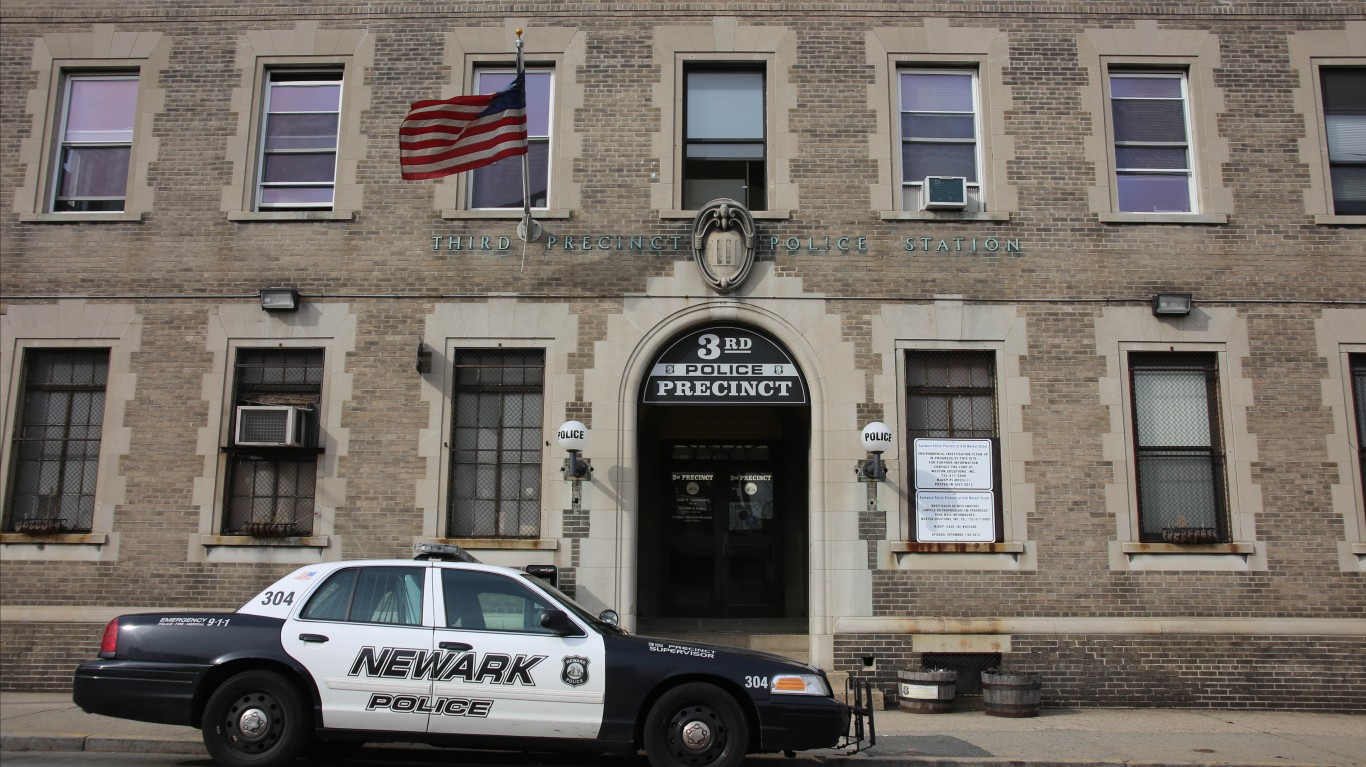
9. Newark, New Jersey
> Total population: 282,258
> Law enforcement employees per 100K: 528
> Total law enforcement employees: 1,490 (1,155 officers, 335 civilian employees)
> Violent crimes reported per 100K in 2018: 733 (153rd highest of 1,843 cities with pop. of 20K or more)
> Property crime reported per 100K in 2018: 2,010 (837th highest of 1,843 cities with pop. of 20K or more)
> % of people below poverty level: 28.0% (113rd highest of 1,843 cities with pop. of 20K or more)
> Pct. black: 49.7% (61st highest of 1,843 cities with pop. of 20K or more)
8. Miami Beach, Florida
> Total population: 92,928
> Law enforcement employees per 100K: 547
> Total law enforcement employees: 508 (393 officers, 115 civilian employees)
> Violent crimes reported per 100K in 2018: 937 (88th highest of 1,843 cities with pop. of 20K or more)
> Property crime reported per 100K in 2018: 7,476 (7th highest of 1,843 cities with pop. of 20K or more)
> % of people below poverty level: 14.9% (664th highest of 1,843 cities with pop. of 20K or more)
> Pct. black: 4.1% (978th highest of 1,843 cities with pop. of 20K or more)

7. Camden County Police Department, New Jersey
> Total population: 73,140
> Law enforcement employees per 100K: 565
> Total law enforcement employees: 413 (370 officers, 43 civilian employees)
> Violent crimes reported per 100K in 2018: 300 (662nd highest of 1,843 cities with pop. of 20K or more)
> Property crime reported per 100K in 2018: 999 (1,281st highest of 1,843 cities with pop. of 20K or more)
> % of people below poverty level: N/A
> Pct. black: N/A
[in-text-ad-2]
6. Atlantic City, New Jersey
> Total population: 38,271
> Law enforcement employees per 100K: 585
> Total law enforcement employees: 224 (190 officers, 34 civilian employees)
> Violent crimes reported per 100K in 2018: 721 (166th highest of 1,843 cities with pop. of 20K or more)
> Property crime reported per 100K in 2018: 3,086 (383rd highest of 1,843 cities with pop. of 20K or more)
> % of people below poverty level: 37.7% (13rd highest of 1,843 cities with pop. of 20K or more)
> Pct. black: 35.5% (142nd highest of 1,843 cities with pop. of 20K or more)

5. Bessemer, Alabama
> Total population: 26,240
> Law enforcement employees per 100K: 606
> Total law enforcement employees: 159 (114 officers, 45 civilian employees)
> Violent crimes reported per 100K in 2018: N/A
> Property crime reported per 100K in 2018: N/A
> % of people below poverty level: 28.1% (109th highest of 1,843 cities with pop. of 20K or more)
> Pct. black: 71.2% (14th highest of 1,843 cities with pop. of 20K or more)
[in-text-ad]
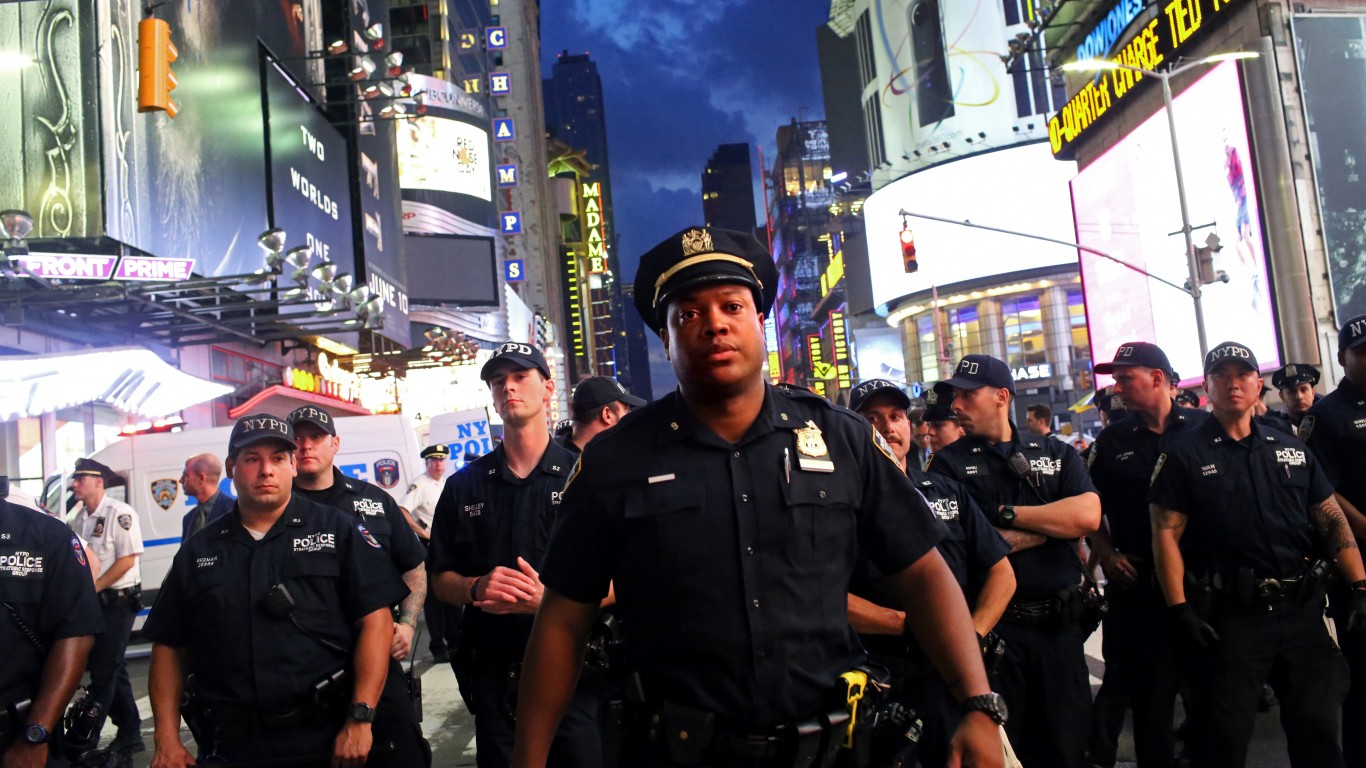
4. New York, New York
> Total population: 8,523,171
> Law enforcement employees per 100K: 613
> Total law enforcement employees: 52,278 (36,134 officers, 16,144 civilian employees)
> Violent crimes reported per 100K in 2018: 541 (302nd highest of 1,843 cities with pop. of 20K or more)
> Property crime reported per 100K in 2018: 1,502 (1,080th highest of 1,843 cities with pop. of 20K or more)
> % of people below poverty level: 18.9% (421st highest of 1,843 cities with pop. of 20K or more)
> Pct. black: 24.3% (245th highest of 1,843 cities with pop. of 20K or more)
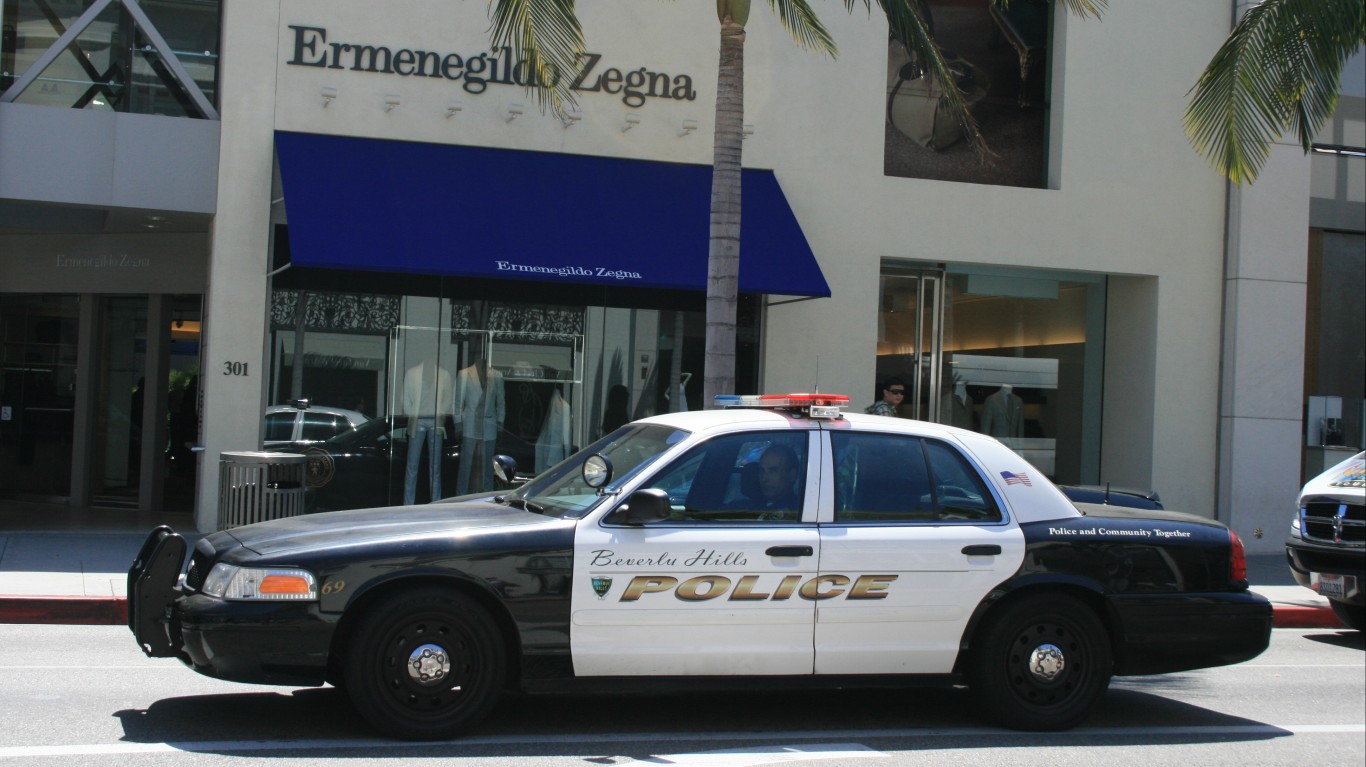
3. Beverly Hills, California
> Total population: 34,557
> Law enforcement employees per 100K: 622
> Total law enforcement employees: 215 (133 officers, 82 civilian employees)
> Violent crimes reported per 100K in 2018: 307 (646th highest of 1,843 cities with pop. of 20K or more)
> Property crime reported per 100K in 2018: 5,084 (65th highest of 1,843 cities with pop. of 20K or more)
> % of people below poverty level: 9.5% (1,062nd highest of 1,843 cities with pop. of 20K or more)
> Pct. black: 1.7% (1,325th highest of 1,843 cities with pop. of 20K or more)
2. Washington, District Of Columbia
> Total population: 702,455
> Law enforcement employees per 100K: 643
> Total law enforcement employees: 4,520 (3,841 officers, 679 civilian employees)
> Violent crimes reported per 100K in 2018: 941 (87th highest of 1,843 cities with pop. of 20K or more)
> Property crime reported per 100K in 2018: 4,270 (146th highest of 1,843 cities with pop. of 20K or more)
> % of people below poverty level: 16.8% (547th highest of 1,843 cities with pop. of 20K or more)
> Pct. black: 46.9% (72nd highest of 1,843 cities with pop. of 20K or more)
[in-text-ad-2]
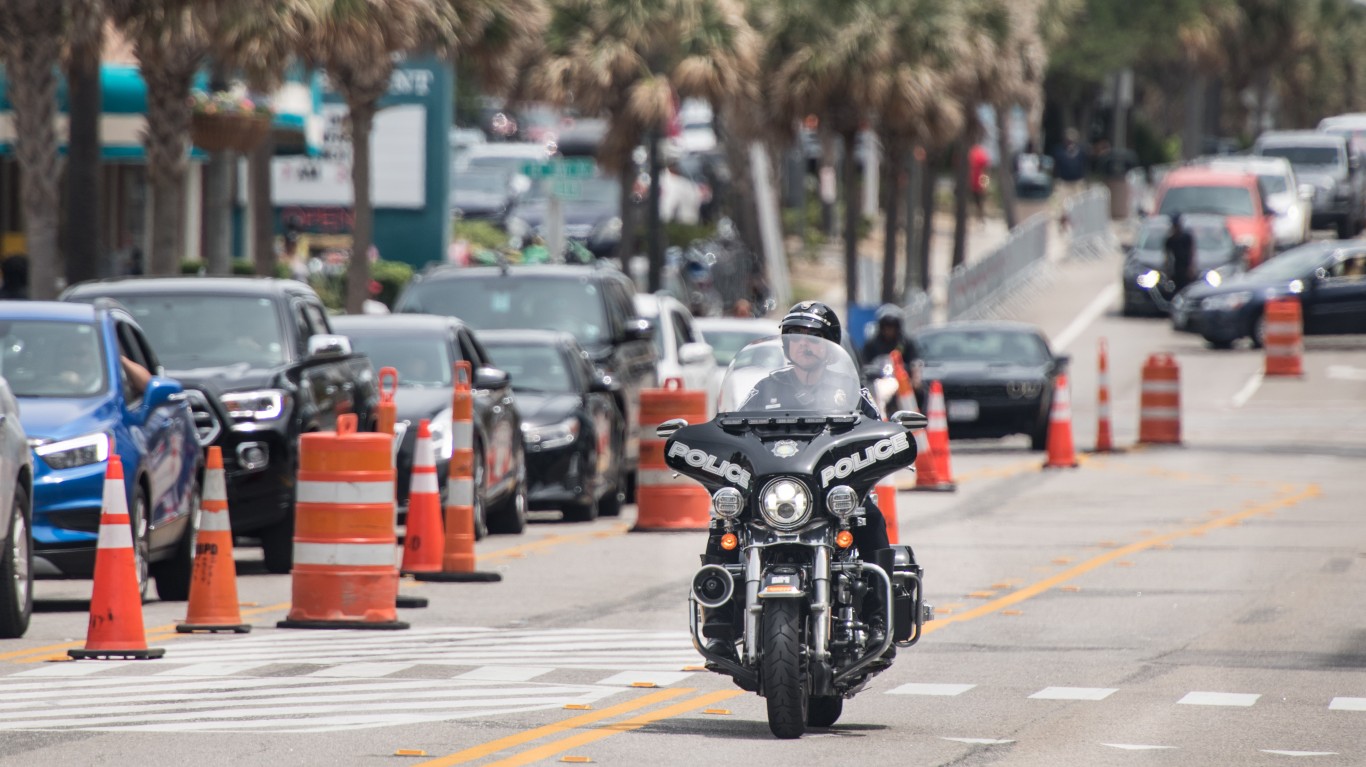
1. Myrtle Beach, South Carolina
> Total population: 33,687
> Law enforcement employees per 100K: 968
> Total law enforcement employees: 326 (247 officers, 79 civilian employees)
> Violent crimes reported per 100K in 2018: 1,404 (24th highest of 1,843 cities with pop. of 20K or more)
> Property crime reported per 100K in 2018: 10,547 (3rd highest of 1,843 cities with pop. of 20K or more)
> % of people below poverty level: 22.4% (259th highest of 1,843 cities with pop. of 20K or more)
> Pct. black: 14.4% (448th highest of 1,843 cities with pop. of 20K or more)
Methodology
To identify the cities with the most and least police officers, 24/7 Wall St. reviewed the number of police department employees for every 100,000 people in 1,843 cities, towns, and places with data from from the FBI’s 2018 Uniform Crime Report (UCR).
Places covered by the FBI statistics include cities, townships, counties, villages, and regional departments. Police employment includes officers (“individuals who ordinarily carry a firearm and a badge, have full arrest powers, and are paid from governmental funds set aside specifically to pay sworn law enforcement”), and civilians (“full-time agency personnel such as clerks, radio dispatchers, meter attendants, stenographers, jailers, correctional officers, and mechanics”).
Poverty rate and the percentage of each place’s population who identify as black or African American came from the U.S. Census Bureau’s American Community Survey 5-Year Estimates (2014 – 2018).
Take Charge of Your Retirement In Just A Few Minutes (Sponsor)
Retirement planning doesn’t have to feel overwhelming. The key is finding expert guidance—and SmartAsset’s simple quiz makes it easier than ever for you to connect with a vetted financial advisor.
Here’s how it works:
- Answer a Few Simple Questions. Tell us a bit about your goals and preferences—it only takes a few minutes!
- Get Matched with Vetted Advisors Our smart tool matches you with up to three pre-screened, vetted advisors who serve your area and are held to a fiduciary standard to act in your best interests. Click here to begin
- Choose Your Fit Review their profiles, schedule an introductory call (or meet in person), and select the advisor who feel is right for you.
Why wait? Start building the retirement you’ve always dreamed of. Click here to get started today!
Thank you for reading! Have some feedback for us?
Contact the 24/7 Wall St. editorial team.
 24/7 Wall St.
 24/7 Wall St.
 24/7 Wall St.

 24/7 Wall St.
