Special Report
How Often and Where People Are Going Is Changing Dramatically in Every State

Published:
Last Updated:

The coronavirus pandemic in the United States — which again is growing at a fierce pace with about 1 million new cases recorded in June — is reshaping society in many ways, from how we work and buy groceries to how we move and where we choose to go. With most states in various stages of reopening their economies, people’s movements have changed significantly.
24/7 Tempo analyzed population mobility data from Google to determine how the geographic movement of people has changed in every state.
In the week from June 26 until July 3, during which most states were in advanced phases of reopening, Americans were staying at home on average 8.9% more than during Google’s baseline period before the pandemic. This was inline with the difference from the base period in each of the three weeks prior. During the weeks ending June 26, June 19, and June 12, Americans stayed home on average 8.6%, 8.6%, and 9.6% more than during the base period.
Google used the five weeks between Jan. 3 and Feb. 6, 2020, as the baseline period — a period with a typical amount of travel before social distancing measures and stay-at-home orders were issued.
In our review, we included mobility data in several categories, including residential and workplace mobility; grocery and pharmacy mobility; and, parks mobility (public parks and beaches).
With the onset of summer, and after months of being strongly encouraged — and in some cases mandated — to stay home, the biggest change in mobility across the country has been in park visits.
Visits by Americans to parks, national parks, beaches, and other places for recreation in the week leading up to July 3 are up by 64.1% compared to the weeks between Jan. 3 and Feb. 6. Park visits were positive in all but four states — Hawaii, Florida, Arizona, and Nevada. The latter three are now on travel advisory lists because of high infection rates.
In the recreation and retail category there wasn’t the same change in mobility. People went out on average 11.4% less than during the pre-pandemic period of Jan. 3 – Feb. 6. Even though restaurants, bars, and other entertainment venues and businesses have reopened, it appears that most people are choosing to stay home. This was also the case across most of the United States, except in 18 states where the frequency of shopping and dining out was higher in the week through July 3 compared to before the pandemic.
The public transit use trend was still negative in 31 states. Only five states — Idaho, West Virginia, Montana, South Dakota, and Wyoming — saw an increase of more than 20% in public transit mobility. These states are generally with the lowest number of COVID-19 cases per capita.
As of July 8, the number of recorded cases of COVID-19 in the United States neared 3.1 million. Many states and major cities are reporting a second wave of coronavirus cases after reopening their economies — these are the states where the coronavirus is spreading the fastest right now.
Click here to read about how people’s movements are changing in every state.
Click here for our detailed methodology.

1. Alabama
> Statewide stay-at-home order: Issued Apr 4; ended Apr 30
> Time spent at home in 7 days ending July 3, compared to pre-pandemic: +7.6% (25th largest increase)
> Single day people stayed at home the most, compared to pre-pandemic: Apr 10, +20.0% more
> Time spent at home in 7 days ending July 3, compared to day people stayed at home the most (Apr 10): -12.4 ppts. (6th smallest decrease)
> Time spent at workplace in 7 days ending July 3, compared to pre-pandemic: -28.4% (14th smallest decrease)
> Pct. working from home before pandemic: 3.5% (4th lowest)
> Change in grocery store visits in 7 days ending July 3, compared to pre-pandemic: +7.4% (17th smallest increase)
> Pct. living more than 1 mile from supermarket: 61.3% (6th highest)
> Time spent at parks in 7 days ending July 3, compared to pre-pandemic: +51.1% (6th smallest increase)
> Avg. new cases per day in 7 days ending July 6: 1,045 (10th most)
[in-text-ad]

2. Alaska
> Statewide stay-at-home order: Issued Mar 28; ended Apr 24
> Time spent at home in 7 days ending July 3, compared to pre-pandemic: +3.6% (3rd smallest increase)
> Single day people stayed at home the most, compared to pre-pandemic: Apr 3, +20.0% more
> Time spent at home in 7 days ending July 3, compared to day people stayed at home the most (Apr 3): -16.4 ppts. (21st largest decrease)
> Time spent at workplace in 7 days ending July 3, compared to pre-pandemic: -25.6% (5th smallest decrease)
> Pct. working from home before pandemic: 5.3% (22nd highest)
> Change in grocery store visits in 7 days ending July 3, compared to pre-pandemic: +23.9% (5th largest increase)
> Pct. living more than 1 mile from supermarket: 55.6% (14th highest)
> Time spent at parks in 7 days ending July 3, compared to pre-pandemic: +201.4% (11th largest increase)
> Avg. new cases per day in 7 days ending July 6: 31 (5th fewest)

3. Arizona
> Statewide stay-at-home order: Issued Mar 30; ended Jun 16
> Time spent at home in 7 days ending July 3, compared to pre-pandemic: +11.3% (6th largest increase)
> Single day people stayed at home the most, compared to pre-pandemic: Apr 10, +20.0% more
> Time spent at home in 7 days ending July 3, compared to day people stayed at home the most (Apr 10): -8.7 ppts. (the smallest decrease)
> Time spent at workplace in 7 days ending July 3, compared to pre-pandemic: -35.9% (7th largest decrease)
> Pct. working from home before pandemic: 6.8% (7th highest)
> Change in grocery store visits in 7 days ending July 3, compared to pre-pandemic: -6.4% (3rd largest decrease)
> Pct. living more than 1 mile from supermarket: 35.0% (9th lowest)
> Time spent at parks in 7 days ending July 3, compared to pre-pandemic: -11.1% (3rd largest decrease)
> Avg. new cases per day in 7 days ending July 6: 3,268 (4th most)
4. Arkansas
> Statewide stay-at-home order: No stay-at-home order issued
> Time spent at home in 7 days ending July 3, compared to pre-pandemic: +5.9% (11th smallest increase)
> Single day people stayed at home the most, compared to pre-pandemic: May 25, +18.0% more
> Time spent at home in 7 days ending July 3, compared to day people stayed at home the most (May 25): -12.1 ppts. (5th smallest decrease)
> Time spent at workplace in 7 days ending July 3, compared to pre-pandemic: -27.6% (8th smallest decrease)
> Pct. working from home before pandemic: 3.7% (7th lowest)
> Change in grocery store visits in 7 days ending July 3, compared to pre-pandemic: +11.0% (16th largest increase)
> Pct. living more than 1 mile from supermarket: 60.2% (8th highest)
> Time spent at parks in 7 days ending July 3, compared to pre-pandemic: +113.3% (22nd smallest increase)
> Avg. new cases per day in 7 days ending July 6: 556 (17th most)
[in-text-ad-2]

5. California
> Statewide stay-at-home order: Issued Mar 19
> Time spent at home in 7 days ending July 3, compared to pre-pandemic: +11.7% (4th largest increase)
> Single day people stayed at home the most, compared to pre-pandemic: Apr 9, +26.0% more
> Time spent at home in 7 days ending July 3, compared to day people stayed at home the most (Apr 9): -14.3 ppts. (17th smallest decrease)
> Time spent at workplace in 7 days ending July 3, compared to pre-pandemic: -36.1% (6th largest decrease)
> Pct. working from home before pandemic: 6.0% (14th highest)
> Change in grocery store visits in 7 days ending July 3, compared to pre-pandemic: -3.9% (3rd smallest decrease)
> Pct. living more than 1 mile from supermarket: 18.7% (the lowest)
> Time spent at parks in 7 days ending July 3, compared to pre-pandemic: +12.4% (3rd smallest increase)
> Avg. new cases per day in 7 days ending July 6: 7,317 (2nd most)

6. Colorado
> Statewide stay-at-home order: Issued Mar 26; ended Jun 9
> Time spent at home in 7 days ending July 3, compared to pre-pandemic: +7.6% (25th largest increase)
> Single day people stayed at home the most, compared to pre-pandemic: Apr 16, +27.0% more
> Time spent at home in 7 days ending July 3, compared to day people stayed at home the most (Apr 16): -19.4 ppts. (5th largest decrease)
> Time spent at workplace in 7 days ending July 3, compared to pre-pandemic: -33.7% (15th largest decrease)
> Pct. working from home before pandemic: 8.6% (the highest)
> Change in grocery store visits in 7 days ending July 3, compared to pre-pandemic: +7.0% (15th smallest increase)
> Pct. living more than 1 mile from supermarket: 35.4% (11th lowest)
> Time spent at parks in 7 days ending July 3, compared to pre-pandemic: +108.7% (19th smallest increase)
> Avg. new cases per day in 7 days ending July 6: 253 (20th fewest)
[in-text-ad]

7. Connecticut
> Statewide stay-at-home order: No stay-at-home order issued
> Time spent at home in 7 days ending July 3, compared to pre-pandemic: +10.3% (9th largest increase)
> Single day people stayed at home the most, compared to pre-pandemic: Apr 10, +28.0% more
> Time spent at home in 7 days ending July 3, compared to day people stayed at home the most (Apr 10): -17.7 ppts. (12th largest decrease)
> Time spent at workplace in 7 days ending July 3, compared to pre-pandemic: -33.0% (19th largest decrease)
> Pct. working from home before pandemic: 5.7% (18th highest)
> Change in grocery store visits in 7 days ending July 3, compared to pre-pandemic: -0.4% (the smallest decrease)
> Pct. living more than 1 mile from supermarket: 42.5% (19th lowest)
> Time spent at parks in 7 days ending July 3, compared to pre-pandemic: +86.9% (12th smallest increase)
> Avg. new cases per day in 7 days ending July 6: 81 (12th fewest)

8. Delaware
> Statewide stay-at-home order: Issued Mar 24; ended Jul 1
> Time spent at home in 7 days ending July 3, compared to pre-pandemic: +8.4% (18th largest increase)
> Single day people stayed at home the most, compared to pre-pandemic: Apr 10, +25.0% more
> Time spent at home in 7 days ending July 3, compared to day people stayed at home the most (Apr 10): -16.6 ppts. (19th largest decrease)
> Time spent at workplace in 7 days ending July 3, compared to pre-pandemic: -30.4% (24th smallest decrease)
> Pct. working from home before pandemic: 5.7% (18th highest)
> Change in grocery store visits in 7 days ending July 3, compared to pre-pandemic: +9.4% (21st largest increase)
> Pct. living more than 1 mile from supermarket: 43.6% (21st lowest)
> Time spent at parks in 7 days ending July 3, compared to pre-pandemic: +131.2% (22nd largest increase)
> Avg. new cases per day in 7 days ending July 6: 119 (14th fewest)
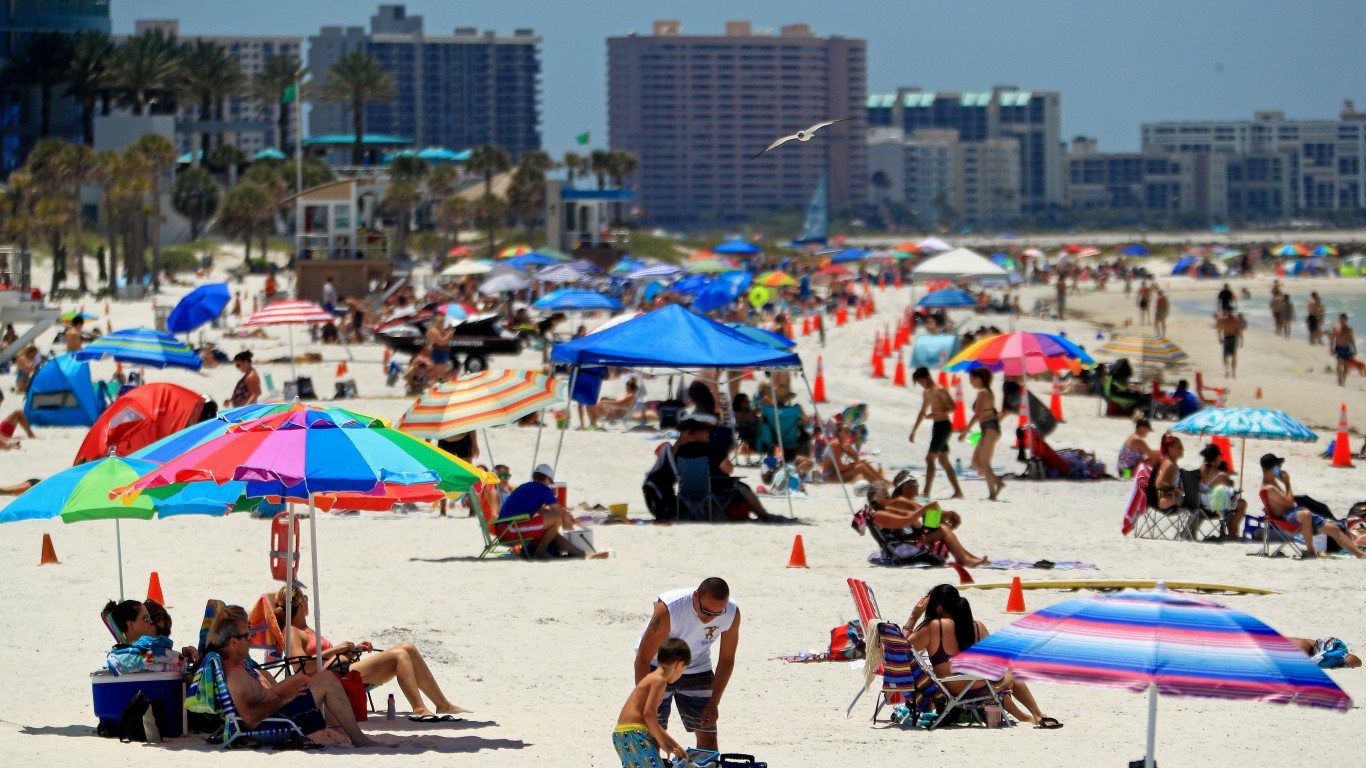
9. Florida
> Statewide stay-at-home order: Issued Apr 3; ended Jun 18
> Time spent at home in 7 days ending July 3, compared to pre-pandemic: +10.3% (9th largest increase)
> Single day people stayed at home the most, compared to pre-pandemic: Apr 10, +23.0% more
> Time spent at home in 7 days ending July 3, compared to day people stayed at home the most (Apr 10): -12.7 ppts. (8th smallest decrease)
> Time spent at workplace in 7 days ending July 3, compared to pre-pandemic: -32.7% (21st largest decrease)
> Pct. working from home before pandemic: 6.2% (9th highest)
> Change in grocery store visits in 7 days ending July 3, compared to pre-pandemic: -7.9% (2nd largest decrease)
> Pct. living more than 1 mile from supermarket: 35.6% (12th lowest)
> Time spent at parks in 7 days ending July 3, compared to pre-pandemic: -13.3% (2nd largest decrease)
> Avg. new cases per day in 7 days ending July 6: 7,883 (the most)
[in-text-ad-2]
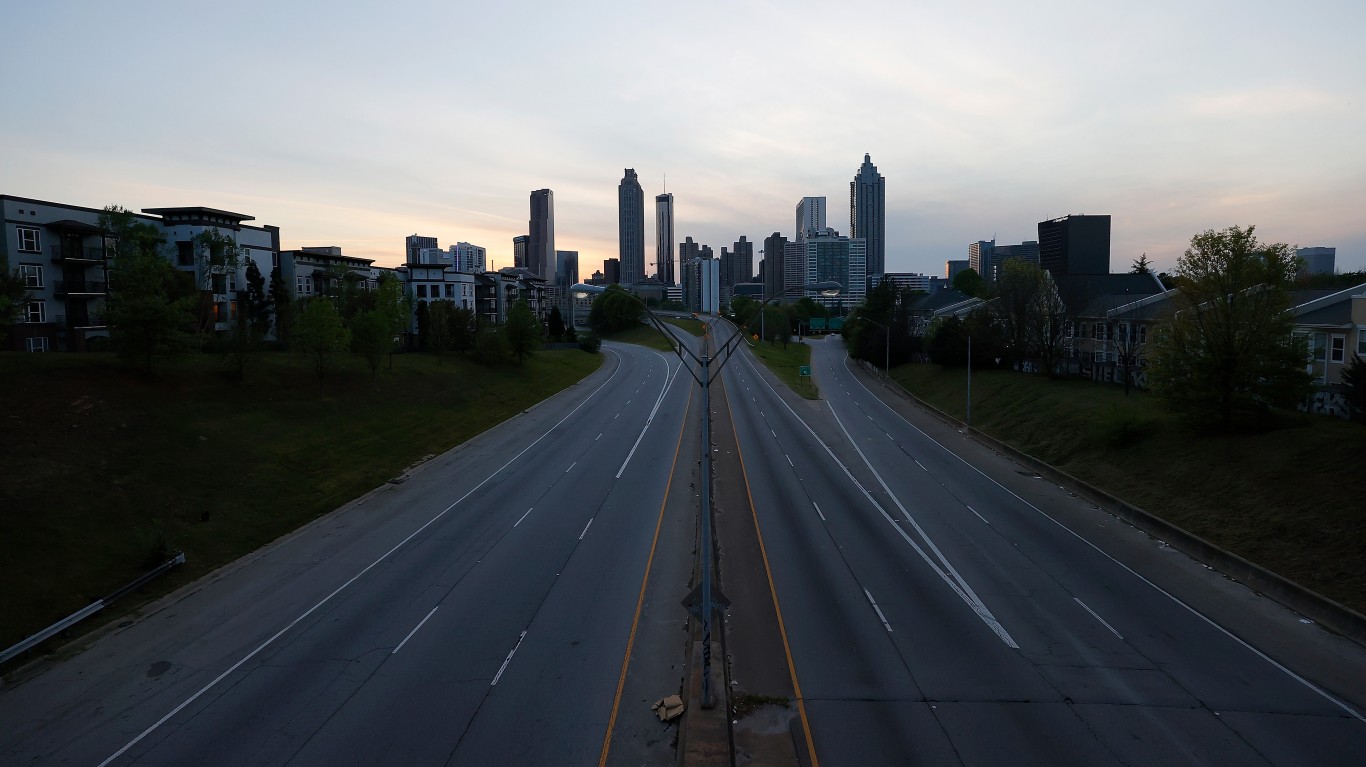
10. Georgia
> Statewide stay-at-home order: No stay-at-home order issued
> Time spent at home in 7 days ending July 3, compared to pre-pandemic: +8.9% (15th largest increase)
> Single day people stayed at home the most, compared to pre-pandemic: Apr 23, +23.0% more
> Time spent at home in 7 days ending July 3, compared to day people stayed at home the most (Apr 23): -14.1 ppts. (14th smallest decrease)
> Time spent at workplace in 7 days ending July 3, compared to pre-pandemic: -33.4% (17th largest decrease)
> Pct. working from home before pandemic: 5.9% (17th highest)
> Change in grocery store visits in 7 days ending July 3, compared to pre-pandemic: +2.1% (5th smallest increase)
> Pct. living more than 1 mile from supermarket: 54.8% (15th highest)
> Time spent at parks in 7 days ending July 3, compared to pre-pandemic: +51.9% (7th smallest increase)
> Avg. new cases per day in 7 days ending July 6: 2,368 (5th most)
11. Hawaii
> Statewide stay-at-home order: Issued Mar 25; ended Jul 10
> Time spent at home in 7 days ending July 3, compared to pre-pandemic: +11.9% (2nd largest increase)
> Single day people stayed at home the most, compared to pre-pandemic: Apr 10, +27.0% more
> Time spent at home in 7 days ending July 3, compared to day people stayed at home the most (Apr 10): -15.1 ppts. (23rd smallest decrease)
> Time spent at workplace in 7 days ending July 3, compared to pre-pandemic: -34.9% (10th largest decrease)
> Pct. working from home before pandemic: 5.4% (21st highest)
> Change in grocery store visits in 7 days ending July 3, compared to pre-pandemic: -16.9% (the largest decrease)
> Pct. living more than 1 mile from supermarket: 38.2% (15th lowest)
> Time spent at parks in 7 days ending July 3, compared to pre-pandemic: -30.0% (the largest decrease)
> Avg. new cases per day in 7 days ending July 6: 15 (2nd fewest)
[in-text-ad]
12. Idaho
> Statewide stay-at-home order: Issued Mar 25; ended Jun 1
> Time spent at home in 7 days ending July 3, compared to pre-pandemic: +3.9% (5th smallest increase)
> Single day people stayed at home the most, compared to pre-pandemic: Mar 27, +18.0% more
> Time spent at home in 7 days ending July 3, compared to day people stayed at home the most (Mar 27): -14.1 ppts. (14th smallest decrease)
> Time spent at workplace in 7 days ending July 3, compared to pre-pandemic: -28.0% (10th smallest decrease)
> Pct. working from home before pandemic: 6.2% (9th highest)
> Change in grocery store visits in 7 days ending July 3, compared to pre-pandemic: +21.9% (6th largest increase)
> Pct. living more than 1 mile from supermarket: 49.1% (22nd highest)
> Time spent at parks in 7 days ending July 3, compared to pre-pandemic: +215.2% (8th largest increase)
> Avg. new cases per day in 7 days ending July 6: 260 (21st fewest)

13. Illinois
> Statewide stay-at-home order: Issued Mar 21; ended Jun 29
> Time spent at home in 7 days ending July 3, compared to pre-pandemic: +8.3% (19th largest increase)
> Single day people stayed at home the most, compared to pre-pandemic: Apr 10, +24.0% more
> Time spent at home in 7 days ending July 3, compared to day people stayed at home the most (Apr 10): -15.7 ppts. (25th largest decrease)
> Time spent at workplace in 7 days ending July 3, compared to pre-pandemic: -33.1% (18th largest decrease)
> Pct. working from home before pandemic: 5.1% (25th lowest)
> Change in grocery store visits in 7 days ending July 3, compared to pre-pandemic: +4.4% (10th smallest increase)
> Pct. living more than 1 mile from supermarket: 30.5% (5th lowest)
> Time spent at parks in 7 days ending July 3, compared to pre-pandemic: +97.7% (15th smallest increase)
> Avg. new cases per day in 7 days ending July 6: 749 (12th most)
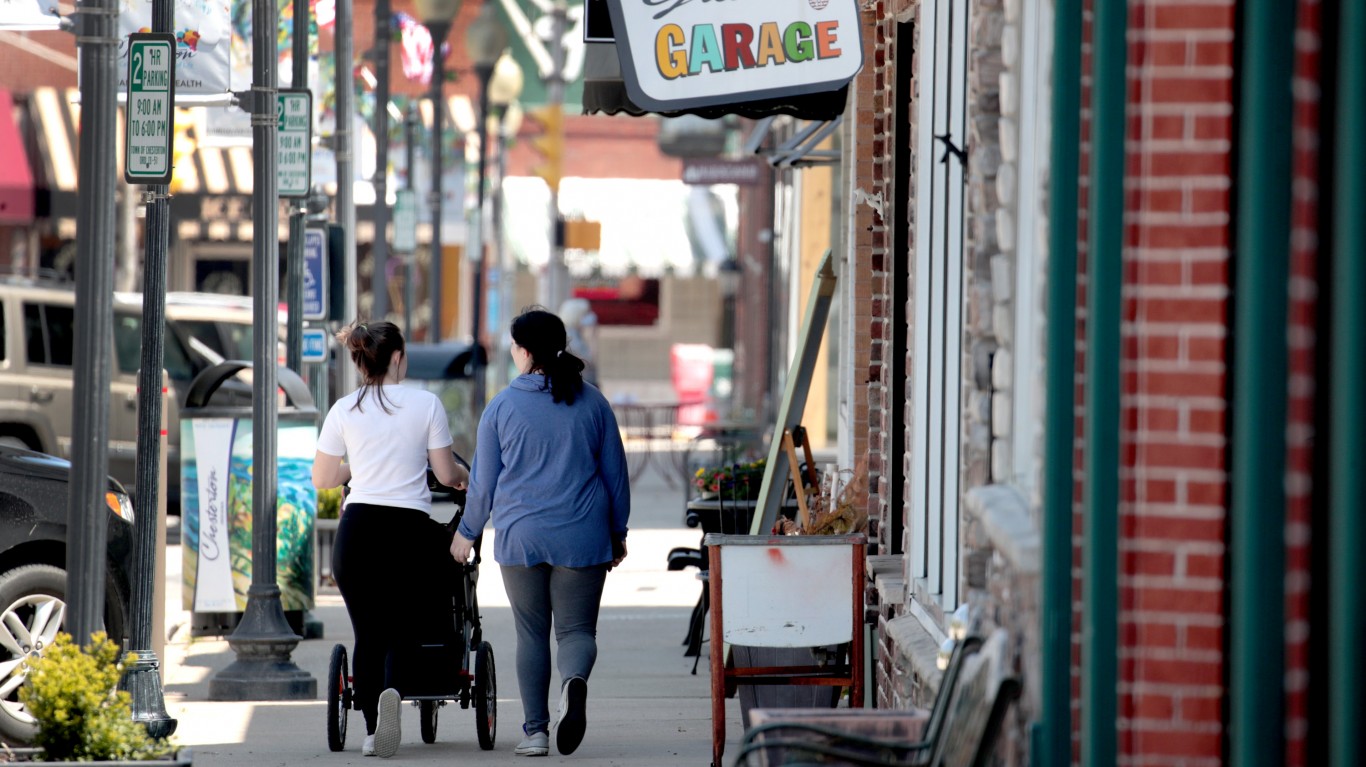
14. Indiana
> Statewide stay-at-home order: Issued Mar 25; ended Jun 18
> Time spent at home in 7 days ending July 3, compared to pre-pandemic: +6.1% (17th smallest increase)
> Single day people stayed at home the most, compared to pre-pandemic: Apr 10, +23.0% more
> Time spent at home in 7 days ending July 3, compared to day people stayed at home the most (Apr 10): -16.9 ppts. (18th largest decrease)
> Time spent at workplace in 7 days ending July 3, compared to pre-pandemic: -28.9% (18th smallest decrease)
> Pct. working from home before pandemic: 3.9% (8th lowest)
> Change in grocery store visits in 7 days ending July 3, compared to pre-pandemic: +10.3% (19th largest increase)
> Pct. living more than 1 mile from supermarket: 51.4% (18th highest)
> Time spent at parks in 7 days ending July 3, compared to pre-pandemic: +182.6% (14th largest increase)
> Avg. new cases per day in 7 days ending July 6: 380 (25th fewest)
[in-text-ad-2]
15. Iowa
> Statewide stay-at-home order: No stay-at-home order issued
> Time spent at home in 7 days ending July 3, compared to pre-pandemic: +5.4% (8th smallest increase)
> Single day people stayed at home the most, compared to pre-pandemic: May 25, +21.0% more
> Time spent at home in 7 days ending July 3, compared to day people stayed at home the most (May 25): -15.6 ppts. (25th smallest decrease)
> Time spent at workplace in 7 days ending July 3, compared to pre-pandemic: -26.9% (7th smallest decrease)
> Pct. working from home before pandemic: 5.1% (25th lowest)
> Change in grocery store visits in 7 days ending July 3, compared to pre-pandemic: +25.0% (4th largest increase)
> Pct. living more than 1 mile from supermarket: 46.8% (25th highest)
> Time spent at parks in 7 days ending July 3, compared to pre-pandemic: +237.9% (5th largest increase)
> Avg. new cases per day in 7 days ending July 6: 394 (24th most)

16. Kansas
> Statewide stay-at-home order: Issued Mar 30; ended Jun 4
> Time spent at home in 7 days ending July 3, compared to pre-pandemic: +5.7% (9th smallest increase)
> Single day people stayed at home the most, compared to pre-pandemic: Apr 16, +20.0% more
> Time spent at home in 7 days ending July 3, compared to day people stayed at home the most (Apr 16): -14.3 ppts. (17th smallest decrease)
> Time spent at workplace in 7 days ending July 3, compared to pre-pandemic: -28.4% (14th smallest decrease)
> Pct. working from home before pandemic: 4.8% (19th lowest)
> Change in grocery store visits in 7 days ending July 3, compared to pre-pandemic: +7.7% (18th smallest increase)
> Pct. living more than 1 mile from supermarket: 43.8% (22nd lowest)
> Time spent at parks in 7 days ending July 3, compared to pre-pandemic: +150.1% (19th largest increase)
> Avg. new cases per day in 7 days ending July 6: 298 (22nd fewest)
[in-text-ad]

17. Kentucky
> Statewide stay-at-home order: No stay-at-home order issued
> Time spent at home in 7 days ending July 3, compared to pre-pandemic: +6.6% (20th smallest increase)
> Single day people stayed at home the most, compared to pre-pandemic: Apr 10, +21.0% more
> Time spent at home in 7 days ending July 3, compared to day people stayed at home the most (Apr 10): -14.4 ppts. (19th smallest decrease)
> Time spent at workplace in 7 days ending July 3, compared to pre-pandemic: -30.3% (22nd smallest decrease)
> Pct. working from home before pandemic: 4.1% (11th lowest)
> Change in grocery store visits in 7 days ending July 3, compared to pre-pandemic: +10.3% (18th largest increase)
> Pct. living more than 1 mile from supermarket: 57.0% (10th highest)
> Time spent at parks in 7 days ending July 3, compared to pre-pandemic: +112.6% (21st smallest increase)
> Avg. new cases per day in 7 days ending July 6: 192 (16th fewest)

18. Louisiana
> Statewide stay-at-home order: Issued Mar 23; ended Jun 15
> Time spent at home in 7 days ending July 3, compared to pre-pandemic: +7.9% (22nd largest increase)
> Single day people stayed at home the most, compared to pre-pandemic: Apr 10, +24.0% more
> Time spent at home in 7 days ending July 3, compared to day people stayed at home the most (Apr 10): -16.1 ppts. (23rd largest decrease)
> Time spent at workplace in 7 days ending July 3, compared to pre-pandemic: -29.0% (19th smallest decrease)
> Pct. working from home before pandemic: 3.4% (3rd lowest)
> Change in grocery store visits in 7 days ending July 3, compared to pre-pandemic: +3.7% (8th smallest increase)
> Pct. living more than 1 mile from supermarket: 50.4% (20th highest)
> Time spent at parks in 7 days ending July 3, compared to pre-pandemic: +7.6% (the smallest increase)
> Avg. new cases per day in 7 days ending July 6: 1,154 (9th most)

19. Maine
> Statewide stay-at-home order: Issued Apr 2; ended Jun 31
> Time spent at home in 7 days ending July 3, compared to pre-pandemic: +6.1% (17th smallest increase)
> Single day people stayed at home the most, compared to pre-pandemic: Apr 3, +23.0% more
> Time spent at home in 7 days ending July 3, compared to day people stayed at home the most (Apr 3): -16.9 ppts. (18th largest decrease)
> Time spent at workplace in 7 days ending July 3, compared to pre-pandemic: -28.4% (14th smallest decrease)
> Pct. working from home before pandemic: 6.0% (14th highest)
> Change in grocery store visits in 7 days ending July 3, compared to pre-pandemic: +14.6% (8th largest increase)
> Pct. living more than 1 mile from supermarket: 66.4% (3rd highest)
> Time spent at parks in 7 days ending July 3, compared to pre-pandemic: +219.1% (7th largest increase)
> Avg. new cases per day in 7 days ending July 6: 34 (6th fewest)
[in-text-ad-2]

20. Maryland
> Statewide stay-at-home order: Issued Mar 30; ended Jun 15
> Time spent at home in 7 days ending July 3, compared to pre-pandemic: +11.1% (7th largest increase)
> Single day people stayed at home the most, compared to pre-pandemic: Apr 10, +28.0% more
> Time spent at home in 7 days ending July 3, compared to day people stayed at home the most (Apr 10): -16.9 ppts. (18th largest decrease)
> Time spent at workplace in 7 days ending July 3, compared to pre-pandemic: -36.7% (4th largest decrease)
> Pct. working from home before pandemic: 5.2% (24th highest)
> Change in grocery store visits in 7 days ending July 3, compared to pre-pandemic: +1.4% (2nd smallest increase)
> Pct. living more than 1 mile from supermarket: 35.1% (10th lowest)
> Time spent at parks in 7 days ending July 3, compared to pre-pandemic: +135.7% (21st largest increase)
> Avg. new cases per day in 7 days ending July 6: 388 (25th most)

21. Massachusetts
> Statewide stay-at-home order: No stay-at-home order issued
> Time spent at home in 7 days ending July 3, compared to pre-pandemic: +12.0% (the largest increase)
> Single day people stayed at home the most, compared to pre-pandemic: Apr 3, +30.0% more
> Time spent at home in 7 days ending July 3, compared to day people stayed at home the most (Apr 3): -18.0 ppts. (11th largest decrease)
> Time spent at workplace in 7 days ending July 3, compared to pre-pandemic: -38.6% (the largest decrease)
> Pct. working from home before pandemic: 5.3% (22nd highest)
> Change in grocery store visits in 7 days ending July 3, compared to pre-pandemic: -4.9% (4th largest decrease)
> Pct. living more than 1 mile from supermarket: 36.2% (13th lowest)
> Time spent at parks in 7 days ending July 3, compared to pre-pandemic: +75.9% (10th smallest increase)
> Avg. new cases per day in 7 days ending July 6: 206 (18th fewest)
[in-text-ad]

22. Michigan
> Statewide stay-at-home order: Issued Mar 24; ended Jul 1
> Time spent at home in 7 days ending July 3, compared to pre-pandemic: +6.0% (14th smallest increase)
> Single day people stayed at home the most, compared to pre-pandemic: Apr 10, +30.0% more
> Time spent at home in 7 days ending July 3, compared to day people stayed at home the most (Apr 10): -24.0 ppts. (the largest decrease)
> Time spent at workplace in 7 days ending July 3, compared to pre-pandemic: -31.7% (24th largest decrease)
> Pct. working from home before pandemic: 4.1% (11th lowest)
> Change in grocery store visits in 7 days ending July 3, compared to pre-pandemic: +11.1% (15th largest increase)
> Pct. living more than 1 mile from supermarket: 45.9% (24th lowest)
> Time spent at parks in 7 days ending July 3, compared to pre-pandemic: +302.7% (2nd largest increase)
> Avg. new cases per day in 7 days ending July 6: 347 (24th fewest)

23. Minnesota
> Statewide stay-at-home order: Issued Mar 28; ended Jun 18
> Time spent at home in 7 days ending July 3, compared to pre-pandemic: +8.1% (21st largest increase)
> Single day people stayed at home the most, compared to pre-pandemic: Apr 3, +27.0% more
> Time spent at home in 7 days ending July 3, compared to day people stayed at home the most (Apr 3): -18.9 ppts. (7th largest decrease)
> Time spent at workplace in 7 days ending July 3, compared to pre-pandemic: -33.7% (15th largest decrease)
> Pct. working from home before pandemic: 6.1% (13th highest)
> Change in grocery store visits in 7 days ending July 3, compared to pre-pandemic: +11.1% (14th largest increase)
> Pct. living more than 1 mile from supermarket: 48.6% (23rd highest)
> Time spent at parks in 7 days ending July 3, compared to pre-pandemic: +180.0% (16th largest increase)
> Avg. new cases per day in 7 days ending July 6: 403 (22nd most)
24. Mississippi
> Statewide stay-at-home order: Issued Apr 3; ended Apr 27
> Time spent at home in 7 days ending July 3, compared to pre-pandemic: +6.0% (14th smallest increase)
> Single day people stayed at home the most, compared to pre-pandemic: Apr 10, +20.0% more
> Time spent at home in 7 days ending July 3, compared to day people stayed at home the most (Apr 10): -14.0 ppts. (13th smallest decrease)
> Time spent at workplace in 7 days ending July 3, compared to pre-pandemic: -27.7% (9th smallest decrease)
> Pct. working from home before pandemic: 2.6% (the lowest)
> Change in grocery store visits in 7 days ending July 3, compared to pre-pandemic: +7.3% (16th smallest increase)
> Pct. living more than 1 mile from supermarket: 68.6% (the highest)
> Time spent at parks in 7 days ending July 3, compared to pre-pandemic: +45.7% (5th smallest increase)
> Avg. new cases per day in 7 days ending July 6: 657 (13th most)
[in-text-ad-2]

25. Missouri
> Statewide stay-at-home order: Issued Apr 6; ended Jun 15
> Time spent at home in 7 days ending July 3, compared to pre-pandemic: +6.1% (17th smallest increase)
> Single day people stayed at home the most, compared to pre-pandemic: Apr 3, +19.0% more
> Time spent at home in 7 days ending July 3, compared to day people stayed at home the most (Apr 3): -12.9 ppts. (9th smallest decrease)
> Time spent at workplace in 7 days ending July 3, compared to pre-pandemic: -28.0% (10th smallest decrease)
> Pct. working from home before pandemic: 4.8% (19th lowest)
> Change in grocery store visits in 7 days ending July 3, compared to pre-pandemic: +11.7% (12th largest increase)
> Pct. living more than 1 mile from supermarket: 49.2% (21st highest)
> Time spent at parks in 7 days ending July 3, compared to pre-pandemic: +119.0% (23rd smallest increase)
> Avg. new cases per day in 7 days ending July 6: 87 (13th fewest)

26. Montana
> Statewide stay-at-home order: Issued Mar 26; ended Apr 26
> Time spent at home in 7 days ending July 3, compared to pre-pandemic: +3.1% (2nd smallest increase)
> Single day people stayed at home the most, compared to pre-pandemic: Apr 3, +19.0% more
> Time spent at home in 7 days ending July 3, compared to day people stayed at home the most (Apr 3): -15.9 ppts. (24th largest decrease)
> Time spent at workplace in 7 days ending July 3, compared to pre-pandemic: -23.6% (the smallest decrease)
> Pct. working from home before pandemic: 7.3% (4th highest)
> Change in grocery store visits in 7 days ending July 3, compared to pre-pandemic: +27.9% (3rd largest increase)
> Pct. living more than 1 mile from supermarket: 53.1% (16th highest)
> Time spent at parks in 7 days ending July 3, compared to pre-pandemic: +182.1% (15th largest increase)
> Avg. new cases per day in 7 days ending July 6: 41 (8th fewest)
[in-text-ad]

27. Nebraska
> Statewide stay-at-home order: No stay-at-home order issued
> Time spent at home in 7 days ending July 3, compared to pre-pandemic: +6.0% (14th smallest increase)
> Single day people stayed at home the most, compared to pre-pandemic: May 25, +23.0% more
> Time spent at home in 7 days ending July 3, compared to day people stayed at home the most (May 25): -17.0 ppts. (15th largest decrease)
> Time spent at workplace in 7 days ending July 3, compared to pre-pandemic: -28.4% (14th smallest decrease)
> Pct. working from home before pandemic: 5.1% (25th lowest)
> Change in grocery store visits in 7 days ending July 3, compared to pre-pandemic: +13.9% (9th largest increase)
> Pct. living more than 1 mile from supermarket: 36.4% (14th lowest)
> Time spent at parks in 7 days ending July 3, compared to pre-pandemic: +188.3% (13th largest increase)
> Avg. new cases per day in 7 days ending July 6: 154 (15th fewest)

28. Nevada
> Statewide stay-at-home order: Issued Mar 31; ended Jun 9
> Time spent at home in 7 days ending July 3, compared to pre-pandemic: +9.4% (12th largest increase)
> Single day people stayed at home the most, compared to pre-pandemic: Apr 10, +24.0% more
> Time spent at home in 7 days ending July 3, compared to day people stayed at home the most (Apr 10): -14.6 ppts. (21st smallest decrease)
> Time spent at workplace in 7 days ending July 3, compared to pre-pandemic: -35.6% (8th largest decrease)
> Pct. working from home before pandemic: 4.2% (12th lowest)
> Change in grocery store visits in 7 days ending July 3, compared to pre-pandemic: +1.4% (3rd smallest increase)
> Pct. living more than 1 mile from supermarket: 28.8% (3rd lowest)
> Time spent at parks in 7 days ending July 3, compared to pre-pandemic: -9.3% (4th largest decrease)
> Avg. new cases per day in 7 days ending July 6: 641 (14th most)

29. New Hampshire
> Statewide stay-at-home order: Issued Mar 27; ended Jul 16
> Time spent at home in 7 days ending July 3, compared to pre-pandemic: +8.9% (15th largest increase)
> Single day people stayed at home the most, compared to pre-pandemic: Apr 3, +25.0% more
> Time spent at home in 7 days ending July 3, compared to day people stayed at home the most (Apr 3): -16.1 ppts. (23rd largest decrease)
> Time spent at workplace in 7 days ending July 3, compared to pre-pandemic: -31.3% (25th largest decrease)
> Pct. working from home before pandemic: 6.9% (5th highest)
> Change in grocery store visits in 7 days ending July 3, compared to pre-pandemic: +9.7% (20th largest increase)
> Pct. living more than 1 mile from supermarket: 66.4% (2nd highest)
> Time spent at parks in 7 days ending July 3, compared to pre-pandemic: +190.4% (12th largest increase)
> Avg. new cases per day in 7 days ending July 6: 25 (3rd fewest)
[in-text-ad-2]

30. New Jersey
> Statewide stay-at-home order: Issued Mar 21; ended Jul 9
> Time spent at home in 7 days ending July 3, compared to pre-pandemic: +11.7% (4th largest increase)
> Single day people stayed at home the most, compared to pre-pandemic: Apr 10, +33.0% more
> Time spent at home in 7 days ending July 3, compared to day people stayed at home the most (Apr 10): -21.3 ppts. (2nd largest decrease)
> Time spent at workplace in 7 days ending July 3, compared to pre-pandemic: -36.4% (5th largest decrease)
> Pct. working from home before pandemic: 4.7% (16th lowest)
> Change in grocery store visits in 7 days ending July 3, compared to pre-pandemic: +2.9% (7th smallest increase)
> Pct. living more than 1 mile from supermarket: 30.0% (4th lowest)
> Time spent at parks in 7 days ending July 3, compared to pre-pandemic: +138.1% (20th largest increase)
> Avg. new cases per day in 7 days ending July 6: 308 (23rd fewest)

31. New Mexico
> Statewide stay-at-home order: No stay-at-home order issued
> Time spent at home in 7 days ending July 3, compared to pre-pandemic: +8.6% (17th largest increase)
> Single day people stayed at home the most, compared to pre-pandemic: Apr 10, +20.0% more
> Time spent at home in 7 days ending July 3, compared to day people stayed at home the most (Apr 10): -11.4 ppts. (2nd smallest decrease)
> Time spent at workplace in 7 days ending July 3, compared to pre-pandemic: -31.1% (25th smallest decrease)
> Pct. working from home before pandemic: 5.1% (25th lowest)
> Change in grocery store visits in 7 days ending July 3, compared to pre-pandemic: +8.1% (21st smallest increase)
> Pct. living more than 1 mile from supermarket: 51.0% (19th highest)
> Time spent at parks in 7 days ending July 3, compared to pre-pandemic: +44.9% (4th smallest increase)
> Avg. new cases per day in 7 days ending July 6: 193 (17th fewest)
[in-text-ad]

32. New York
> Statewide stay-at-home order: Issued Mar 22; ended Jul 8
> Time spent at home in 7 days ending July 3, compared to pre-pandemic: +11.0% (8th largest increase)
> Single day people stayed at home the most, compared to pre-pandemic: Apr 10, +32.0% more
> Time spent at home in 7 days ending July 3, compared to day people stayed at home the most (Apr 10): -21.0 ppts. (3rd largest decrease)
> Time spent at workplace in 7 days ending July 3, compared to pre-pandemic: -37.1% (3rd largest decrease)
> Pct. working from home before pandemic: 4.5% (14th lowest)
> Change in grocery store visits in 7 days ending July 3, compared to pre-pandemic: +1.3% (the smallest increase)
> Pct. living more than 1 mile from supermarket: 23.0% (2nd lowest)
> Time spent at parks in 7 days ending July 3, compared to pre-pandemic: +62.4% (8th smallest increase)
> Avg. new cases per day in 7 days ending July 6: 593 (16th most)

33. North Carolina
> Statewide stay-at-home order: Issued Mar 30; ended Jun 8
> Time spent at home in 7 days ending July 3, compared to pre-pandemic: +7.7% (23rd largest increase)
> Single day people stayed at home the most, compared to pre-pandemic: Apr 10, +21.0% more
> Time spent at home in 7 days ending July 3, compared to day people stayed at home the most (Apr 10): -13.3 ppts. (10th smallest decrease)
> Time spent at workplace in 7 days ending July 3, compared to pre-pandemic: -31.9% (23rd largest decrease)
> Pct. working from home before pandemic: 6.0% (14th highest)
> Change in grocery store visits in 7 days ending July 3, compared to pre-pandemic: +5.4% (12th smallest increase)
> Pct. living more than 1 mile from supermarket: 56.4% (13th highest)
> Time spent at parks in 7 days ending July 3, compared to pre-pandemic: +85.7% (11th smallest increase)
> Avg. new cases per day in 7 days ending July 6: 1,518 (7th most)

34. North Dakota
> Statewide stay-at-home order: No stay-at-home order issued
> Time spent at home in 7 days ending July 3, compared to pre-pandemic: +3.7% (4th smallest increase)
> Single day people stayed at home the most, compared to pre-pandemic: Apr 3, +24.0% more
> Time spent at home in 7 days ending July 3, compared to day people stayed at home the most (Apr 3): -20.3 ppts. (4th largest decrease)
> Time spent at workplace in 7 days ending July 3, compared to pre-pandemic: -24.7% (4th smallest decrease)
> Pct. working from home before pandemic: 3.7% (7th lowest)
> Change in grocery store visits in 7 days ending July 3, compared to pre-pandemic: +10.9% (17th largest increase)
> Pct. living more than 1 mile from supermarket: 44.5% (23rd lowest)
> Time spent at parks in 7 days ending July 3, compared to pre-pandemic: +206.3% (10th largest increase)
> Avg. new cases per day in 7 days ending July 6: 41 (7th fewest)
[in-text-ad-2]

35. Ohio
> Statewide stay-at-home order: Issued Mar 23; ended Jun 20
> Time spent at home in 7 days ending July 3, compared to pre-pandemic: +6.3% (18th smallest increase)
> Single day people stayed at home the most, compared to pre-pandemic: Apr 10, +24.0% more
> Time spent at home in 7 days ending July 3, compared to day people stayed at home the most (Apr 10): -17.7 ppts. (13th largest decrease)
> Time spent at workplace in 7 days ending July 3, compared to pre-pandemic: -30.3% (22nd smallest decrease)
> Pct. working from home before pandemic: 4.4% (13th lowest)
> Change in grocery store visits in 7 days ending July 3, compared to pre-pandemic: +9.3% (22nd smallest increase)
> Pct. living more than 1 mile from supermarket: 46.3% (25th lowest)
> Time spent at parks in 7 days ending July 3, compared to pre-pandemic: +206.4% (9th largest increase)
> Avg. new cases per day in 7 days ending July 6: 910 (11th most)

36. Oklahoma
> Statewide stay-at-home order: No stay-at-home order issued
> Time spent at home in 7 days ending July 3, compared to pre-pandemic: +5.9% (11th smallest increase)
> Single day people stayed at home the most, compared to pre-pandemic: Apr 3, +20.0% more
> Time spent at home in 7 days ending July 3, compared to day people stayed at home the most (Apr 3): -14.1 ppts. (16th smallest decrease)
> Time spent at workplace in 7 days ending July 3, compared to pre-pandemic: -28.0% (10th smallest decrease)
> Pct. working from home before pandemic: 4.1% (11th lowest)
> Change in grocery store visits in 7 days ending July 3, compared to pre-pandemic: +11.3% (13th largest increase)
> Pct. living more than 1 mile from supermarket: 52.0% (17th highest)
> Time spent at parks in 7 days ending July 3, compared to pre-pandemic: +87.0% (13th smallest increase)
> Avg. new cases per day in 7 days ending July 6: 396 (23rd most)
[in-text-ad]

37. Oregon
> Statewide stay-at-home order: Issued Mar 23; ended Jul 19
> Time spent at home in 7 days ending July 3, compared to pre-pandemic: +7.6% (25th largest increase)
> Single day people stayed at home the most, compared to pre-pandemic: Mar 27, +20.0% more
> Time spent at home in 7 days ending July 3, compared to day people stayed at home the most (Mar 27): -12.4 ppts. (6th smallest decrease)
> Time spent at workplace in 7 days ending July 3, compared to pre-pandemic: -33.7% (15th largest decrease)
> Pct. working from home before pandemic: 7.5% (2nd highest)
> Change in grocery store visits in 7 days ending July 3, compared to pre-pandemic: +6.3% (13th smallest increase)
> Pct. living more than 1 mile from supermarket: 34.2% (7th lowest)
> Time spent at parks in 7 days ending July 3, compared to pre-pandemic: +111.3% (20th smallest increase)
> Avg. new cases per day in 7 days ending July 6: 223 (19th fewest)

38. Pennsylvania
> Statewide stay-at-home order: Issued Apr 1; ended Jul 5
> Time spent at home in 7 days ending July 3, compared to pre-pandemic: +7.7% (23rd largest increase)
> Single day people stayed at home the most, compared to pre-pandemic: Apr 10, +27.0% more
> Time spent at home in 7 days ending July 3, compared to day people stayed at home the most (Apr 10): -19.3 ppts. (6th largest decrease)
> Time spent at workplace in 7 days ending July 3, compared to pre-pandemic: -32.6% (22nd largest decrease)
> Pct. working from home before pandemic: 5.1% (25th lowest)
> Change in grocery store visits in 7 days ending July 3, compared to pre-pandemic: +4.6% (11th smallest increase)
> Pct. living more than 1 mile from supermarket: 42.5% (18th lowest)
> Time spent at parks in 7 days ending July 3, compared to pre-pandemic: +124.0% (23rd largest increase)
> Avg. new cases per day in 7 days ending July 6: 632 (15th most)

39. Rhode Island
> Statewide stay-at-home order: Issued Mar 28; ended Jun 9
> Time spent at home in 7 days ending July 3, compared to pre-pandemic: +9.0% (14th largest increase)
> Single day people stayed at home the most, compared to pre-pandemic: Apr 3, +26.0% more
> Time spent at home in 7 days ending July 3, compared to day people stayed at home the most (Apr 3): -17.0 ppts. (15th largest decrease)
> Time spent at workplace in 7 days ending July 3, compared to pre-pandemic: -32.9% (20th largest decrease)
> Pct. working from home before pandemic: 3.7% (7th lowest)
> Change in grocery store visits in 7 days ending July 3, compared to pre-pandemic: +2.6% (6th smallest increase)
> Pct. living more than 1 mile from supermarket: 32.6% (6th lowest)
> Time spent at parks in 7 days ending July 3, compared to pre-pandemic: +231.0% (6th largest increase)
> Avg. new cases per day in 7 days ending July 6: 42 (9th fewest)
[in-text-ad-2]

40. South Carolina
> Statewide stay-at-home order: Issued Apr 7; ended Jun 4
> Time spent at home in 7 days ending July 3, compared to pre-pandemic: +7.3% (22nd smallest increase)
> Single day people stayed at home the most, compared to pre-pandemic: Apr 10, +19.0% more
> Time spent at home in 7 days ending July 3, compared to day people stayed at home the most (Apr 10): -11.7 ppts. (3rd smallest decrease)
> Time spent at workplace in 7 days ending July 3, compared to pre-pandemic: -29.0% (19th smallest decrease)
> Pct. working from home before pandemic: 5.0% (20th lowest)
> Change in grocery store visits in 7 days ending July 3, compared to pre-pandemic: +8.0% (19th smallest increase)
> Pct. living more than 1 mile from supermarket: 60.9% (7th highest)
> Time spent at parks in 7 days ending July 3, compared to pre-pandemic: +66.7% (9th smallest increase)
> Avg. new cases per day in 7 days ending July 6: 1,531 (6th most)

41. South Dakota
> Statewide stay-at-home order: No stay-at-home order issued
> Time spent at home in 7 days ending July 3, compared to pre-pandemic: +4.0% (6th smallest increase)
> Single day people stayed at home the most, compared to pre-pandemic: Apr 3, +22.0% more
> Time spent at home in 7 days ending July 3, compared to day people stayed at home the most (Apr 3): -18.0 ppts. (11th largest decrease)
> Time spent at workplace in 7 days ending July 3, compared to pre-pandemic: -24.3% (3rd smallest decrease)
> Pct. working from home before pandemic: 6.2% (9th highest)
> Change in grocery store visits in 7 days ending July 3, compared to pre-pandemic: +37.3% (the largest increase)
> Pct. living more than 1 mile from supermarket: 56.5% (12th highest)
> Time spent at parks in 7 days ending July 3, compared to pre-pandemic: +376.0% (the largest increase)
> Avg. new cases per day in 7 days ending July 6: 52 (10th fewest)
[in-text-ad]

42. Tennessee
> Statewide stay-at-home order: Issued Apr 2; ended Jun 26
> Time spent at home in 7 days ending July 3, compared to pre-pandemic: +6.7% (21st smallest increase)
> Single day people stayed at home the most, compared to pre-pandemic: Apr 10, +20.0% more
> Time spent at home in 7 days ending July 3, compared to day people stayed at home the most (Apr 10): -13.3 ppts. (11th smallest decrease)
> Time spent at workplace in 7 days ending July 3, compared to pre-pandemic: -29.6% (21st smallest decrease)
> Pct. working from home before pandemic: 4.7% (16th lowest)
> Change in grocery store visits in 7 days ending July 3, compared to pre-pandemic: +8.0% (20th smallest increase)
> Pct. living more than 1 mile from supermarket: 59.5% (9th highest)
> Time spent at parks in 7 days ending July 3, compared to pre-pandemic: +98.4% (16th smallest increase)
> Avg. new cases per day in 7 days ending July 6: 1,225 (8th most)

43. Texas
> Statewide stay-at-home order: Issued Apr 2; ended Jun 1
> Time spent at home in 7 days ending July 3, compared to pre-pandemic: +11.9% (2nd largest increase)
> Single day people stayed at home the most, compared to pre-pandemic: Apr 10, +24.0% more
> Time spent at home in 7 days ending July 3, compared to day people stayed at home the most (Apr 10): -12.1 ppts. (4th smallest decrease)
> Time spent at workplace in 7 days ending July 3, compared to pre-pandemic: -34.9% (10th largest decrease)
> Pct. working from home before pandemic: 5.2% (24th highest)
> Change in grocery store visits in 7 days ending July 3, compared to pre-pandemic: -2.6% (2nd smallest decrease)
> Pct. living more than 1 mile from supermarket: 41.9% (17th lowest)
> Time spent at parks in 7 days ending July 3, compared to pre-pandemic: +7.7% (2nd smallest increase)
> Avg. new cases per day in 7 days ending July 6: 6,412 (3rd most)

44. Utah
> Statewide stay-at-home order: No stay-at-home order issued
> Time spent at home in 7 days ending July 3, compared to pre-pandemic: +7.4% (23rd smallest increase)
> Single day people stayed at home the most, compared to pre-pandemic: Apr 2, +21.0% more
> Time spent at home in 7 days ending July 3, compared to day people stayed at home the most (Apr 2): -13.6 ppts. (12th smallest decrease)
> Time spent at workplace in 7 days ending July 3, compared to pre-pandemic: -34.7% (11th largest decrease)
> Pct. working from home before pandemic: 6.9% (5th highest)
> Change in grocery store visits in 7 days ending July 3, compared to pre-pandemic: +13.4% (10th largest increase)
> Pct. living more than 1 mile from supermarket: 34.8% (8th lowest)
> Time spent at parks in 7 days ending July 3, compared to pre-pandemic: +155.0% (18th largest increase)
> Avg. new cases per day in 7 days ending July 6: 545 (19th most)
[in-text-ad-2]

45. Vermont
> Statewide stay-at-home order: Issued Mar 24; ended Jun 15
> Time spent at home in 7 days ending July 3, compared to pre-pandemic: +8.3% (19th largest increase)
> Single day people stayed at home the most, compared to pre-pandemic: Apr 10, +27.0% more
> Time spent at home in 7 days ending July 3, compared to day people stayed at home the most (Apr 10): -18.7 ppts. (8th largest decrease)
> Time spent at workplace in 7 days ending July 3, compared to pre-pandemic: -33.4% (17th largest decrease)
> Pct. working from home before pandemic: 7.5% (2nd highest)
> Change in grocery store visits in 7 days ending July 3, compared to pre-pandemic: +6.4% (14th smallest increase)
> Pct. living more than 1 mile from supermarket: 66.3% (4th highest)
> Time spent at parks in 7 days ending July 3, compared to pre-pandemic: +162.7% (17th largest increase)
> Avg. new cases per day in 7 days ending July 6: 06 (the fewest)

46. Virginia
> Statewide stay-at-home order: Issued Mar 30; ended Jul 5
> Time spent at home in 7 days ending July 3, compared to pre-pandemic: +9.6% (11th largest increase)
> Single day people stayed at home the most, compared to pre-pandemic: Apr 10, +24.0% more
> Time spent at home in 7 days ending July 3, compared to day people stayed at home the most (Apr 10): -14.4 ppts. (19th smallest decrease)
> Time spent at workplace in 7 days ending July 3, compared to pre-pandemic: -34.4% (12th largest decrease)
> Pct. working from home before pandemic: 5.6% (20th highest)
> Change in grocery store visits in 7 days ending July 3, compared to pre-pandemic: +4.1% (9th smallest increase)
> Pct. living more than 1 mile from supermarket: 42.7% (20th lowest)
> Time spent at parks in 7 days ending July 3, compared to pre-pandemic: +106.0% (18th smallest increase)
> Avg. new cases per day in 7 days ending July 6: 549 (18th most)
[in-text-ad]

47. Washington
> Statewide stay-at-home order: Issued Mar 23
> Time spent at home in 7 days ending July 3, compared to pre-pandemic: +9.3% (13th largest increase)
> Single day people stayed at home the most, compared to pre-pandemic: Mar 27, +24.0% more
> Time spent at home in 7 days ending July 3, compared to day people stayed at home the most (Mar 27): -14.7 ppts. (22nd smallest decrease)
> Time spent at workplace in 7 days ending July 3, compared to pre-pandemic: -37.6% (2nd largest decrease)
> Pct. working from home before pandemic: 6.5% (8th highest)
> Change in grocery store visits in 7 days ending July 3, compared to pre-pandemic: +2.0% (4th smallest increase)
> Pct. living more than 1 mile from supermarket: 38.8% (16th lowest)
> Time spent at parks in 7 days ending July 3, compared to pre-pandemic: +88.7% (14th smallest increase)
> Avg. new cases per day in 7 days ending July 6: 522 (20th most)
48. West Virginia
> Statewide stay-at-home order: Issued Mar 25; ended Jun 4
> Time spent at home in 7 days ending July 3, compared to pre-pandemic: +4.7% (7th smallest increase)
> Single day people stayed at home the most, compared to pre-pandemic: Apr 10, +20.0% more
> Time spent at home in 7 days ending July 3, compared to day people stayed at home the most (Apr 10): -15.3 ppts. (24th smallest decrease)
> Time spent at workplace in 7 days ending July 3, compared to pre-pandemic: -26.3% (6th smallest decrease)
> Pct. working from home before pandemic: 3.4% (3rd lowest)
> Change in grocery store visits in 7 days ending July 3, compared to pre-pandemic: +12.9% (11th largest increase)
> Pct. living more than 1 mile from supermarket: 65.9% (5th highest)
> Time spent at parks in 7 days ending July 3, compared to pre-pandemic: +102.1% (17th smallest increase)
> Avg. new cases per day in 7 days ending July 6: 54 (11th fewest)

49. Wisconsin
> Statewide stay-at-home order: Issued Mar 25; ended Jun 13
> Time spent at home in 7 days ending July 3, compared to pre-pandemic: +6.6% (20th smallest increase)
> Single day people stayed at home the most, compared to pre-pandemic: Apr 10, +25.0% more
> Time spent at home in 7 days ending July 3, compared to day people stayed at home the most (Apr 10): -18.4 ppts. (9th largest decrease)
> Time spent at workplace in 7 days ending July 3, compared to pre-pandemic: -28.1% (13th smallest decrease)
> Pct. working from home before pandemic: 4.8% (19th lowest)
> Change in grocery store visits in 7 days ending July 3, compared to pre-pandemic: +15.4% (7th largest increase)
> Pct. living more than 1 mile from supermarket: 47.0% (24th highest)
> Time spent at parks in 7 days ending July 3, compared to pre-pandemic: +279.3% (4th largest increase)
> Avg. new cases per day in 7 days ending July 6: 510 (21st most)
[in-text-ad-2]

50. Wyoming
> Statewide stay-at-home order: No stay-at-home order issued
> Time spent at home in 7 days ending July 3, compared to pre-pandemic: +2.6% (the smallest increase)
> Single day people stayed at home the most, compared to pre-pandemic: Apr 2, +19.0% more
> Time spent at home in 7 days ending July 3, compared to day people stayed at home the most (Apr 2): -16.4 ppts. (21st largest decrease)
> Time spent at workplace in 7 days ending July 3, compared to pre-pandemic: -23.6% (the smallest decrease)
> Pct. working from home before pandemic: 6.2% (9th highest)
> Change in grocery store visits in 7 days ending July 3, compared to pre-pandemic: +36.6% (2nd largest increase)
> Pct. living more than 1 mile from supermarket: 56.9% (11th highest)
> Time spent at parks in 7 days ending July 3, compared to pre-pandemic: +281.5% (3rd largest increase)
> Avg. new cases per day in 7 days ending July 6: 31 (4th fewest)
Methodology
To determine how social distancing has influenced where people are going in every state, 24/7 Tempo analyzed mobility data from Google. Google’s mobility database covers changes in mobility for every state from Google’s baseline for every day between Feb. 15 and June 15. This data is updated by Google every two to three days. The baseline is the median value for the corresponding day of the week, during the five-week period from Jan. 3 to Feb. 6, 2020.
We calculated for every state average changes in daily mobility in six categories — residential, retail and recreation, grocery and pharmacy, parks, transit stations, and workplaces — over the seven days ending July 3, 2020.
Google does not share absolute visitor numbers. Google’s calculations are based on data from Google users who have opted-in to Location History in their Google Account. Because the data represents a sample of Google users, the calculations may or may not represent the exact behavior of a wider population.
Data on COVID-19 case counts came from state and local health departments and was adjusted to each state’s population using data from the U.S. Census Bureau’s 2018 1-year American Community Survey.
Choosing the right (or wrong) time to claim Social Security can dramatically change your retirement. So, before making one of the biggest decisions of your financial life, it’s a smart idea to get an extra set of eyes on your complete financial situation.
A financial advisor can help you decide the right Social Security option for you and your family. Finding a qualified financial advisor doesn’t have to be hard. SmartAsset’s free tool matches you with up to three financial advisors who serve your area, and you can interview your advisor matches at no cost to decide which one is right for you.
Click here to match with up to 3 financial pros who would be excited to help you optimize your Social Security outcomes.
Have questions about retirement or personal finance? Email us at [email protected]!
By emailing your questions to 24/7 Wall St., you agree to have them published anonymously on a673b.bigscoots-temp.com.
By submitting your story, you understand and agree that we may use your story, or versions of it, in all media and platforms, including via third parties.
Thank you for reading! Have some feedback for us?
Contact the 24/7 Wall St. editorial team.