Special Report
States That Are Falling Apart
Published:

Before the COVID-19 pandemic, each day, motorists drove about 8.8 billion miles on American roadways, while the U.S. railroad system carried 85,000 passengers and 5 million tons of freight. Though travel habits have shifted since the coronavirus outbreak, transportation infrastructure remains vital to the health of the U.S. economy.
Despite the importance of a reliable transportation network, upkeep of critical infrastructure is being neglected across the country as roads, bridges, and railroads age. Nationwide, 21.8% of roads are in poor condition, 7.6% of bridges are in need of replacement or repair, and there have been 4.8 derailments for every 100 miles of train track from 2015 to 2019, the most common cause of which are broken rails or welds. In some states, these figures are far worse, indicating a threat to not only the economy, but to public health and safety as well.
Using data from the U.S. Department of Transportation, 24/7 Wall St. created an index to identify the states that are falling apart. The index comprises three measures: the share of roadway in poor condition, the share of bridges considered to be structurally deficient, and the number of train derailments between 2015 and 2019 adjusted per mile of railroad track. One state, Iowa, was not ranked, due to a lack of sufficient data.
When it comes to maintaining transportation infrastructure, different states face different challenges. States in the Northeast and Midwest, for example, often have harsh winters, and the cycle of freezing and thawing can accelerate the deterioration of road surfaces. Similarly, densely-populated states often have traffic congestion that can contribute to wear and tear on roadways. Here is a look at the worst cities to drive in every state.
To maintain transportation infrastructure like roads and bridges, states typically use revenue from taxes levied on gasoline sales. These are the states with the highest and lowest gas taxes.
However, because each state faces a unique set of challenges, greater spending does not always align with better overall conditions — especially as some states have only recently ramped up investment to compensate for past neglect.
Click here to see the states that are falling apart
Click here to read our methodology
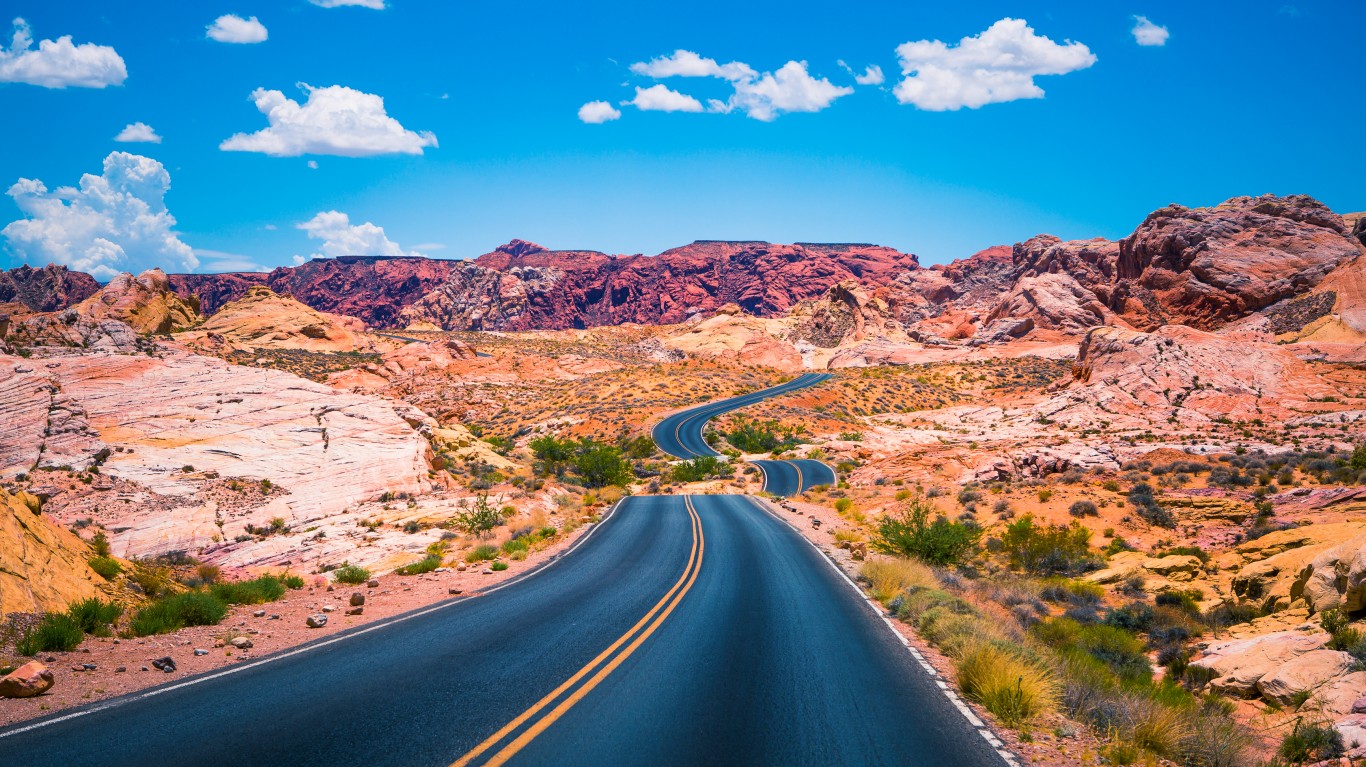
49. Nevada
> Roadway in poor condition: 13.7% (14th lowest)
> Structurally deficient bridges: 1.4% of bridges (2nd lowest)
> Locomotive derailments from 2015-2019: 21 (1.8 per 100 miles of track — 6th fewest out of 49 states)
> State highway spending per licensed driver: $409 (5th lowest)
Based on the share of roadway in poor condition, the number of bridges that are considered structurally deficient, and the number of train derailments in recent years, Nevada has the overall best infrastructure of any state.
Though Nevada spends the equivalent of only about $400 per year per licensed driver on its highway system — less than all but four other states — it is also one of the least densely populated states, suggesting that roads across the state could take longer to accumulate damage from usage.
[in-text-ad]
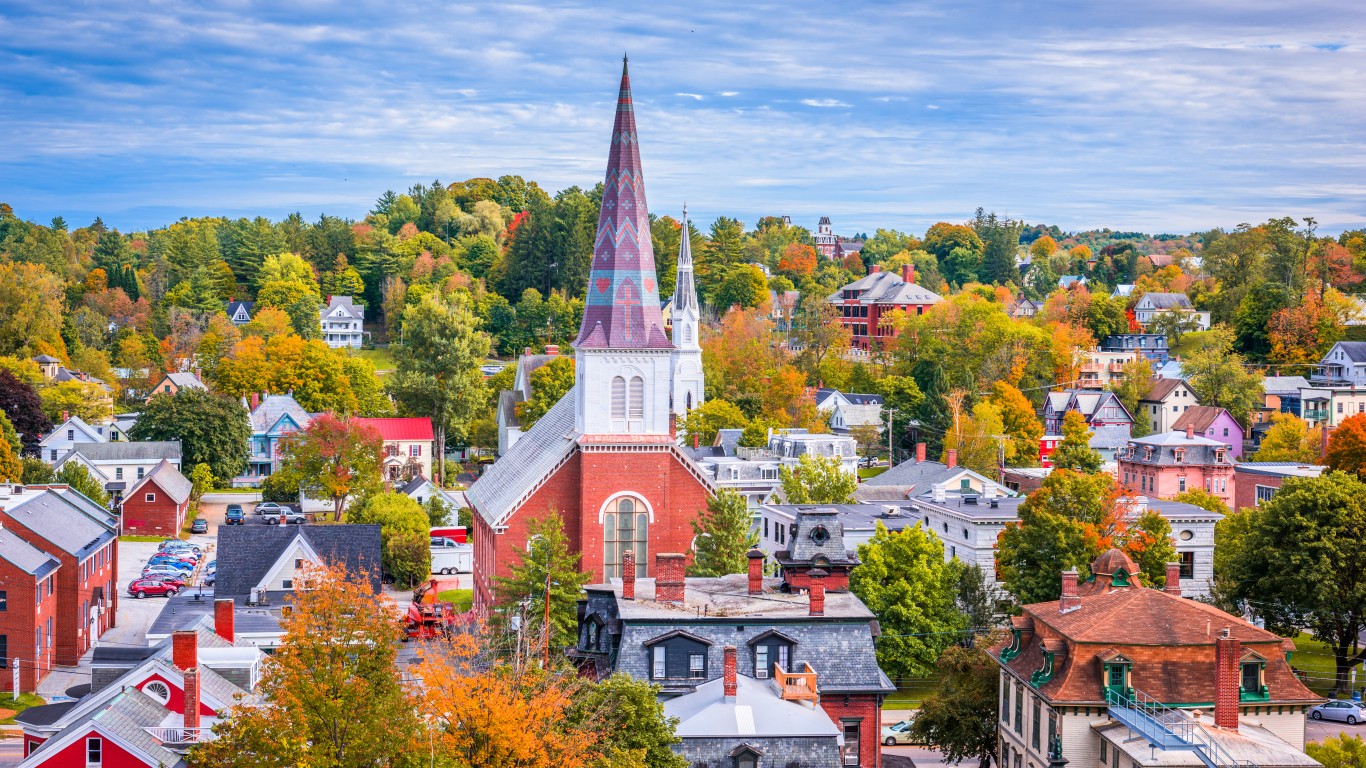
48. Vermont
> Roadway in poor condition: 22.9% (21st highest)
> Structurally deficient bridges: 2.4% of bridges (5th lowest)
> Locomotive derailments from 2015-2019: 10 (1.7 per 100 miles of track — 5th fewest out of 49 states)
> State highway spending per licensed driver: $804 (12th highest)
Like most states in the Northeast, Vermont has a higher than average share of roadway in poor condition. States with longer and harsher winters tend to have greater wear and tear on their roads, as water seeps into cracks in the asphalt and expands as it freezes, weakening the integrity of the surface. In Vermont, 22.9% of roadway is in poor condition compared to 21.8% of roadway nationwide.
Still, bridges in Vermont are more likely to be structurally sound than in all but four other states. Additionally, railways in the state appear to be in better than average condition as train derailments are far less common than average in Vermont. Broken rails are the leading cause of derailment.
47. Arizona
> Roadway in poor condition: 14.3% (16th lowest)
> Structurally deficient bridges: 1.8% of bridges (3rd lowest)
> Locomotive derailments from 2015-2019: 60 (3.3 per 100 miles of track — 18th fewest out of 49 states)
> State highway spending per licensed driver: $411 (7th lowest)
Located in the Southwest, Arizona has a warm climate, and roads in the state are not subjected to the harsh winters and the harm they can cause to roads as in other parts of the country. Partially as a result, just 14.3% of roadway in the state is in poor condition, compared to 21.8% of roadway nationwide.
Arizona is also one of only three states where less than 2% of all bridges are considered structurally deficient.

46. Florida
> Roadway in poor condition: 9.4% (9th lowest)
> Structurally deficient bridges: 2.6% of bridges (6th lowest)
> Locomotive derailments from 2015-2019: 101 (3.5 per 100 miles of track — 21st fewest out of 49 states)
> State highway spending per licensed driver: $551 (20th lowest)
Florida is one of only eight states where less than 10% or roadway is in poor condition. Like many states with well maintained roads, Florida does not have to contend with the harsh winter weather other parts of the country do. Good road conditions are common in Florida even though the state spends less on its highways per driver than most states and also has more traffic congestion than most states.
[in-text-ad-2]
45. Georgia
> Roadway in poor condition: 2.9% (2nd lowest)
> Structurally deficient bridges: 3.3% of bridges (7th lowest)
> Locomotive derailments from 2015-2019: 203 (4.4 per 100 miles of track — 24th most out of 49 states)
> State highway spending per licensed driver: $366 (3rd lowest)
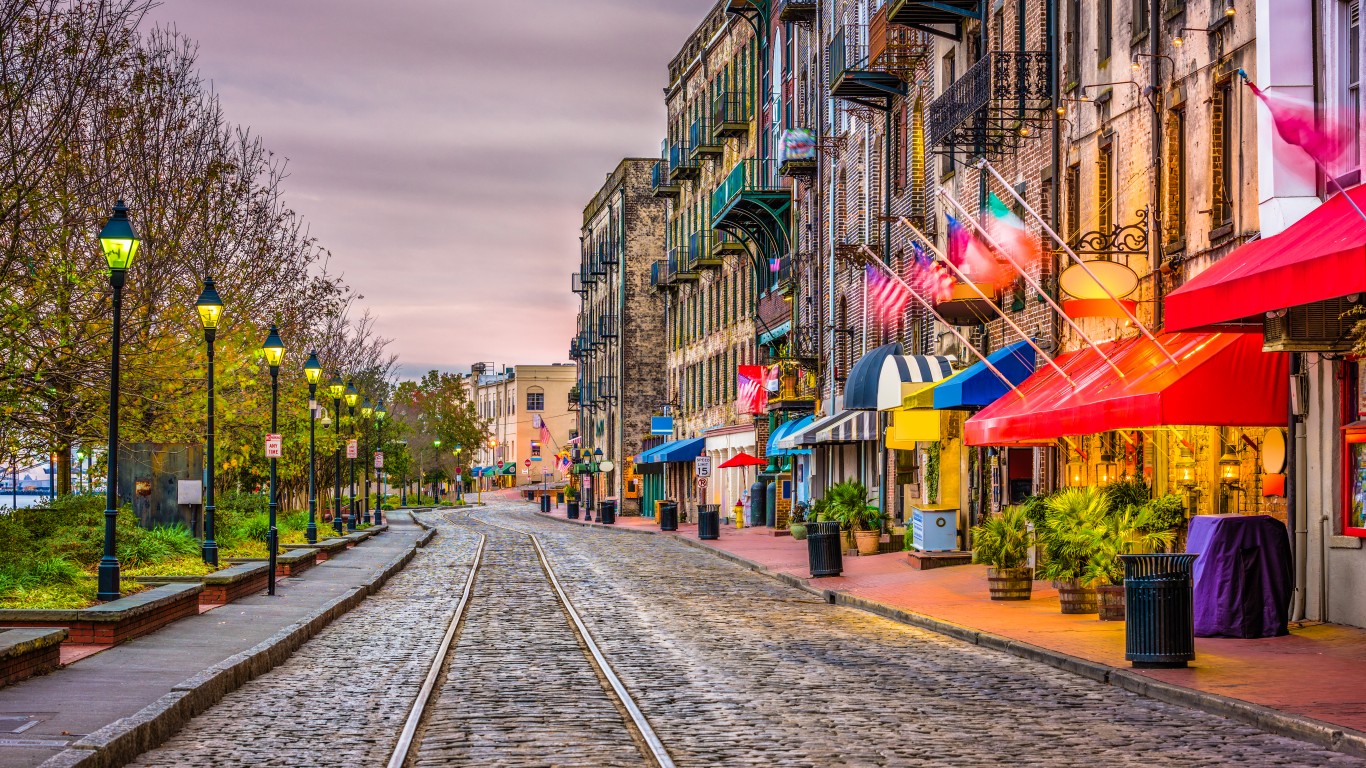
Georgia’s roads are among the best maintained in the country. Just 2.9% of roadway in the state is in poor condition, the smallest share of any state. Without harsh winters, roads in Georgia do not require the kind of upkeep of roads further north. Georgia spends an average of $2.5 billion on its highways annually, or just $366 per licensed driver, nearly the least of any state.
While Georgia’s roads are among the most likely nationwide to be in good condition, its network of railways is about average. Broken tracks are the most common cause of derailments, and there were 203 derailed trains in Georgia between 2015 and 2019, just below the national average when adjusted for miles of track.
44. Idaho
> Roadway in poor condition: 3.0% (3rd lowest)
> Structurally deficient bridges: 7.0% of bridges (23rd lowest)
> Locomotive derailments from 2015-2019: 49 (2.8 per 100 miles of track — 16th fewest out of 49 states)
> State highway spending per licensed driver: $622 (20th highest)
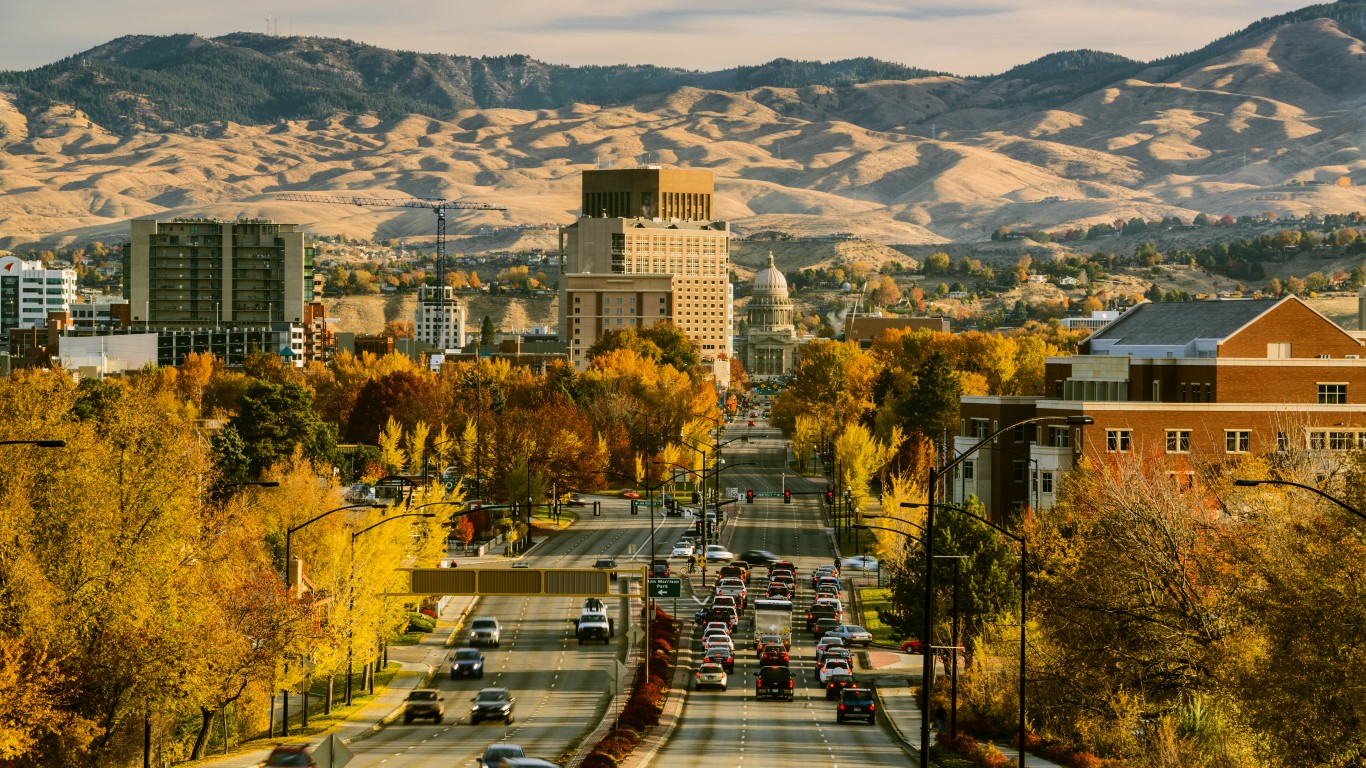
Idaho’s infrastructure ranks as one of best in the country, with just 3.0% of state roadways in poor condition. In fiscal 2018, the state spent just over $10 billion on its highways, the 10th lowest amount among states. But Idaho is also a relatively low-population state, and the state’s average annual highway expenditure comes to $622 per licensed driver in the state, higher than the national average expenditure or of $570 per licensed driver.
[in-text-ad]
43. Kentucky
> Roadway in poor condition: 8.4% (7th lowest)
> Structurally deficient bridges: 7.1% of bridges (25th lowest)
> Locomotive derailments from 2015-2019: 73 (2.8 per 100 miles of track — 15th fewest out of 49 states)
> State highway spending per licensed driver: $724 (14th highest)
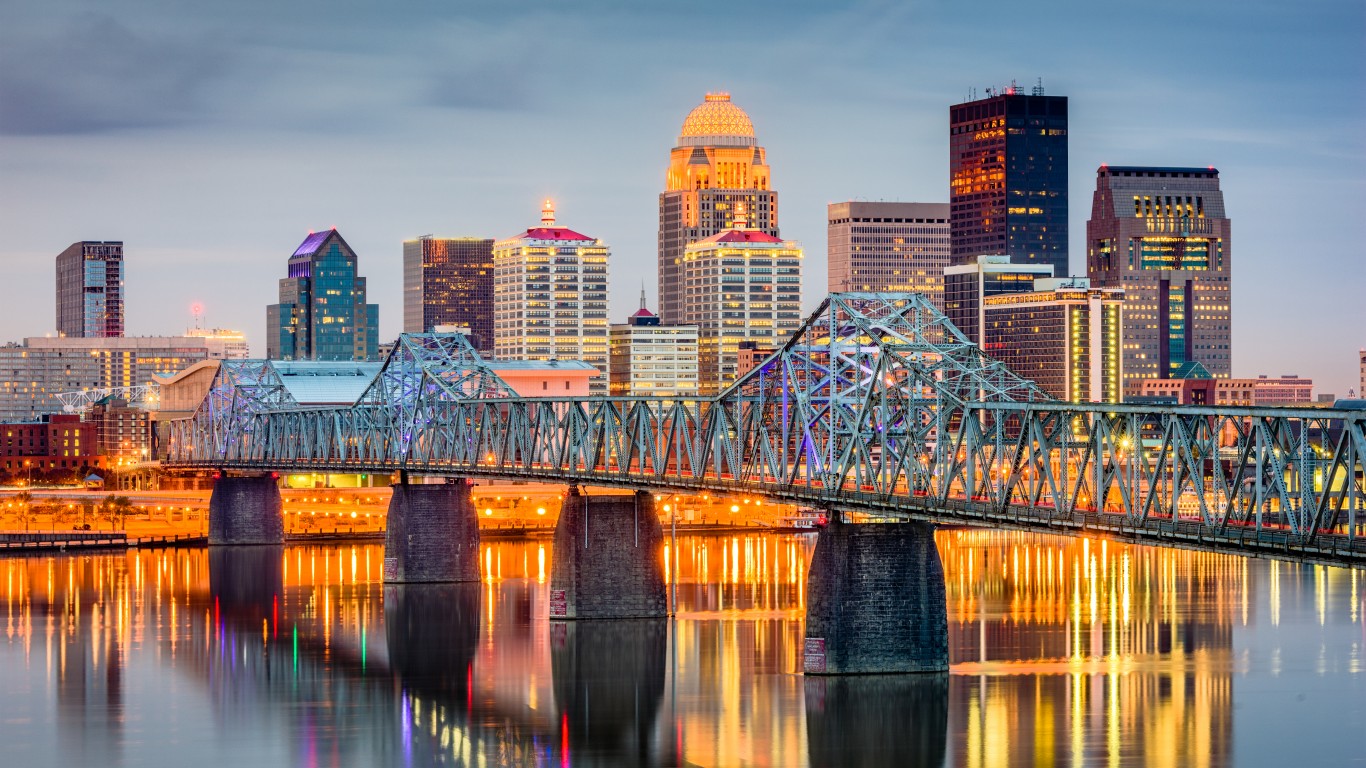
Kentucky, along with many states in the South, ranks as having one of the better infrastructure among U.S. states, especially based on the state’s road conditions. Harsh winter weather in colder states is a major cause of road degradation, and in Southern states like Kentucky, this is much less of a concern. Spending on highways in the state is actually higher than spending in most states, with annual highway expenditure from 2014 through 2018 averaging $723 per licensed driver in the state. In comparison, the national average highway expenditures was $571 per licensed driver over the same period.

42. Virginia
> Roadway in poor condition: 14.7% (18th lowest)
> Structurally deficient bridges: 4.6% of bridges (13th lowest)
> Locomotive derailments from 2015-2019: 109 (3.5 per 100 miles of track — 19th fewest out of 49 states)
> State highway spending per licensed driver: $867 (8th highest)
Virginia spends an average of about $5.1 billion on its highway system every year — or $867 per licensed driver, the eighth most of any state. The higher than average spending is contributing to some positive results, as just 14.7% of roadway in the state is in poor condition, well below the average of 21.8% of roadway in poor condition nationwide. The higher spending is also likely necessitated by high usage as Virginia roads are more likely to be congested than those in most other states, particularly in and around the D.C. metropolitan area.
Bridges are also generally well maintained in Virginia. Less than 5% of bridges in the state are considered structurally deficient, compared to 7.6% of bridges nationwide.
41. New Hampshire
> Roadway in poor condition: 24.8% (19th highest)
> Structurally deficient bridges: 9.0% of bridges (16th highest)
> Locomotive derailments from 2015-2019: 0
> State highway spending per licensed driver: $472 (15th lowest)
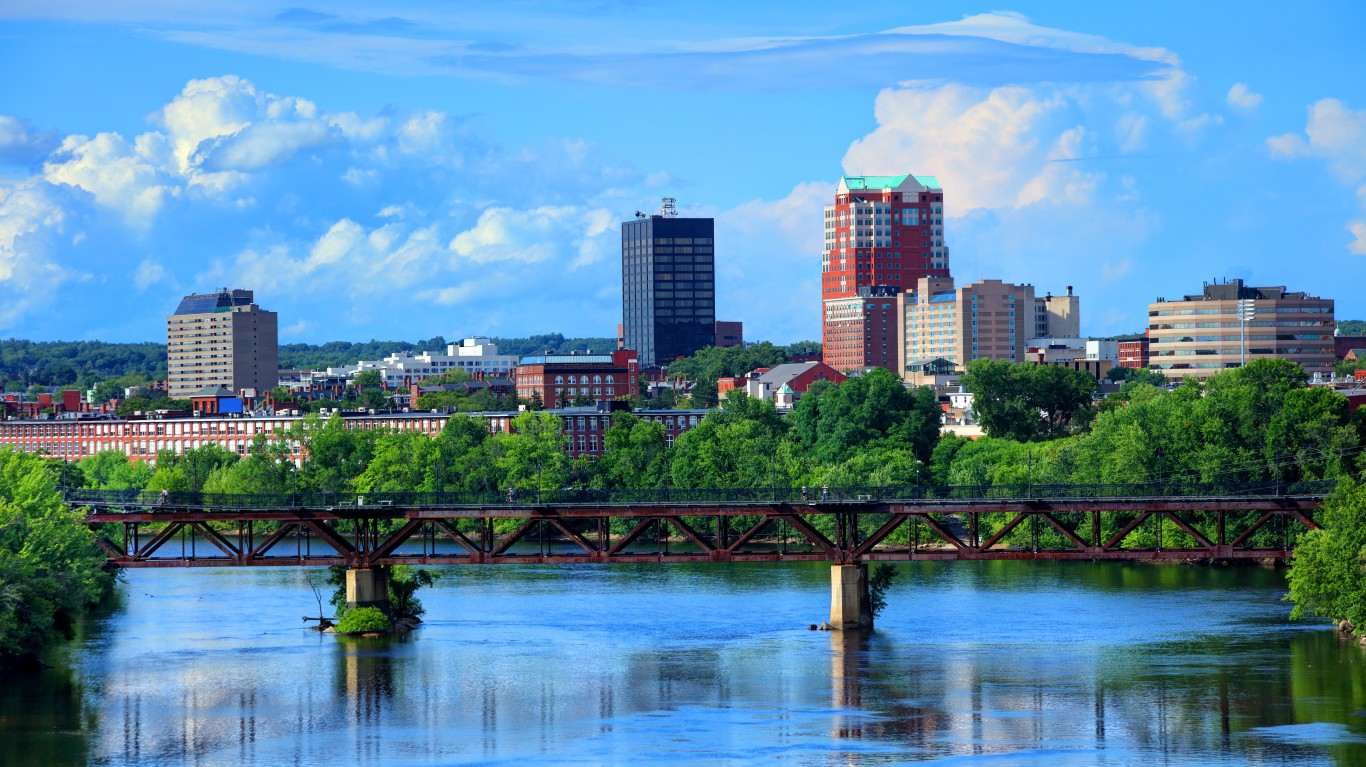
Broken tracks are the most common cause of a train derailment, and New Hampshire is the only state in the country to report no train derailments between 2015 and 2019, suggesting that New Hampshire’s railway is in better shape than tracks in the rest of the country.
In other areas, the condition of New Hampshire’s transportation infrastructure is somewhat worse than average. Nearly 1 in every 10 bridges in the state are in need of repair or replacement, a larger share than in most states. Additionally, likely due in part to harsh winters, nearly 25% of roadway in the state is in poor condition.
[in-text-ad-2]
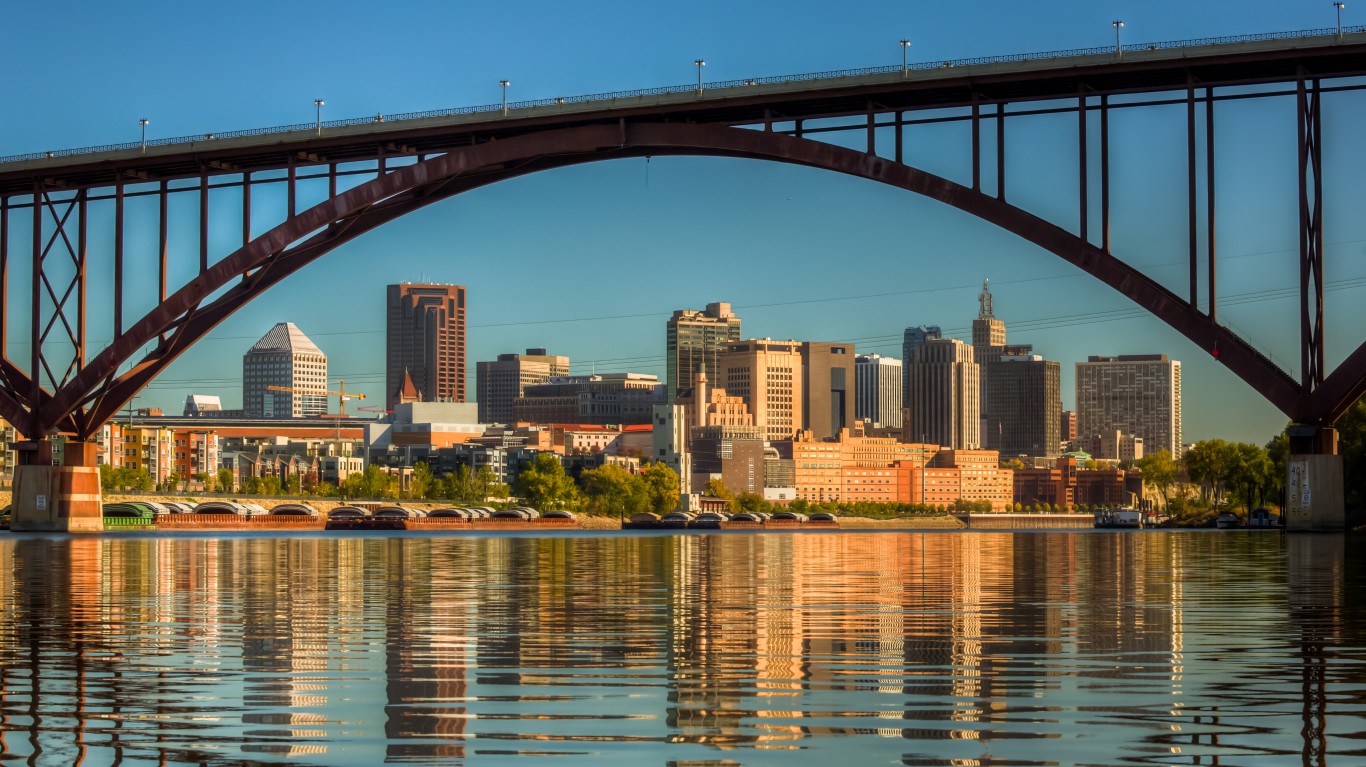
40. Minnesota
> Roadway in poor condition: 15.8% (19th lowest)
> Structurally deficient bridges: 5.0% of bridges (14th lowest)
> Locomotive derailments from 2015-2019: 149 (3.5 per 100 miles of track — 20th fewest out of 49 states)
> State highway spending per licensed driver: $864 (9th highest)
The northernmost point in the lower 48 is in Minnesota, and northern states often have larger than average shares of roadway in poor condition due to harsh winters. Despite the damage freezing temperatures cause to the integrity of road surfaces in the winter months in Minnesota, just 15.8% of roadway in the state is in poor condition, compared to 21.8% of roadway nationwide.
Better road conditions are partially attributable to greater maintenance spending. Minnesota spends $2.9 billion on its highways annually, or $864 per driver, more than all but eight other states.
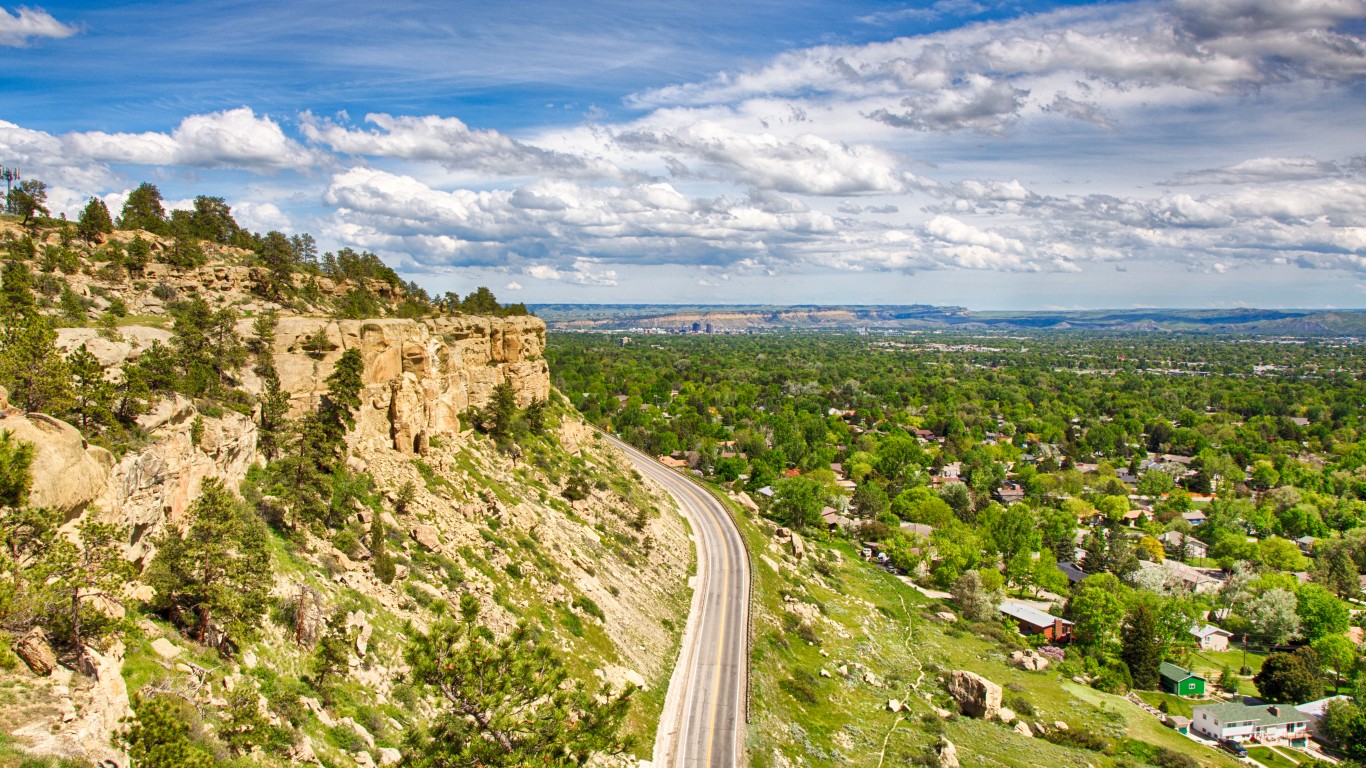
39. Montana
> Roadway in poor condition: 18.4% (24th lowest)
> Structurally deficient bridges: 7.4% of bridges (23rd highest)
> Locomotive derailments from 2015-2019: 77 (2.1 per 100 miles of track — 9th fewest out of 49 states)
> State highway spending per licensed driver: $827 (11th highest)
Montana is one of the least densely populated states, and partially as a result, it has some of lowest roadway congestion in the country. More limited road usage means less wear and tear on road surfaces, and in Montana, just 18.4% of roadway is in poor condition compared to 21.8% of roadway nationwide.
Railway in the state also appears to be in relatively good condition. There were 77 train derailments documented in Montana from 2015 to 2019, or 2.1 for every 100 miles of track — less than half the national average of 4.8 derailments for every 100 miles.
[in-text-ad]
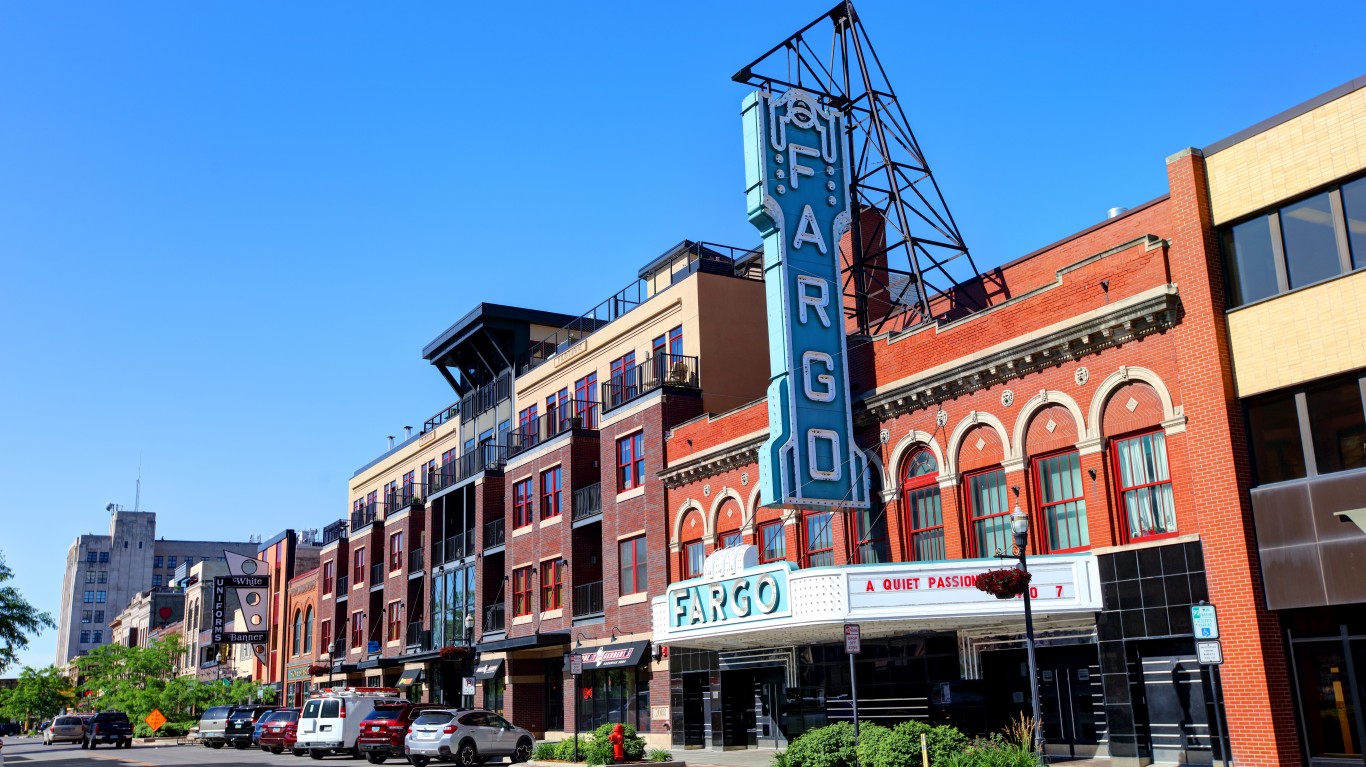
38. North Dakota
> Roadway in poor condition: 7.8% (6th lowest)
> Structurally deficient bridges: 10.8% of bridges (9th highest)
> Locomotive derailments from 2015-2019: 60 (1.8 per 100 miles of track — 7th fewest out of 49 states)
> State highway spending per licensed driver: $2,107 (2nd highest)
States with long and harsh winters often have more roadway in poor condition as freezing and thawing can contribute to cracks and potholes in asphalt surfaces. Despite its location along the Canadian border, North Dakota’s roads are in relatively good shape, with just 7.8% of total roadway considered to be in poor condition, the sixth lowest share among states.
The state’s better road conditions are partially attributable to greater maintenance spending. North Dakota spends $1.2 billion on its highways annually, or $2,107 per driver, more than every other state except Alaska.
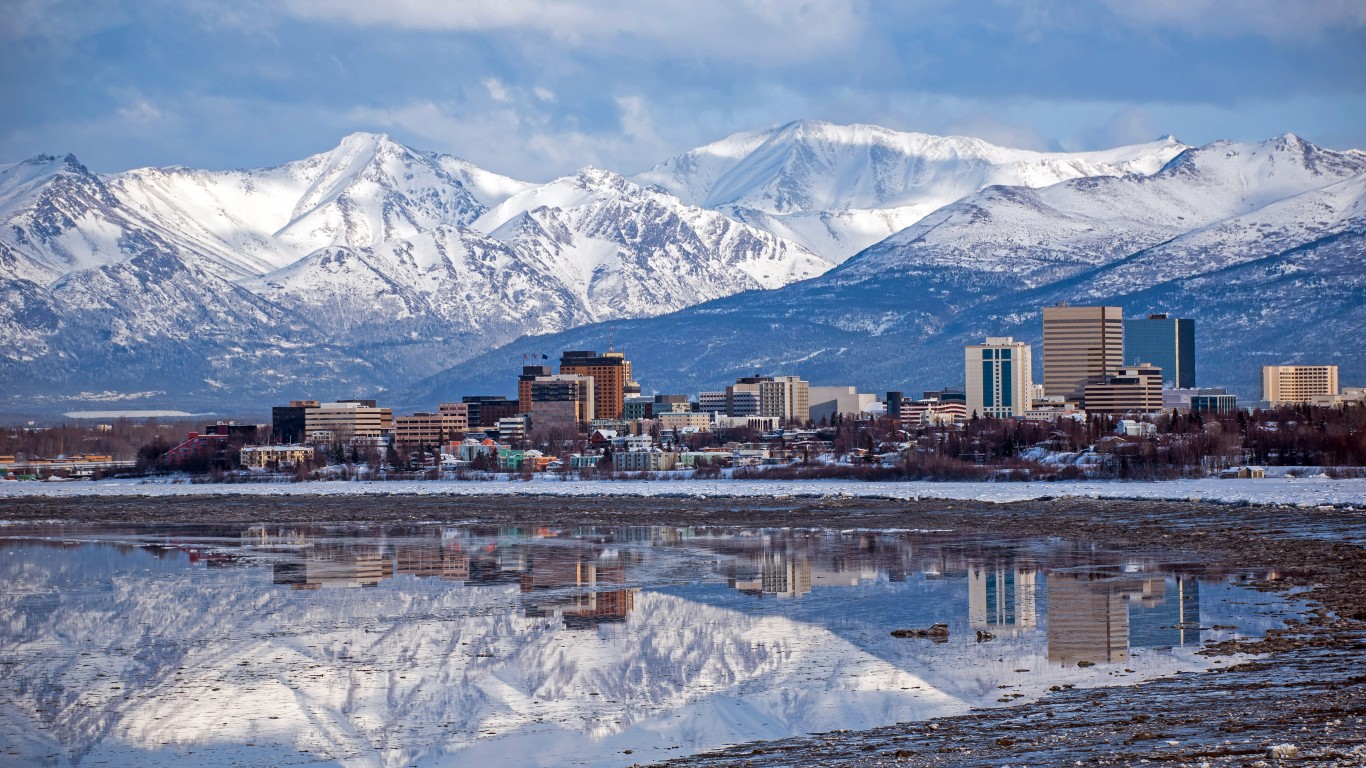
37. Alaska
> Roadway in poor condition: 21.1% (25th highest)
> Structurally deficient bridges: 9.7% of bridges (13th highest)
> Locomotive derailments from 2015-2019: 3 (0.6 per 100 miles of track — 2nd fewest out of 49 states)
> State highway spending per licensed driver: $2,364 (the highest)
Despite relatively low usage as evidenced by the lack of congestion, and despite the greatest highway spending per driver of any state, the share of roadway in Alaska in poor condition is closely in line with the average share nationwide, at 21.1% compared to 21.8%, respectively. The state’s high maintenance spending and limited deterioration due to low usage are likely outweighed by harsh winters in the state, as freezing and thawing cycles often lead to cracks and potholes in asphalt.
Broken tracks are the most common cause of a train derailment, and there were only three train derailments in Alaska between 2015 and 2019 — suggesting that the state’s railway is in better shape than tracks nationwide.
36. Kansas
> Roadway in poor condition: 14.5% (17th lowest)
> Structurally deficient bridges: 5.2% of bridges (17th lowest)
> Locomotive derailments from 2015-2019: 199 (4.3 per 100 miles of track — 24th fewest out of 49 states)
> State highway spending per licensed driver: $591 (24th lowest)
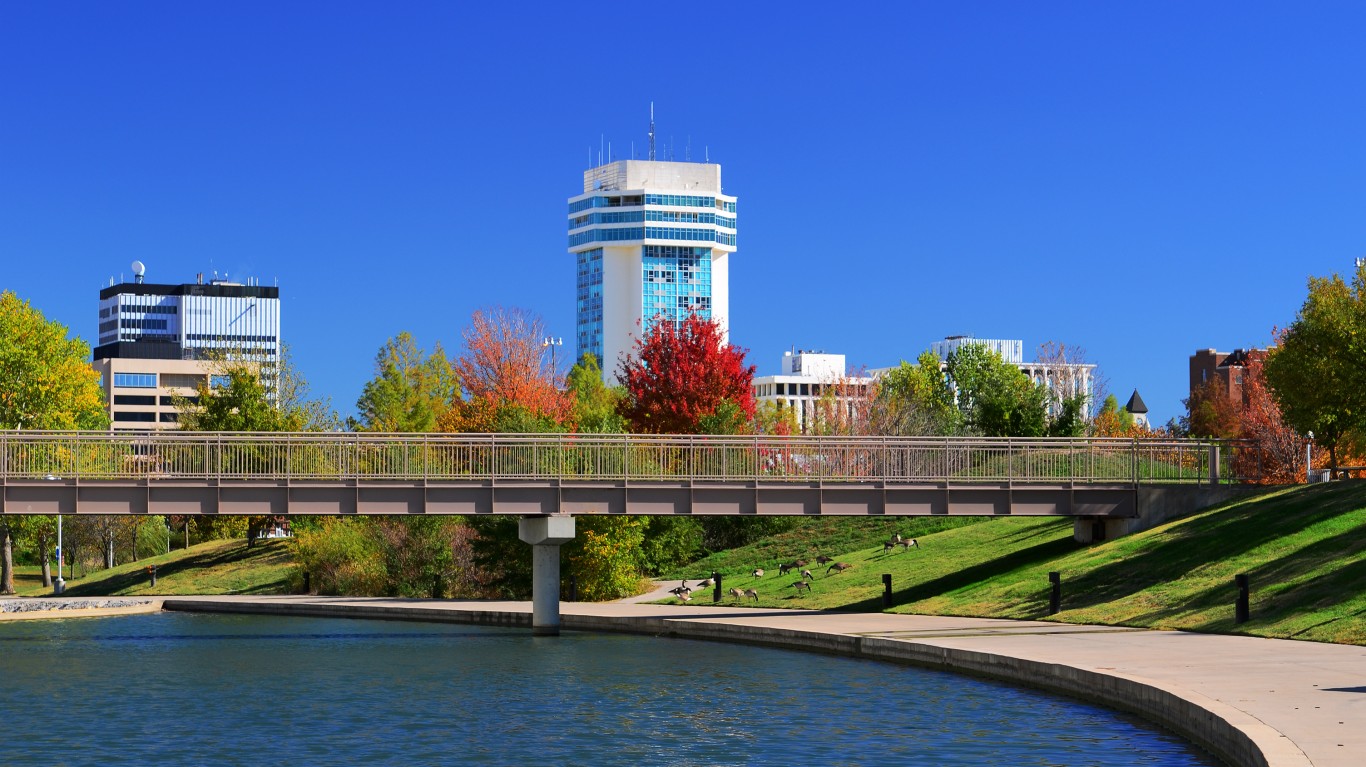
In Kansas, 5.2% of bridges are in need of replacement or repair, a smaller share than the 7.6% share of bridges nationwide. This is a marked improvement that follows a decade-long, $8 billion transportation infrastructure project known as T-WORKS, which repaired or replaced hundreds of bridges across the state. Many of the bridges in the state that are still structurally deficient fall under the purview of local governments.
Roads in the state are also in relatively good shape. Just 14.5% of roadway across Kansas is in poor condition, compared to 21.8% of roadway nationwide.
[in-text-ad-2]
35. Alabama
> Roadway in poor condition: 11.8% (12th lowest)
> Structurally deficient bridges: 4.3% of bridges (9th lowest)
> Locomotive derailments from 2015-2019: 174 (5.3 per 100 miles of track — 13th most out of 49 states)
> State highway spending per licensed driver: $433 (10th lowest)
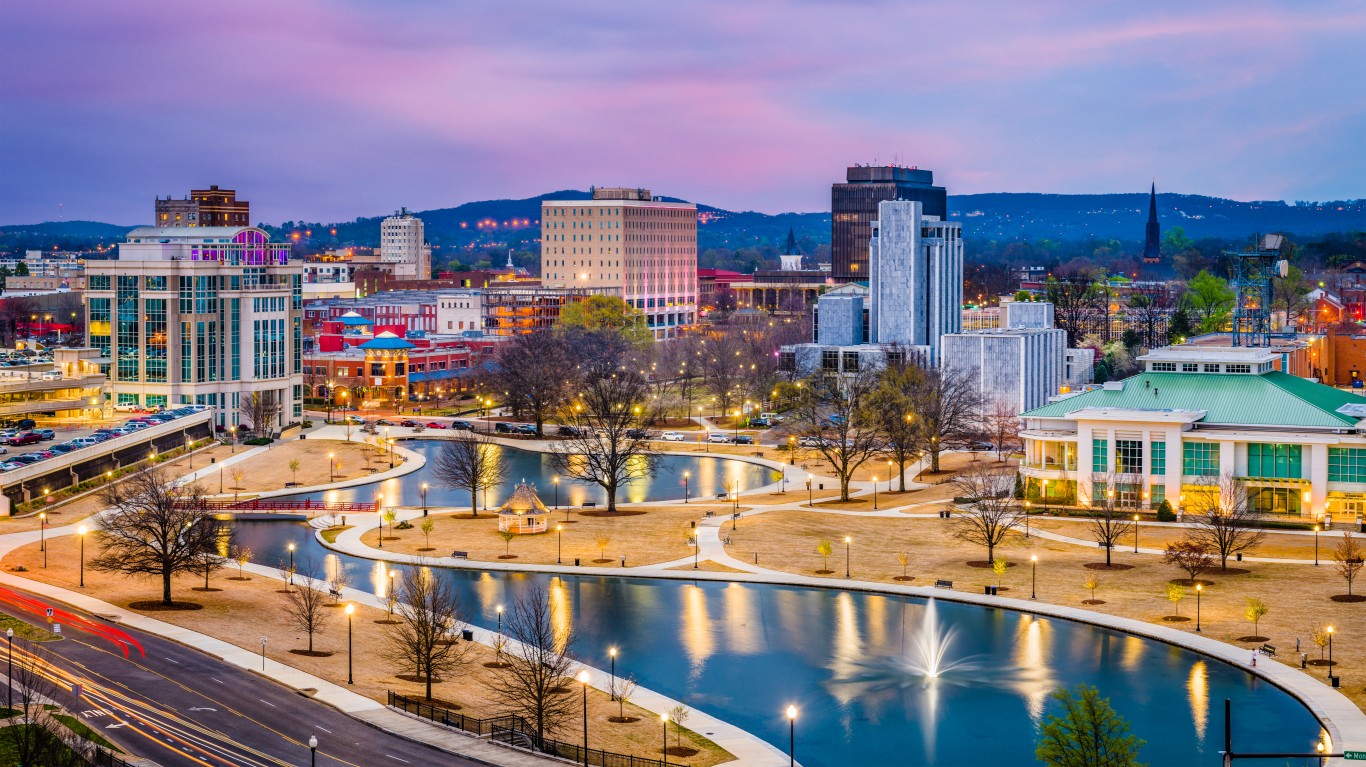
Alabama is one of only 13 states where less than 5% of all bridges are in need of replacement or repair. Additionally, just 11.8% of roadway in the state is in poor condition, nearly half the 21.8% national share.
More parts of Alabama’s railroad infrastructure may be in need of repair, however. Broken tracks are the most common cause of derailments, and there were 174 documented derailments in Alabama from 2015 to 2019, or 5.3 for every 100 miles of track, more than in all but a dozen other states.

34. North Carolina
> Roadway in poor condition: 7.8% (5th lowest)
> Structurally deficient bridges: 10.2% of bridges (11th highest)
> Locomotive derailments from 2015-2019: 98 (3.1 per 100 miles of track — 17th fewest out of 49 states)
> State highway spending per licensed driver: $591 (25th lowest)
North Carolina is one of only a dozen states where at least 1 in every 10 bridges are considered structurally deficient and in need of replacement or repair. As is often the case in states that do not have harsh winters, North Carolina’s roadways are less likely to be in need of repair than those in most other states. Just 7.8% of roadway in the state are in poor condition, a smaller share than in all but four other states and well below the 21.8% share of roadway nationwide.
[in-text-ad]
33. Ohio
> Roadway in poor condition: 12.7% (13th lowest)
> Structurally deficient bridges: 5.6% of bridges (19th lowest)
> Locomotive derailments from 2015-2019: 256 (5.0 per 100 miles of track — 16th most out of 49 states)
> State highway spending per licensed driver: $534 (19th lowest)
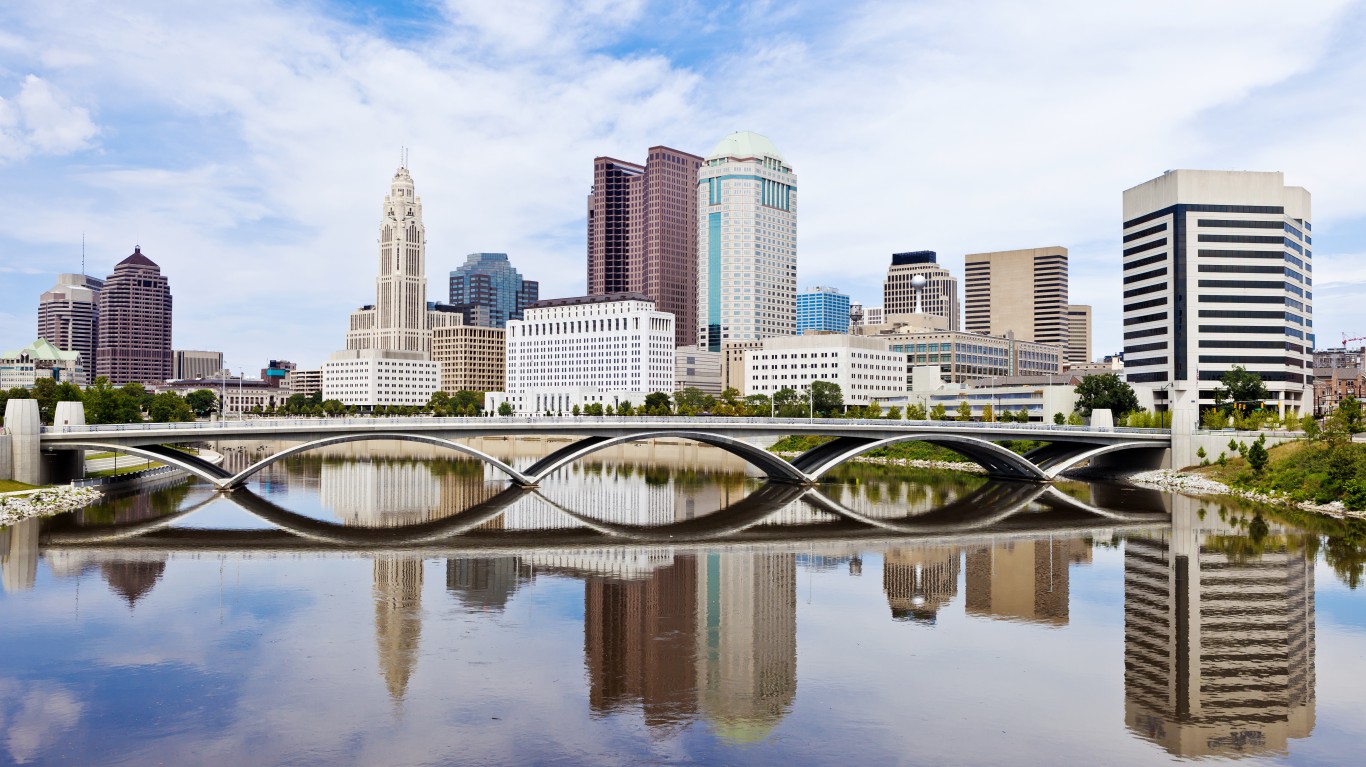
The roads in Ohio are in better shape than those in most states. Just 12.7% of roadway in the state is in poor condition, a smaller share than in all but 11 other states. Meanwhile, Ohio’s rail system appears to be in worse than average shape. There were five derailments between 2015 and 2019 for every 100 miles of railway, the 16th most among states.

32. South Carolina
> Roadway in poor condition: 19.3% (25th lowest)
> Structurally deficient bridges: 8.5% of bridges (20th highest)
> Locomotive derailments from 2015-2019: 63 (2.8 per 100 miles of track — 14th fewest out of 49 states)
> State highway spending per licensed driver: $411 (6th lowest)
Without the harsh winters common in many states further north, South Carolina roads are not typically exposed to the freezing and thawing cycles than can create cracks and potholes in roadways. Partially as a result, despite spending less money per driver on its highways than all but five other states, just 19.3% of roads in the state are in poor condition, slightly below the 21.8% share of roads nationwide.
31. Oregon
> Roadway in poor condition: 26.1% (14th highest)
> Structurally deficient bridges: 5.2% of bridges (16th lowest)
> Locomotive derailments from 2015-2019: 86 (3.6 per 100 miles of track — 22nd fewest out of 49 states)
> State highway spending per licensed driver: $413 (8th lowest)
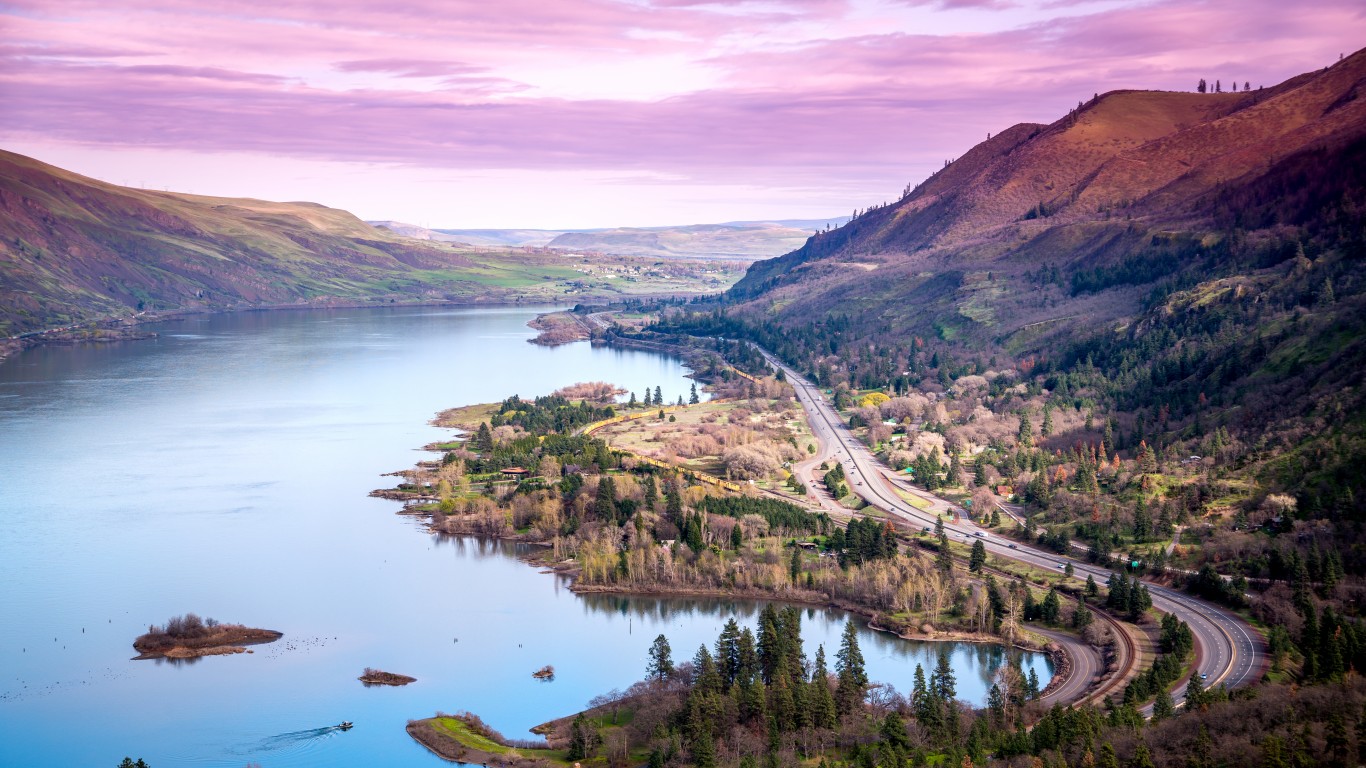
Oregon’s roads are in worse shape than roads in most of the country. Just over 26% of roadway in the state is in poor condition, compared to 21.8% of roads nationwide. The prevalence of rough and cracked road surfaces could be due in part to the state’s low spending on road maintenance. Oregon spends an average of $1.2 billion annually on its highways, or just $413 for every licensed driver in the state, a smaller amount than in all but seven other states.
[in-text-ad-2]
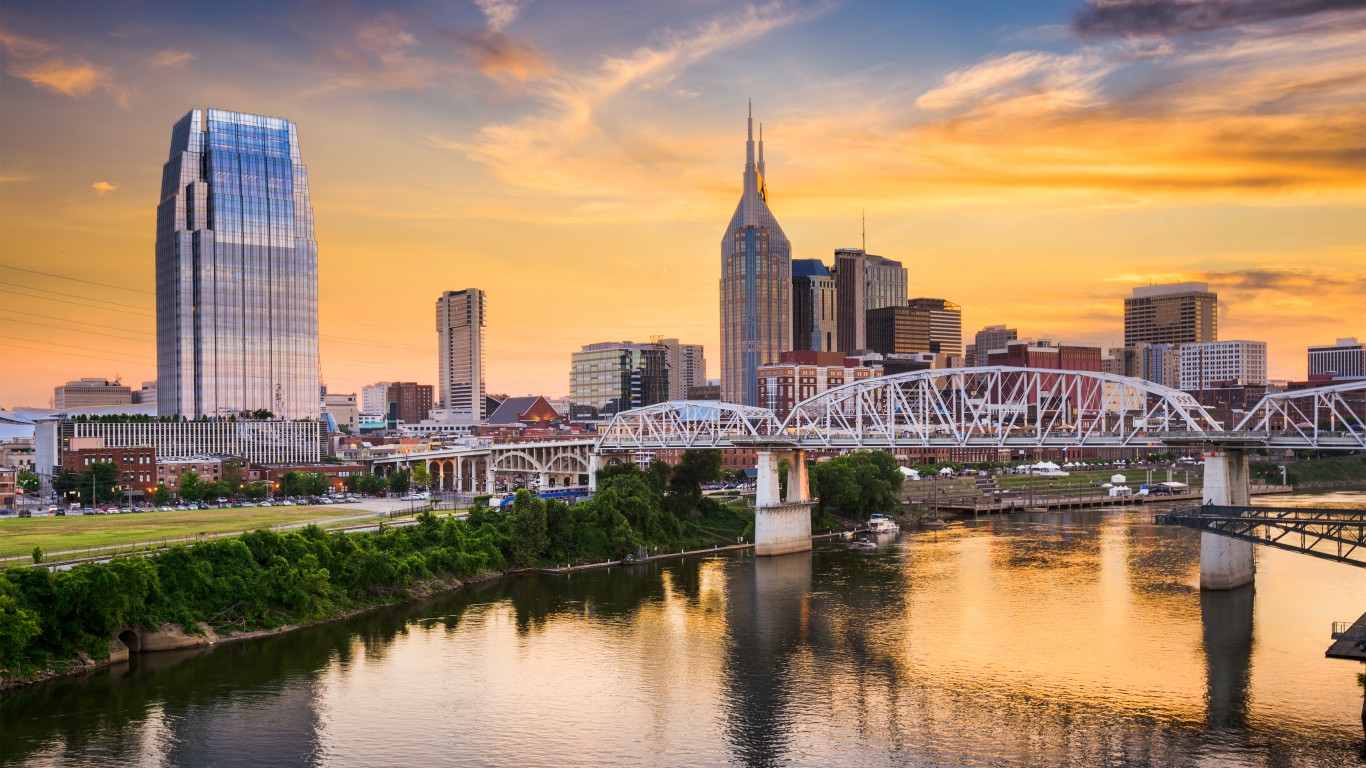
30. Tennessee
> Roadway in poor condition: 7.6% (4th lowest)
> Structurally deficient bridges: 4.3% of bridges (10th lowest)
> Locomotive derailments from 2015-2019: 171 (6.7 per 100 miles of track — 7th most out of 49 states)
> State highway spending per licensed driver: $315 (the lowest)
Tennessee is one of only eight states where less than 10% of roads are in poor condition. The state has better than average road conditions despite spending far less on its highways relative to potential use than average at just $315 per year for every licensed driver, the least of any state.
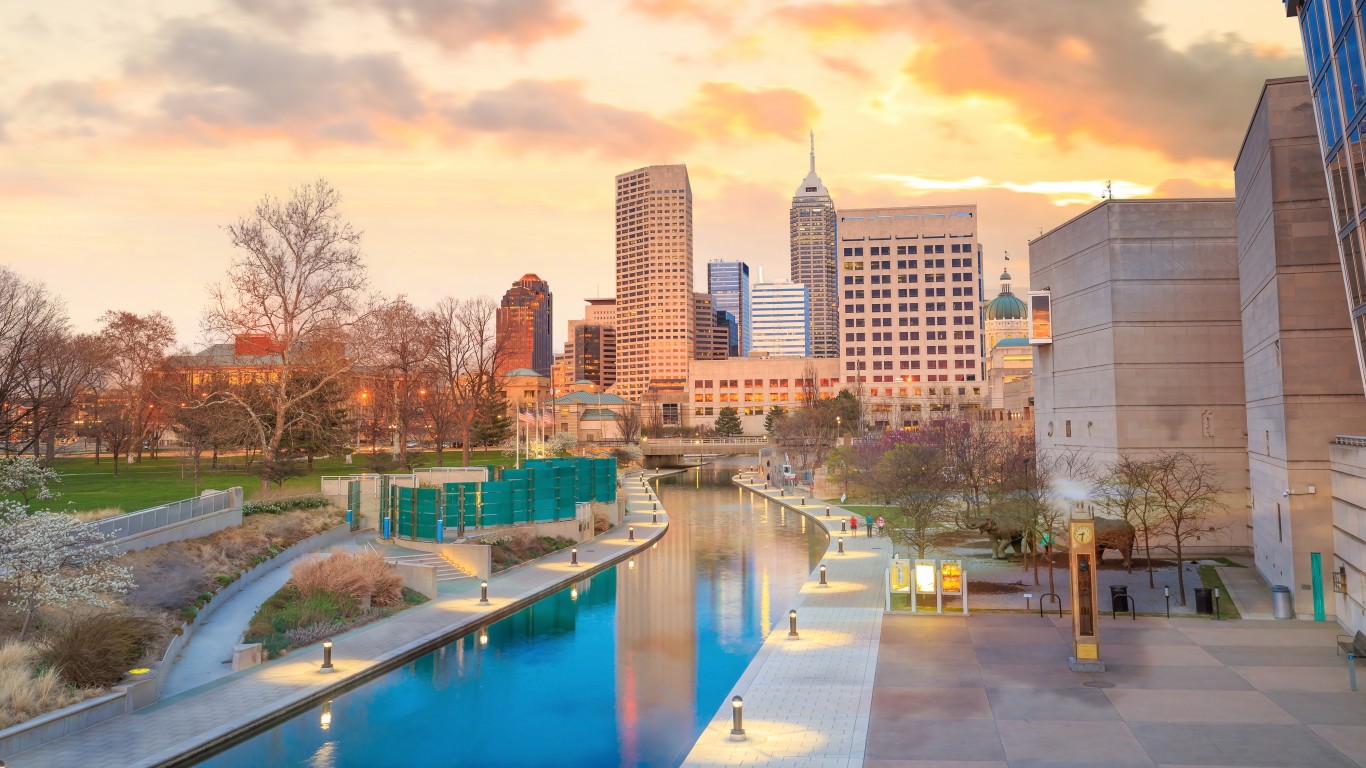
29. Indiana
> Roadway in poor condition: 8.6% (8th lowest)
> Structurally deficient bridges: 6.2% of bridges (21st lowest)
> Locomotive derailments from 2015-2019: 215 (5.7 per 100 miles of track — 11th most out of 49 states)
> State highway spending per licensed driver: $556 (22nd lowest)
One of only eight states where less than 10% of roadway is in poor condition, Indiana’s roads are less likely to be in need of maintenance than roads in most states. A smaller than average share of bridges in the state are also in need of repair or replacement, as just 6.2% are considered structurally deficient, compared to 7.6% of bridges nationwide.
[in-text-ad]
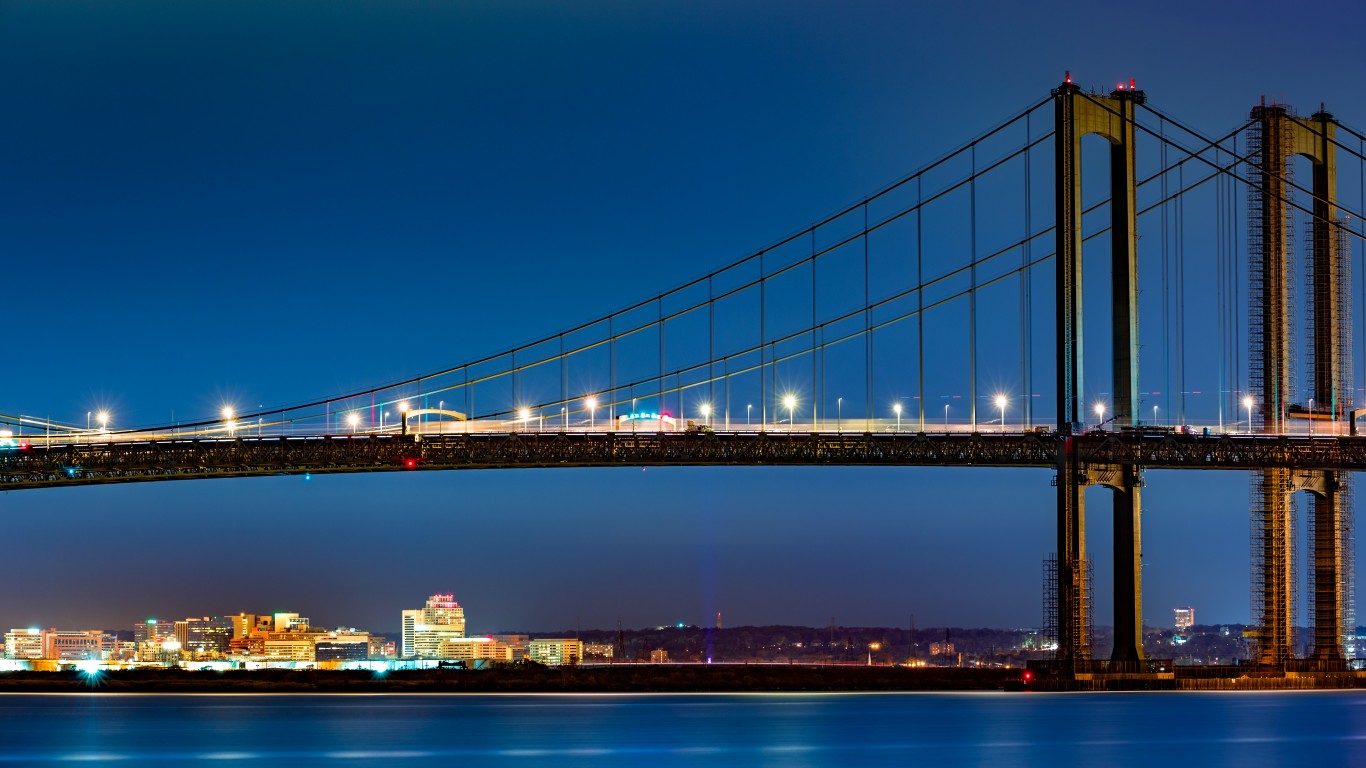
28. Delaware
> Roadway in poor condition: 13.8% (15th lowest)
> Structurally deficient bridges: 3.9% of bridges (8th lowest)
> Locomotive derailments from 2015-2019: 15 (6.2 per 100 miles of track — 9th most out of 49 states)
> State highway spending per licensed driver: $623 (19th highest)
Delaware’s roads and bridges are in relatively good condition compared to most U.S. states. However, the state’s rail lines appear to be in less than optimal condition. There have been 15 train derailments in the state between 2015 and 2019, the ninth highest number of derailments per mile of track among states.
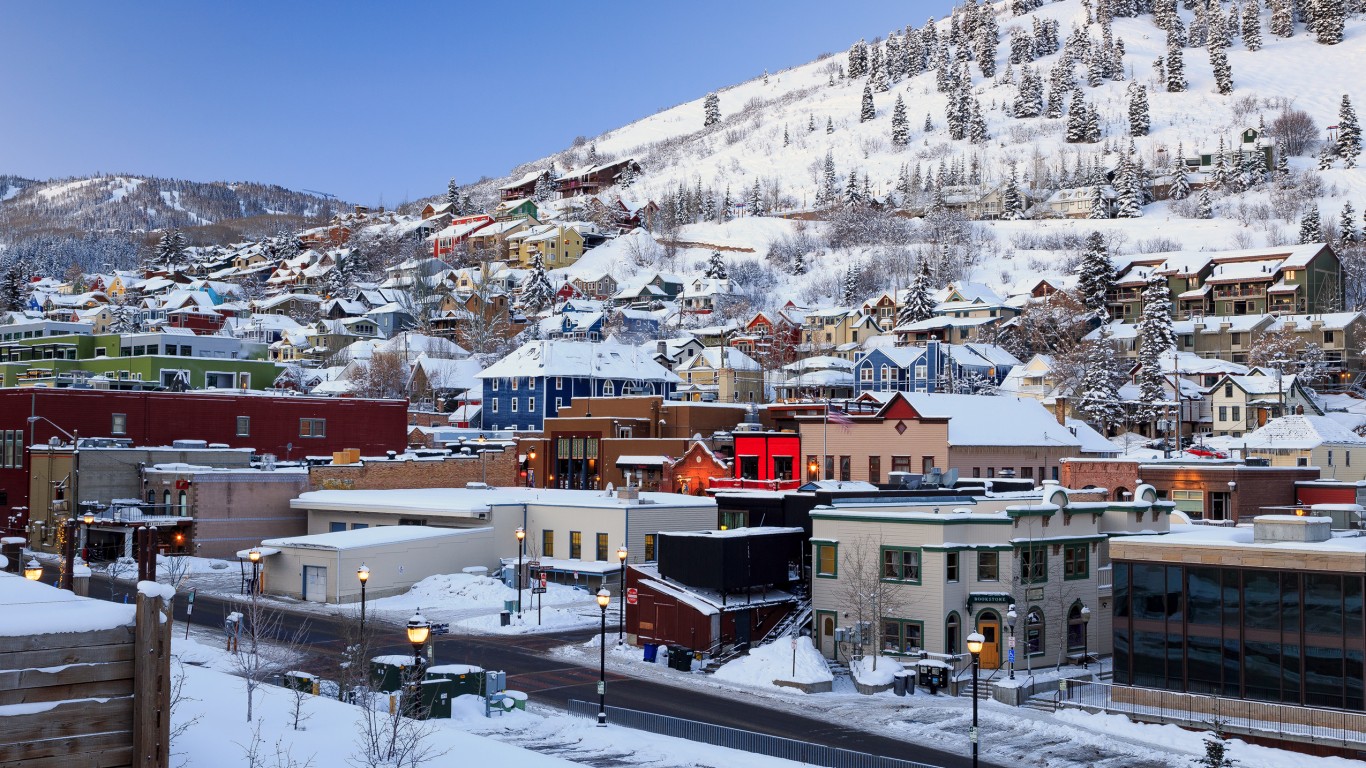
27. Utah
> Roadway in poor condition: 25.3% (17th highest)
> Structurally deficient bridges: 2.2% of bridges (4th lowest)
> Locomotive derailments from 2015-2019: 79 (5.7 per 100 miles of track — 10th most out of 49 states)
> State highway spending per licensed driver: $617 (21st highest)
Utah’s bridges are in much better condition than its roads. Just 2.2% of bridges in Utah are designated as being in poor condition by the FHWA, the fourth lowest share of any state and much lower than the 7.6% share of bridges nationwide. However, more than a quarter of the state’s roads are in poor condition, the 17th highest share among states and higher than the 21.8% of roads in poor condition across the country.
26. Wyoming
> Roadway in poor condition: 11.2% (10th lowest)
> Structurally deficient bridges: 8.2% of bridges (21st highest)
> Locomotive derailments from 2015-2019: 86 (4.6 per 100 miles of track — 23rd most out of 49 states)
> State highway spending per licensed driver: $1,271 (3rd highest)
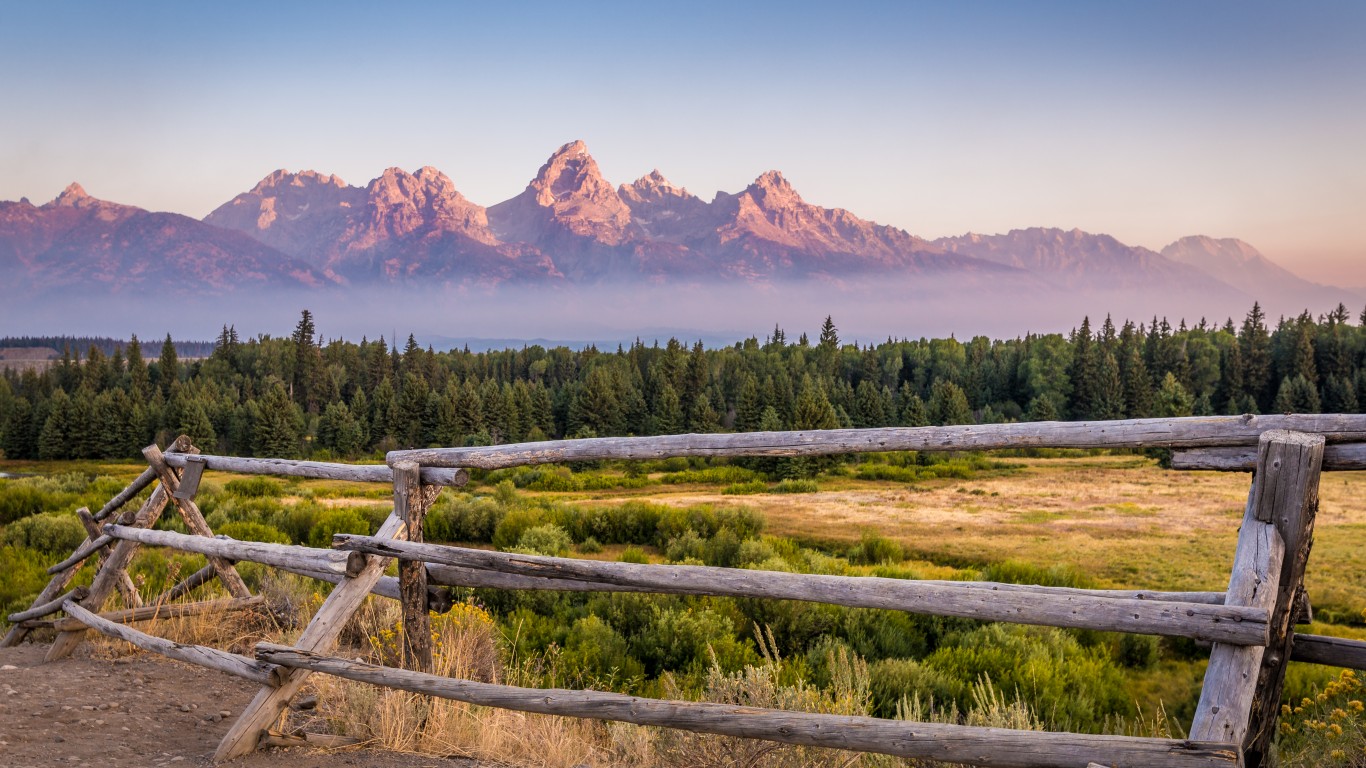
Wyoming spends the equivalent of $1,271 per licensed driver on its highways, more than all but two other states. Additionally, as one of the least densely populated states in the country, and one that rarely has serious traffic congestion, Wyoming’s roads have less wear and tear attributable to usage than most states. Due in part to these factors, just 11.2% of roadway in Wyoming is in poor condition, nearly half the 21.8% share of roadway nationwide.
[in-text-ad-2]
25. Arkansas
> Roadway in poor condition: 26.3% (13th highest)
> Structurally deficient bridges: 4.6% of bridges (11th lowest)
> Locomotive derailments from 2015-2019: 118 (4.7 per 100 miles of track — 20th most out of 49 states)
> State highway spending per licensed driver: $705 (16th highest)
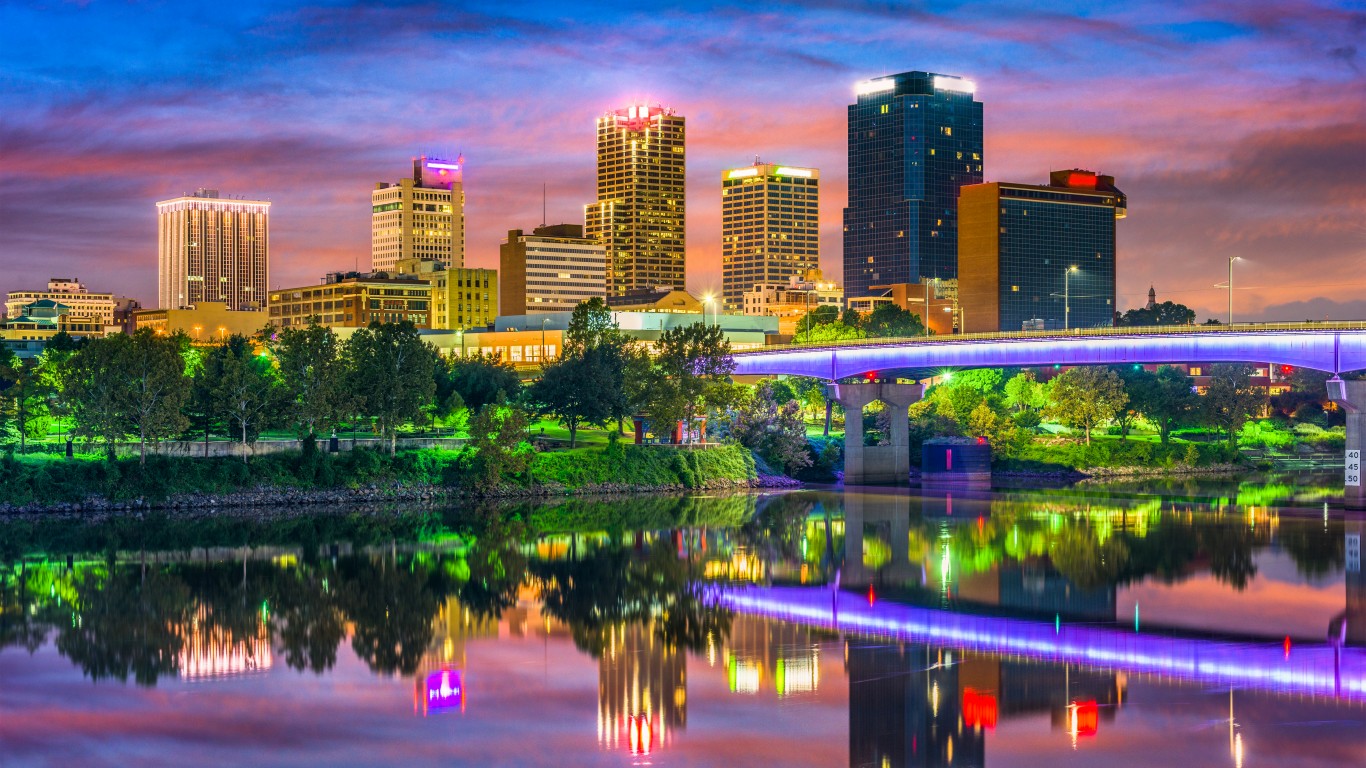
A larger share of Arkansas’ bridges is in good condition compared to the U.S. as a whole. However, 26.3% of the state’s roadways are in poor condition, the 13th highest share among states.

24. Maryland
> Roadway in poor condition: 11.4% (11th lowest)
> Structurally deficient bridges: 5.1% of bridges (15th lowest)
> Locomotive derailments from 2015-2019: 50 (6.5 per 100 miles of track — 8th most out of 49 states)
> State highway spending per licensed driver: $593 (25th highest)
Over the last two decades, the Maryland Department of Transportation, in conjunction with local authorities, has repaired and replaced bridges across the state. As a result, just 5.1% of bridges in the state today are considered structurally deficient, a smaller share than in most states. However, the average age of all bridges in the state is 48 years old, just shy of the expected 50-year lifespan for bridges, meaning repairs will continue to be necessary in the coming years.
As for the state’s roads, despite being a densely populated state with some of the worst traffic congestion in the country contributing to increased wear on road surfaces, just 11.4% of roadway is in poor condition, well below the 21.8% share of roads nationwide.
[in-text-ad]
23. Washington
> Roadway in poor condition: 27.7% (11th highest)
> Structurally deficient bridges: 4.6% of bridges (12th lowest)
> Locomotive derailments from 2015-2019: 139 (4.6 per 100 miles of track — 22nd most out of 49 states)
> State highway spending per licensed driver: $519 (18th lowest)
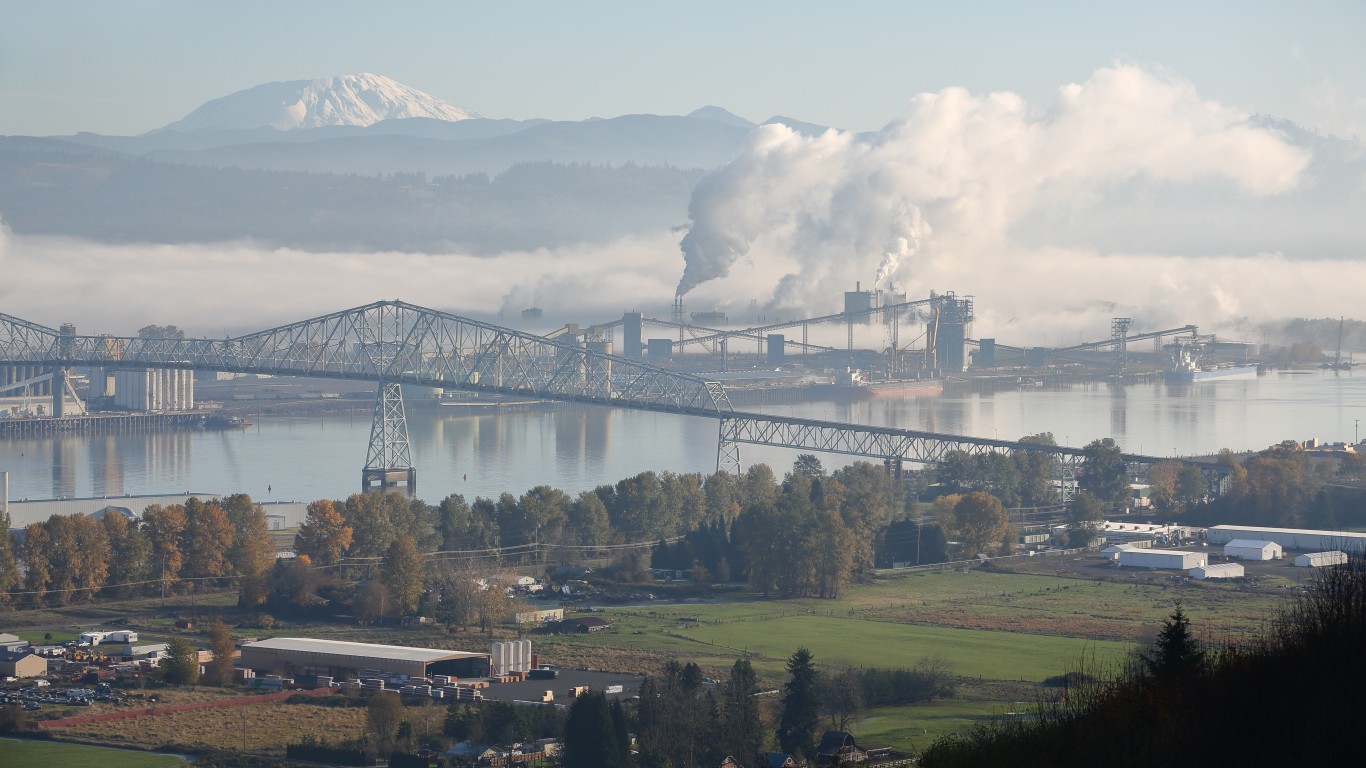
A relatively large share of roadway in Washington state is in need of repair. Nearly 28% of road surface in the state is considered to be in poor condition, a larger share than in all but 10 other states. The poor road surfaces are likely attributable in part to limited investment. Washington spends the equivalent of just $519 on average annually on its highways for every licensed driver in the state.
22. Michigan
> Roadway in poor condition: 22.6% (22nd highest)
> Structurally deficient bridges: 10.7% of bridges (10th highest)
> Locomotive derailments from 2015-2019: 82 (2.4 per 100 miles of track — 12th fewest out of 49 states)
> State highway spending per licensed driver: $403 (4th lowest)
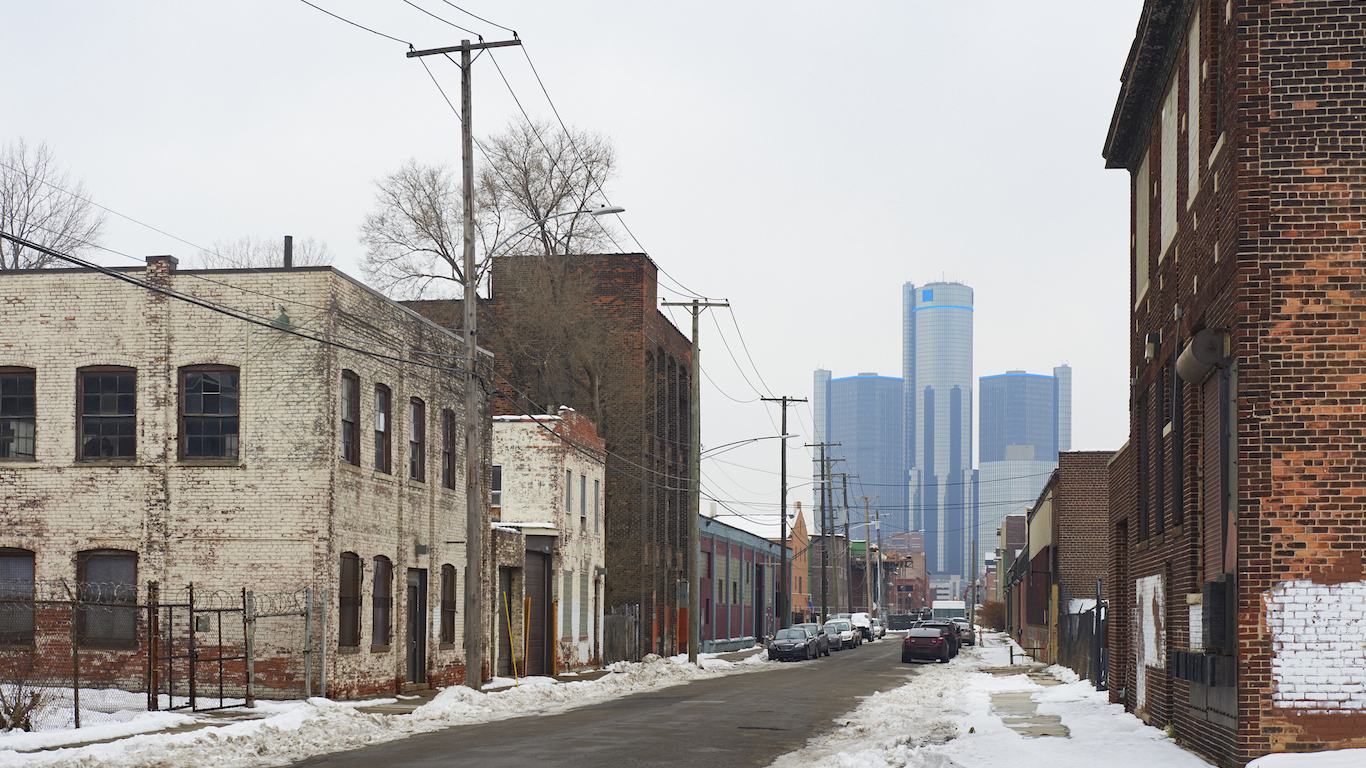
Michigan is one of only a dozen states where more than one in every 10 bridges are considered structurally deficient. This share will only likely grow in the near future as the Michigan Department of Transportation estimates, based on available funding, that the number of bridges in poor condition will climb by 50% from 2016 to 2023. Michigan spends an average of only $403 per licensed driver annually on its highways, less than all but three states despite a slightly larger than average 22.6% of road surface in Michigan is in poor condition.
21. Mississippi
> Roadway in poor condition: 32.2% (9th highest)
> Structurally deficient bridges: 9.4% of bridges (14th highest)
> Locomotive derailments from 2015-2019: 49 (2.0 per 100 miles of track — 8th fewest out of 49 states)
> State highway spending per licensed driver: $602 (23rd highest)
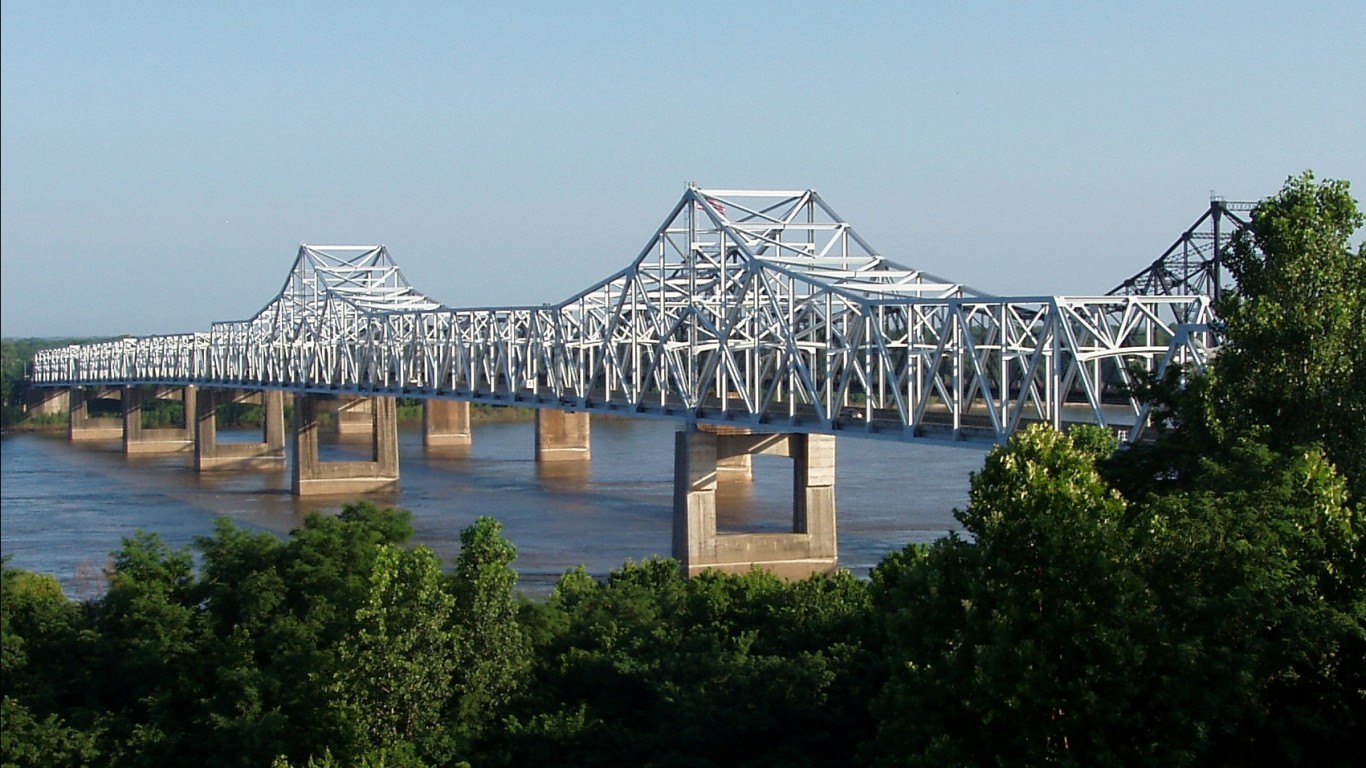
A larger share of roads and bridges are in a state of disrepair in Mississippi than in most other states. Nearly one-third of roadway in the state is in poor condition, and nearly one in every 10 bridges are structurally deficient. In order to address the state’s dire infrastructure conditions, the legislature voted in 2018 to allocate $100 million a year for bridge maintenance and repair. Still, the state’s bridge funding gap is estimated at around $1.6 billion. Road maintenance is funded in large part by taxes on gasoline sales, and as of late 2019, Mississippi’s 18.4 cents-per-gallon of gas tax has not been raised in over three decades.
[in-text-ad-2]
20. Maine
> Roadway in poor condition: 25.5% (16th highest)
> Structurally deficient bridges: 13.1% of bridges (6th highest)
> Locomotive derailments from 2015-2019: 11 (1.0 per 100 miles of track — 3rd fewest out of 49 states)
> State highway spending per licensed driver: $712 (15th highest)
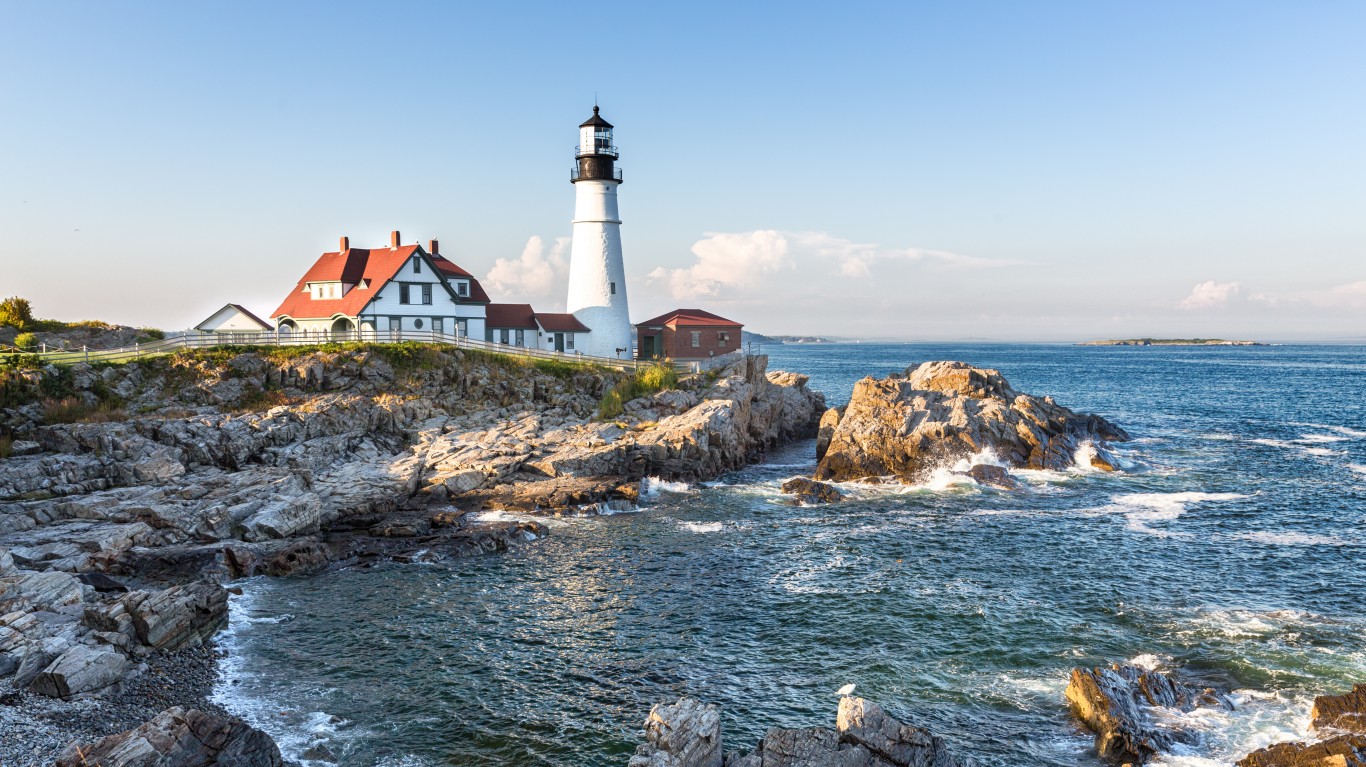
There are over 2,400 bridges in Maine, and 13.1% of those are structurally deficient, according to the Federal Highway Administration, the sixth highest share of any state. In its most recent report card on the state of Maine’s infrastructure, the American Society of Civil Engineers gave the state’s infrastructure a C- grade. The ACSE gave the same grade to the state’s bridges infrastructure, noting that more than half were over 50 years old.
19. Colorado
> Roadway in poor condition: 22.2% (23rd highest)
> Structurally deficient bridges: 5.4% of bridges (18th lowest)
> Locomotive derailments from 2015-2019: 135 (5.6 per 100 miles of track — 12th most out of 49 states)
> State highway spending per licensed driver: $470 (13th lowest)
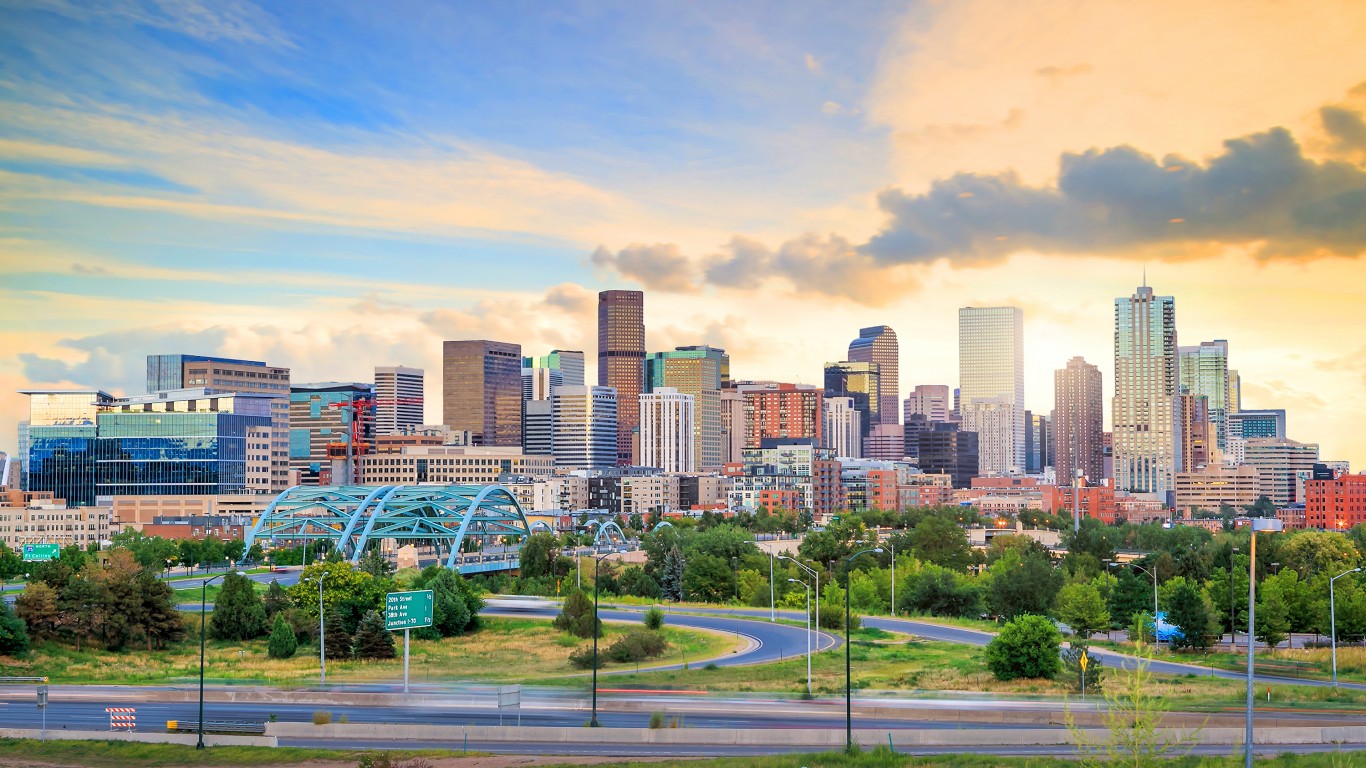
Due to elevation changes and the number of mountain passes through the Rockies, Colorado’s roads are far more difficult — and expensive — to maintain than the roadways in most other states. Partially as a result, 22.2% of road surface in Colorado is in poor condition, compared to 21.8% nationwide.
Train derailments — most commonly caused by broken tracks — are also more common in Colorado than elsewhere. There were 135 derailments reported in the state from 2015 to 2019, or 5.6 for every 100 miles of track, compared to 4.8 per 100 miles of track nationwide over the same period.
[in-text-ad]
18. Texas
> Roadway in poor condition: 24.7% (20th highest)
> Structurally deficient bridges: 1.3% of bridges (the lowest)
> Locomotive derailments from 2015-2019: 822 (7.8 per 100 miles of track — 3rd most out of 49 states)
> State highway spending per licensed driver: $553 (21st lowest)
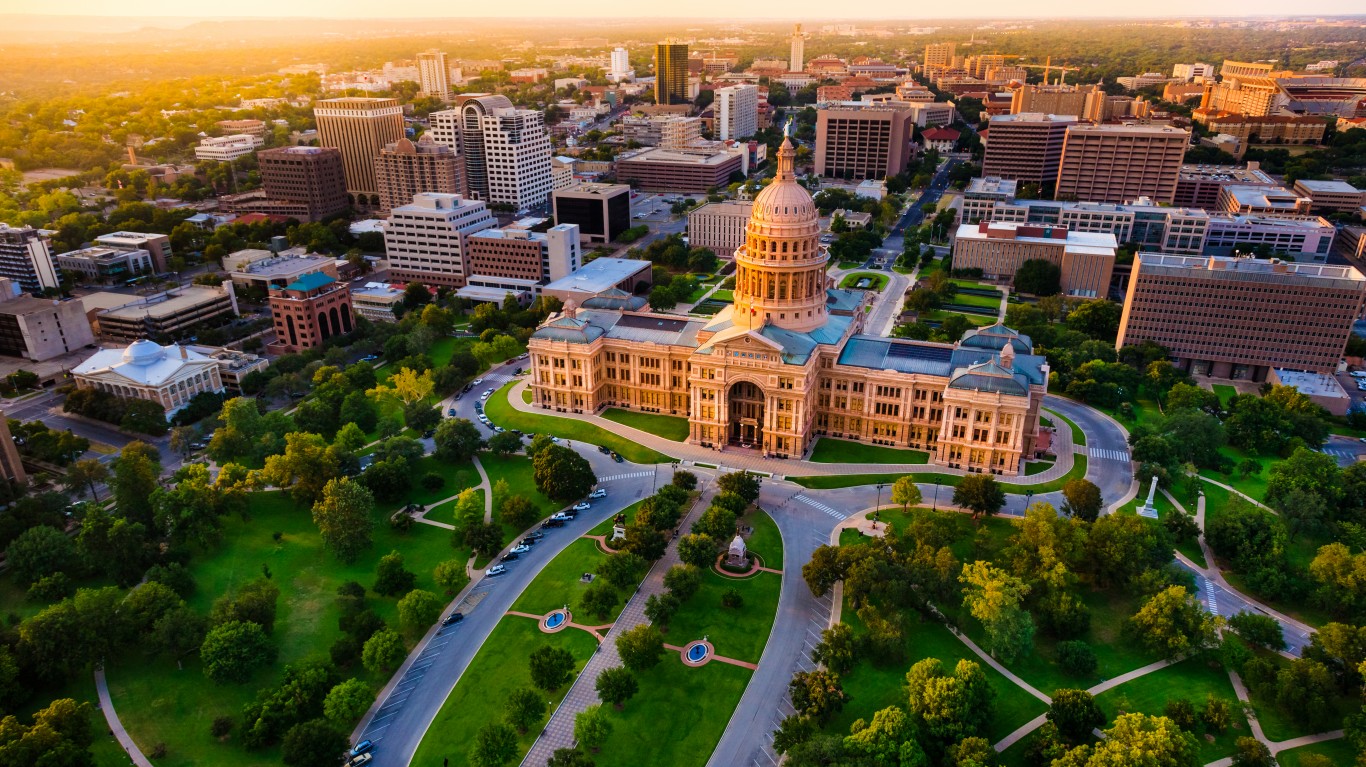
Nearly one-quarter of roads in Texas is in poor condition, a larger share than in most states. Trains are also more likely to become derailed in Texas than in nearly every other state, and derailments are most commonly caused by broken tracks or welds. There were 822 derailments reported in the state from 2015 to 2019, or 7.8 for every 100 miles of track. Over the same period there were 4.8 per 100 miles of track nationwide.
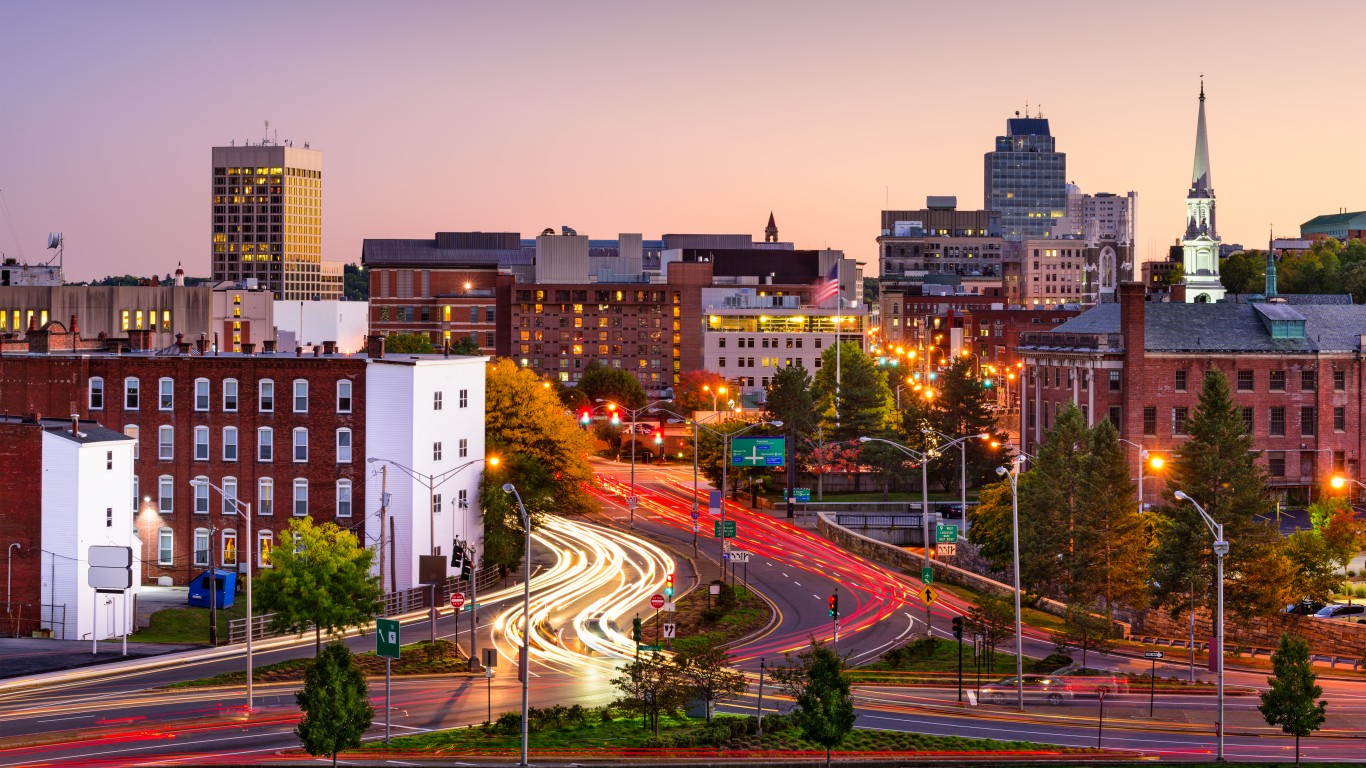
17. Massachusetts
> Roadway in poor condition: 17.2% (21st lowest)
> Structurally deficient bridges: 9.2% of bridges (15th highest)
> Locomotive derailments from 2015-2019: 53 (5.0 per 100 miles of track — 15th most out of 49 states)
> State highway spending per licensed driver: $600 (24th highest)
In Massachusetts, bridges are more likely to be in need of repair or replacement than bridges in most of the country. Of all bridges in the state, 9.2% are considered to be structurally deficient, a larger share than the 7.6% share of bridges nationwide.
Many states in the Northeast have a disproportionately high share of roadway in poor condition partially due to the increased wear sustained during winters. Massachusetts is an exception, however, as just 17.2% of roadway is in poor condition compared to 21.8% of roads nationwide.
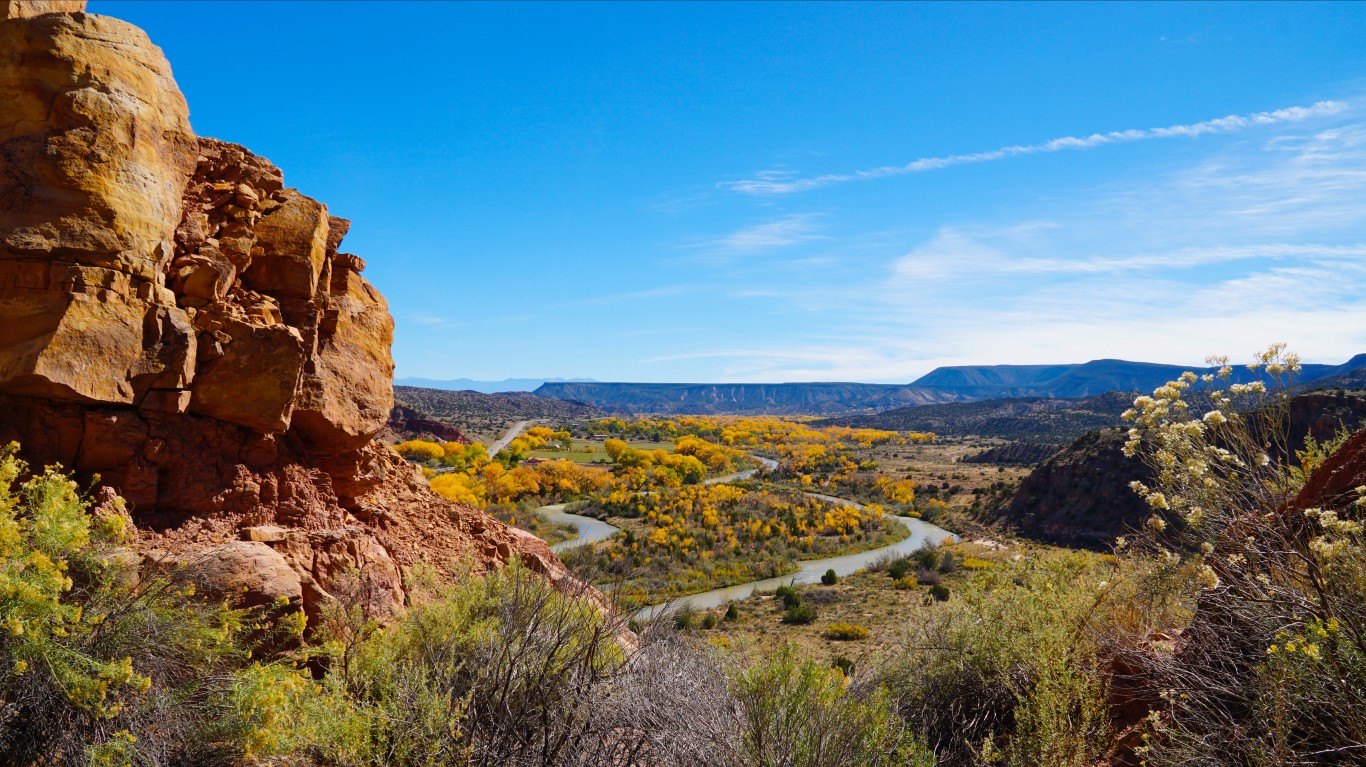
16. New Mexico
> Roadway in poor condition: 39.4% (5th highest)
> Structurally deficient bridges: 5.8% of bridges (20th lowest)
> Locomotive derailments from 2015-2019: 73 (3.9 per 100 miles of track — 23rd fewest out of 49 states)
> State highway spending per licensed driver: $484 (16th lowest)
Just under 40% of New Mexico’s roads are in poor condition, a higher share than in all but four other states. The state is spending relatively less to fix these roads. Between 2014 and 2018, the state’s annual highway expenditure averaged $484 per licensed driver, 16th lowest among states.
[in-text-ad-2]
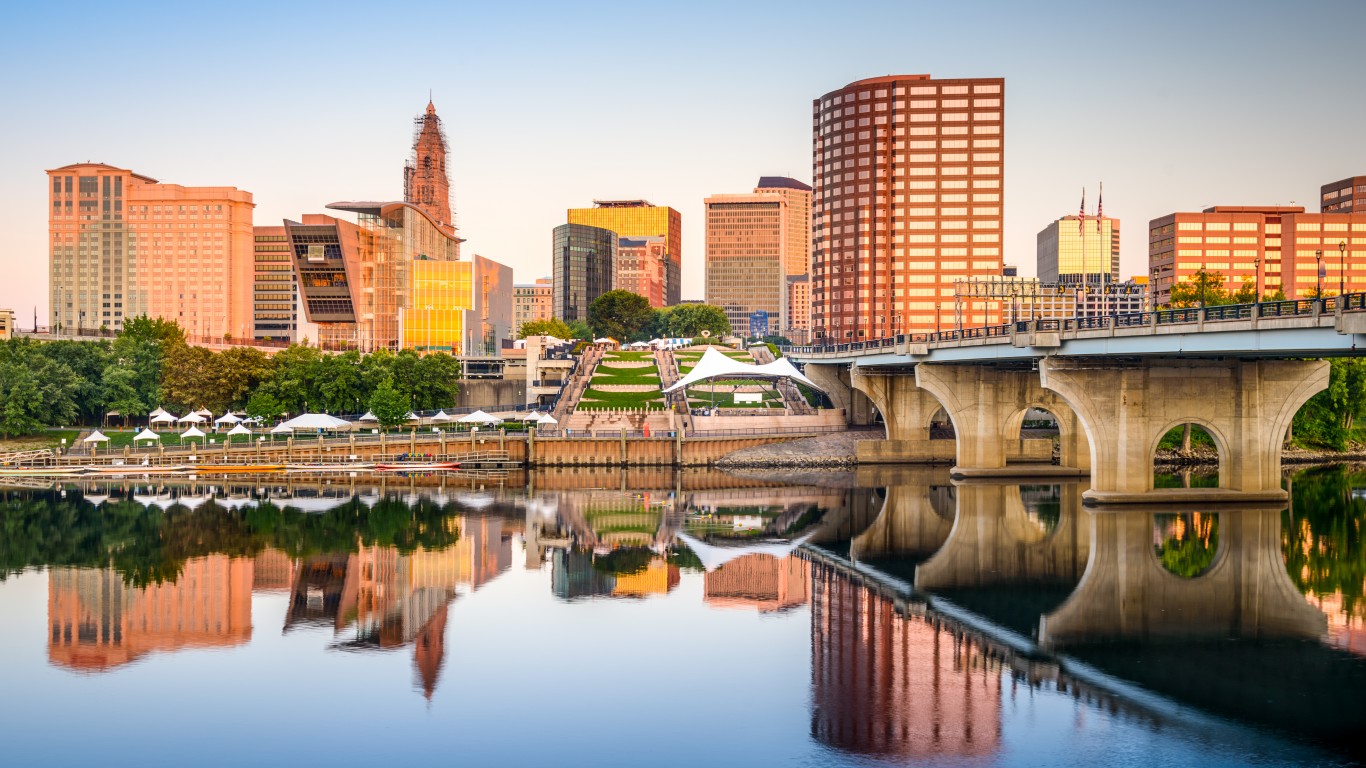
15. Connecticut
> Roadway in poor condition: 25.9% (15th highest)
> Structurally deficient bridges: 7.2% of bridges (25th highest)
> Locomotive derailments from 2015-2019: 26 (5.0 per 100 miles of track — 17th most out of 49 states)
> State highway spending per licensed driver: $632 (18th highest)
Just over 25% of Connecticut’s roads have been determined to be in poor condition by the Federal Highway Administration, the 15th highest share among states and higher than the 21.8% share of roads in poor condition nationwide. Train derailments are often caused by poor track conditions, and these accidents are relatively common in the state. There were 26 derailments in the state between 2015 and 2018, equivalent to five per 100 miles of track, the 17th highest rate out of 49 states.

14. New York
> Roadway in poor condition: 18.3% (23rd lowest)
> Structurally deficient bridges: 10.0% of bridges (12th highest)
> Locomotive derailments from 2015-2019: 163 (5.0 per 100 miles of track — 18th most out of 49 states)
> State highway spending per licensed driver: $494 (17th lowest)
Approximately one in 10 of New York state’s over 17,000 bridges were deemed structurally deficient by the FHWA, the 12th highest share among states. In its most recent state infrastructure report card, the ACSE gave the state’s overall infrastructure a C- grade, and a D+ for its bridges. As of 2015, more than half of the state’s bridges were at least 75 years old, and 400 were over 100 years old.
[in-text-ad]
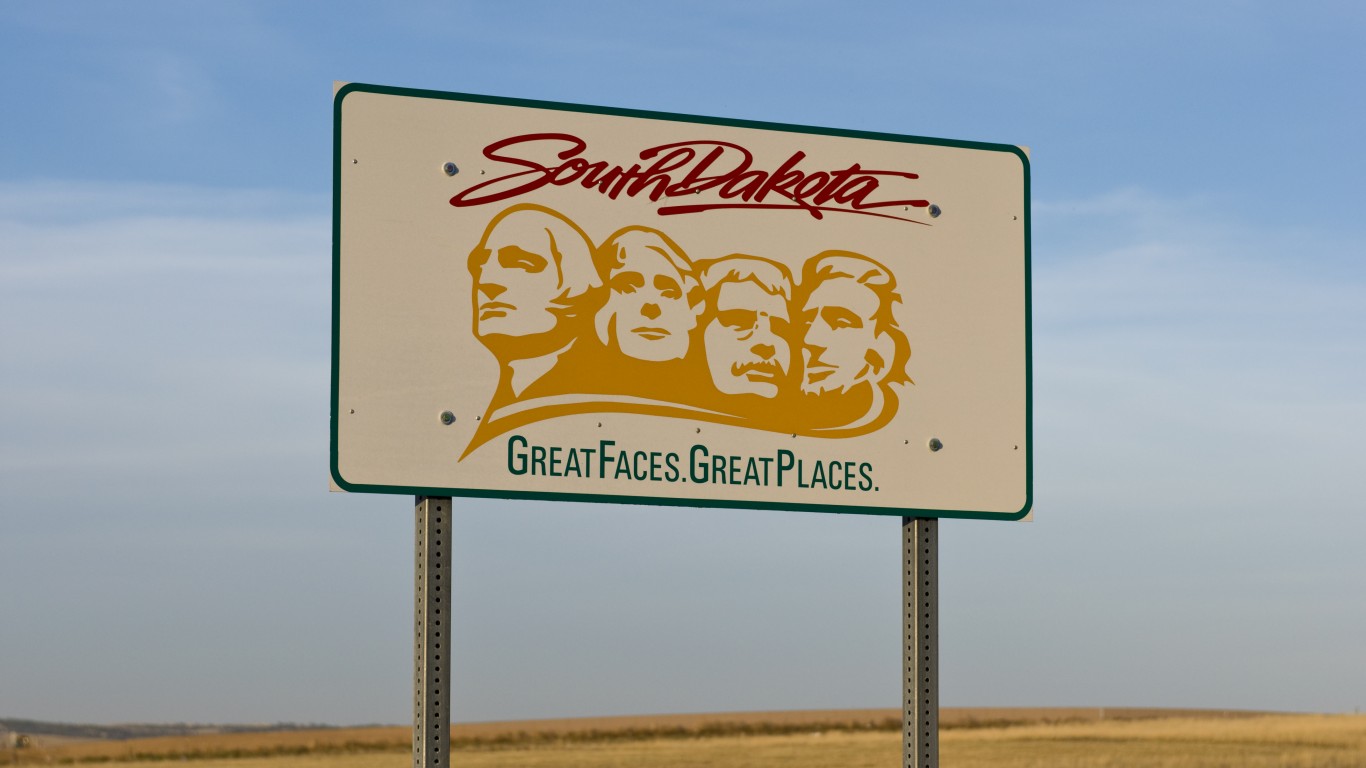
13. South Dakota
> Roadway in poor condition: 18.0% (22nd lowest)
> Structurally deficient bridges: 16.7% of bridges (4th highest)
> Locomotive derailments from 2015-2019: 45 (2.2 per 100 miles of track — 10th fewest out of 49 states)
> State highway spending per licensed driver: $1,035 (4th highest)
The FHWA considers 16.7% of bridges in South Dakota to be structurally deficient, a higher share than all but three other states. In 2018, three construction workers were injured when a bridge near Sioux Falls collapsed while it was under repair.
12. Missouri
> Roadway in poor condition: 28.9% (10th highest)
> Structurally deficient bridges: 8.6% of bridges (18th highest)
> Locomotive derailments from 2015-2019: 194 (5.0 per 100 miles of track — 14th most out of 49 states)
> State highway spending per licensed driver: $329 (2nd lowest)
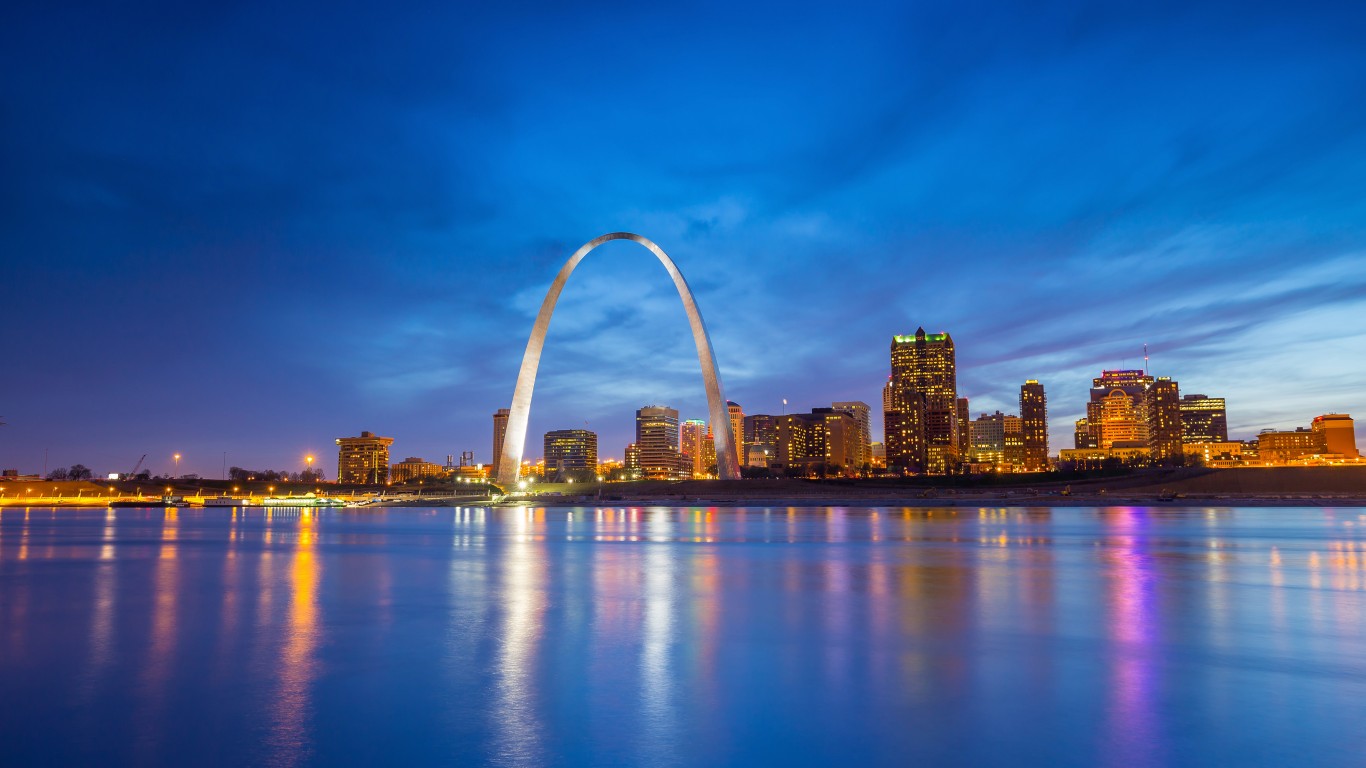
Missouri has one of the largest highway networks in the country, with 34,000 miles of highway as of 2017. Much of that network is in disrepair — 28.9% of state roads are in poor conditions, the 10th highest share of any state. In its most recent report card, the ACSE awarded Missouri’s infrastructure a grade of C-, and gave its road systems a D+.

11. Hawaii
> Roadway in poor condition: 42.3% (4th highest)
> Structurally deficient bridges: 6.9% of bridges (22nd lowest)
> Locomotive derailments from 2015-2019: N/A
> State highway spending per licensed driver: $471 (14th lowest)
Hawaii has a relatively small road network, with just 921 miles that are part of the National Highway System, the smallest total of any state. The state’s relatively small system of roads is also some of the most damaged in the country — with more than 40% of state roads in poor condition, according to the FHWA. In 2019, the ACSE gave Hawaii’s road infrastructure a D+ grade, noting that the state’s roads are threatened by sea level rise and flooding.
[in-text-ad-2]

10. Illinois
> Roadway in poor condition: 16.8% (20th lowest)
> Structurally deficient bridges: 8.5% of bridges (19th highest)
> Locomotive derailments from 2015-2019: 551 (7.7 per 100 miles of track — 4th most out of 49 states)
> State highway spending per licensed driver: $695 (17th highest)
Few states have as many train derailments relative to miles of train track as Illinois. There were 551 train derailments in the state from 2015 to 2019, or 7.7 for every 100 miles of track — well above the 4.8 derailments per 100 miles nationwide. Broken rail and welds are the most common cause of derailments, an indication that rail track is less likely to be well maintained in Illinois than in most other states.
Illinois also has a higher than average share of bridges in need of repair or replacement.
9. Nebraska
> Roadway in poor condition: 21.6% (24th highest)
> Structurally deficient bridges: 8.8% of bridges (17th highest)
> Locomotive derailments from 2015-2019: 247 (7.9 per 100 miles of track — 2nd most out of 49 states)
> State highway spending per licensed driver: $589 (23rd lowest)
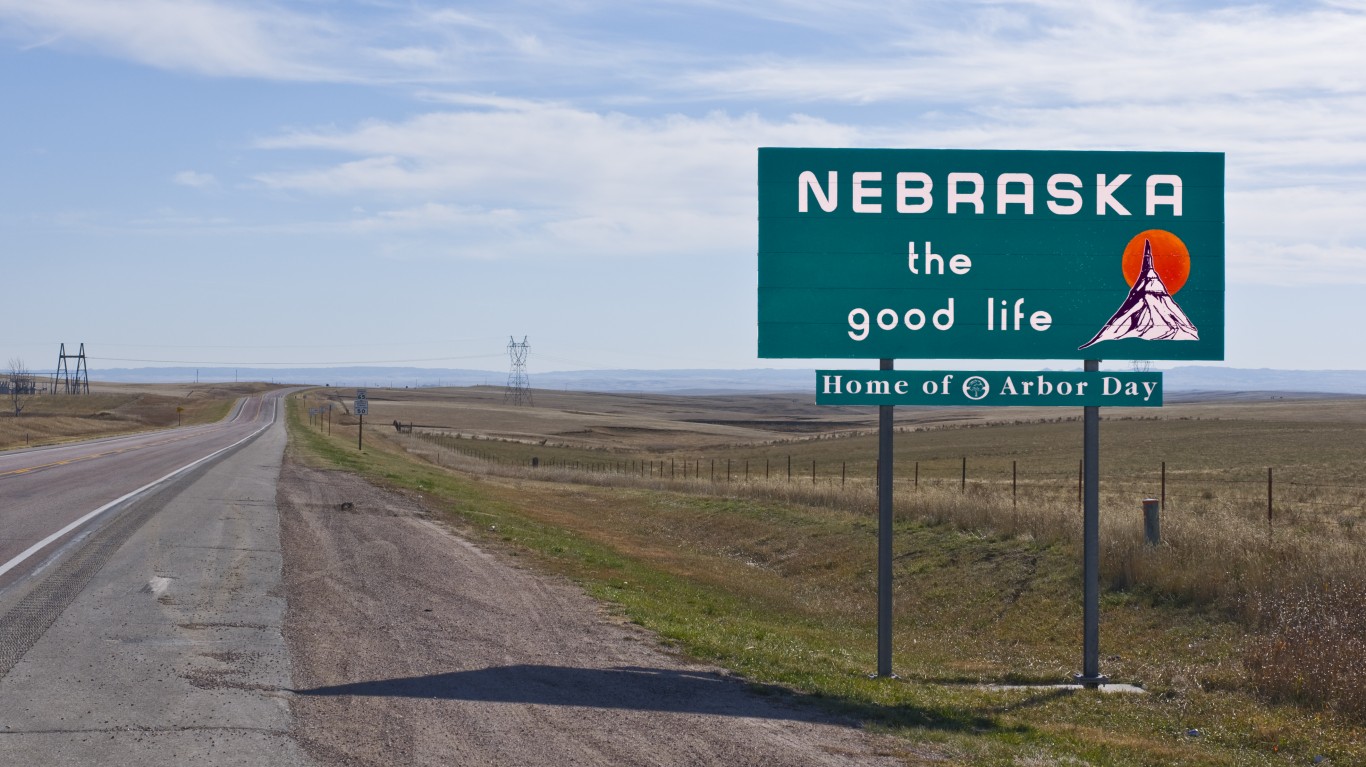
In Nebraska, 21.6% of roads are in poor condition, in line with the comparable share of 21.8% nationwide. In other ways, however, Nebraska’s transportation infrastructure is in greater need of repair than it is nationwide.
For example, 8.8% of bridges in the state are considered structurally deficient compared to 7.6% of bridges nationwide. Additionally, there were 247 train derailments in the state from 2015 to 2019, or 7.9 for every 100 miles of track — well above the national average of 4.8 derailments per 100 miles. This is an indication that Nebraska’s train tracks are more likely to have broken rails or welds.
[in-text-ad]
8. Oklahoma
> Roadway in poor condition: 42.7% (3rd highest)
> Structurally deficient bridges: 11.0% of bridges (8th highest)
> Locomotive derailments from 2015-2019: 137 (4.3 per 100 miles of track — 25th most out of 49 states)
> State highway spending per licensed driver: $855 (10th highest)
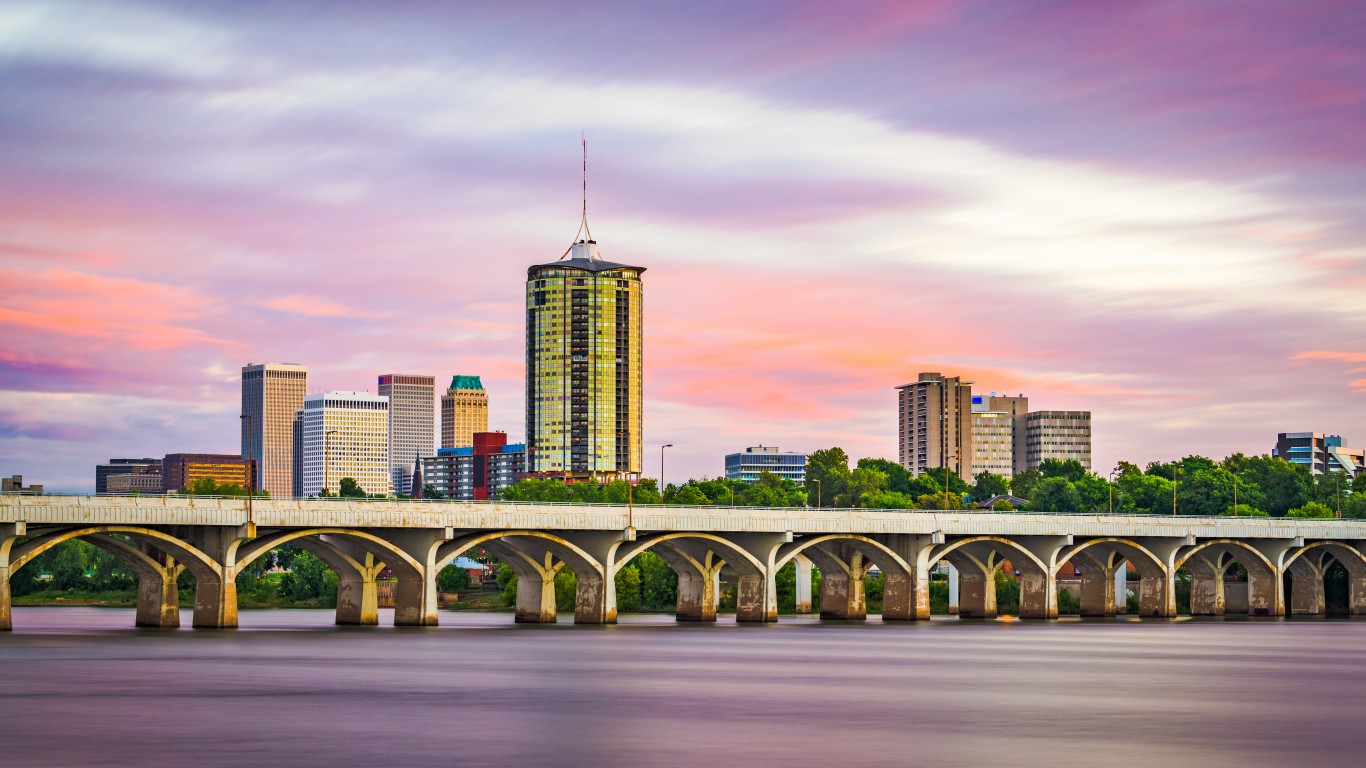
A staggering 42.7% of roadway in Oklahoma is in poor condition, nearly double the 21.8% share of roadway nationwide and a larger share than in all but two other states. Additionally, Oklahoma is one of only a dozen states where more than one in every 10 bridges are considered structurally deficient.
Oklahoma’s overall spending on its highway system climbed each year from 2014 to 2018. The state spends an average of $855 on its highways for every licensed driver, more than all but nine other states.

7. California
> Roadway in poor condition: 34.9% (8th highest)
> Structurally deficient bridges: 7.0% of bridges (24th lowest)
> Locomotive derailments from 2015-2019: 369 (7.6 per 100 miles of track — 5th most out of 49 states)
> State highway spending per licensed driver: $431 (9th lowest)
Relative to the total length of train tracks in the state, locomotive derailments are more common in California than they are nationwide, suggesting that tracks and welds in the state may be more likely to be in need of repair. There were 369 total train derailments between 2015 and 2019 in California, or 7.6 for every 100 miles of track, well above the national average of 4.8 per 100 miles.
Much of California’s roadway is also in need of repair. Nearly 35% of road surface in the state is in poor condition — among the top 10 nationwide for worst road quality.
6. Pennsylvania
> Roadway in poor condition: 27.3% (12th highest)
> Structurally deficient bridges: 16.6% of bridges (5th highest)
> Locomotive derailments from 2015-2019: 236 (4.6 per 100 miles of track — 21st most out of 49 states)
> State highway spending per licensed driver: $946 (7th highest)
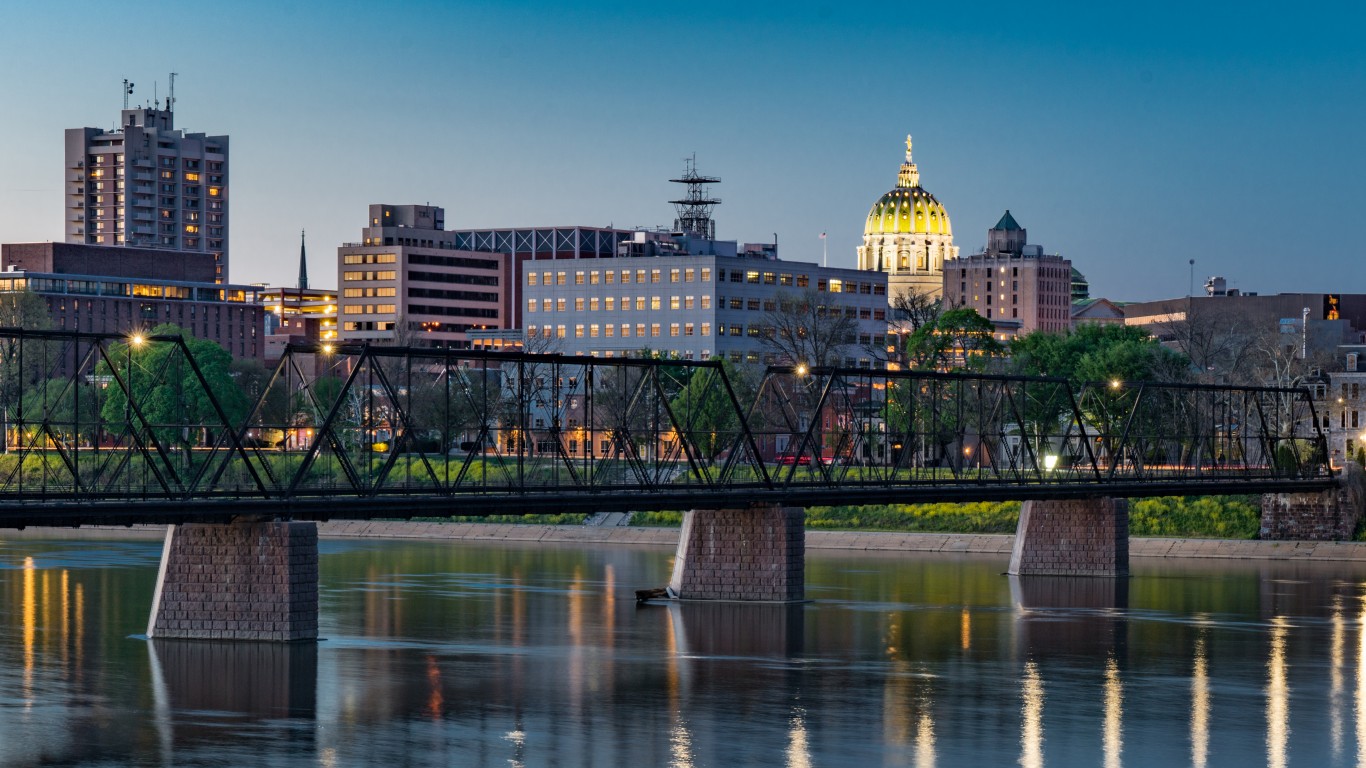
A staggering 16.6% of bridges in Pennsylvania are in need of replacement or repair, more than double the 7.6% share of bridges nationwide that are considered structurally deficient. Much of the disrepair is attributable to age, as bridges in the state are 15 years older than the national average and are in need of modernization.
A relatively large share of roads in Pennsylvania is also in a state of disrepair. More than 27% of road surface in the state is in poor condition, well above the 21.8% national average.
[in-text-ad-2]

5. Louisiana
> Roadway in poor condition: 25.0% (18th highest)
> Structurally deficient bridges: 13.0% of bridges (7th highest)
> Locomotive derailments from 2015-2019: 214 (7.3 per 100 miles of track — 6th most out of 49 states)
> State highway spending per licensed driver: $448 (11th lowest)
Based on the frequency with which train derailments occur in Louisiana, the state’s railway system appears to be in greater need of replacement or repair than tracks in most other states. There were 214 derailments documented between 2015 and 2019, or 7.3 for every 100 miles of track, more than in all but five other states.
Additionally, 13.0% of bridges in Louisiana are considered structurally deficient, well above the 7.6% share of bridges nationwide in need of repair or replacement. Louisiana has more bridge surface area than nearly any other state, and some bridges in the state are often submerged by the waterways they are supposed to traverse after heavy rains.

4. West Virginia
> Roadway in poor condition: 36.4% (7th highest)
> Structurally deficient bridges: 19.9% of bridges (2nd highest)
> Locomotive derailments from 2015-2019: 52 (2.3 per 100 miles of track — 11th fewest out of 49 states)
> State highway spending per licensed driver: $988 (5th highest)
West Virginia has fewer train derailments relative to the amount of track it has than most states. But its advantages in terms of the quality of its infrastructure end there. About one in every five bridges in the state are structurally deficient, and more than a third of all roadway is in poor condition — second and seventh highest shares of any state, respectively.
[in-text-ad]
3. Wisconsin
> Roadway in poor condition: 81.7% (the highest)
> Structurally deficient bridges: 7.4% of bridges (24th highest)
> Locomotive derailments from 2015-2019: 85 (2.6 per 100 miles of track — 13th fewest out of 49 states)
> State highway spending per licensed driver: $778 (13th highest)
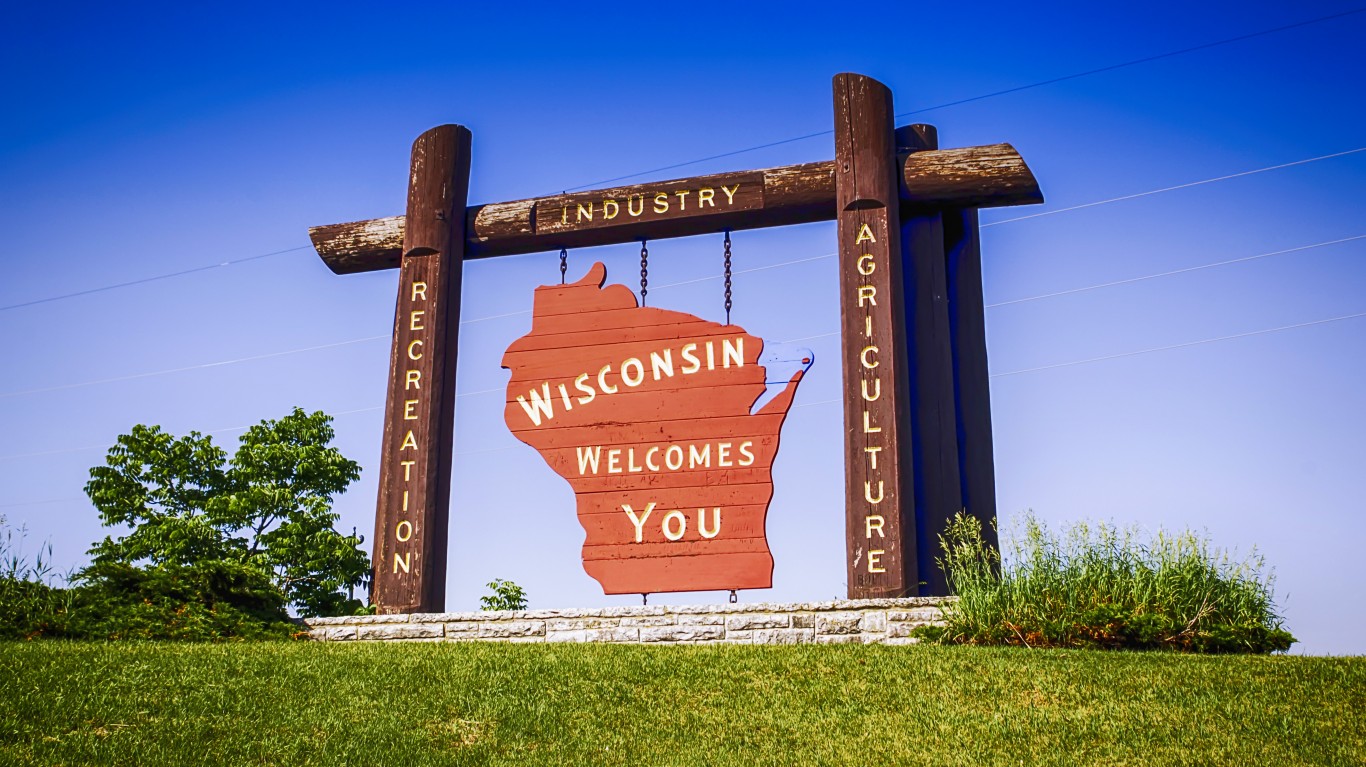
While Wisconsin dedicated 8.0% of state expenditure to highways from 2014 to 2018 — one of the larger shares of any state — it is home to some of the worst roads in the country. According to data from the FHWA, some 81.7% of roadway in Wisconsin is in poor condition — defined as rural roads with an International Roughness Index score greater than 170 and urban roads with an IRI score greater than 220 — the largest share of any state. Motorists in Wisconsin incur in costs an average of $737 each year from driving on roads in need of maintenance, according to data from the American Society of Civil Engineers.
2. Rhode Island
> Roadway in poor condition: 48.7% (2nd highest)
> Structurally deficient bridges: 23.1% of bridges (the highest)
> Locomotive derailments from 2015-2019: 1 (1.7 per 100 miles of track — 4th fewest out of 49 states)
> State highway spending per licensed driver: $467 (12th lowest)
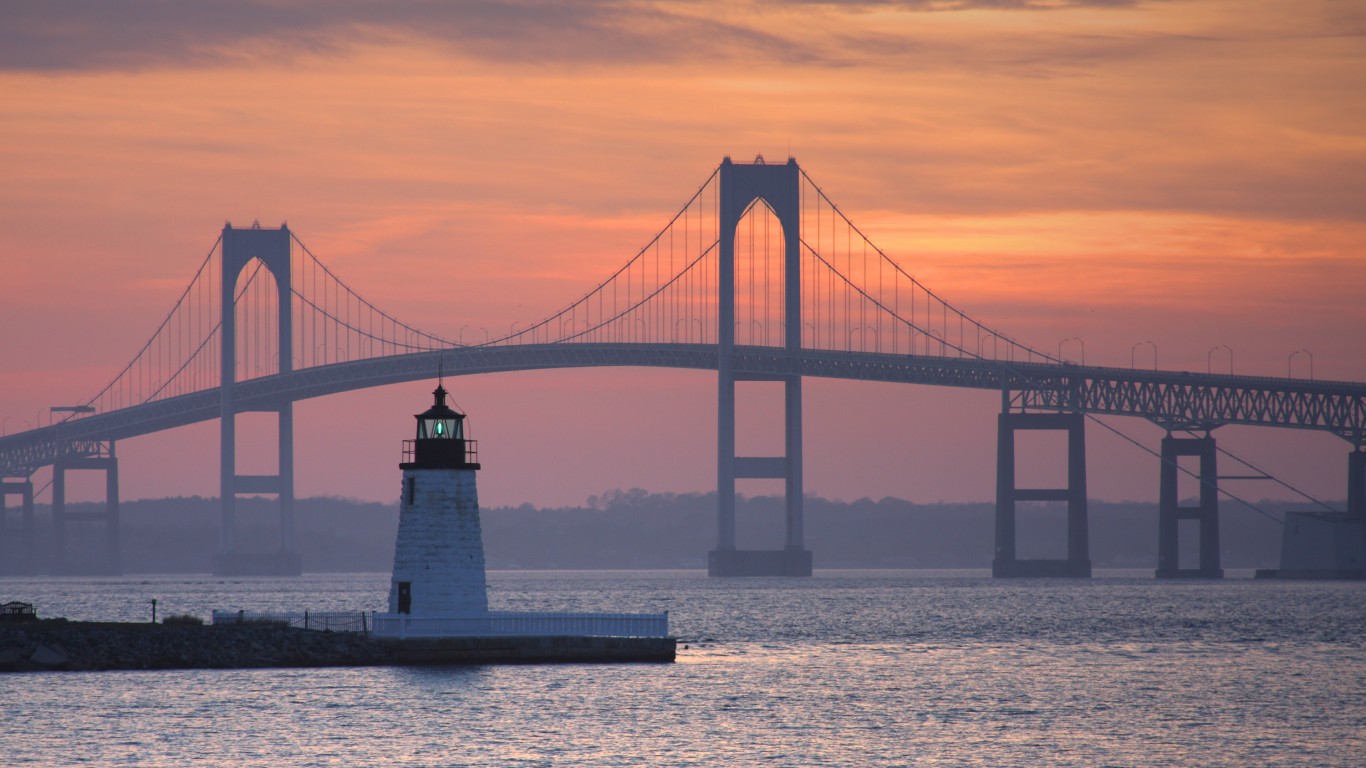
From 2014 to 2018, Rhode Island dedicated just 3.9% of its annual expenditure to highway maintenance, the sixth smallest share of any state. Highway spending amounts to an average of $467 per licensed driver per year, also one of the smaller figures of any state.
The relative lack of funding may be one factor contributing to the state of Rhode Island’s infrastructure. Some 48.7% of state roads are in poor condition, the second largest share of any state. Similarly, the FHWA deems 23.1% of bridges in the state to be structurally deficient, the largest share nationwide.

1. New Jersey
> Roadway in poor condition: 37.2% (6th highest)
> Structurally deficient bridges: 8.1% of bridges (22nd highest)
> Locomotive derailments from 2015-2019: 104 (10.9 per 100 miles of track — the most out of 49 states)
> State highway spending per licensed driver: $614 (22nd highest)
In New Jersey, 37.2% of roads are in poor condition, the sixth largest share of any state and far more than the 21.8% national figure. New Jersey is also one of the most congested states, with a mean travel time to work of 32.4 minutes — the third longest commute nationwide. According to data from the American Transport Research Institute, congestion and poor roads in New Jersey cost the trucking industry some $3.4 billion in 2016, the most of any state when adjusted for total miles of highway.
Rail transportation infrastructure in the state is in similarly poor condition. According to data from the Federal Railroad Administration of the DOT, from 2015 to 2019 there were a total of 104 train derailments in New Jersey. Adjusted for miles of railway, there were 10.9 derailments per 100 miles — by far the most of any state.
Methodology
To determine the states that are falling apart, 24/7 Wall St. constructed an index consisting of three measures related to state infrastructure — road, bridges, and rail conditions — using data from the U.S. Department of Transportation and other sources. Data on the percentage of roads in “poor” condition — rural roads with an International Roughness Index score greater than 170 and urban roads with an IRI score greater than 220 — as of Dec. 31, 2018, came from the Federal Highway Administration of the DOT and were included in the index. Data on IRI by road length by state came from table HM-63 of the FHWA’s 2018 Highway Statistics. Data on the percentage of the number of bridges in “poor” condition — a designation from the FHWA indicating structural deficiencies such as deterioration, crackling, and spalling — as of Dec. 31, 2018 also came from the FHWA and were included in the index. The final component of the index is the number of train derailment accidents per 100 miles of railway. Data on the number of train derailments from 2015 and 2019 came from the Federal Railroad Administration of the DOT and were adjusted for the total miles of railway in each state as of 2017 using data from the Association of American Railroads.
Supplemental data on highway spending by state from 2014 to 2018 came from the U.S. Census Bureau’s Annual Survey of State Government Finances. The average annual highway spending during that period was adjusted for the number of licensed drivers using annual data from FHWA.
Iowa did not meet our data completeness requirements and was therefore excluded from consideration.
The average American spends $17,274 on debit cards a year, and it’s a HUGE mistake. First, debit cards don’t have the same fraud protections as credit cards. Once your money is gone, it’s gone. But more importantly you can actually get something back from this spending every time you swipe.
Issuers are handing out wild bonuses right now. With some you can earn up to 5% back on every purchase. That’s like getting a 5% discount on everything you buy!
Our top pick is kind of hard to imagine. Not only does it pay up to 5% back, it also includes a $200 cash back reward in the first six months, a 0% intro APR, and…. $0 annual fee. It’s quite literally free money for any one that uses a card regularly. Click here to learn more!
Flywheel Publishing has partnered with CardRatings to provide coverage of credit card products. Flywheel Publishing and CardRatings may receive a commission from card issuers.
Thank you for reading! Have some feedback for us?
Contact the 24/7 Wall St. editorial team.