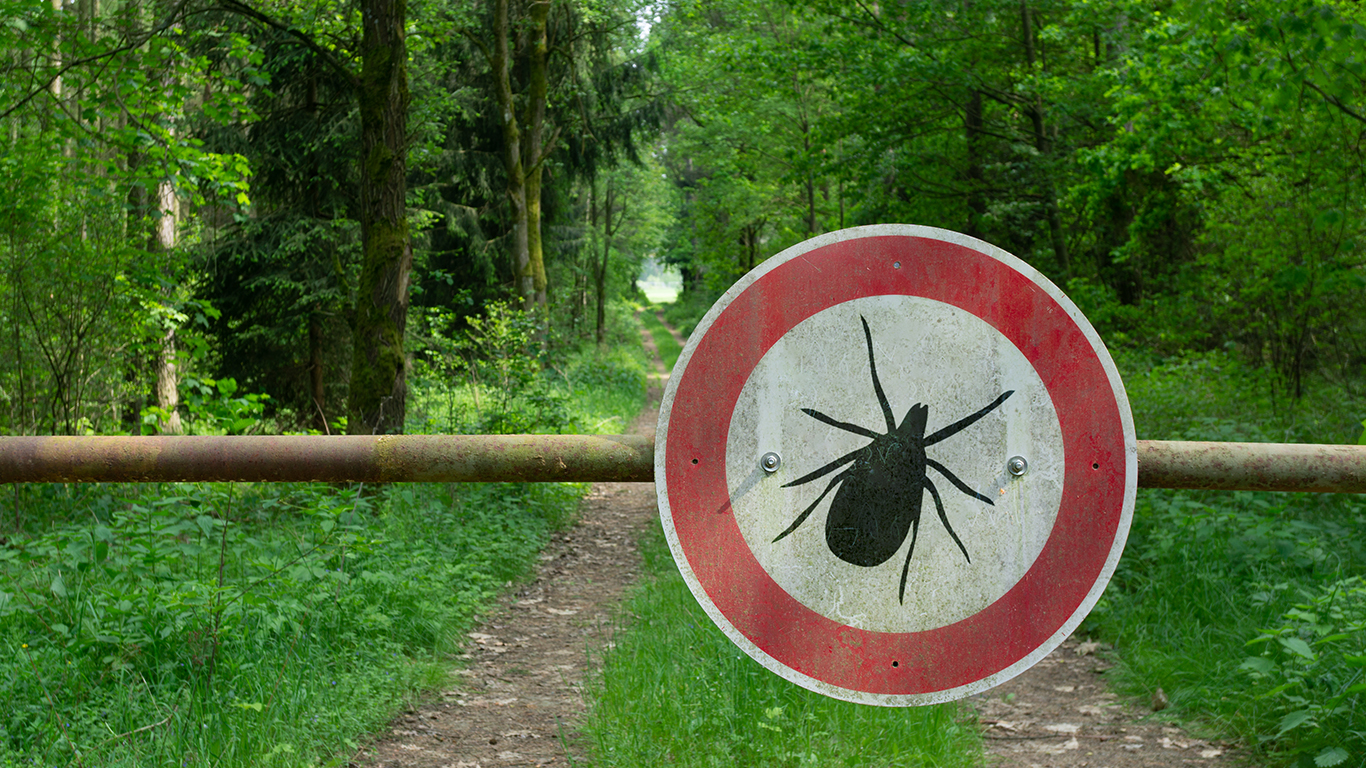
Cases of the novel coronavirus continue to soar in the United States, and millions of Americans are making a conscious effort to protect themselves by wearing masks and by adhering to social distancing recommendations. In this context, it can be easy to forget some perennial risks to our health that, with some precaution, are avoidable. One of them is Lyme disease.
Lyme disease is a bacterial infection humans can get from certain species of parasitic ticks — western blacklegged ticks along the Pacific Coast, and deer ticks or blacklegged ticks in the rest of the country. Ticks contract the disease from animals like deer or mice and can pass it along to humans if they are able to attach to bare skin for at least 36 hours.
Symptoms of the disease include fever, chills, headache, fatigue, muscle and joint aches, and between 70% and 80% of people with the disease develop a rash that resembles a bull’s eye. In most cases, Lyme disease is curable with a regimen of antibiotics. The disease is most commonly contracted in the spring and summer months. Here is a look at other health problems common in the winter and fall.
Though cases of Lyme have been reported in every state, the infection is far more common in certain parts of the country. Using data from the Centers for Disease Control and Prevention, 24/7 Wall St. identified the worst states for Lyme disease. We ranked states based on the average annual number of infections from 2016 to 2018, adjusted for population. We included Washington, D.C., in our analysis.
Nationwide, there are 8.1 cases of Lyme disease for every 100,000 people every year. In most of the places on this list — which are concentrated in the Northeast, mid-Atlantic, and Midwest — the infection rate is many times greater than the national average.
Even in higher risk areas, there are measures people can take to reduce the likelihood of infection. Ticks live in grassy and forested areas, so avoiding such places when possible is the best way to prevent tick bites. When venturing into areas with dense brush, wearing long sleeves and pants and showering and checking for ticks afterward can also reduce risk of infection. Here is a list of 16 tips to prevent different types of infections.
Click here to see the worst states for lyme disease.
Click here to read our methodology.
15. District of Columbia
> Avg. new Lyme cases per year: 8.9 confirmed cases per 100,000 people
> Total cases in 2018: 79 (57 confirmed, 22 probable)
> Worst year since 2009: 11.6 per 100,000 in 2015
> Physically active adults: 81.6% (6th highest)
> Uninsured rate: 3.2% (the lowest)
The humidity in the spring and summer seasons in Washington, D.C., provides ideal conditions for ticks — particularly deer ticks that carry Lyme disease. Based on the number of infections reported between 2016 and 2018, there are an average of 8.9 cases of Lyme disease in Washington D.C. annually for every 100,000 residents, a higher incidence rate than in all but 14 states.
Even in urban areas, disease carrying ticks can live in backyards and parks. While in much of the country Lyme disease is spread by deer populations who then pass the disease on to ticks, in urban areas like Washington, the disease is likely passed to ticks mostly by mice.
[in-text-ad]

14. Virginia
> Avg. new Lyme cases per year: 10.9 confirmed cases per 100,000 people
> Total cases in 2018: 1,139 (744 confirmed, 395 probable)
> Worst year since 2009: 13.1 per 100,000 in 2015
> Physically active adults: 77.1% (23rd highest)
> Uninsured rate: 8.8% (19th highest)
There are an average of 10.9 cases of Lyme disease for every 100,000 people in Virginia annually. The average annual incidence rate only accounts for confirmed cases and does not include probably cases, which numbered nearly 400 in 2018. Not all cases of Lyme disease are confirmed by lab tests, as testing for the infection is done by checking for antibodies for the disease, which can take several weeks after the initial infection to develop.
13. New York
> Avg. new Lyme cases per year: 14.5 confirmed cases per 100,000 people
> Total cases in 2018: 3,638 (2,446 confirmed, 1,192 probable)
> Worst year since 2009: 21.2 per 100,000 in 2009
> Physically active adults: 75.3% (17th lowest)
> Uninsured rate: 5.4% (9th lowest)
New York state ranks among the worst places in the country for Lyme disease. There are an average of 14.5 cases of the disease for every 100,000 people in the state annually. Lyme disease used to be more of a problem in southern parts of the state, including the lower Hudson Valley and Long Island. In recent years, however, the disease has been moving farther north, into central New York and the Adirondack region.
12. Maryland
> Avg. new Lyme cases per year: 18.6 confirmed cases per 100,000 people
> Total cases in 2018: 1,382 (894 confirmed, 488 probable)
> Worst year since 2009: 25.7 per 100,000 in 2009
> Physically active adults: 77.6% (22nd highest)
> Uninsured rate: 6.0% (15th lowest)
Over the last three years, there has been an average of 18.6 confirmed cases of Lyme disease for every 100,000 people in Maryland annually. While the incidence of the infection is higher than in most of the country, infections have become less common in recent years. There were only 14.8 cases for every 100,000 people in 2018, down from 19.7 in 2017 and 21.2 in 2016. Over the last decade of data, the worst year for Lyme disease in the state was 2009, when there were 25.7 new infections for every 100,000 residents.
[in-text-ad-2]

11. Minnesota
> Avg. new Lyme cases per year: 21.9 confirmed cases per 100,000 people
> Total cases in 2018: 1,541 (950 confirmed, 591 probable)
> Worst year since 2009: 26.4 per 100,000 in 2013
> Physically active adults: 79.9% (10th highest)
> Uninsured rate: 4.4% (5th lowest)
Lyme disease tends to be more common in Northeastern and mid-Atlantic states, but Minnesota is one of a few Midwestern states with a near nation-leading incidence rate of the infection. There are an average of 21.9 new infections for every 100,000 people in the state annually, more than double the average infection rate nationwide of 8.1 per 100,000.
Minnesota residents are more likely to contract Lyme disease than most Americans and are also more likely to be able to seek and afford treatment. Minnesota is one of only seven states where less than than 5% of the population is without health insurance.

10. West Virginia
> Avg. new Lyme cases per year: 24.9 confirmed cases per 100,000 people
> Total cases in 2018: 671 (554 confirmed, 117 probable)
> Worst year since 2009: 30.7 per 100,000 in 2018
> Physically active adults: 71.1% (5th lowest)
> Uninsured rate: 6.4% (17th lowest)
Lyme disease has become much more common in West Virginia in recent years. As recently as 2012, there were only 4.4 cases for every 100,000 people. As of 2018, there were 30.7 confirmed cases of the disease for every 100,000 state residents — a nearly 600% increase.
Deer tick populations, which carry Lyme disease, have grown in West Virginia in recent years. In March 2018, Gov. Jim Justice signed legislation that prevents insurance companies from denying coverage for Lyme disease treatment and care.
[in-text-ad]

9. Wisconsin
> Avg. new Lyme cases per year: 25.4 confirmed cases per 100,000 people
> Total cases in 2018: 1,869 (1,121 confirmed, 748 probable)
> Worst year since 2009: 44.0 per 100,000 in 2010
> Physically active adults: 79.2% (13th highest)
> Uninsured rate: 5.5% (11th lowest)
Wisconsin is the only state in the Midwest and one of nine states nationwide with an average of more than 25 new cases of Lyme disease for every 100,000 people annually. Infections have become less common in the state recently, as there were only 19.3 cases for every 100,000 people in 2018, down 38% from 31.0 cases per 100,000 people in 2017.
People who spend more time outdoors are at increased risk of being bitten and infected by disease-carrying ticks. In Wisconsin, nearly 80% of adults are regularly physically active, a larger share than in the majority of states.

8. Connecticut
> Avg. new Lyme cases per year: 36.2 confirmed cases per 100,000 people
> Total cases in 2018: 1,859 (1,268 confirmed, 591 probable)
> Worst year since 2009: 78.2 per 100,000 in 2009
> Physically active adults: 79.6% (11th highest)
> Uninsured rate: 5.3% (7th lowest)
Lyme disease was first identified in Connecticut in the 1970s, and today, the state remains one of the hotspots for the disease. There are 36.2 new infections for every 100,000 people annually in Connecticut, more than four times the national incidence rate of 8.1 new infections per 100,000.
Encouragingly, cases of the disease are becoming less common in the state. There were only 35.5 cases for every 100,000 people in 2018, down 55% from a 10-year high of 78.2 cases per 100,000 in 2009. However, experts warn that tick populations may surge this year in the state due to the mild winter and cool spring.

7. New Jersey
> Avg. new Lyme cases per year: 36.6 confirmed cases per 100,000 people
> Total cases in 2018: 4,000 (2,876 confirmed, 1,124 probable)
> Worst year since 2009: 52.8 per 100,000 in 2009
> Physically active adults: 74.0% (12th lowest)
> Uninsured rate: 7.4% (23rd lowest)
The humidity common in much of the mid-Atlantic region allows tick populations to thrive. In New Jersey, nearly 2,900 people were infected with Lyme disease by deer ticks, and an additional 1,100 people were likely infected. Over the last three years, there has been an average of 36.6 confirmed cases of Lyme disease for every 100,000 people in the state annually, well above the comparable 8.1 per 100,000 national average.
[in-text-ad-2]

6. Delaware
> Avg. new Lyme cases per year: 45.7 confirmed cases per 100,000 people
> Total cases in 2018: 520 (505 confirmed, 15 probable)
> Worst year since 2009: 111.2 per 100,000 in 2009
> Physically active adults: 72.3% (7th lowest)
> Uninsured rate: 5.7% (14th lowest)
Confirmed cases of Lyme disease have climbed in recent years in Delaware. There were 505 confirmed cases in the state in 2018 alone, or 52.2 infections for every 100,000 people — a 19% increase from the previous year. Still, the incidence rate lags well behind the highs recorded in the state from 2009 to 2011, when Delaware led the nation in Lyme disease incidence rates.
Though cases of the infection have been identified in each of the state’s three counties, cases tend to be concentrated in New Castle, the state’s northernmost county that sits across the Delaware River from New Jersey and shares a border with Maryland and Pennsylvania — three other states that rank on this list.

5. Rhode Island
> Avg. new Lyme cases per year: 56.4 confirmed cases per 100,000 people
> Total cases in 2018: 1,111 (661 confirmed, 450 probable)
> Worst year since 2009: 62.5 per 100,000 in 2018
> Physically active adults: 75.6% (19th lowest)
> Uninsured rate: 4.1% (4th lowest)
The northeastern United States — particularly the New England region — is a hotspot for Lyme disease. Each of the five states with an annual incidence rate of more than 50 cases of the disease for every 100,000 people is located in the Northeast, and Rhode Island is one of them.
Cases have climbed considerably in Rhode Island over the last 10 years, from just 14.2 cases per 100,000 people in 2009 to 62.5 per 100,000 in 2018. It is important to note that the most recent incidence rate only includes the 661 confirmed cases in the state and not the additional 450 probable cases.
[in-text-ad]
4. New Hampshire
> Avg. new Lyme cases per year: 63.8 confirmed cases per 100,000 people
> Total cases in 2018: 1,428 (927 confirmed, 501 probable)
> Worst year since 2009: 100.0 per 100,000 in 2013
> Physically active adults: 78.7% (15th highest)
> Uninsured rate: 5.7% (14th lowest)
Every year from 2009 through 2013, New Hampshire ranked among the three states with highest concentration of new Lyme disease cases. Over the last three years, there has been an average of 63.8 cases for every 100,000 people annually, the fourth highest average among states. In 2018, the most recent year of data, there were 68.3 cases for every 100,000 people, the second most of any state, trailing only Maine, New Hampshire’s neighbor to the east.

3. Pennsylvania
> Avg. new Lyme cases per year: 68.1 confirmed cases per 100,000 people
> Total cases in 2018: 10,208 (7,920 confirmed, 2,288 probable)
> Worst year since 2009: 72.2 per 100,000 in 2017
> Physically active adults: 76.9% (24th highest)
> Uninsured rate: 5.5% (11th lowest)
Of the states with the highest incidence of Lyme disease, Pennsylvania is the only one located outside of the New England region. There were an average of 68.1 new Lyme cases annually in the state for every 100,000 residents between 2016 and 2018.
The type of tick that carries Lyme disease was virtually non-existent in Pennsylvania as recently as the 1960s. Experts attribute its prevalence today to climate change, change in human and animal behavior that may bring ticks closer to population centers, and the regrowth of timber that was initially cut around 1900 that is now providing a habitat for tick populations.

2. Vermont
> Avg. new Lyme cases per year: 79.1 confirmed cases per 100,000 people
> Total cases in 2018: 576 (348 confirmed, 228 probable)
> Worst year since 2009: 107.6 per 100,000 in 2013
> Physically active adults: 80.9% (7th highest)
> Uninsured rate: 4.0% (2nd lowest)
Over the last 30 years, cases of Lyme disease have skyrocketed in Vermont. In the early 1990s, there were fewer than a dozen cases a year. As of 2018, there were 348 confirmed cases and another 228 likely cases. Though the number of cases fluctuates from year to year, there are currently an average of 79.1 cases for every 100,000 people in the state annually.
Though Vermonters have been diagnosed with Lyme disease in every county in the state, the disease tends to be concentrated in the southern half of the state — particularly in Bennington, Rutland, and Windham counties.
[in-text-ad-2]
1. Maine
> Avg. new Lyme cases per year: 92.0 confirmed cases per 100,000 people
> Total cases in 2018: 1,405 (1,111 confirmed, 294 probable)
> Worst year since 2009: 106.6 per 100,000 in 2017
> Physically active adults: 78.4% (18th highest)
> Uninsured rate: 8.0% (25th highest)
Maine’s annual incidence of Lyme disease of 92 per 100,000 residents is the highest of any state and more than 10 times higher than the nationwide incidence rate of 8.1 cases per 100,000 people.
Maine is one of the most rural and sparsely populated states in the country, and Mainers are likely to be close to grassy and wooded areas where disease-carrying blacklegged ticks tend to live. According to the Maine Center for Disease Control and Prevention, Lyme disease is common in every part of the state, and children ages 5 to 14 are at especially high risk for the disease.
Methodology:
To determine the worst states for Lyme disease, 24/7 Wall St. reviewed the average annual incidence of Lyme disease between 2016 and 2018 in every state and Washington D.C. from the Centers for Disease Control and Prevention, National Center for Emerging and Zoonotic Infectious Diseases (NCEZID), and Division of Vector-Borne Diseases (DVBD). The 14 states and D.C. are those that reported a “high incidence” of Lyme disease, defined by the CDC as an average incidence of at least 10 confirmed cases per 100,000 persons for the previous three reporting years. We also reviewed annual total cases, which includes confirmed as well as probable cases, for each year between 2009 and 2018 in every state.
The percentage of adults who are physically active came from County Health Rankings & Roadmaps, a Robert Wood Johnson Foundation and the University of Wisconsin Population Health Institute joint program. The percentage of state residents who do not have health insurance (uninsured rate) are from the U.S. Census Bureau’s 2018 American Community Survey.
It’s Your Money, Your Future—Own It (sponsor)
Are you ahead, or behind on retirement? For families with more than $500,000 saved for retirement, finding a financial advisor who puts your interest first can be the difference, and today it’s easier than ever. SmartAsset’s free tool matches you with up to three fiduciary financial advisors who serve your area in minutes. Each advisor has been carefully vetted and must act in your best interests. Start your search now.
If you’ve saved and built a substantial nest egg for you and your family, don’t delay; get started right here and help your retirement dreams become a retirement reality.
Thank you for reading! Have some feedback for us?
Contact the 24/7 Wall St. editorial team.

