
The surge of COVID-19 in the United States continues to accelerate. More than 50,000 new daily cases have been reported each day nationwide for the past week, more than double the daily figures from the same period in June. States across the country have paused reopening plans and some have even implemented new restrictions.
The rise in cases has been particularly sharp in states in the South and Southwest. On Sunday, July 12, Florida reported over 15,000 new cases, surpassing the previous record set by New York state in early April.
While new cases of the virus are spiking dramatically nationwide, in some metropolitan areas, the average daily increase dwarfs that of the U.S. as a whole, adjusting for population.
Using data from state and local health departments, 24/7 Wall St. compiled and reviewed the average number of new daily confirmed COVID-19 cases for the week ending July 13 and compared it to the average of new daily cases from the previous week to determine the cities where the virus is growing the fastest. For comparison purposes, we adjusted the number of confirmed cases per 100,000 people. We excluded metropolitan areas where fewer than 20 new cases were reported in the past 14 days.
Nationwide, the average number of new daily cases climbed by 2.9 per 100,000 people week over week, from 14.2 average daily new cases per 100,000 residents to 17.0. Average daily cases in these 34 metro areas climbed by at least 10 cases per 100,000 residents and by as many as 26.1.
Surges in COVID-19 cases among the metro areas on this list are driving up overall infection rates in their respective states. For example, more than half of the 33 cities on this list are located in either Florida, Texas, or Louisiana. It is no coincidence that all three states rank among the states where the virus is currently spreading the fastest. Here is a complete list of the states where the virus is spreading the fastest right now.
Click here to see the cities where COVID-19 is growing the fastest

34. Albany, GA
> Change in daily avg. new COVID-19 cases week over week: +10.0 per 100,000 people
> Avg. new daily cases in 7 days ending July 13: 21 per 100,000
> Avg. new daily cases in 7 days ending July 6: 11 per 100,000
> Cumulative confirmed COVID-19 cases as of July 13: 2,137 per 100,000 people (total: 3,203)
> COVID-19 related deaths as of July 13: 228
> Population: 151,158
> Avg. new daily cases in Georgia in 7 days ending July 13: 26 per 100,000 (8th most)
[in-text-ad]

33. Dallas-Fort Worth-Arlington, TX
> Change in daily avg. new COVID-19 cases week over week: +10.1 per 100,000 people
> Avg. new daily cases in 7 days ending July 13: 28 per 100,000
> Avg. new daily cases in 7 days ending July 6: 18 per 100,000
> Cumulative confirmed COVID-19 cases as of July 13: 914 per 100,000 people (total: 65,705)
> COVID-19 related deaths as of July 13: 878
> Population: 7,540,371
> Avg. new daily cases in Texas in 7 days ending July 13: 28 per 100,000 (5th most)

32. Modesto, CA
> Change in daily avg. new COVID-19 cases week over week: +10.2 per 100,000 people
> Avg. new daily cases in 7 days ending July 13: 37 per 100,000
> Avg. new daily cases in 7 days ending July 6: 27 per 100,000
> Cumulative confirmed COVID-19 cases as of July 13: 960 per 100,000 people (total: 5,177)
> COVID-19 related deaths as of July 13: 51
> Population: 549,815
> Avg. new daily cases in California in 7 days ending July 13: 5 per 100,000 (10th fewest)

31. Hilton Head Island-Bluffton, SC
> Change in daily avg. new COVID-19 cases week over week: +10.4 per 100,000 people
> Avg. new daily cases in 7 days ending July 13: 37 per 100,000
> Avg. new daily cases in 7 days ending July 6: 26 per 100,000
> Cumulative confirmed COVID-19 cases as of July 13: 1,088 per 100,000 people (total: 2,290)
> COVID-19 related deaths as of July 13: 26
> Population: 217,686
> Avg. new daily cases in South Carolina in 7 days ending July 13: 45 per 100,000 (2nd most)
[in-text-ad-2]
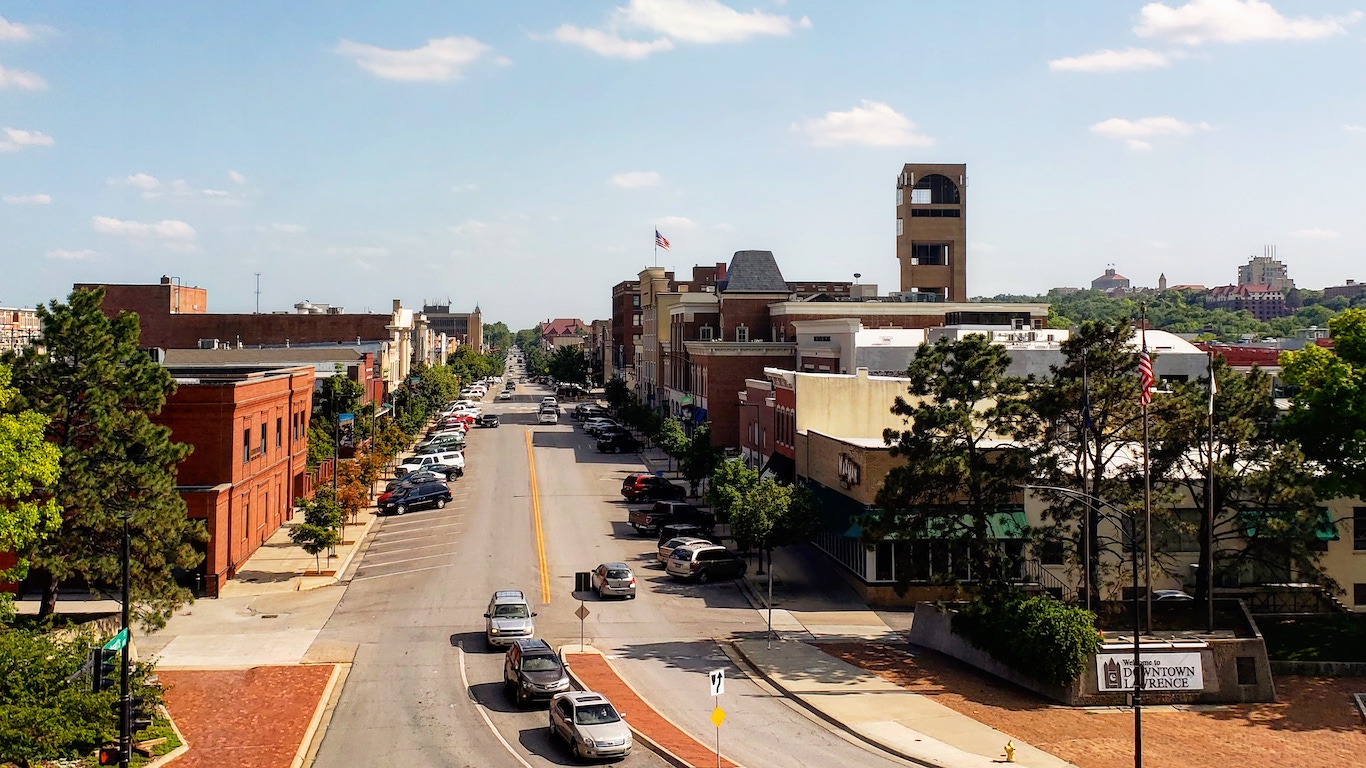
30. Lawrence, KS
> Change in daily avg. new COVID-19 cases week over week: +10.6 per 100,000 people
> Avg. new daily cases in 7 days ending July 13: 22 per 100,000
> Avg. new daily cases in 7 days ending July 6: 12 per 100,000
> Cumulative confirmed COVID-19 cases as of July 13: 380 per 100,000 people (total: 454)
> COVID-19 related deaths as of July 13: 0
> Population: 121,436
> Avg. new daily cases in Kansas in 7 days ending July 13: 6 per 100,000 (13th fewest)

29. Panama City, FL
> Change in daily avg. new COVID-19 cases week over week: +11.0 per 100,000 people
> Avg. new daily cases in 7 days ending July 13: 35 per 100,000
> Avg. new daily cases in 7 days ending July 6: 24 per 100,000
> Cumulative confirmed COVID-19 cases as of July 13: 724 per 100,000 people (total: 1,322)
> COVID-19 related deaths as of July 13: 8
> Population: 202,977
> Avg. new daily cases in Florida in 7 days ending July 13: 45 per 100,000 (2nd most)
[in-text-ad]

28. Alexandria, LA
> Change in daily avg. new COVID-19 cases week over week: +11.1 per 100,000 people
> Avg. new daily cases in 7 days ending July 13: 29 per 100,000
> Avg. new daily cases in 7 days ending July 6: 18 per 100,000
> Cumulative confirmed COVID-19 cases as of July 13: 1,398 per 100,000 people (total: 2,152)
> COVID-19 related deaths as of July 13: 81
> Population: 153,044
> Avg. new daily cases in Louisiana in 7 days ending July 13: 36 per 100,000 (3rd most)

27. Baton Rouge, LA
> Change in daily avg. new COVID-19 cases week over week: +11.5 per 100,000 people
> Avg. new daily cases in 7 days ending July 13: 35 per 100,000
> Avg. new daily cases in 7 days ending July 6: 24 per 100,000
> Cumulative confirmed COVID-19 cases as of July 13: 1,559 per 100,000 people (total: 13,291)
> COVID-19 related deaths as of July 13: 549
> Population: 831,310
> Avg. new daily cases in Louisiana in 7 days ending July 13: 36 per 100,000 (3rd most)

26. Huntsville, AL
> Change in daily avg. new COVID-19 cases week over week: +11.7 per 100,000 people
> Avg. new daily cases in 7 days ending July 13: 28 per 100,000
> Avg. new daily cases in 7 days ending July 6: 16 per 100,000
> Cumulative confirmed COVID-19 cases as of July 13: 710 per 100,000 people (total: 3,200)
> COVID-19 related deaths as of July 13: 12
> Population: 462,693
> Avg. new daily cases in Alabama in 7 days ending July 13: 7 per 100,000 (21st fewest)
[in-text-ad-2]

25. Wenatchee, WA
> Change in daily avg. new COVID-19 cases week over week: +11.9 per 100,000 people
> Avg. new daily cases in 7 days ending July 13: 25 per 100,000
> Avg. new daily cases in 7 days ending July 6: 13 per 100,000
> Cumulative confirmed COVID-19 cases as of July 13: 797 per 100,000 people (total: 933)
> COVID-19 related deaths as of July 13: 10
> Population: 119,943
> Avg. new daily cases in Washington in 7 days ending July 13: 16 per 100,000 (15th most)
24. Longview, TX
> Change in daily avg. new COVID-19 cases week over week: +12.0 per 100,000 people
> Avg. new daily cases in 7 days ending July 13: 19 per 100,000
> Avg. new daily cases in 7 days ending July 6: 7 per 100,000
> Cumulative confirmed COVID-19 cases as of July 13: 546 per 100,000 people (total: 1,554)
> COVID-19 related deaths as of July 13: 47
> Population: 219,417
> Avg. new daily cases in Texas in 7 days ending July 13: 19 per 100,000 (14th most)
[in-text-ad]

23. Kennewick-Richland, WA
> Change in daily avg. new COVID-19 cases week over week: +12.1 per 100,000 people
> Avg. new daily cases in 7 days ending July 13: 40 per 100,000
> Avg. new daily cases in 7 days ending July 6: 28 per 100,000
> Cumulative confirmed COVID-19 cases as of July 13: 1,663 per 100,000 people (total: 4,738)
> COVID-19 related deaths as of July 13: 130
> Population: 296,224
> Avg. new daily cases in Washington in 7 days ending July 13: 25 per 100,000 (9th most)

22. Phoenix-Mesa-Chandler, AZ
> Change in daily avg. new COVID-19 cases week over week: +12.1 per 100,000 people
> Avg. new daily cases in 7 days ending July 13: 63 per 100,000
> Avg. new daily cases in 7 days ending July 6: 50 per 100,000
> Cumulative confirmed COVID-19 cases as of July 13: 1,858 per 100,000 people (total: 86,843)
> COVID-19 related deaths as of July 13: 1,228
> Population: 4,857,962
> Avg. new daily cases in Arizona in 7 days ending July 13: 6 per 100,000 (13th fewest)

21. The Villages, FL
> Change in daily avg. new COVID-19 cases week over week: +12.6 per 100,000 people
> Avg. new daily cases in 7 days ending July 13: 22 per 100,000
> Avg. new daily cases in 7 days ending July 6: 10 per 100,000
> Cumulative confirmed COVID-19 cases as of July 13: 561 per 100,000 people (total: 679)
> COVID-19 related deaths as of July 13: 18
> Population: 128,754
> Avg. new daily cases in Florida in 7 days ending July 13: 51 per 100,000 (the most)
[in-text-ad-2]

20. Macon-Bibb County, GA
> Change in daily avg. new COVID-19 cases week over week: +12.9 per 100,000 people
> Avg. new daily cases in 7 days ending July 13: 40 per 100,000
> Avg. new daily cases in 7 days ending July 6: 27 per 100,000
> Cumulative confirmed COVID-19 cases as of July 13: 953 per 100,000 people (total: 2,188)
> COVID-19 related deaths as of July 13: 63
> Population: 226,680
> Avg. new daily cases in Georgia in 7 days ending July 13: 11 per 100,000 (21st most)

19. El Paso, TX
> Change in daily avg. new COVID-19 cases week over week: +13.6 per 100,000 people
> Avg. new daily cases in 7 days ending July 13: 37 per 100,000
> Avg. new daily cases in 7 days ending July 6: 23 per 100,000
> Cumulative confirmed COVID-19 cases as of July 13: 1,160 per 100,000 people (total: 9,716)
> COVID-19 related deaths as of July 13: 152
> Population: 844,723
> Avg. new daily cases in Texas in 7 days ending July 13: 6 per 100,000 (13th fewest)
[in-text-ad]

18. Madera, CA
> Change in daily avg. new COVID-19 cases week over week: +14.3 per 100,000 people
> Avg. new daily cases in 7 days ending July 13: 30 per 100,000
> Avg. new daily cases in 7 days ending July 6: 15 per 100,000
> Cumulative confirmed COVID-19 cases as of July 13: 661 per 100,000 people (total: 1,025)
> COVID-19 related deaths as of July 13: 8
> Population: 157,672
> Avg. new daily cases in California in 7 days ending July 13: 2 per 100,000 (2nd fewest)

17. Boise City, ID
> Change in daily avg. new COVID-19 cases week over week: +14.6 per 100,000 people
> Avg. new daily cases in 7 days ending July 13: 41 per 100,000
> Avg. new daily cases in 7 days ending July 6: 26 per 100,000
> Cumulative confirmed COVID-19 cases as of July 13: 925 per 100,000 people (total: 6,419)
> COVID-19 related deaths as of July 13: 36
> Population: 732,257
> Avg. new daily cases in Idaho in 7 days ending July 13: 23 per 100,000 (11th most)

16. Dalton, GA
> Change in daily avg. new COVID-19 cases week over week: +15.1 per 100,000 people
> Avg. new daily cases in 7 days ending July 13: 49 per 100,000
> Avg. new daily cases in 7 days ending July 6: 34 per 100,000
> Cumulative confirmed COVID-19 cases as of July 13: 1,498 per 100,000 people (total: 2,148)
> COVID-19 related deaths as of July 13: 17
> Population: 143,983
> Avg. new daily cases in Georgia in 7 days ending July 13: 26 per 100,000 (8th most)
[in-text-ad-2]

15. Beaumont-Port Arthur, TX
> Change in daily avg. new COVID-19 cases week over week: +15.7 per 100,000 people
> Avg. new daily cases in 7 days ending July 13: 48 per 100,000
> Avg. new daily cases in 7 days ending July 6: 32 per 100,000
> Cumulative confirmed COVID-19 cases as of July 13: 1,125 per 100,000 people (total: 4,450)
> COVID-19 related deaths as of July 13: 49
> Population: 410,233
> Avg. new daily cases in Texas in 7 days ending July 13: 28 per 100,000 (5th most)

14. Tyler, TX
> Change in daily avg. new COVID-19 cases week over week: +16.1 per 100,000 people
> Avg. new daily cases in 7 days ending July 13: 31 per 100,000
> Avg. new daily cases in 7 days ending July 6: 15 per 100,000
> Cumulative confirmed COVID-19 cases as of July 13: 577 per 100,000 people (total: 1,299)
> COVID-19 related deaths as of July 13: 7
> Population: 230,221
> Avg. new daily cases in Texas in 7 days ending July 13: 28 per 100,000 (5th most)
[in-text-ad]
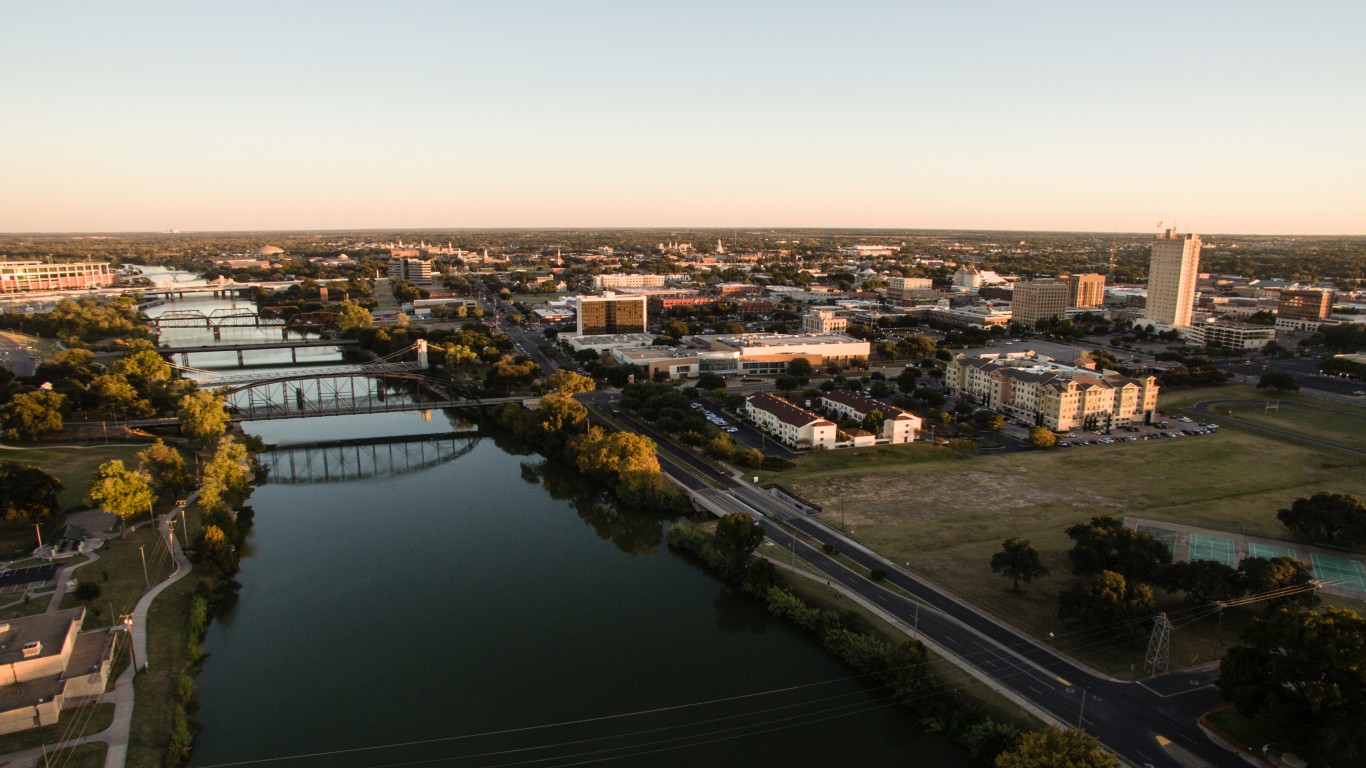
13. Waco, TX
> Change in daily avg. new COVID-19 cases week over week: +16.6 per 100,000 people
> Avg. new daily cases in 7 days ending July 13: 56 per 100,000
> Avg. new daily cases in 7 days ending July 6: 39 per 100,000
> Cumulative confirmed COVID-19 cases as of July 13: 983 per 100,000 people (total: 2,613)
> COVID-19 related deaths as of July 13: 17
> Population: 270,566
> Avg. new daily cases in Texas in 7 days ending July 13: 11 per 100,000 (21st most)

12. San Angelo, TX
> Change in daily avg. new COVID-19 cases week over week: +16.7 per 100,000 people
> Avg. new daily cases in 7 days ending July 13: 33 per 100,000
> Avg. new daily cases in 7 days ending July 6: 17 per 100,000
> Cumulative confirmed COVID-19 cases as of July 13: 642 per 100,000 people (total: 754)
> COVID-19 related deaths as of July 13: 1
> Population: 119,310
> Avg. new daily cases in Texas in 7 days ending July 13: 19 per 100,000 (14th most)

11. Lafayette, LA
> Change in daily avg. new COVID-19 cases week over week: +16.9 per 100,000 people
> Avg. new daily cases in 7 days ending July 13: 57 per 100,000
> Avg. new daily cases in 7 days ending July 6: 40 per 100,000
> Cumulative confirmed COVID-19 cases as of July 13: 1,703 per 100,000 people (total: 8,326)
> COVID-19 related deaths as of July 13: 184
> Population: 489,364
> Avg. new daily cases in Louisiana in 7 days ending July 13: 36 per 100,000 (3rd most)
[in-text-ad-2]

10. Dubuque, IA
> Change in daily avg. new COVID-19 cases week over week: +17.7 per 100,000 people
> Avg. new daily cases in 7 days ending July 13: 37 per 100,000
> Avg. new daily cases in 7 days ending July 6: 19 per 100,000
> Cumulative confirmed COVID-19 cases as of July 13: 1,018 per 100,000 people (total: 985)
> COVID-19 related deaths as of July 13: 23
> Population: 96,854
> Avg. new daily cases in Iowa in 7 days ending July 13: 9 per 100,000 (24th most)
9. Houma-Thibodaux, LA
> Change in daily avg. new COVID-19 cases week over week: +18.2 per 100,000 people
> Avg. new daily cases in 7 days ending July 13: 43 per 100,000
> Avg. new daily cases in 7 days ending July 6: 25 per 100,000
> Cumulative confirmed COVID-19 cases as of July 13: 1,587 per 100,000 people (total: 3,346)
> COVID-19 related deaths as of July 13: 158
> Population: 209,136
> Avg. new daily cases in Louisiana in 7 days ending July 13: 6 per 100,000 (15th fewest)
[in-text-ad]

8. Hammond, LA
> Change in daily avg. new COVID-19 cases week over week: +18.2 per 100,000 people
> Avg. new daily cases in 7 days ending July 13: 40 per 100,000
> Avg. new daily cases in 7 days ending July 6: 21 per 100,000
> Cumulative confirmed COVID-19 cases as of July 13: 1,467 per 100,000 people (total: 1,914)
> COVID-19 related deaths as of July 13: 44
> Population: 133,777
> Avg. new daily cases in Louisiana in 7 days ending July 13: 6 per 100,000 (13th fewest)

7. Morgantown, WV
> Change in daily avg. new COVID-19 cases week over week: +18.4 per 100,000 people
> Avg. new daily cases in 7 days ending July 13: 25 per 100,000
> Avg. new daily cases in 7 days ending July 6: 6 per 100,000
> Cumulative confirmed COVID-19 cases as of July 13: 461 per 100,000 people (total: 641)
> COVID-19 related deaths as of July 13: 7
> Population: 140,259
> Avg. new daily cases in West Virginia in 7 days ending July 13: 9 per 100,000 (25th most)

6. Lake Charles, LA
> Change in daily avg. new COVID-19 cases week over week: +18.5 per 100,000 people
> Avg. new daily cases in 7 days ending July 13: 73 per 100,000
> Avg. new daily cases in 7 days ending July 6: 54 per 100,000
> Cumulative confirmed COVID-19 cases as of July 13: 1,611 per 100,000 people (total: 3,336)
> COVID-19 related deaths as of July 13: 71
> Population: 209,548
> Avg. new daily cases in Louisiana in 7 days ending July 13: 45 per 100,000 (2nd most)
[in-text-ad-2]

5. Miami-Fort Lauderdale-Pompano Beach, FL
> Change in daily avg. new COVID-19 cases week over week: +19.4 per 100,000 people
> Avg. new daily cases in 7 days ending July 13: 67 per 100,000
> Avg. new daily cases in 7 days ending July 6: 48 per 100,000
> Cumulative confirmed COVID-19 cases as of July 13: 1,993 per 100,000 people (total: 121,003)
> COVID-19 related deaths as of July 13: 2,218
> Population: 6,198,782
> Avg. new daily cases in Florida in 7 days ending July 13: 5 per 100,000 (10th fewest)

4. Corpus Christi, TX
> Change in daily avg. new COVID-19 cases week over week: +20.1 per 100,000 people
> Avg. new daily cases in 7 days ending July 13: 79 per 100,000
> Avg. new daily cases in 7 days ending July 6: 59 per 100,000
> Cumulative confirmed COVID-19 cases as of July 13: 1,517 per 100,000 people (total: 6,484)
> COVID-19 related deaths as of July 13: 54
> Population: 452,927
> Avg. new daily cases in Texas in 7 days ending July 13: 28 per 100,000 (5th most)
[in-text-ad]

3. Odessa, TX
> Change in daily avg. new COVID-19 cases week over week: +21.6 per 100,000 people
> Avg. new daily cases in 7 days ending July 13: 41 per 100,000
> Avg. new daily cases in 7 days ending July 6: 19 per 100,000
> Cumulative confirmed COVID-19 cases as of July 13: 780 per 100,000 people (total: 1,235)
> COVID-19 related deaths as of July 13: 14
> Population: 162,124
> Avg. new daily cases in Texas in 7 days ending July 13: 14 per 100,000 (17th most)
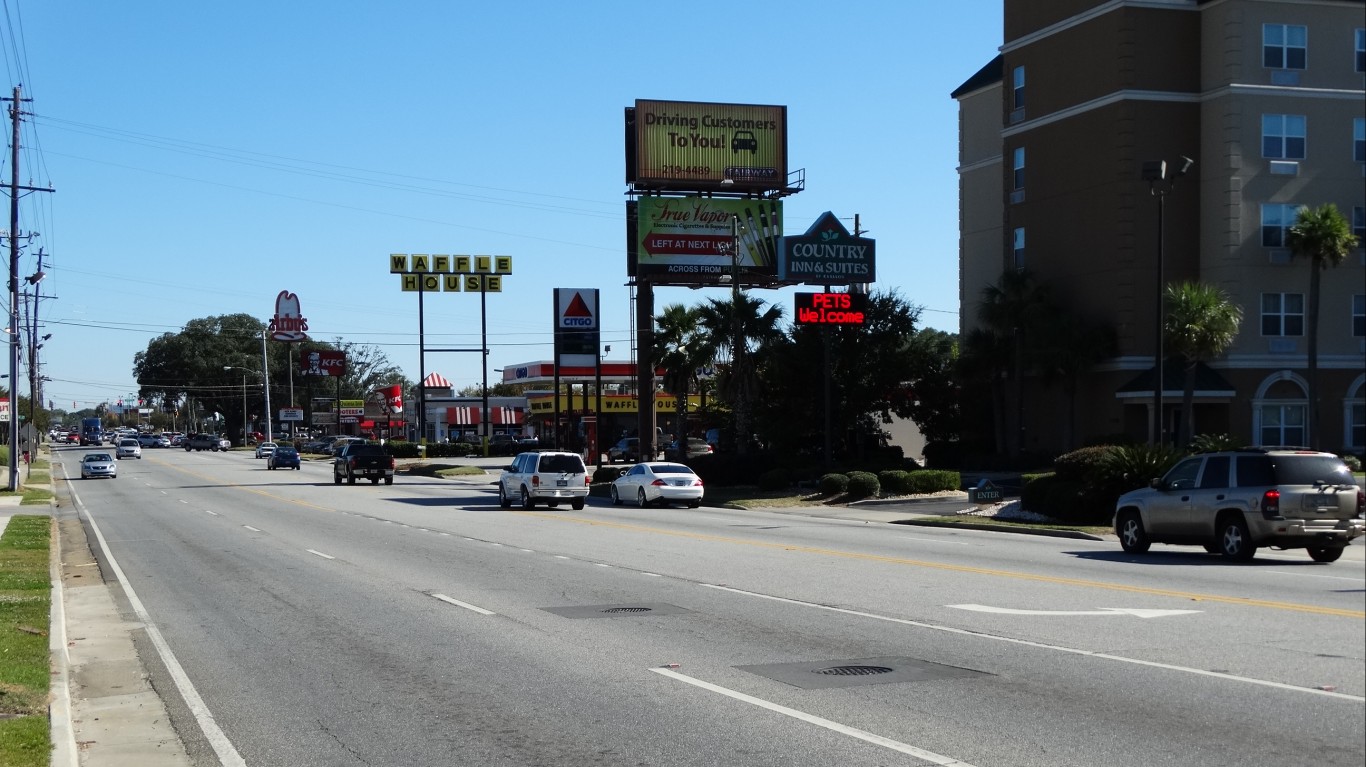
2. Valdosta, GA
> Change in daily avg. new COVID-19 cases week over week: +24.5 per 100,000 people
> Avg. new daily cases in 7 days ending July 13: 54 per 100,000
> Avg. new daily cases in 7 days ending July 6: 29 per 100,000
> Cumulative confirmed COVID-19 cases as of July 13: 1,733 per 100,000 people (total: 2,506)
> COVID-19 related deaths as of July 13: 32
> Population: 145,577
> Avg. new daily cases in Georgia in 7 days ending July 13: 19 per 100,000 (14th most)

1. Victoria, TX
> Change in daily avg. new COVID-19 cases week over week: +26.1 per 100,000 people
> Avg. new daily cases in 7 days ending July 13: 91 per 100,000
> Avg. new daily cases in 7 days ending July 6: 65 per 100,000
> Cumulative confirmed COVID-19 cases as of July 13: 1,640 per 100,000 people (total: 1,632)
> COVID-19 related deaths as of July 13: 10
> Population: 99,047
> Avg. new daily cases in Texas in 7 days ending July 13: 9 per 100,000 (25th most)
Take Charge of Your Retirement In Just A Few Minutes (Sponsor)
Retirement planning doesn’t have to feel overwhelming. The key is finding expert guidance—and SmartAsset’s simple quiz makes it easier than ever for you to connect with a vetted financial advisor.
Here’s how it works:
- Answer a Few Simple Questions. Tell us a bit about your goals and preferences—it only takes a few minutes!
- Get Matched with Vetted Advisors Our smart tool matches you with up to three pre-screened, vetted advisors who serve your area and are held to a fiduciary standard to act in your best interests. Click here to begin
- Choose Your Fit Review their profiles, schedule an introductory call (or meet in person), and select the advisor who feel is right for you.
Why wait? Start building the retirement you’ve always dreamed of. Click here to get started today!
Thank you for reading! Have some feedback for us?
Contact the 24/7 Wall St. editorial team.
 24/7 Wall St.

 24/7 Wall St.