Special Report
How COVID-19 Has Disproportionately Affected Minority Communities In Every State
Published:
Last Updated:

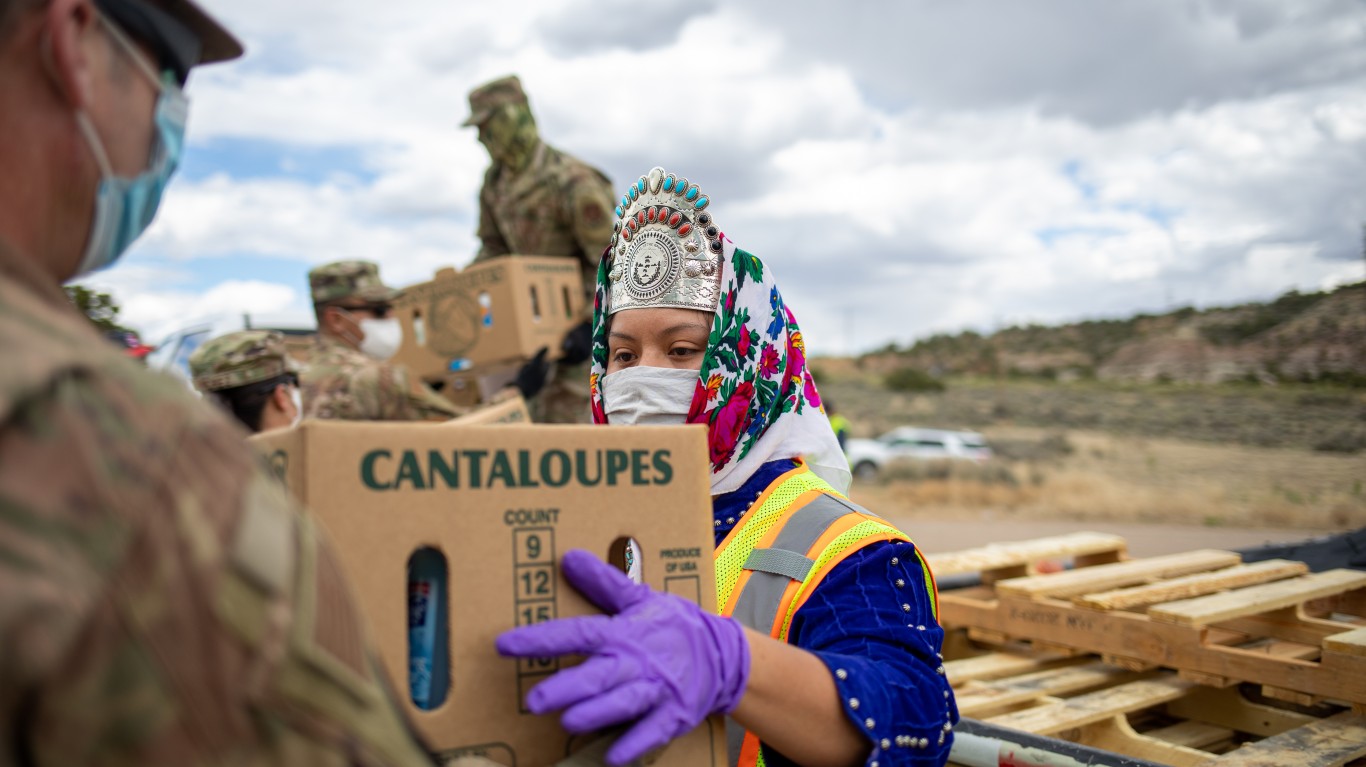
The coronavirus pandemic has had devastating economic and health consequences in the United States. Due to persistent racial differences in wealth, poverty, employment, housing, health status, access to health care, and other factors, Black and other non-white communities have faced significantly worse economic and health effects related to the coronavirus than white communities.
On average across the United States, white people, Hispanic or Latino people, and Black people comprise 61.1%, 17.8%, and 12.3% of the population. According to the Centers for Disease Control and Prevention (CDC) weekly COVID-19 data release, white people have accounted for 52.7%, Hispanic or Latinos 17.2%, and Black or African Americans 22.3% of COVID-19 deaths in the United States.
Data on the race of COVID-19 victims shows that non-white populations have died at disporortionately higher rates than white populations in nearly every state.
Out of the 47 states that report the race of COVID-19 victims, the most disproportionately high COVID-19 mortality rate was born by Black or African Americans in 35 states, American Indian and Alaska Native (AIAN) residents in five states, Asian Americans in four states, white residents in two states, and Native Hawaiian and Pacific Islanders (NHPI) in one state.
The relatively outsized impacts of the virus on communities of color can also be seen within states. The counties with the highest COVID-19 mortality rates consistently have disproportionately larger non-white populations. Black and Hispanic residents comprise a larger-than-average share of the population in 33 and 14 of the 50 counties where the most COVID-19 deaths have been reported per 100,000 residents.
These lopsided outcomes are largely due to the higher likelihoods that racial minority populations will fall into groups considered at risk of serious COVID-19 cases. For example, incarcerated populations, essential workers, people with disabilities, and people with underlying chronic health conditions comprise relatively larger shares of people of color compared to white Americans. For a comparison of economic and social disparities between white and Black in U.S. metropolitan areas, here are the worst cities for Black Americans.
To highlight the disproportionate impacts of the pandemic on Americans, 24/7 Wall St. reviewed COVID-19 statistics for every state’s white, Black or African American, Asian, Hispanic or Latino, American Indian and Alaska Native, and Native Hawaiian and other Pacific Islander populations. We also considered the size of these racial groups and the overall COVID-19 mortality rate for counties within every state.
Click here to see how COVID-19 has disproportionately affected minority communities in every state.
Click here to see our methodology.
1. Alabama
> Community w/ highest death-to-pop. ratio: Black or African American (26.4% of pop.)
> Black share of COVID-19 infections: 49.1%
> Black share of COVID-19 deaths: 46.7%
> County with most COVID-19 deaths: Lowndes County (215 per 100,000 county residents)
> Lowndes County population: White (24.5%); Black (74.1%); AIAN (0.1%); Asian (0.0%); NHPI (0.0%); Hispanic (0.7%)
There are six counties in Alabama that have reported more than 100 COVID-19 related deaths for every 100,000 people, and each of the six has a higher concentration of Black residents than the state as a whole. In Lowndes County in the Montgomery metropolitan area, which reported a state-leading 215 coronavirus deaths for every 100,000 people, nearly 75% of the population is Black, almost triple the 26.4% share of state residents who are Black.
Across the country, Black workers are more likely to be exposed to the coronavirus than white workers. Though Black Americans make up 12.3% of the population, about 17% of front line workers are Black. Such jobs, including those in health care and public transit, put workers at increased risk of contracting COVID-19.
[in-text-ad]

2. Alaska
> Community w/ highest death-to-pop. ratio: Native Hawaiian and Other Pacific Islander (1.2% of pop.)
> NHPI share of COVID-19 infections: 4.1%
> NHPI share of COVID-19 deaths: 5.9%
> County with most COVID-19 deaths: Petersburg Borough (31 per 100,000 county residents)
> Petersburg Borough population: White (63.0%); Black (0.7%); AIAN (6.8%); Asian (9.2%); NHPI (0.5%); Hispanic (10.4%)
A geographically isolated state, Alaska has been largely spared from the worst effects of the COVID-19 pandemic. As of July 13, there have been only 209 cases of the coronavirus and 2.3 related deaths for every 100,000 people in the state — the fourth and second lowest rates among states, respectively. Alaska also has one of the proportionally smallest Black populations of any state. Just 3.1% of the state population identifies as Black — versus 12.3% share of the population nationwide. About 3.7% of all COVID-19 cases in Alaska have been in Black residents, and the state has not reported any deaths among its Black residents.
While comprising just 1.2% of the state population but 5.9% of deaths, Native Hawaiians and other Pacific Islanders in Alaska have been the most disproportionately affected by COVID-19.

3. Arizona
> Community w/ highest death-to-pop. ratio: American Indian and Alaska Native (3.9% of pop.)
> AIAN share of COVID-19 infections: 13.0%
> AIAN share of COVID-19 deaths: 18.3%
> County with most COVID-19 deaths: Apache County (145 per 100,000 county residents)
> Apache County population: White (18.3%); Black (0.7%); AIAN (73.1%); Asian (0.4%); NHPI (0.0%); Hispanic (6.2%)
COVID-19 infections have surged in Arizona in recent weeks, and the parts of the state that are populated by Native Americans have borne the brunt. In the two counties with the highest death rates in the state — Apache County and Navajo County — 73.1% and 43.3% identify as Native American, respectively. Each of these counties has a high number of cases per capita, more than triple the national caseload of 1,029 for every 100,000 people as of July 13. The number of COVID-19 fatalities in each of these counties is also more than triple the comparable national figure of 39 COVID-19 deaths per 100,000 people. Arizona had 1,727 confirmed cases and 31 deaths per 100,000 state residents as of July 13, the third and 14th highest among states.
In mid-June, the Navajo Nation reinstated lockdowns to slow the coronavirus’s spread through its population, even as Arizona had relaxed many of its COVID-19 restrictions.

4. Arkansas
> Community w/ highest death-to-pop. ratio: Black or African American (15.3% of pop.)
> Black share of COVID-19 infections: 27.7%
> Black share of COVID-19 deaths: 28.0%
> County with most COVID-19 deaths: Lincoln County (80 per 100,000 county residents)
> Lincoln County population: White (64.3%); Black (31.2%); AIAN (0.3%); Asian (0.0%); NHPI (0.0%); Hispanic (3.8%)
Arkansas is seeing a spike in COVID-19, reporting on July 11 more than 1,000 new cases in one day, a new milestone. Pulaski County, home to the state capital of Little Rock, has suffered the most total deaths from COVID-19 of the state’s 75 counties, with 65 through July 13. Blacks make up 15.3% of the state’s total population but account for 27.7% of the state’s COVID-19 cases and 28% of related deaths.
Lincoln County, in the southeastern part of the state, near Pine Bluff, has the highest incidence of COVID-19 deaths per capita, with 80.1 per 100,000 people. The county, where a state prison and a state prison farm are located, has a population that is 31.1% black. The state prison farm (Cummins Unit) reported 11 inmate deaths due to COVID-19 as of July 13, which account for all of the coronavirus deaths in the county.
[in-text-ad-2]

5. California
> Community w/ highest death-to-pop. ratio: Black or African American (5.5% of pop.)
> Black share of COVID-19 infections: 5.2%
> Black share of COVID-19 deaths: 9.1%
> County with most COVID-19 deaths: Imperial County (75 per 100,000 county residents)
> Imperial County population: White (11.0%); Black (2.2%); AIAN (0.6%); Asian (1.3%); NHPI (0.2%); Hispanic (83.8%)
About 39% of California’s population identifies as Hispanic or Latino. However, the same group accounts for about 55% of coronavirus cases and 42% of the deaths. In each of the five counties in the state to report the most COVID-19 deaths per capita — Imperia, Los Angeles, Tulare, Kings, and Riverside counties — the share of the population identifying as Hispanic or Latino far exceeds the statewide share.
These counties have also reported the most COVID-19 cases per capita. Across California, there have been 832 cases of the coronavirus for every 100,000 people. In each of the five counties with the most COVID-19 death per capita, there have been over 1,000 confirmed cases for every 100,000 people. In Imperial County, located near the Mexico border, where about 84% of the population is Hispanic or Latino, there have been a staggering 3,884 infections for every 100,000 people.

6. Colorado
> Community w/ highest death-to-pop. ratio: Black or African American (3.9% of pop.)
> Black share of COVID-19 infections: 6.5%
> Black share of COVID-19 deaths: 7.1%
> County with most COVID-19 deaths: Morgan County (163 per 100,000 county residents)
> Morgan County population: White (58.7%); Black (3.2%); AIAN (0.2%); Asian (0.6%); NHPI (0.1%); Hispanic (35.9%)
Four of the five counties with the most COVID-19 related deaths per capita in Colorado are home to far larger than average shares of minority populations. In Denver County, where there have been 57 coronavirus deaths for every 100,000 people — third highest of counties in the state and well above the 39 COVID-19 deaths for every 100,000 people nationwide — 10.3% of the population identifies as Black, compared to 3.2% of the total population across Colorado. Similarly, in Arapahoe County, which is 9.0% Black, there have been 55 deaths for every 100,000 people.
Meanwhile, in Morgan and Weld counties, 38.9% and 29.2% of residents identify as Hispanic or Latino — far larger shares than the 21.4% of the total Colorado population who do. In these counties, there have been 163 and 47 COVID-19 deaths for every 100,000 people, respectively — nearly 5.5 times the state death rate of 30 deaths per 100,000 people.
[in-text-ad]

7. Connecticut
> Community w/ highest death-to-pop. ratio: Black or African American (9.8% of pop.)
> Black share of COVID-19 infections: 19.0%
> Black share of COVID-19 deaths: 15.2%
> County with most COVID-19 deaths: Hartford County (155 per 100,000 county residents)
> Hartford County population: White (61.9%); Black (12.8%); AIAN (0.2%); Asian (5.2%); NHPI (0.0%); Hispanic (17.6%)
Since the end of April, the numbers of new cases in Connecticut have declined and remained relatively steady in July. Earlier in the pandemic the state was such a hot spot that it still ranks eighth among the 50 states in total number of COVID-19 deaths, even though the state is 29th in total population. Only two states, New Jersey and New York, have a higher rate of COVID-19 deaths per 100,000 residents.
Although Black residents make up 9.8% of Connecticut’s population, the Black population accounts for 15.2% of COVID-19 deaths and 19% of known cases. Hartford County, in the northern part of the state, and Fairfield County, in the southern part of the state, go back and forth as the county with the most deaths. Hartford County’s population is 15.8% Black; Fairfield County’s is 12.9% Black.

8. Delaware
> Community w/ highest death-to-pop. ratio: Black or African American (21.6% of pop.)
> Black share of COVID-19 infections: 29.6%
> Black share of COVID-19 deaths: 27.0%
> County with most COVID-19 deaths: Sussex County (80 per 100,000 county residents)
> Sussex County population: White (75.0%); Black (12.2%); AIAN (0.3%); Asian (1.2%); NHPI (0.0%); Hispanic (9.1%)
Delaware, the sixth least populous state, ranks 33rd in the total number of COVID-19 deaths with 517 as of July 13. When adjusting for population — the number of deaths per 100,000 residents — the state moves up 11th of all states. Like other states in the Northeast, Delaware, which has only three counties, has slowed the fatality rate, with two deaths in the seven days ending July 13.
The coronavirus has had a bigger impact on Delaware’s Black residents relative to their share of the population. Blacks make up 21.6% of the state’s population but account for 27.0% of its COVID-19 deaths and 29.6% of known infections. The disparity is not as wide as it is in some other states, but it is still significant. In the early weeks of the pandemic, more than half of the laboratories did not ask the race or ethnicity of people who were tested. As it became clear that people of color across the country were disproportionately impacted by the pandemic, Gov. John Carney mandated that data on race and ethnicity be collected.
9. Florida
> Community w/ highest death-to-pop. ratio: Black or African American (15.4% of pop.)
> Black share of COVID-19 infections: 23.4%
> Black share of COVID-19 deaths: 21.8%
> County with most COVID-19 deaths: Hendry County (72 per 100,000 county residents)
> Hendry County population: White (32.7%); Black (11.0%); AIAN (1.4%); Asian (0.8%); NHPI (0.0%); Hispanic (52.9%)
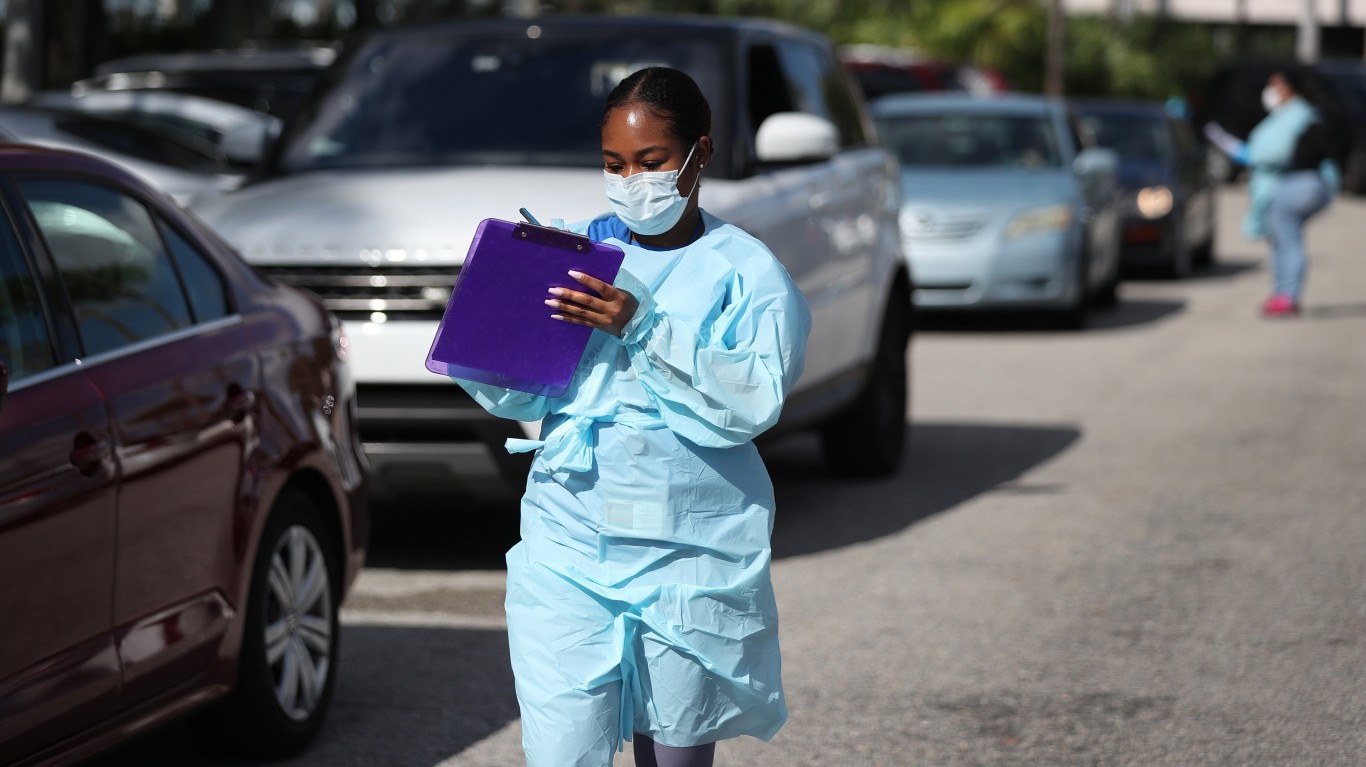
The current epicenter of the pandemic in the U.S., Florida was forced to close its Emergency Operations Center in Tallahassee on July 16 after 12 workers tested positive for COVID-19. Blacks represent 15.4% of the state’s population but make up 21.8% of known coronavirus deaths and 23.4% of cases. Latino residents make up 25.2% of Florida’s population but have 42.3% of the positive COVID-19 tests and 27.8% of the coronavirus deaths.
Of the state’s 67 counties, Hendry, in southern Florida, has been hit the hardest with a death rate of 72.3 per 100,000 residents. According to Florida Politics, the part of Hendry County most affected is an unincorporated area known as Immokalee. In 2019, the U.S. Census Bureau estimated that Immokalee was 72.1% Hispanic (of any race), 21.7% Black and 4.8% non-Hispanic white.
[in-text-ad-2]
10. Georgia
> Community w/ highest death-to-pop. ratio: Black or African American (31.0% of pop.)
> Black share of COVID-19 infections: 39.9%
> Black share of COVID-19 deaths: 46.7%
> County with most COVID-19 deaths: Hancock County (387 per 100,000 county residents)
> Hancock County population: White (24.2%); Black (72.3%); AIAN (0.0%); Asian (0.9%); NHPI (0.2%); Hispanic (1.9%)
Though Black Americans account for just 31% of Georgia’s population, the Black population accounts for nearly 47% of all COVID-19 deaths in the state. Georgia is home to the four counties with the highest concentration of coronavirus deaths in the United States — Hancock, Randolph, Terrell, and Early counties. In these areas, deaths range from 300 to 387 for every 100,000 people — compared to the state and nationwide case fatality rates of 29 and 39 deaths per 100,000 people. Each of these counties has majority Black populations.
The economic and public health toll of the coronavirus is disproportionately affecting lower-income households. Across Georgia, the typical Black household earns $42,085 a year, much lower than the income of a typical white household of $63,543. In each of the four majority Black counties with the highest COVID-19 death toll, the income disparity along racial lines is even more pronounced.
11. Hawaii
> Community w/ highest death-to-pop. ratio: No racial data available
> Share of COVID-19 infections: Data not available
> Share of COVID-19 deaths: Data not available
> County with most COVID-19 deaths: Maui County (4 per 100,000 county residents)
> Maui County population: White (30.4%); Black (0.5%); AIAN (0.1%); Asian (28.7%); NHPI (10.4%); Hispanic (11.2%)
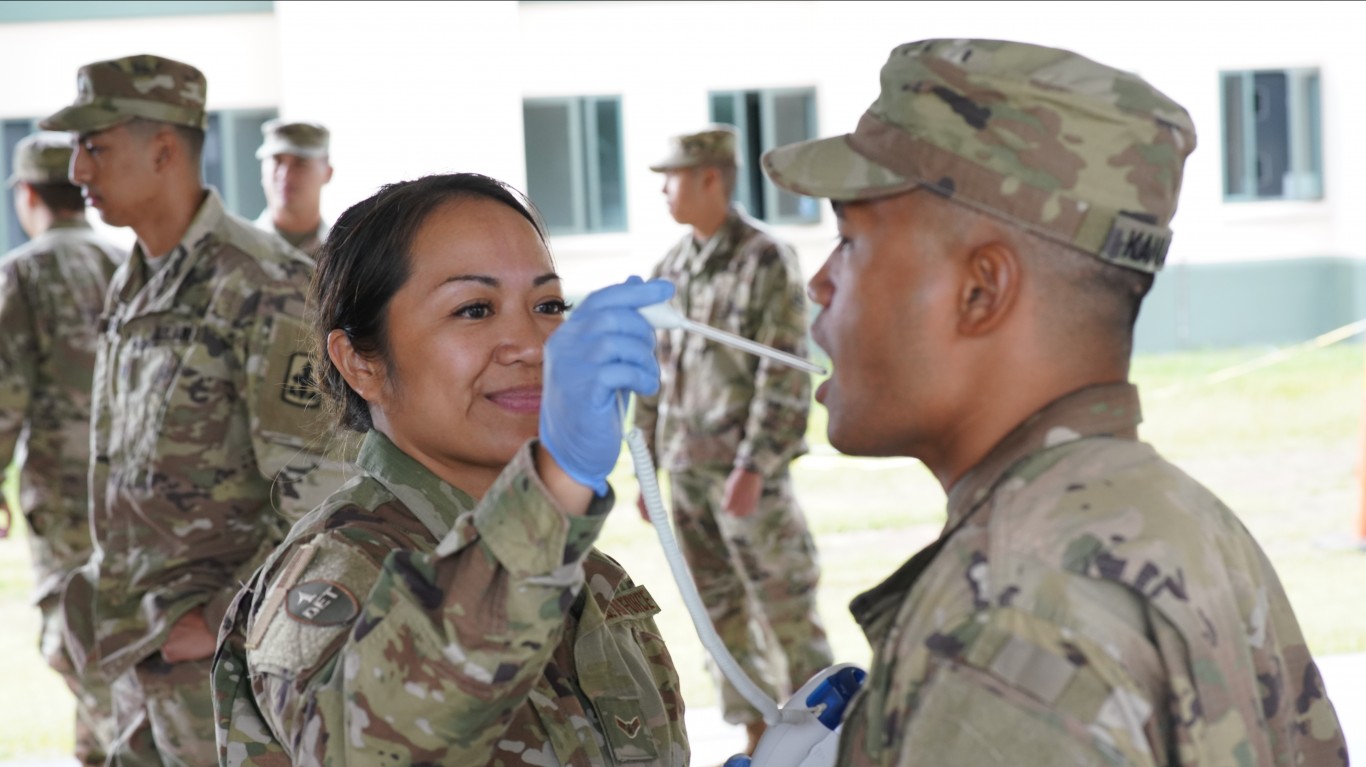
A geographically isolated state, Hawaii has been largely spared the worst effects of the COVID-19 pandemic. As of July 13, there have been only 86 cases and 1 coronavirus related death for every 100,000 people — each the lowest rate among states. Hawaii has one of the proportionally smallest Black populations of any state. Just 1.7% of the state population identifies as Black, compared to the 12.3% share of the population nationwide. Unlike nearly every other state, the coronavirus is less likely to affect Black Americans in Hawaii. Black residents account for only 1.1% of infections in the state.
Native Hawaiians are likely facing one of the most disproportionate burdens from the state’s outbreak. While race is not included in COVID-19 fatality reporting, Native Hawaiians, who make up 9.3% of state residents, have accounted for approximately 38% of positive COVID-19 cases.
[in-text-ad]
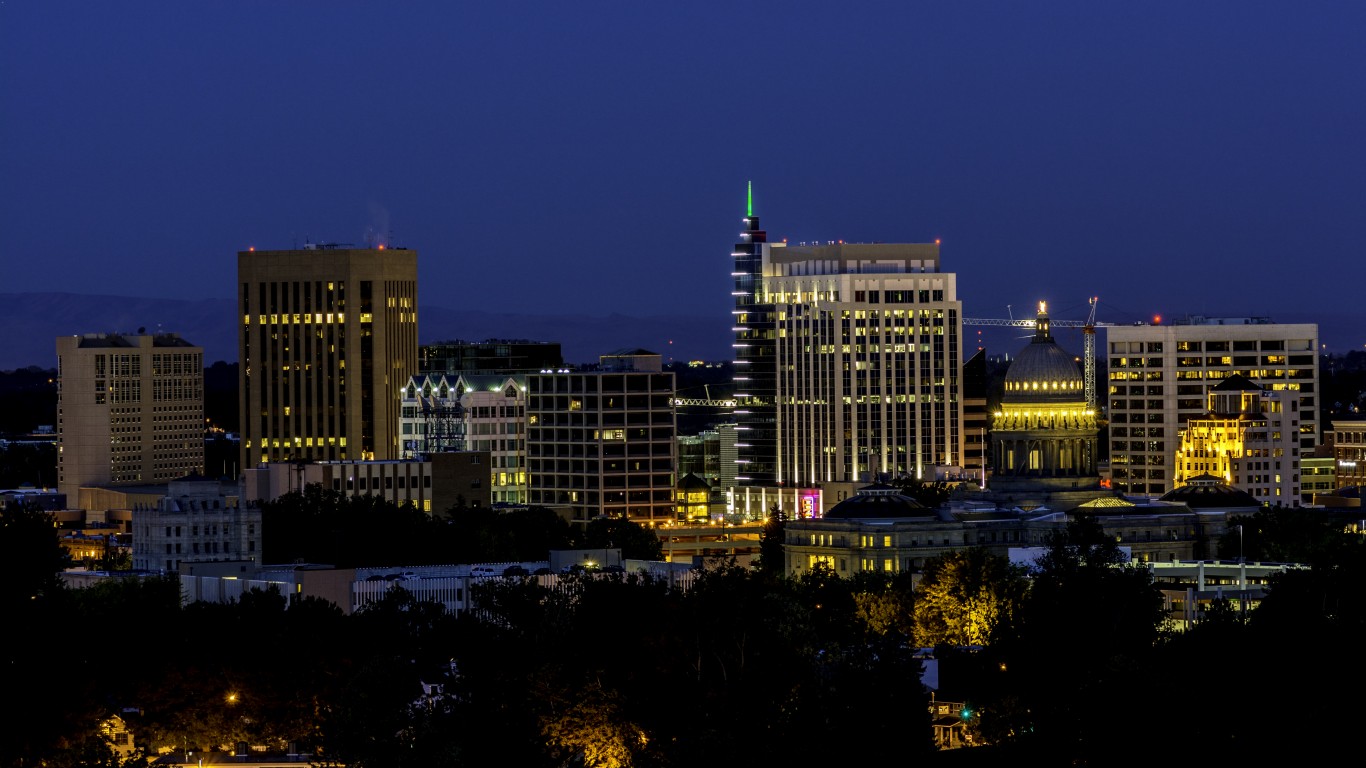
12. Idaho
> Community w/ highest death-to-pop. ratio: Asian (1.4% of pop.)
> Asian share of COVID-19 infections: 1.7%
> Asian share of COVID-19 deaths: 2.0%
> County with most COVID-19 deaths: Nez Perce County (47 per 100,000 county residents)
> Nez Perce County population: White (87.0%); Black (0.2%); AIAN (5.7%); Asian (0.8%); NHPI (0.1%); Hispanic (3.9%)
As of July 13, there have been about six coronavirus deaths for every 100,000 people in Idaho. Across the state, there are eight counties where the concentration of COVID-19 deaths exceeds the state average — and each of them is home to larger than average shares of Native American or Hispanic or Latino populations. In Nez Perce County, where a state-leading 47 deaths per 100,000 people has been reported, 5.7% of the population identifies as Native American, about five times the statewide concentration. Several cases have been reported on the Nez Perce Reservation, and many of the deaths reported were in a single nursing home in Lewiston, the largest city in the county.
On the state level, the Asian community bears the largest burden of COVID-19 deaths of any race in Idaho. While Asian Americans constitute 1.4% of the Idaho population, they account for 2.0% of all deaths — the highest ratio of any racial identity in the state with available data.

13. Illinois
> Community w/ highest death-to-pop. ratio: Black or African American (14.0% of pop.)
> Black share of COVID-19 infections: 22.8%
> Black share of COVID-19 deaths: 28.3%
> County with most COVID-19 deaths: Union County (111 per 100,000 county residents)
> Union County population: White (91.0%); Black (1.4%); AIAN (0.1%); Asian (0.3%); NHPI (0.0%); Hispanic (5.1%)
Illinois, the nation’s fifth most populous state, hit its highest level of daily new COVID-19 diagnoses on May 8 with 4,014 new confirmed cases. Since then, the state has brought the number down to fewer than 1,000 new infections a day. In the week ending July 13, however, cases again spiked to over 1,000 a day. Black residents have been hit hard, making up 14% of the state’s population but accounting for 28.3% of the known coronavirus deaths and 22.8% of infections.
14. Indiana
> Community w/ highest death-to-pop. ratio: Black or African American (9.2% of pop.)
> Black share of COVID-19 infections: 20.1%
> Black share of COVID-19 deaths: 18.1%
> County with most COVID-19 deaths: Decatur County (121 per 100,000 county residents)
> Decatur County population: White (94.9%); Black (0.6%); AIAN (0.2%); Asian (1.4%); NHPI (0.0%); Hispanic (1.9%)
Home to nearly one million people, Marion County, located in the Indianapolis metro area, is the most populous county in Indiana. More than 27% of the county population are Black, about three times the statewide concentration of Black residents. As of July 13, there have been 1,282 COVID-19 infections and 73 coronavirus deaths for every 100,000 people — well above the comparable statewide concentrations of 778 infections and 38 deaths per 100,000 people. Across Indiana as a whole, Black residents account for about 20% of all COVID-19 infections and 18% of all deaths, though less than 10% of the state population are Black.
The economic and public health toll of the coronavirus is disproportionately affecting lower income households. Across Indiana, the typical Black household earns $33,342 a year, a fraction of the $57,269 the typical white household earns.
[in-text-ad-2]
15. Iowa
> Community w/ highest death-to-pop. ratio: Black or African American (3.4% of pop.)
> Black share of COVID-19 infections: 11.1%
> Black share of COVID-19 deaths: 5.3%
> County with most COVID-19 deaths: Tama County (169 per 100,000 county residents)
> Tama County population: White (81.5%); Black (0.8%); AIAN (7.1%); Asian (0.3%); NHPI (0.0%); Hispanic (9.2%)
Iowa is one of the least racially diverse states in the country. Of the state’s 3.1 million residents, 86.1% are white, compared to 61.1% of Americans nationwide who do. Though the state has had a higher concentration of COVID-19 infections than the U.S. as a whole — 1,125 per 100,000 people compared to 1,016 per 100,000 — it has had fewer fatalities. As of July 13, there have been 24 COVID-19 deaths for every 100,000 people in Iowa, compared to 39 per 100,000 nationwide.
Each of the counties in Iowa hit hardest by coronavirus deaths are home to relatively large Hispanic and Latino populations. In five of the seven Iowa counties where the COVID-19 death rate more than doubles the statewide average, the share of the population identifying as Hispanic or Latino far exceeds the 5.9% share of Iowa residents who do.
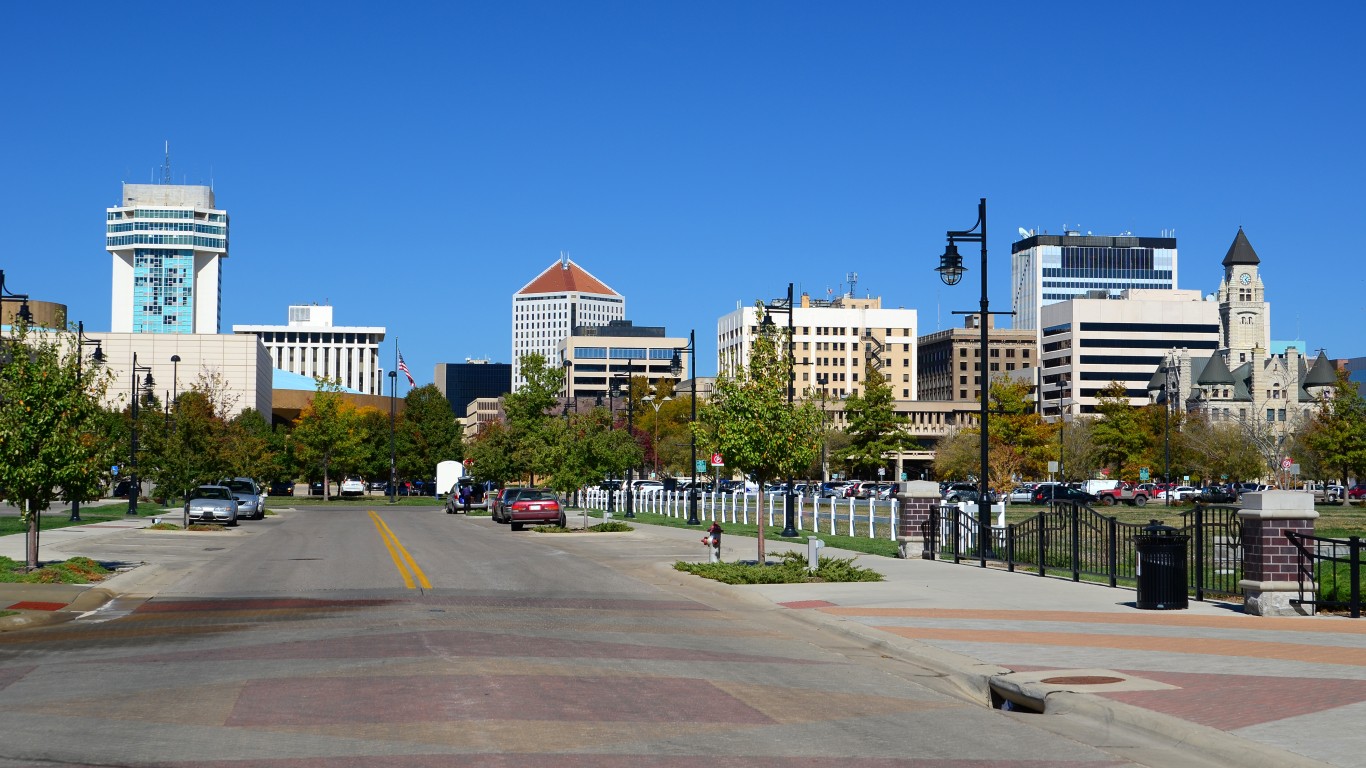
16. Kansas
> Community w/ highest death-to-pop. ratio: Black or African American (5.6% of pop.)
> Black share of COVID-19 infections: 10.3%
> Black share of COVID-19 deaths: 22.6%
> County with highest cumulative cases: Ford County (5,730 per 100,000 county residents)
> Ford County population: White (40.2%); Black (1.9%); AIAN (0.3%); Asian (1.5%); NHPI (0.1%); Hispanic (54.5%)
Although Kansas has a relatively small Black population, making up 5.6% of the state’s population, COVID-19 infections and deaths are disproportionately affecting the Black community. Blacks account for 10.3% of the coronavirus cases recorded in the state and 22.6% of COVID-19 deaths.
The total number of infections is highest in Johnson and Wyandotte counties, which encompass Kansas City and its suburbs, in the eastern part of the state. Adjusted for population, however, the highest number of infections is in Ford County, in the southwestern part of the state. The county reported 5,730.2 cases per 100,000 people as of July 13. The non-Hispanic white population of Ford County is less than 40%, while the Hispanic population is more than 50% and the Black population is less than 3%. No data was available for Hispanic residents of the state. Kansas does not release data on coronavirus deaths by county.
[in-text-ad]
17. Kentucky
> Community w/ highest death-to-pop. ratio: Black or African American (7.9% of pop.)
> Black share of COVID-19 infections: 14.7%
> Black share of COVID-19 deaths: 15.4%
> County with most COVID-19 deaths: Butler County (110 per 100,000 county residents)
> Butler County population: White (94.9%); Black (0.3%); AIAN (0.2%); Asian (0.2%); NHPI (0.0%); Hispanic (3.2%)
In Kentucky, most of the counties hit hardest by the coronavirus are predominantly white. Still, while Black residents account for just 7.9% of Kentucky’s population, they account for 15.4% of all known COVID-19 deaths.
Low-income populations, irrespective of race, are more susceptible to both the economic and health risks associated with the COVID-19 pandemic — and incomes in Kentucky are generally low. The typical household in the state earns $48,392 a year, well below the $60,293 national median annual household income.
18. Louisiana
> Community w/ highest death-to-pop. ratio: Black or African American (32.0% of pop.)
> Black share of COVID-19 infections: N/A
> Black share of COVID-19 deaths: 52.7%
> County with most COVID-19 deaths: Bienville Parish (205 per 100,000 county residents)
> Bienville Parish population: White (54.4%); Black (43.0%); AIAN (0.0%); Asian (0.1%); NHPI (0.0%); Hispanic (0.2%)
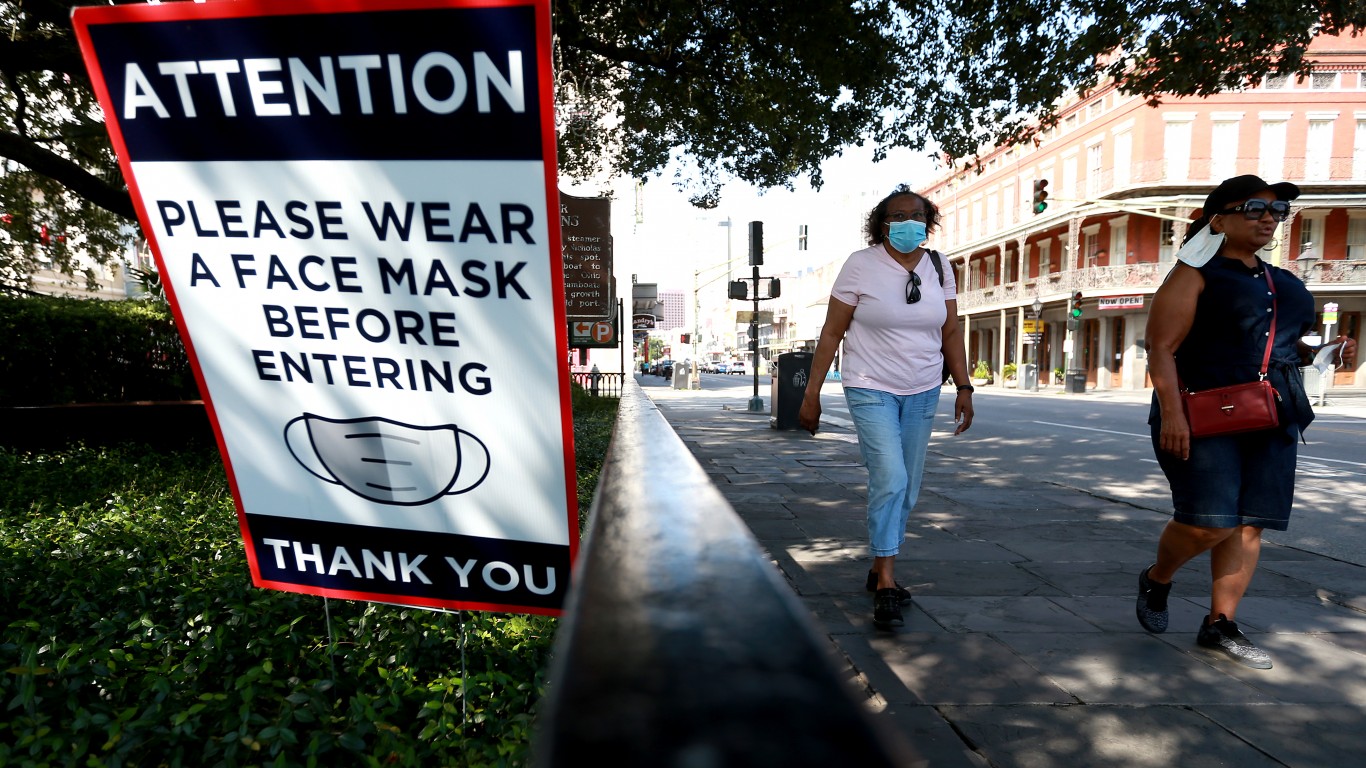
Just under one-in-three Louisiana residents are Black. However, the state’s Black population has borne the brunt of the COVID-19 pandemic, accounting for over half of all coronavirus related deaths. In each of the seven counties in the state with the highest COVID-19 death rate, the concentration of Black residents is greater than it is statewide. In these counties, largely concentrated in the Baton Rouge and New Orleans metro areas, COVID-19 deaths range from 126 per 100,000 people to 205 for every 100,000 people, and populations are anywhere from 35.5% to 59.0% Black. For context, there have been 39 deaths for every 100,000 people nationwide. There have been 72 COVID-19 deaths across Louisiana for every 100,000 residents, the sixth highest of all states.
19. Maine
> Community w/ highest death-to-pop. ratio: Black or African American (1.3% of pop.)
> Black share of COVID-19 infections: 26.9%
> Black share of COVID-19 deaths: 2.1%
> County with most COVID-19 deaths: Waldo County (36 per 100,000 county residents)
> Waldo County population: White (95.6%); Black (0.5%); AIAN (0.5%); Asian (0.5%); NHPI (0.0%); Hispanic (1.3%)
Maine is the least racially diverse state in the country. A little over 93% of the population identifies as white, compared to 61.1% of the U.S. population. Maine also has the worst disparity in COVID-19 infections along racial lines than any other state in the country. Though only 1.3% of Mainers are Black, the Black population accounts for nearly 27% of all known cases of the coronavirus.
Many of the state’s Black and minority residents who tested positive are immigrants. To help stop the spread in the immigrant community, who often have crowded living conditions, the cities of Portland, Lewiston, Augusta, Waterville, and Bangor are providing hotel rooms to individuals who tested positive to self isolate.
[in-text-ad-2]
20. Maryland
> Community w/ highest death-to-pop. ratio: Black or African American (29.3% of pop.)
> Black share of COVID-19 infections: 37.2%
> Black share of COVID-19 deaths: 41.2%
> County with most COVID-19 deaths: Kent County (117 per 100,000 county residents)
> Kent County population: White (77.8%); Black (14.3%); AIAN (0.1%); Asian (1.3%); NHPI (0.0%); Hispanic (4.3%)
With 29.3% of its residents identifying as Black, Maryland has one of the most diverse populations in the country. Only Mississippi, Georgia, and Louisiana have populations with a larger percentage of Blacks. Even so, Maryland shows a large disparity related to COVID-19. Black Americans represent 37.2% of the Maryland residents who have tested positive by the coronavirus and account for 41.2% of the deaths.
Prince George’s County, which borders Washington, D.C., is one of the most affluent majority African American counties in the United States. It is also the county with the highest incidence of COVID-19 infection, with 2,181 infections per 100,000 residents. It is second only to Kent County in the rate of coronavirus deaths, with 78.8 deaths per 100,000. Kent County’s population is less than 15% Black and more than 75% non-Hispanic white.
21. Massachusetts
> Community w/ highest death-to-pop. ratio: Black or African American (6.8% of pop.)
> Black share of COVID-19 infections: 15.3%
> Black share of COVID-19 deaths: 8.9%
> County with most COVID-19 deaths: Essex County (145 per 100,000 county residents)
> Essex County population: White (71.0%); Black (3.1%); AIAN (0.1%); Asian (3.4%); NHPI (0.0%); Hispanic (20.4%)
The two Massachusetts counties with the highest concentration of COVID-19 deaths — Essex and Hampden — are also home to disproportionately large shares Hispanic and Latino populations. In Essex, where there have been 146 deaths for every 100,000 people, 20.4% of the population identifies as Hispanic or Latino, and in Hampden, a county with 145 COVID-19 deaths per 100,000 people, 24.6% of the population are Hispanic or Latino. For comparison, 11.6% of the Massachusetts population identifies as Hispanic or Latino, and there have been 121 deaths per 100,000 people statewide.
The economic and public health toll of the coronavirus is disproportionately affecting lower-income households. Across Massachusetts, the typical Latino or Hispanic household earns $41,289 a year, well below the $81,877 the typical white household earns.
[in-text-ad]

22. Michigan
> Community w/ highest death-to-pop. ratio: Black or African American (13.7% of pop.)
> Black share of COVID-19 infections: 39.6%
> Black share of COVID-19 deaths: 42.5%
> County with most COVID-19 deaths: Wayne County (157 per 100,000 county residents)
> Wayne County population: White (49.6%); Black (38.7%); AIAN (0.3%); Asian (3.2%); NHPI (0.0%); Hispanic (5.9%)
Michigan has some of the worst racial disparities in COVID-19 outcomes along racial lines of any state. Though less than 14% of the state’s population is Black, nearly 43% of all Michigan residents who have died from COVID-19 were Black.
The statewide disparity is driven in large part by Wayne County, which includes the city of Detroit. In Wayne, a county where 38.7% of the population is Black, there have been 157 COVID-19 deaths for every 100,000 people, by far the highest death rate in the state. According to a Brooking’s study, social distancing was not an option for many Black Detroiters due to any number of factors, including work demands, transportation needs, and housing settings.

23. Minnesota
> Community w/ highest death-to-pop. ratio: Black or African American (6.1% of pop.)
> Black share of COVID-19 infections: 28.9%
> Black share of COVID-19 deaths: 10.1%
> County with most COVID-19 deaths: Hennepin County (64 per 100,000 county residents)
> Hennepin County population: White (69.2%); Black (12.9%); AIAN (0.6%); Asian (7.0%); NHPI (0.0%); Hispanic (6.9%)
In Minnesota, 80.1% or the residents self-identify as white and 6.1% as Black. However, 28.9% of the people who tested positive for the coronavirus are Black, and 10.1% of the people who have died were Black. This disparity is not the only racial divide in the state. Minnesota’s income gap between Blacks and whites is the second largest in the country, exceeded only by Wisconsin’s.
Hennepin County, which encompasses Minneapolis and some of its suburbs, had the highest rate of COVID-19 deaths, with 64.0 per 100,000 residents as of July 13. As of the same date, 39 of Minnesota’s 87 counties had no deaths from COVID-19. Many of those counties are in rural areas and are predominately white.
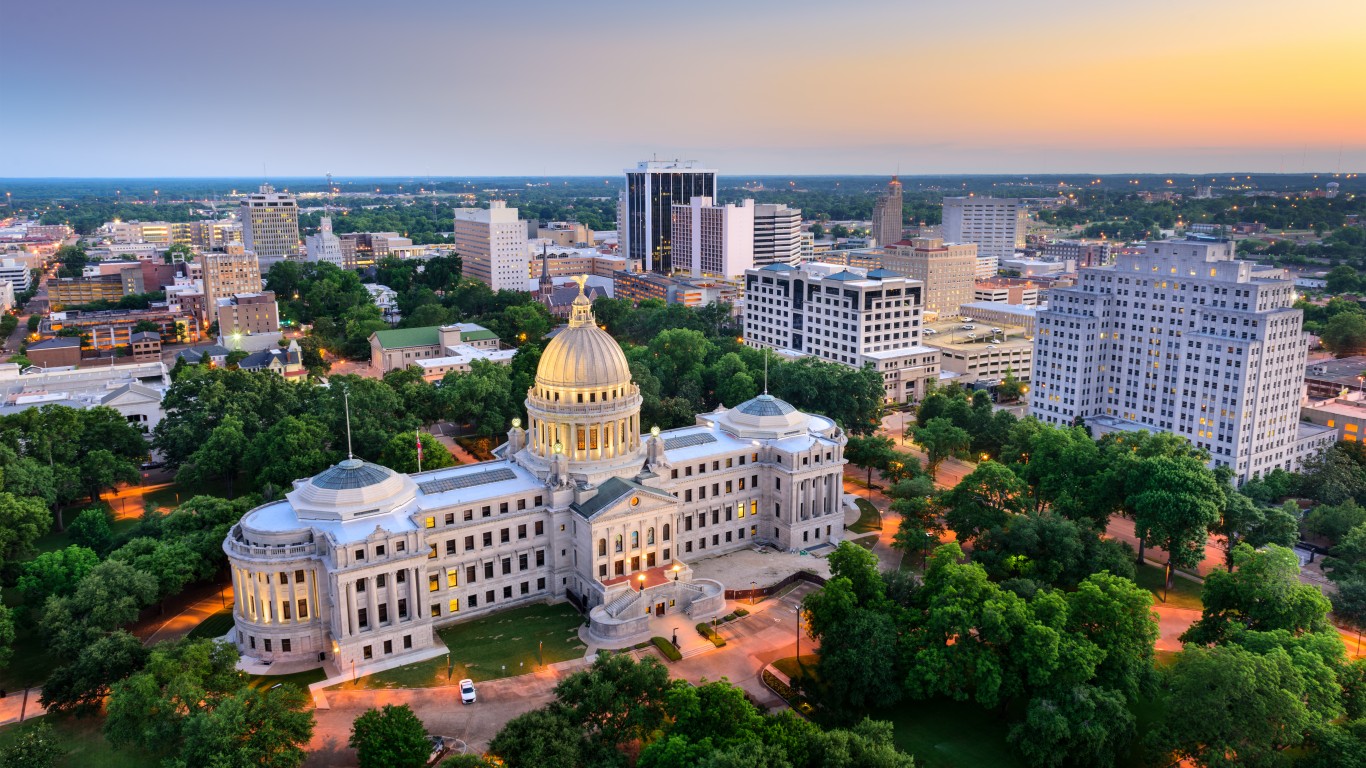
24. Mississippi
> Community w/ highest death-to-pop. ratio: Black or African American (37.5% of pop.)
> Black share of COVID-19 infections: 57.1%
> Black share of COVID-19 deaths: 50.7%
> County with most COVID-19 deaths: Neshoba County (262 per 100,000 county residents)
> Neshoba County population: White (58.6%); Black (21.0%); AIAN (15.9%); Asian (0.5%); NHPI (0.0%); Hispanic (2.0%)
Mississippians identifying as Black account for 37.5% of the state population, the largest share of any state. Still, Mississippi’s Black population is disproportionately affected by the coronavirus. Black Mississippians account for half of all COVID-19 deaths in the state to date.
Neshoba County has reported the highest number of deaths per capita of any county in the state. Neshoba is home to a large Choctaw Indian population, and Native Americans have been shown to have an especially high COVID-19 mortality rate. There have been 262 coronavirus deaths for every 100,000 people in Neshoba County compared to 42 deaths per 100,000 statewide. In Neshoba County, 15.9% of the population identifies as Native American, compared to 0.4% of Mississippi’s population.
[in-text-ad-2]
25. Missouri
> Community w/ highest death-to-pop. ratio: Black or African American (11.5% of pop.)
> Black share of COVID-19 infections: 36.2%
> Black share of COVID-19 deaths: 37.1%
> County with most COVID-19 deaths: Gentry County (135 per 100,000 county residents)
> Gentry County population: White (96.1%); Black (0.7%); AIAN (0.3%); Asian (0.6%); NHPI (0.1%); Hispanic (1.5%)
Though Black Americans account for just 11.5% of Missouri’s population, the Black population accounts for nearly 37.9% of all COVID-19 deaths in the state. In four of the five counties with the highest concentration of COVID-19 deaths, the share of the population identifying as Black is more than double the statewide share.
The economic and public health toll of the pandemic is disproportionately affecting lower-income households. Across Missouri, the typical Black household earns $35,710 a year, a fraction of the $56,701 the typical white household earns in the state.
26. Montana
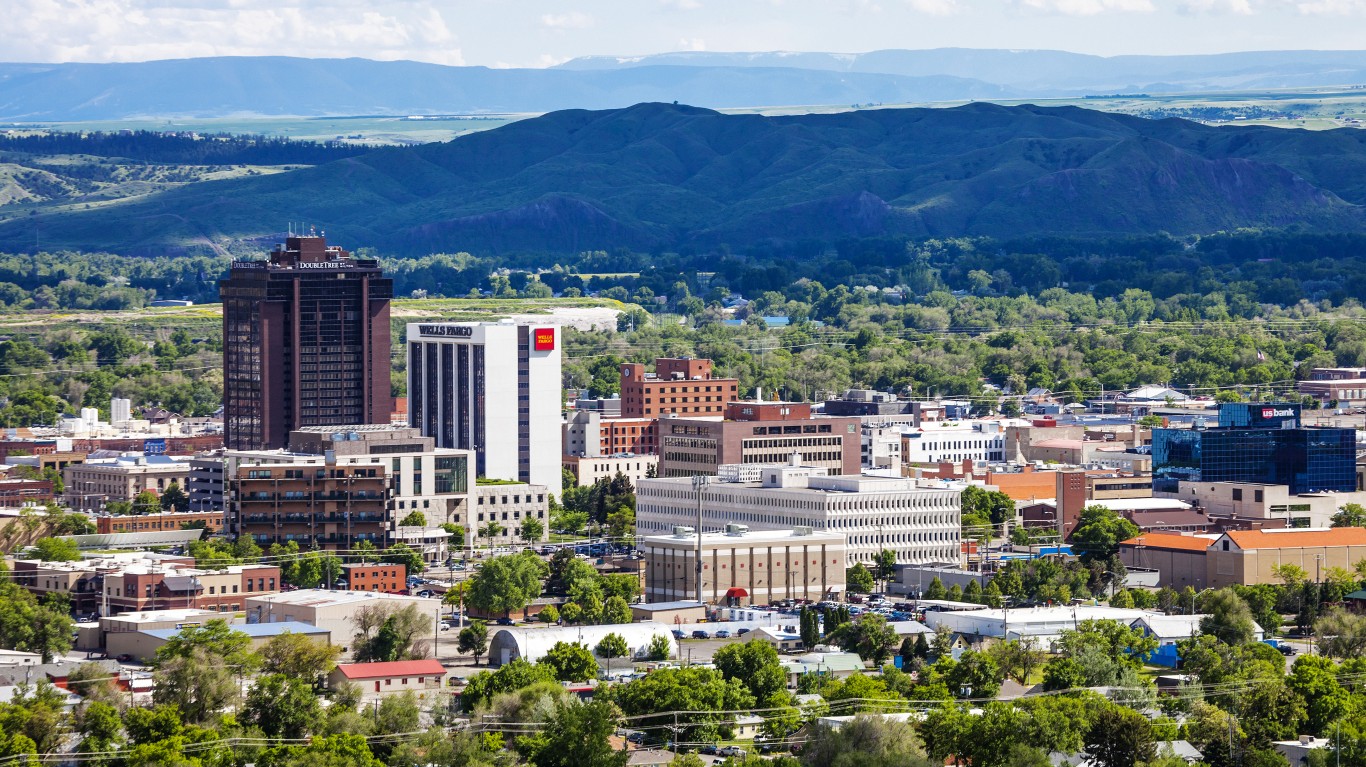
> Community w/ highest death-to-pop. ratio: American Indian and Alaska Native (6.2% of pop.)
> AIAN share of COVID-19 infections: 14.9%
> AIAN share of COVID-19 deaths: 36.4%
> County with most COVID-19 deaths: Toole County (121 per 100,000 county residents)
> Toole County population: White (87.6%); Black (0.2%); AIAN (4.1%); Asian (2.5%); NHPI (0.0%); Hispanic (3.7%)
Native Americans account for 6.2% of Montana’s population, a larger share than in most states, and many of the parts of the state hit hardest by COVID-19 have especially large Native American populations. In Big Horn County, for example, where 64.8% of residents identify as American Indian, there have been 37 COVID-19 deaths for every 100,000 people, more than 12 times the death rate statewide of 3 per 100,000. Big Horn also has the highest total number of cases per capita of any county in the state, at 890 per 100,000 people.
[in-text-ad]
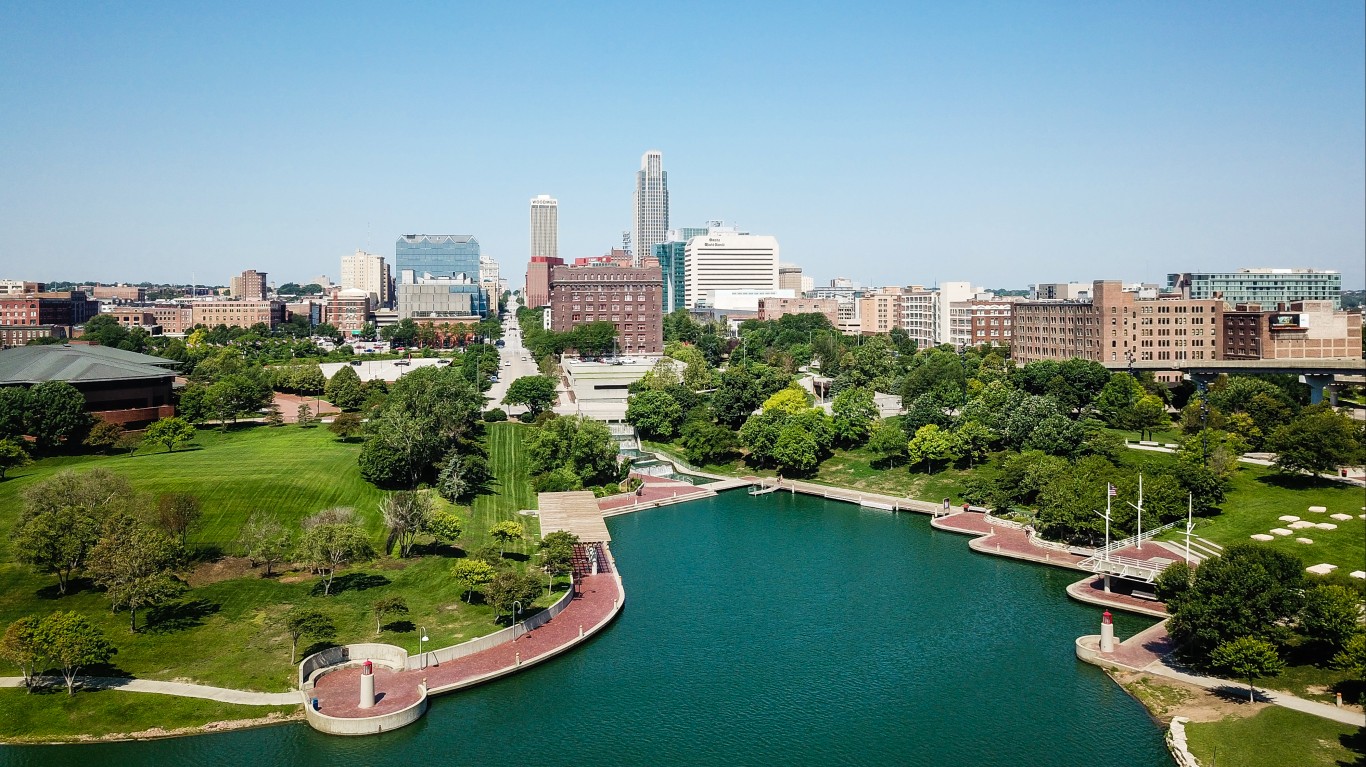
27. Nebraska
> Community w/ highest death-to-pop. ratio: Asian (2.3% of pop.)
> Asian share of COVID-19 infections: 8.1%
> Asian share of COVID-19 deaths: 6.4%
> County with most COVID-19 deaths: Dakota County (177 per 100,000 county residents)
> Dakota County population: White (49.0%); Black (4.4%); AIAN (2.5%); Asian (3.2%); NHPI (0.0%); Hispanic (38.5%)
Dakota County, located in the Sioux City metro area, has the highest number of COVID-19 deaths per capita of any county in Nebraska. There have been 177 deaths for every 100,000 people in Dakota County, compared to 15 deaths per 100,000 people statewide. As is often the case in counties with especially high fatality rates, Dakota County is home to a large racial minority community. Of the county’s more than 20,000 residents, 38.5% identify as Hispanic or Latino, more than triple the 10.7% share among Nebraska residents.
On the state level, the Asian community bears the largest burden of COVID-19 deaths of any race in Nebraska. While Asian Americans constitute 2.3% of Nebraska’s population, they account for 6.4% of all deaths — the highest ratio of any racial identity in the state with available data.

28. Nevada
> Community w/ highest death-to-pop. ratio: Asian (7.9% of pop.)
> Asian share of COVID-19 infections: 8.9%
> Asian share of COVID-19 deaths: 15.9%
> County with most COVID-19 deaths: Humboldt County (24 per 100,000 county residents)
> Humboldt County population: White (64.9%); Black (0.4%); AIAN (5.2%); Asian (0.5%); NHPI (0.0%); Hispanic (26.7%)
Nevada, where 8.6% of the population is Black, has one of the smaller disparities for how the Black community is being affected by COVID-19. Still, a disproportionately high share of Black residents tested positive or died of COVID-19. As of July 13, Black residents accounted for 9.6% of known coronavirus cases and 13.3% of the deaths.
COVID-19 has affected the Asian community even more disproportionately. The community makes up 7.9% of Nevada’s population but accounts for 15.9% of deaths — the highest death-to-population ratio of any racial identity in the state with available data.

29. New Hampshire
> Community w/ highest death-to-pop. ratio: Black or African American (1.3% of pop.)
> Black share of COVID-19 infections: 6.5%
> Black share of COVID-19 deaths: 2.2%
> County with most COVID-19 deaths: Hillsborough County (63 per 100,000 county residents)
> Hillsborough County population: White (84.9%); Black (2.3%); AIAN (0.1%); Asian (4.0%); NHPI (0.0%); Hispanic (6.5%)
New Hampshire is one of the least diverse states in the country. About nine in every 10 residents identify as white, compared to about six in every 10 Americans. The county with the highest concentration of COVID-19 deaths is also the most diverse county in the state. There have been 63 coronavirus related deaths for every 100,000 people in Hillsborough County, compared to 29 deaths per 100,000 people across New Hampshire. Meanwhile, only about 85% of Hillsborough residents identify as white, while 2.3% of county residents are Black and 6.5% are Hispanic and Latino.
[in-text-ad-2]

30. New Jersey
> Community w/ highest death-to-pop. ratio: Black or African American (12.7% of pop.)
> Black share of COVID-19 infections: 19.3%
> Black share of COVID-19 deaths: 18.7%
> County with most COVID-19 deaths: Essex County (262 per 100,000 county residents)
> Essex County population: White (30.8%); Black (38.6%); AIAN (0.2%); Asian (5.2%); NHPI (0.0%); Hispanic (22.7%)
New Jersey, the most densely populated state in the nation, is second only to New York in total number of COVID-19 deaths, with 15,560 through July 13. Although the state has a population that is 12.7% Black, the coronavirus has affected the Black community disproportionately. Black residents account for 19.3% of known COVID-19 infections and 18.7% of the deaths.
Latino residents make up 19.9% of the state’s population but account for 34.5% of COVID-19 infections and 20.5% of the deaths.
The pandemic has spread fairly consistently across New Jersey’s 21 counties. The six counties closest to New York City — Essex, Passaic, Union, Hudson, Bergen and Middlesex — each has more than 16,000 infections. Only two counties — Salem and Cape May — have fewer than 1,000 cases.
31. New Mexico
> Community w/ highest death-to-pop. ratio: American Indian and Alaska Native (8.8% of pop.)
> AIAN share of COVID-19 infections: 47.0%
> AIAN share of COVID-19 deaths: 59.3%
> County with most COVID-19 deaths: McKinley County (262 per 100,000 county residents)
> McKinley County population: White (8.8%); Black (0.6%); AIAN (73.7%); Asian (1.0%); NHPI (0.0%); Hispanic (14.3%)
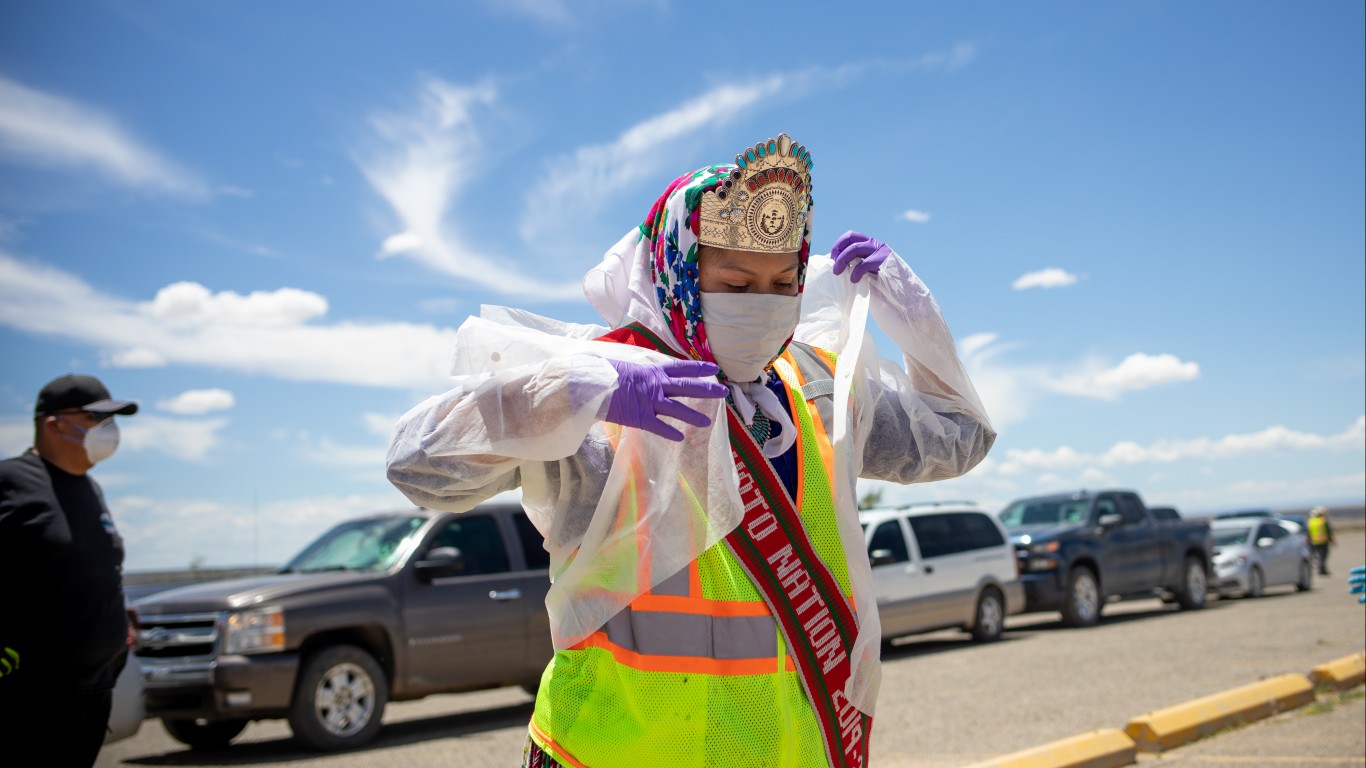
In New Mexico, the counties hit hardest by the coronavirus also have the largest relative Native American populations. In Cibola and San Juan counties, COVID-19 deaths per capita are at least double the statewide rate of 26 deaths per 100,000. Native Americans comprise 39.0% and 38.1% of these counties’ populations, respectively. Statewide, Native Americans make up 8.8% of the population.
And McKinley County, where 73.7% of the population is Native American, is by far the hardest hit, reporting a staggering 262 COVID-19 deaths per 100,000 people.
[in-text-ad]
32. New York
> Community w/ highest death-to-pop. ratio: Black or African American (14.3% of pop.)
> Black share of COVID-19 infections: N/A
> Black share of COVID-19 deaths: 27.2%
> County with most COVID-19 deaths: Bronx County (232 per 100,000 county residents)
> Bronx County population: White (9.3%); Black (29.3%); AIAN (0.2%); Asian (3.5%); NHPI (0.0%); Hispanic (55.9%)
Early in the global pandemic, New York became the epicenter of the disease. New York succeeded in bringing down the numbers of new infections and deaths and is now one of the few places in the country where, at least for now, the outbreak seems to be under some sort of control.
New York’s population is 14.3% Black and 18.9% Latino. But Black residents accounted for 27.2% of the COVID-19 fatalities, and Latino residents made up 28.7% of the deaths. Information was unavailable for the number of cases by race.
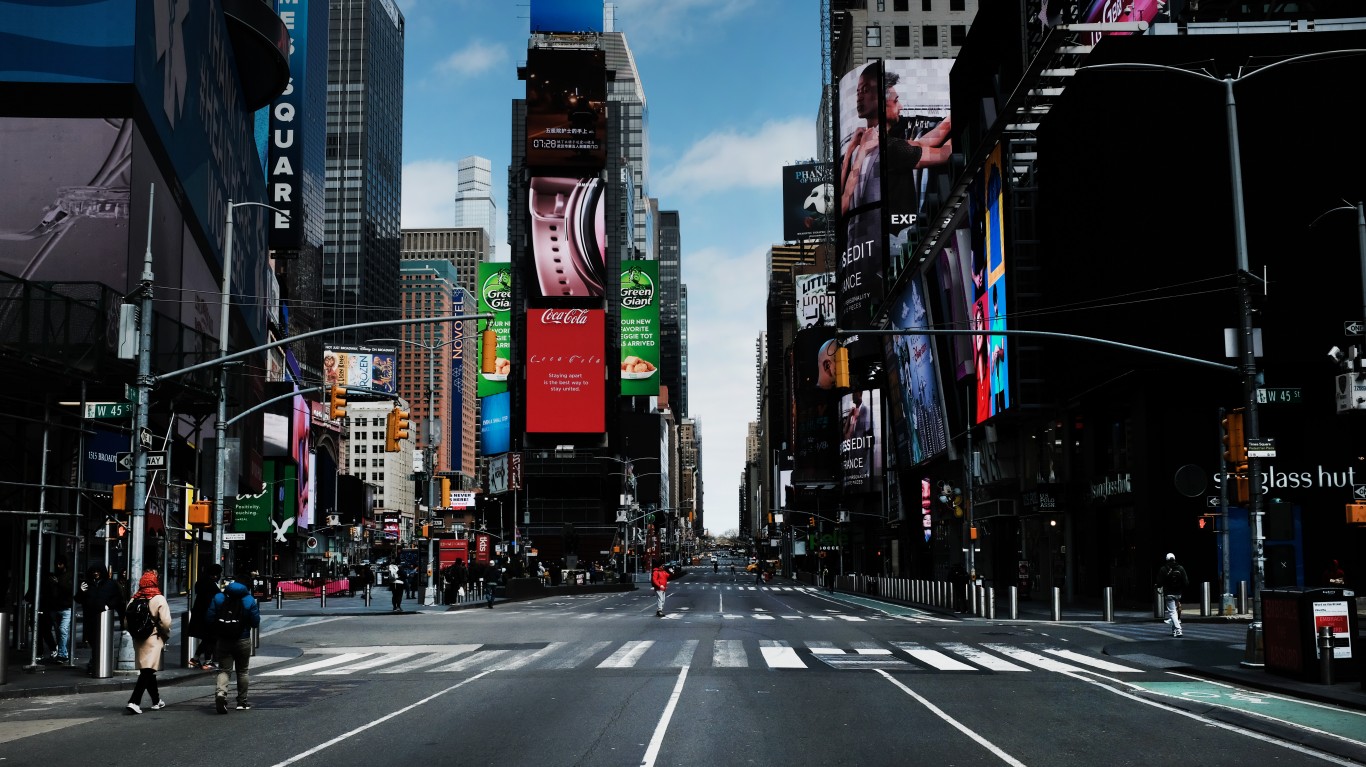
The Bronx County, Queens County, and Kings County (Brooklyn) were the areas of the state where the numbers of deaths per 100,000 people were the highest. The three boroughs of New York City are among the most racially diverse places in the state.
33. North Carolina
> Community w/ highest death-to-pop. ratio: Black or African American (21.1% of pop.)
> Black share of COVID-19 infections: 28.8%
> Black share of COVID-19 deaths: 34.9%
> County with most COVID-19 deaths: Vance County (90 per 100,000 county residents)
> Vance County population: White (40.0%); Black (49.9%); AIAN (0.3%); Asian (0.6%); NHPI (0.1%); Hispanic (7.6%)
Black Americans account for about one in every five North Carolina residents. However, the state’s Black population accounts for more than one in every three known coronavirus deaths in the state. In Vance County, where COVID-19 deaths have been most concentrated in the state, half of the population is Black.
In June, North Carolina Gov. Roy Cooper explained how entrenched inequality related to housing, access to health care, and economic opportunity is contributing to the COVID-19 disparity in outcomes along racial lines. Cooper established a task force to address these underlying issues.
34. North Dakota
> Community w/ highest death-to-pop. ratio: No racial data available
> Share of COVID-19 infections: Data not available
> Share of COVID-19 deaths: Data not available
> County with most COVID-19 deaths: Cass County (41 per 100,000 county residents)
> Cass County population: White (86.1%); Black (5.1%); AIAN (0.9%); Asian (3.0%); NHPI (0.0%); Hispanic (2.6%)
North Dakota is the only state that does not report race and ethnicity data related to COVID-19 infections and deaths. Only three states — Alaska, Vermont, and Wyoming — have smaller populations than North Dakota’s 752,201. Only 2.7% of the state’s population is Black, and 5.1% is American Indian or Alaska Native.
North Dakota is seeing a surge in COVID-19 infections, which has coincided with the reopening of such businesses as bars and restaurants. The state ranks 35th in number of deaths per 100,000 population, at 11.4. Cass County, home to Fargo, the state’s largest city, has the highest incidence of COVID-19 cases and deaths with 1,430.5 cases per 100,000 people and 41.3 deaths per 100,000. It also is the county with the highest percentage of Black residents, at 6.3%.
[in-text-ad-2]
35. Ohio
> Community w/ highest death-to-pop. ratio: Black or African American (12.2% of pop.)
> Black share of COVID-19 infections: 34.4%
> Black share of COVID-19 deaths: 19.8%
> County with most COVID-19 deaths: Monroe County (121 per 100,000 county residents)
> Monroe County population: White (97.3%); Black (0.3%); AIAN (0.0%); Asian (0.4%); NHPI (0.0%); Hispanic (1.1%)
After experiencing a spike in COVID-19 infections in April, Ohio succeeded in bringing down the number of new cases in May and June. Now, cases are spiking again, rising even higher than they were in April.
Although Ohio’s population is 12.2% black, Black residents account for 34.4% of new COVID-19 infections. Of the 3,064 coronavirus deaths through July 13, 19.8% of the fatalities were Black.
36. Oklahoma
> Community w/ highest death-to-pop. ratio: White (66.0% of pop.)
> White share of COVID-19 infections: 72.3%
> White share of COVID-19 deaths: 81.5%
> County with most COVID-19 deaths: Greer County (118 per 100,000 county residents)
> Greer County population: White (75.0%); Black (8.3%); AIAN (2.4%); Asian (0.0%); NHPI (0.0%); Hispanic (11.3%)
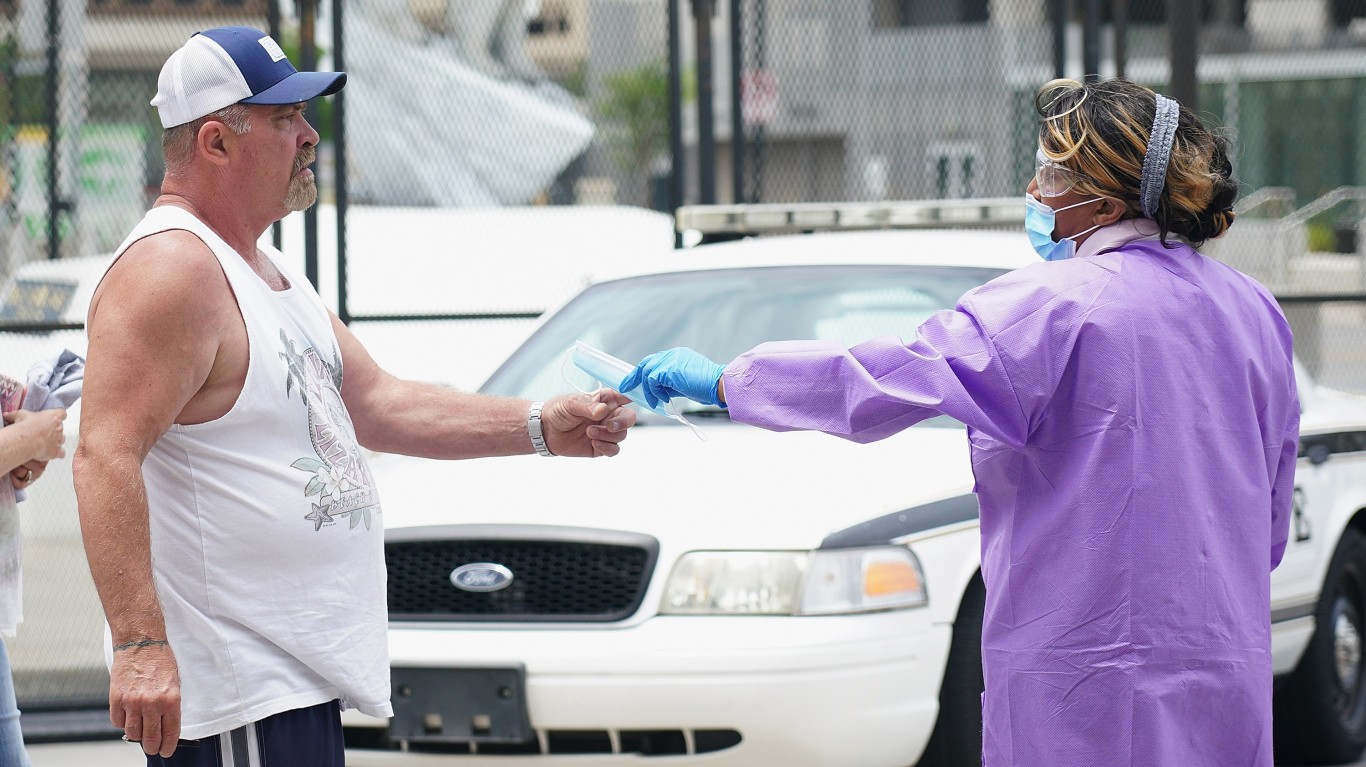
Racial disparities in outcomes related to COVID-19 infections are not as pronounced in Oklahoma as they are in much of the country. Black residents make up 7.2% of the population and account for 7.7% of all known coronavirus deaths in the state. Similarly, 7.2% of Oklahoma residents identify as Native American, a group that accounts for 9.1% of all known COVID-19 related deaths in the state.
So far, Oklahoma has been largely spared the worst of the COVID-19 pandemic. There have been 526 cases and 11 deaths for every 100,000 people in the state — well below the comparable national rates of 1,016 cases and 39 deaths per 100,000 people as of July 13.
[in-text-ad]

37. Oregon
> Community w/ highest death-to-pop. ratio: Black or African American (1.8% of pop.)
> Black share of COVID-19 infections: 7.8%
> Black share of COVID-19 deaths: 3.1%
> County with most COVID-19 deaths: Marion County (16 per 100,000 county residents)
> Marion County population: White (65.8%); Black (1.2%); AIAN (0.5%); Asian (2.0%); NHPI (0.9%); Hispanic (26.3%)
Oregon has been largely spared the worst public health effects of the coronavirus pandemic. There have been 297 cases and 6 deaths for every 100,000 people in the state — well below the comparable national rates of 1,016 cases and 39 deaths per 100,000 people as of July 13.
Still, Black Americans in the state are more than four times as likely to contract COVID-19 and nearly twice as likely to die from it than the typical state resident. Additionally, some of the hardest hit counties in the state are home to relatively large Hispanic and Latino populations. In Marion County, for example, there have been 16 deaths for every 100,000 people, the highest death rate in the state. Meanwhile, more than one in every four Marion County residents identify as Hispanic or Latino, compared to less than 13% of all Oregon residents.
38. Pennsylvania
> Community w/ highest death-to-pop. ratio: Black or African American (10.6% of pop.)
> Black share of COVID-19 infections: 28.7%
> Black share of COVID-19 deaths: 22.4%
> County with most COVID-19 deaths: Delaware County (119 per 100,000 county residents)
> Delaware County population: White (67.4%); Black (20.9%); AIAN (0.1%); Asian (5.5%); NHPI (0.0%); Hispanic (3.7%)
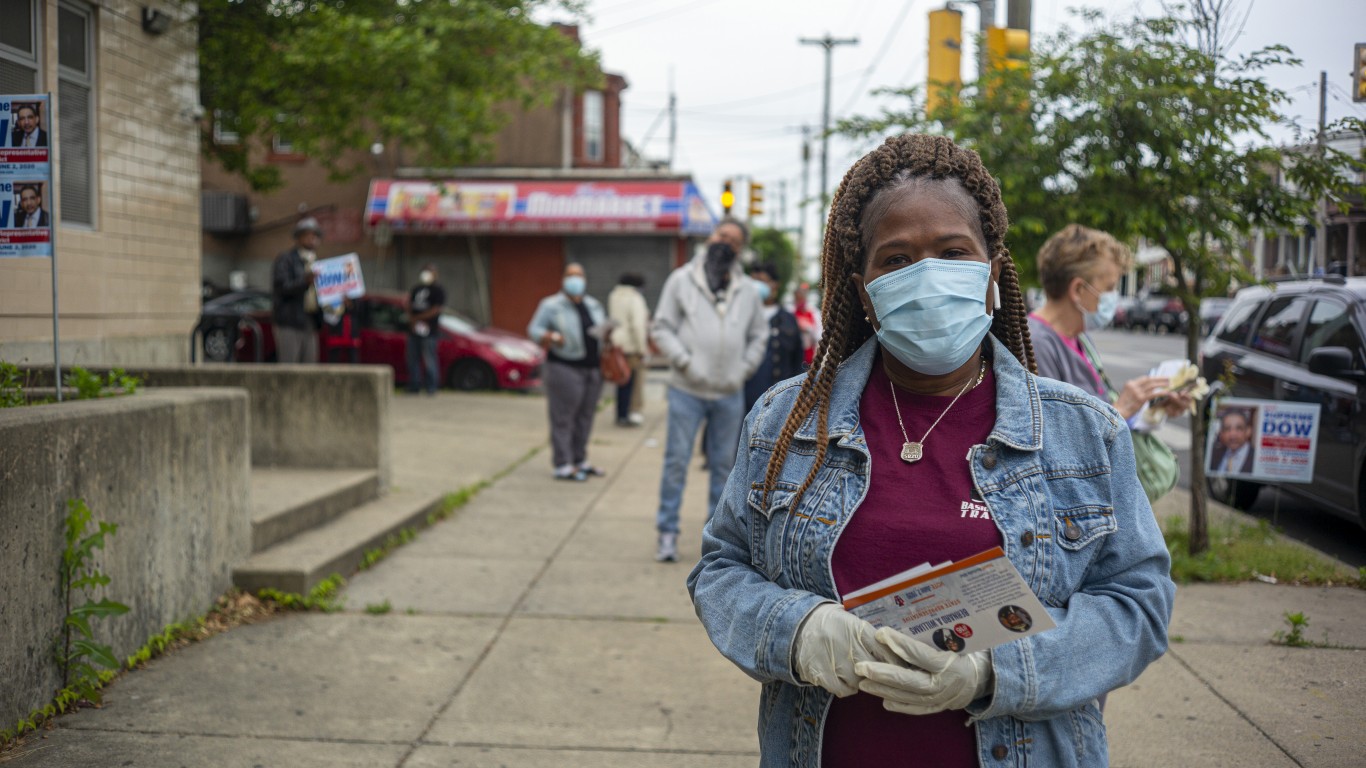
About one in every 10 Pennsylvanians are Black, yet more than one in five COVID-19 deaths in the state have been of Black residents. The two counties with the highest deaths per capita in the state — Delaware and Philadelphia counties, both located in the Philadelphia metro area — are 20.9% Black and 40.0% Black, respectively. Experts attribute higher infection rates among Black Philadelphia residents to structural inequalities that make social distancing more difficult, such as crowded living quarters, having jobs as essential workers, and lower income.
Across Pennsylvania, Black residents are more than twice as likely as white residents to live below the poverty line. Similarly, the typical Black household earns $36,847 a year, compared to the median income of $59,445 across all households in the state.
39. Rhode Island
> Community w/ highest death-to-pop. ratio: White (72.7% of pop.)
> White share of COVID-19 infections: 38.1%
> White share of COVID-19 deaths: 83.2%
> County with highest cumulative cases: Providence County (2,071 per 100,000 county residents)
> Providence County population: White (61.5%); Black (8.1%); AIAN (0.3%); Asian (4.1%); NHPI (0.1%); Hispanic (22.3%)
Few states have been hit as hard by the COVID-19 pandemic as Rhode Island. The small, densely-populated state has had 1,654 known infections and 93 deaths for every 100,000 people as of July 13. Meanwhile, there have been 1,016 infections and 39 deaths for every 100,000 people nationwide over the same period.
Across the state, Black residents have been far more likely to contract the coronavirus than the state’s white residents. Black Americans make up 5.6% of the state population yet account for 13.1% of all known COVID-19 cases. While Black residents have bore the worst burden in terms of infections, Rhode Island is one of only two states where the white community bears the worst burden in terms of death. White people in Rhode Island make up 72.7% of the population and 83.2% of COVID-19 deaths — the highest proportion of any race for which data is available.
[in-text-ad-2]
40. South Carolina
> Community w/ highest death-to-pop. ratio: Black or African American (26.8% of pop.)
> Black share of COVID-19 infections: 40.5%
> Black share of COVID-19 deaths: 47.3%
> County with most COVID-19 deaths: Clarendon County (138 per 100,000 county residents)
> Clarendon County population: White (47.5%); Black (48.5%); AIAN (0.1%); Asian (0.1%); NHPI (0.0%); Hispanic (3.0%)
About one in every four South Carolina residents are Black. However, Black Americans account for nearly half of all COVID-19 deaths in the state. In the three counties with the greatest concentration of coronavirus deaths — Clarendon, Lee, and Fairfield — the share of residents identifying as Black ranges from about 49% to 64%.
A recent report from the South Carolina Institute of Medicine and Public Health analyzed the coronavirus’s different impact along racial lines. According to the report, deeply rooted structural inequities in social and environmental conditions make social distancing more difficult for minority communities in the state. These conditions are compounded by racial disparity in health care systems and delivery.
41. South Dakota
> Community w/ highest death-to-pop. ratio: No racial data available
> Share of COVID-19 infections: Data not available
> Share of COVID-19 deaths: Data not available
> County with most COVID-19 deaths: Buffalo County (146 per 100,000 county residents)
> Buffalo County population: White (12.3%); Black (0.1%); AIAN (82.3%); Asian (0.0%); NHPI (1.1%); Hispanic (3.2%)
The disparity in COVID-19 infections along racial lines in South Dakota is among the worst in the United States. Black Americans account for less than 2% of South Dakota’s population, yet account for nearly 15% of all COVID-19 infections in the state. Similarly, though Native Americans make up only 8.4% of the state population, they also account for 17.9% of all known coronavirus cases. The disparities are also evident among the state’s Hispanic and Latino residents who account for 3.7% of the population but 16.7% of all infections.
[in-text-ad]
42. Tennessee
> Community w/ highest death-to-pop. ratio: Black or African American (16.6% of pop.)
> Black share of COVID-19 infections: 32.0%
> Black share of COVID-19 deaths: 38.2%
> County with most COVID-19 deaths: Trousdale County (52 per 100,000 county residents)
> Trousdale County population: White (84.5%); Black (9.5%); AIAN (0.3%); Asian (0.2%); NHPI (0.0%); Hispanic (0.7%)
Black residents in Tennessee are being affected by COVID-19 at about double their proportion in the population. Black residents make up 16.6% of Tennessee’s population but they account for 32.0% of COVID-19 infections. And 38.2% of the residents who have died because of the coronavirus were Black.
Trousdale County, the smallest of Tennessee’s 95 counties by area, is the eighth least populous. Still, the county ranks eighth among counties in the state for total COVID-19 infections. The county is home to the Trousdale Turner Correctional Facility in Hartsville, where more than 1,300 inmates and staff members tested positive for COVID-19 in May.
43. Texas
> Community w/ highest death-to-pop. ratio: Black or African American (11.7% of pop.)
> Black share of COVID-19 infections: 14.6%
> Black share of COVID-19 deaths: 14.6%
> County with most COVID-19 deaths: Crane County (186 per 100,000 county residents)
> Crane County population: White (32.0%); Black (3.9%); AIAN (0.1%); Asian (0.4%); NHPI (0.0%); Hispanic (63.6%)
Texas, the second most populous state in the country, is experiencing a COVID-19 surge, recording its largest number of deaths in one day, at 129, on Thursday. The state also added more than 28,000 new cases from July 14 to 16.
Black residents, who make up 11.7% of the state’s population, account for a disproportionate share of infections and deaths, both at 14.6%. And Latino residents, who make up 39.2% of the state’s population, account for more than half the state’s COVID-19 infections, at 50.5%. Of those who died from the coronavirus, 33.6% were Hispanic.
44. Utah
> Community w/ highest death-to-pop. ratio: Black or African American (1.1% of pop.)
> Black share of COVID-19 infections: 2.8%
> Black share of COVID-19 deaths: 2.4%
> County with most COVID-19 deaths: San Juan County (72 per 100,000 county residents)
> San Juan County population: White (43.6%); Black (0.2%); AIAN (47.3%); Asian (0.4%); NHPI (0.3%); Hispanic (5.6%)
Utah reported its first COVID-19 case on March 6 and its first death on March 23. The number of cases have been trending upward at a fairly steady rate since then, with the state reporting a high of 870 new cases on July 9. Although Utah’s Black and Latino populations are relatively small, they have been affected disproportionately.
Black residents make up 2.8% of COVID-19 infections and 2.4% of the deaths, even though they represent only 1.1% of the state’s total population. Latino residents make up 13.9% of the state’s population but account for 46.0% of the coronavirus cases and 25.6% of the deaths.
[in-text-ad-2]

45. Vermont
> Community w/ highest death-to-pop. ratio: Asian (1.7% of pop.)
> Asian share of COVID-19 infections: 4.2%
> Asian share of COVID-19 deaths: 3.6%
> County with most COVID-19 deaths: Chittenden County (24 per 100,000 county residents)
> Chittenden County population: White (88.8%); Black (2.5%); AIAN (0.2%); Asian (4.2%); NHPI (0.0%); Hispanic (2.3%)
Vermont saw its biggest spike in new COVID-19 cases three months ago, when it reported 72 new cases on April 4. Then the number of new cases began to decline, reaching below 10 per day on June 4 and staying there until July 3. Now the cases appear to be surging slightly, going above 10 per day on some days and below on others.
Coronavirus infections in the state are disproportionately dispersed by race. Vermont has the second smallest population in the country and only 1.7% of state residents are Asian. But Asian Americans represent 3.6% of COVID-19 infections — the highest death-to-population ratio of any race in the state with available data.
46. Virginia
> Community w/ highest death-to-pop. ratio: Black or African American (18.8% of pop.)
> Black share of COVID-19 infections: 20.8%
> Black share of COVID-19 deaths: 24.7%
> County with most COVID-19 deaths: Emporia city (279 per 100,000 county residents)
> Emporia city population: White (22.5%); Black (69.7%); AIAN (0.1%); Asian (0.3%); NHPI (0.0%); Hispanic (5.5%)
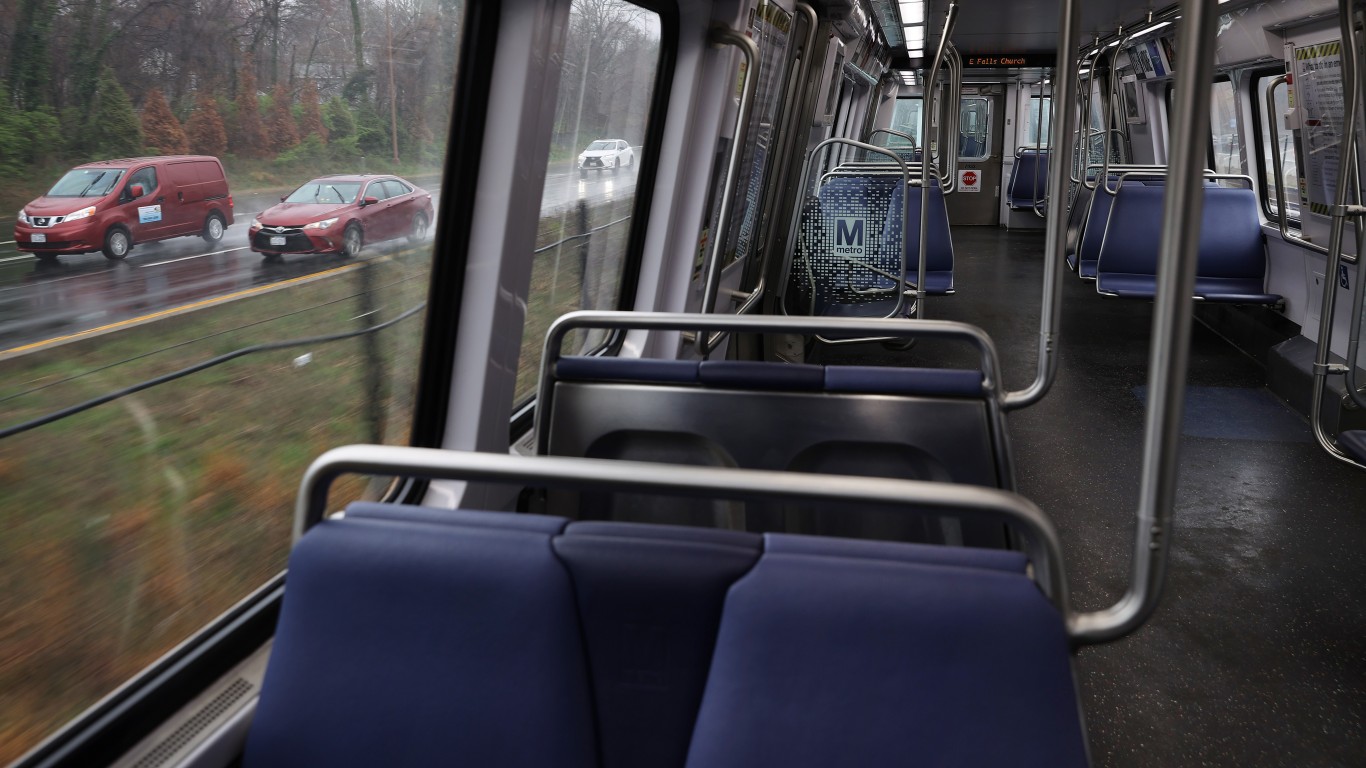
With a population that is 18.8% Black, Virginia has reported that 20.8% of its confirmed COVID-19 infections are in Black residents. In addition, 24.7% of the people who have died because of the coronavirus were Black. So the Black community is being disproportionately affected by the coronavirus relative to its share of the population. The Latino community, which makes up 9.2% of the state’s population, accounts for 45.0% of the state’s COVID-19 cases and 11.7% of the deaths.
Emporia City, an independent city surrounded by Greensville County, has the highest rate of COVID-19 deaths in the state, at 279 deaths per 100,000 residents. Its population is 69.7% Black.
[in-text-ad]
47. Washington
> Community w/ highest death-to-pop. ratio: American Indian and Alaska Native (1.1% of pop.)
> AIAN share of COVID-19 infections: 1.7%
> AIAN share of COVID-19 deaths: 1.2%
> County with most COVID-19 deaths: Yakima County (76 per 100,000 county residents)
> Yakima County population: White (43.7%); Black (0.8%); AIAN (3.6%); Asian (0.9%); NHPI (0.1%); Hispanic (48.9%)
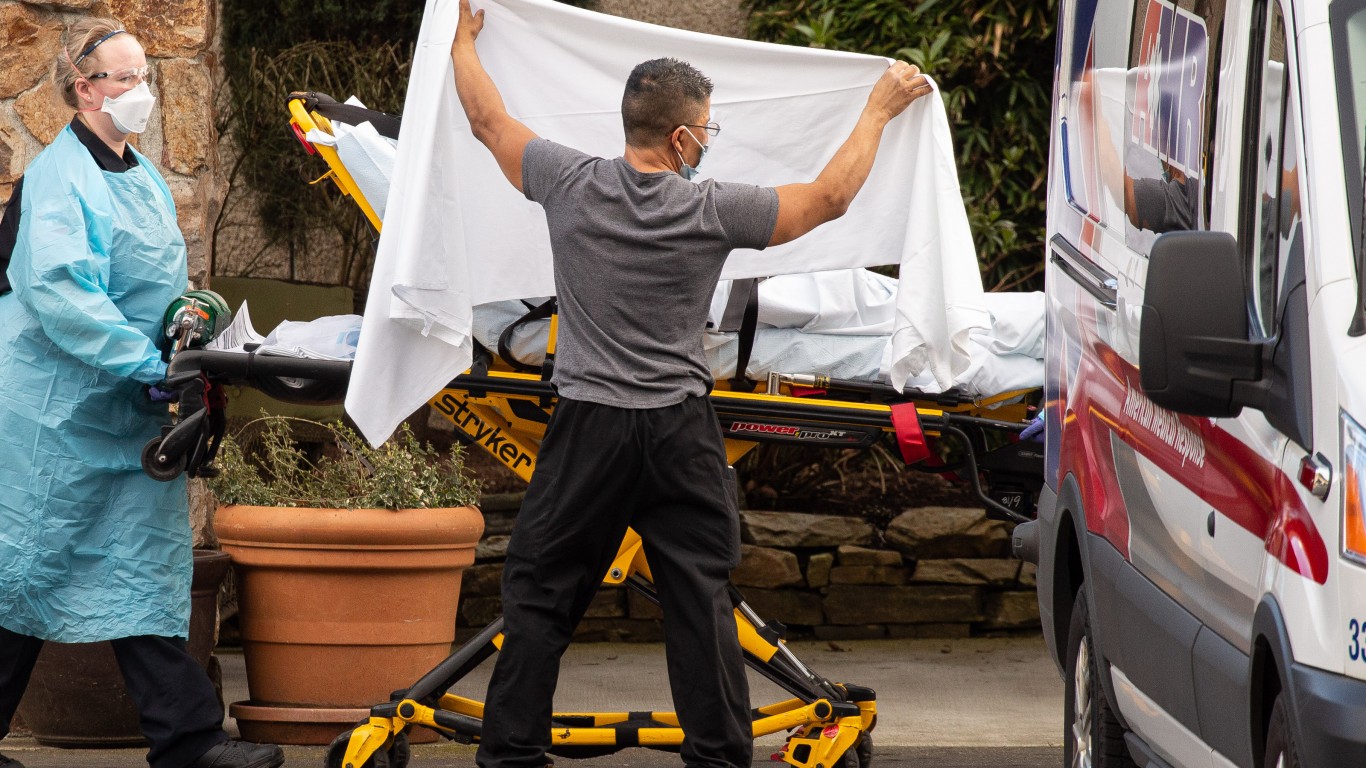
The first U.S. case of COVID-19 was confirmed in Washington state on January 21. The state had the highest number of confirmed cases and the highest number of deaths until mid-March, when New York became the epicenter of the outbreak in the U.S. Until recently, it appeared that Washington had managed to subdue the coronavirus, but the number of new cases has been trending upward over the past month, with the state reporting over 1,000 new cases on some days.
Many of the racial and ethnic groups in Washington have been significantly affected by COVID-19. Black residents make up 3.6% of the state’s population but account for 5.7% of COVID-19 infections and 3.5% of deaths. Latino residents represent 12.5% of the population but account for 46.0% of infections and 13.4% of the deaths. Hawaiian Natives and Pacific Islanders represent 0.6% of the population but account for 3.1% of infections and 1.0% of the deaths.

48. West Virginia
> Community w/ highest death-to-pop. ratio: Black or African American (3.6% of pop.)
> Black share of COVID-19 infections: 8.2%
> Black share of COVID-19 deaths: 4.9%
> County with most COVID-19 deaths: Jackson County (62 per 100,000 county residents)
> Jackson County population: White (97.0%); Black (0.1%); AIAN (0.8%); Asian (0.3%); NHPI (0.0%); Hispanic (0.5%)
West Virginia appeared to have reached a stable state with COVID-19 cases, with reports of new cases below 75 each day, and generally much lower, from April 16 to July 5. But on July 6 and 7 the number of cases spiked at 160.
Although Black residents make up only 3.6% of West Virginia’s population, they account for an 8.2% share of the coronavirus known infections. Black residents account for 4.9% of COVID-19 deaths in the state.
49. Wisconsin
> Community w/ highest death-to-pop. ratio: Black or African American (6.3% of pop.)
> Black share of COVID-19 infections: 20.5%
> Black share of COVID-19 deaths: 24.1%
> County with most COVID-19 deaths: Milwaukee County (42 per 100,000 county residents)
> Milwaukee County population: White (51.7%); Black (26.1%); AIAN (0.5%); Asian (4.2%); NHPI (0.0%); Hispanic (14.7%)
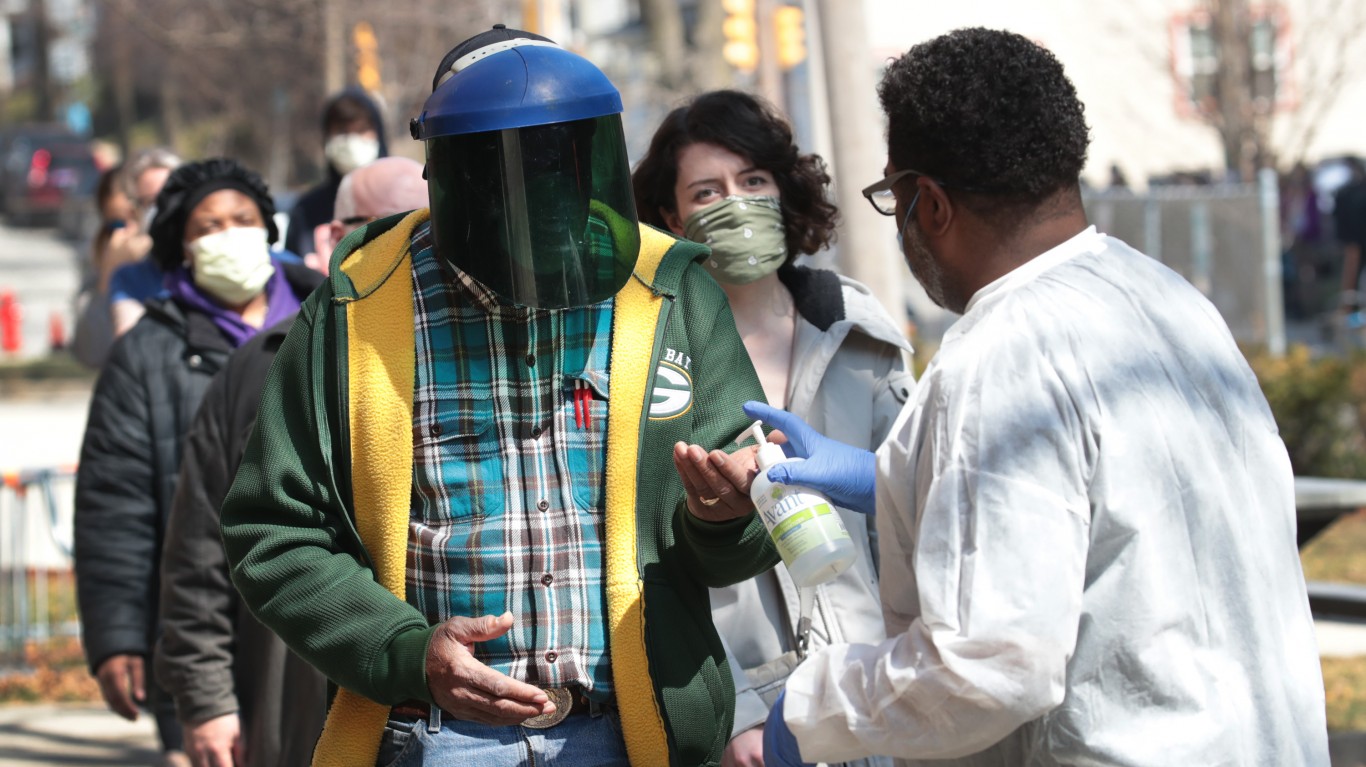
Confirmed coronavirus cases have been surging in Wisconsin with new infections reaching above 900 on three different days over the past week. Compared to its proportion of the state population, the Black community has seen three to four times as many positive tests and deaths. Black residents represent 6.3% of Wisconsin’s population but account for a 20.5% share of positive COVID-19 tests and represent 24.1% of the coronavirus deaths in the state.
Milwaukee County, which is 26.1% Black, has 41.7 deaths per 100,000 people. As a whole, the state has 14.1 deaths per 100,000 people.
[in-text-ad-2]

50. Wyoming
> Community w/ highest death-to-pop. ratio: American Indian and Alaska Native (2.2% of pop.)
> AIAN share of COVID-19 infections: 22.9%
> AIAN share of COVID-19 deaths: 45.0%
> County with most COVID-19 deaths: Washakie County (62 per 100,000 county residents)
> Washakie County population: White (82.0%); Black (0.0%); AIAN (0.4%); Asian (0.0%); NHPI (0.0%); Hispanic (14.2%)
Wyoming, the nation’s least populous state, is seeing an upward trend in the number of COVID-19 daily infections, with more than 40 new cases on most days in the past week.
American Indians and Alaska Natives account for a much larger share of COVID-19 infections and deaths than their share of the state’s population. Although they represent 2.2% of the state’s residents, they account for 22.9% of infections and 45.0% of the deaths. Latino residents make up 9.8% of the population but account for 16.1% of COVID-19 infections and 10% of the deaths.
Methodology
To determine how COVID-19 has disproportionately been affecting minority communities, 24/7 Wall St. analyzed data on COVID-19 infections and deaths by race and ethnicity. We identified the most affected race and ethnicity in every state by comparing each group’s share of total COVID-19 deaths in the state with its share of the state total population and finding the highest death-to-population ratio of any racial identity. Only races that make up at least 1% of the population were compared.
Data on COVID-19 infections and deaths by state came from The COVID Tracking Project at The Atlantic magazine and are current as of July 12, 2020. The number of COVID-19 deaths by race were calculated as a percentage of all reported COVID-19 deaths with known race. Data on population by race came from the U.S. Census Bureau’s 2018 American Community Survey and are five-year estimates for 2018. Supplemental data on income and poverty also came from the 2018 ACS. County-level COVID-19 data came from various state and local health departments and are current as of July 15, 2020.
There are other important risk factors for COVID-19 mortality that vary by race and Hispanic origin that are not accounted for, such as age. The age distribution of the population and of COVID-19 deaths may vary between race and Hispanic origin groups.
Retirement planning doesn’t have to feel overwhelming. The key is finding expert guidance—and SmartAsset’s simple quiz makes it easier than ever for you to connect with a vetted financial advisor.
Here’s how it works:
Why wait? Start building the retirement you’ve always dreamed of. Click here to get started today!
Thank you for reading! Have some feedback for us?
Contact the 24/7 Wall St. editorial team.