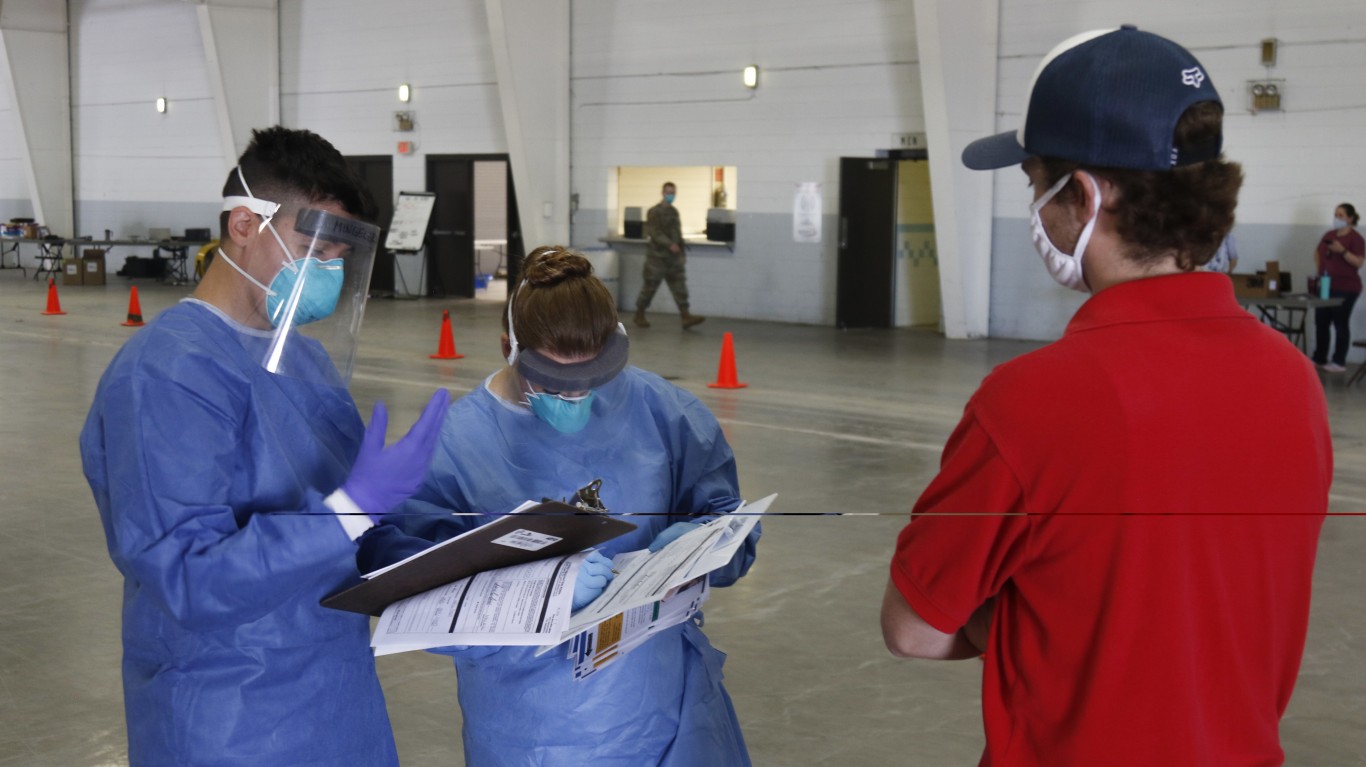
According to the projections of one organization, the U.S. will reach 310,000 COVID-19-related deaths by the end of 2020. This estimate, which comes from the Institute for Health Metrics and Evaluation, is significantly higher than the organization’s early June forecast of 135,100 deaths by the end of 2020. The IHME took into account in its latest projections the upcoming school year and the increase in the number of Americans returning to work.
24/7 Wall St. reviewed projections from the Institute for Health Metrics and Evaluation — an independent global health research center at the University of Washington — on the estimated peak COVID-19 dates for every state, both in terms of the total number of estimated active infections and the total number of hospital beds needed to treat COVID-19 patients.
When the IHME released its projections on May 29, at a time when the spread of COVID-19 appeared to be slowing across the country, the institute estimated that every state but one had hit its peak on or before that date. Based on the revised round of projections released on Aug. 21, however, 36 states have not yet reached their peaks for active infections, and 30 have not yet reached peak hospital bed usage. Notably, there are 15 states that will not reach peak cases until at least Dec. 1.
Many of the states that have yet to reach peak dates are those where the average number of daily new cases dramatically increased throughout the summer, like Texas, Georgia and Nevada. There are also a large number of states that are just starting to see significant increases in case counts, such as Hawaii, North Dakota, and South Dakota, and will not peak until at least the winter.
In Hawaii, for example, the number of new cases per 100,000 jumped from 10 a day in the week ending Aug. 9 to 14 a day in the week ending Aug. 23, the largest increase of any state. The IMHE projects that Hawaii will not reach peak cases or hospital bed usage until Dec. 1 or later. These are the states where the virus spread is slowing (and where it’s still getting worse).
Click here to see COVID-19 peak dates for every state
Alabama
> Est. peak date, active infections: Nov. 6, 2020 (est. 7,199 active infections)
> Est. peak date, hospital beds needed: Nov. 21, 2020 (est. 1,418 beds needed)
> Date of first known case: Mar. 13, 2020
> Avg. new daily cases for week ending Aug. 23: 15 per 100,000 people — 17th most
> Cumulative confirmed COVID-19 cases as of Aug. 23: 2,252 per 100,000 people — 6th most (total: 110,094)
> COVID-19 related deaths as of Aug. 23: 40 per 100,000 people — 18th most (total: 1,944)
[in-text-ad]

Alaska
> Est. peak date, active infections: Mar. 16, 2020 (est. 69 active infections)
> Est. peak date, hospital beds needed: Apr. 4, 2020 (est. 22 beds needed)
> Date of first known case: Mar. 12, 2020
> Avg. new daily cases for week ending Aug. 23: 11 per 100,000 people — 22nd fewest
> Cumulative confirmed COVID-19 cases as of Aug. 23: 754 per 100,000 people — 9th fewest (total: 5,558)
> COVID-19 related deaths as of Aug. 23: 4 per 100,000 people — 2nd fewest (total: 32)
Arizona
> Est. peak date, active infections: Nov. 7, 2020 (est. 10,975 active infections)
> Est. peak date, hospital beds needed: Nov. 21, 2020 (est. 2,065 beds needed)
> Date of first known case: Jan. 26, 2020
> Avg. new daily cases for week ending Aug. 23: 11 per 100,000 people — 24th fewest
> Cumulative confirmed COVID-19 cases as of Aug. 23: 2,762 per 100,000 people — 3rd most (total: 198,103)
> COVID-19 related deaths as of Aug. 23: 67 per 100,000 people — 9th most (total: 4,771)

Arkansas
> Est. peak date, active infections: Nov. 6, 2020 (est. 4,884 active infections)
> Est. peak date, hospital beds needed: Nov. 21, 2020 (est. 1,866 beds needed)
> Date of first known case: Mar. 11, 2020
> Avg. new daily cases for week ending Aug. 23: 16 per 100,000 people — 14th most
> Cumulative confirmed COVID-19 cases as of Aug. 23: 1,877 per 100,000 people — 14th most (total: 56,574)
> COVID-19 related deaths as of Aug. 23: 23 per 100,000 people — 18th fewest (total: 687)
[in-text-ad-2]

California
> Est. peak date, active infections: Oct. 19, 2020 (est. 61,039 active infections)
> Est. peak date, hospital beds needed: Nov. 4, 2020 (est. 16,465 beds needed)
> Date of first known case: Jan. 25, 2020
> Avg. new daily cases for week ending Aug. 23: 19 per 100,000 people — 10th most
> Cumulative confirmed COVID-19 cases as of Aug. 23: 1,678 per 100,000 people — 21st most (total: 663,669)
> COVID-19 related deaths as of Aug. 23: 31 per 100,000 people — 24th fewest (total: 12,134)

Colorado
> Est. peak date, active infections: Dec. 1, 2020 or later (est. 6,891 active infections)
> Est. peak date, hospital beds needed: Apr. 26, 2020 (est. 956 beds needed)
> Date of first known case: Mar. 5, 2020
> Avg. new daily cases for week ending Aug. 23: 5 per 100,000 people — 8th fewest
> Cumulative confirmed COVID-19 cases as of Aug. 23: 968 per 100,000 people — 12th fewest (total: 55,143)
> COVID-19 related deaths as of Aug. 23: 34 per 100,000 people — 23rd most (total: 1,918)
[in-text-ad]
Connecticut
> Est. peak date, active infections: Apr. 4, 2020 (est. 10,317 active infections)
> Est. peak date, hospital beds needed: Apr. 24, 2020 (est. 3,167 beds needed)
> Date of first known case: Mar. 8, 2020
> Avg. new daily cases for week ending Aug. 23: 3 per 100,000 people — 5th fewest
> Cumulative confirmed COVID-19 cases as of Aug. 23: 1,442 per 100,000 people — 25th most (total: 51,519)
> COVID-19 related deaths as of Aug. 23: 125 per 100,000 people — 4th most (total: 4,460)
Delaware
> Est. peak date, active infections: Apr. 16, 2020 (est. 1,105 active infections)
> Est. peak date, hospital beds needed: May 6, 2020 (est. 347 beds needed)
> Date of first known case: Mar. 11, 2020
> Avg. new daily cases for week ending Aug. 23: 10 per 100,000 people — 20th fewest
> Cumulative confirmed COVID-19 cases as of Aug. 23: 1,747 per 100,000 people — 16th most (total: 16,895)
> COVID-19 related deaths as of Aug. 23: 62 per 100,000 people — 10th most (total: 600)

Florida
> Est. peak date, active infections: Aug. 24, 2020 (est. 20,687 active infections)
> Est. peak date, hospital beds needed: Sep. 6, 2020 (est. 7,756 beds needed)
> Date of first known case: Mar. 1, 2020
> Avg. new daily cases for week ending Aug. 23: 22 per 100,000 people — 6th most
> Cumulative confirmed COVID-19 cases as of Aug. 23: 2,820 per 100,000 people — 2nd most (total: 600,571)
> COVID-19 related deaths as of Aug. 23: 49 per 100,000 people — 15th most (total: 10,462)
[in-text-ad-2]
Georgia
> Est. peak date, active infections: Sep. 4, 2020 (est. 15,261 active infections)
> Est. peak date, hospital beds needed: Sep. 18, 2020 (est. 5,250 beds needed)
> Date of first known case: Mar. 2, 2020
> Avg. new daily cases for week ending Aug. 23: 25 per 100,000 people — 2nd most
> Cumulative confirmed COVID-19 cases as of Aug. 23: 2,414 per 100,000 people — 5th most (total: 253,949)
> COVID-19 related deaths as of Aug. 23: 49 per 100,000 people — 16th most (total: 5,132)

Hawaii
> Est. peak date, active infections: Dec. 1, 2020 or later (est. 933 active infections)
> Est. peak date, hospital beds needed: Dec. 1, 2020 or later (est. 336 beds needed)
> Date of first known case: Mar. 6, 2020
> Avg. new daily cases for week ending Aug. 23: 14 per 100,000 people — 19th most
> Cumulative confirmed COVID-19 cases as of Aug. 23: 447 per 100,000 people — 3rd fewest (total: 6,356)
> COVID-19 related deaths as of Aug. 23: 3 per 100,000 people — the fewest (total: 47)
[in-text-ad]

Idaho
> Est. peak date, active infections: Nov. 20, 2020 (est. 3,383 active infections)
> Est. peak date, hospital beds needed: Dec. 1, 2020 or later (est. 784 beds needed)
> Date of first known case: Mar. 13, 2020
> Avg. new daily cases for week ending Aug. 23: 20 per 100,000 people — 8th most
> Cumulative confirmed COVID-19 cases as of Aug. 23: 1,702 per 100,000 people — 19th most (total: 29,853)
> COVID-19 related deaths as of Aug. 23: 18 per 100,000 people — 11th fewest (total: 307)

Illinois
> Est. peak date, active infections: Dec. 1, 2020 or later (est. 19,869 active infections)
> Est. peak date, hospital beds needed: May 9, 2020 (est. 3,925 beds needed)
> Date of first known case: Jan. 24, 2020
> Avg. new daily cases for week ending Aug. 23: 15 per 100,000 people — 18th most
> Cumulative confirmed COVID-19 cases as of Aug. 23: 1,728 per 100,000 people — 17th most (total: 220,178)
> COVID-19 related deaths as of Aug. 23: 62 per 100,000 people — 11th most (total: 7,880)
Indiana
> Est. peak date, active infections: Nov. 10, 2020 (est. 10,983 active infections)
> Est. peak date, hospital beds needed: Nov. 25, 2020 (est. 2,822 beds needed)
> Date of first known case: Mar. 6, 2020
> Avg. new daily cases for week ending Aug. 23: 12 per 100,000 people — 24th most
> Cumulative confirmed COVID-19 cases as of Aug. 23: 1,284 per 100,000 people — 22nd fewest (total: 85,932)
> COVID-19 related deaths as of Aug. 23: 45 per 100,000 people — 17th most (total: 3,003)
[in-text-ad-2]
Iowa
> Est. peak date, active infections: Nov. 4, 2020 (est. 4,541 active infections)
> Est. peak date, hospital beds needed: Nov. 19, 2020 (est. 1,167 beds needed)
> Date of first known case: Mar. 8, 2020
> Avg. new daily cases for week ending Aug. 23: 17 per 100,000 people — 11th most
> Cumulative confirmed COVID-19 cases as of Aug. 23: 1,779 per 100,000 people — 15th most (total: 56,157)
> COVID-19 related deaths as of Aug. 23: 33 per 100,000 people — 24th most (total: 1,035)
Kansas
> Est. peak date, active infections: Nov. 26, 2020 (est. 6,139 active infections)
> Est. peak date, hospital beds needed: Dec. 1, 2020 or later (est. 1,274 beds needed)
> Date of first known case: Mar. 7, 2020
> Avg. new daily cases for week ending Aug. 23: 16 per 100,000 people — 15th most
> Cumulative confirmed COVID-19 cases as of Aug. 23: 1,266 per 100,000 people — 20th fewest (total: 36,856)
> COVID-19 related deaths as of Aug. 23: 14 per 100,000 people — 10th fewest (total: 419)
[in-text-ad]
Kentucky
> Est. peak date, active infections: Nov. 19, 2020 (est. 7,676 active infections)
> Est. peak date, hospital beds needed: Dec. 1, 2020 or later (est. 1,927 beds needed)
> Date of first known case: Mar. 6, 2020
> Avg. new daily cases for week ending Aug. 23: 13 per 100,000 people — 21st most
> Cumulative confirmed COVID-19 cases as of Aug. 23: 964 per 100,000 people — 11th fewest (total: 43,066)
> COVID-19 related deaths as of Aug. 23: 20 per 100,000 people — 17th fewest (total: 872)

Louisiana
> Est. peak date, active infections: Mar. 26, 2020 (est. 7,903 active infections)
> Est. peak date, hospital beds needed: Apr. 16, 2020 (est. 2,347 beds needed)
> Date of first known case: Mar. 9, 2020
> Avg. new daily cases for week ending Aug. 23: 17 per 100,000 people — 13th most
> Cumulative confirmed COVID-19 cases as of Aug. 23: 3,067 per 100,000 people — the most (total: 142,943)
> COVID-19 related deaths as of Aug. 23: 99 per 100,000 people — 5th most (total: 4,605)

Maine
> Est. peak date, active infections: Mar. 31, 2020 (est. 196 active infections)
> Est. peak date, hospital beds needed: Apr. 19, 2020 (est. 54 beds needed)
> Date of first known case: Mar. 12, 2020
> Avg. new daily cases for week ending Aug. 23: 2 per 100,000 people — 4th fewest
> Cumulative confirmed COVID-19 cases as of Aug. 23: 324 per 100,000 people — 2nd fewest (total: 4,335)
> COVID-19 related deaths as of Aug. 23: 10 per 100,000 people — 6th fewest (total: 131)
[in-text-ad-2]

Maryland
> Est. peak date, active infections: Dec. 1, 2020 or later (est. 12,956 active infections)
> Est. peak date, hospital beds needed: Apr. 29, 2020 (est. 1,769 beds needed)
> Date of first known case: Mar. 5, 2020
> Avg. new daily cases for week ending Aug. 23: 10 per 100,000 people — 19th fewest
> Cumulative confirmed COVID-19 cases as of Aug. 23: 1,723 per 100,000 people — 18th most (total: 104,102)
> COVID-19 related deaths as of Aug. 23: 61 per 100,000 people — 12th most (total: 3,691)

Massachusetts
> Est. peak date, active infections: Apr. 8, 2020 (est. 18,356 active infections)
> Est. peak date, hospital beds needed: Apr. 27, 2020 (est. 4,107 beds needed)
> Date of first known case: Feb. 1, 2020
> Avg. new daily cases for week ending Aug. 23: N/A
> Cumulative confirmed COVID-19 cases as of Aug. 22: 1,678 per 100,000 people — 20th most (total: 115,850)
> COVID-19 related deaths as of Aug. 22: 126 per 100,000 people — 3rd most (total: 8,690)
[in-text-ad]
Michigan
> Est. peak date, active infections: Mar. 29, 2020 (est. 15,820 active infections)
> Est. peak date, hospital beds needed: Apr. 18, 2020 (est. 4,802 beds needed)
> Date of first known case: Mar. 10, 2020
> Avg. new daily cases for week ending Aug. 23: 7 per 100,000 people — 13th fewest
> Cumulative confirmed COVID-19 cases as of Aug. 23: 1,069 per 100,000 people — 15th fewest (total: 106,808)
> COVID-19 related deaths as of Aug. 23: 67 per 100,000 people — 8th most (total: 6,659)

Minnesota
> Est. peak date, active infections: Oct. 29, 2020 (est. 9,343 active infections)
> Est. peak date, hospital beds needed: Nov. 12, 2020 (est. 1,714 beds needed)
> Date of first known case: Mar. 6, 2020
> Avg. new daily cases for week ending Aug. 23: 11 per 100,000 people — 23rd fewest
> Cumulative confirmed COVID-19 cases as of Aug. 23: 1,240 per 100,000 people — 19th fewest (total: 69,584)
> COVID-19 related deaths as of Aug. 23: 31 per 100,000 people — 25th fewest (total: 1,767)
Mississippi
> Est. peak date, active infections: Jul. 19, 2020 (est. 3,458 active infections)
> Est. peak date, hospital beds needed: Aug. 7, 2020 (est. 787 beds needed)
> Date of first known case: Mar. 11, 2020
> Avg. new daily cases for week ending Aug. 23: 25 per 100,000 people — the most
> Cumulative confirmed COVID-19 cases as of Aug. 23: 2,608 per 100,000 people — 4th most (total: 77,894)
> COVID-19 related deaths as of Aug. 23: 75 per 100,000 people — 7th most (total: 2,240)
[in-text-ad-2]

Missouri
> Est. peak date, active infections: Nov. 30, 2020 (est. 11,896 active infections)
> Est. peak date, hospital beds needed: Dec. 1, 2020 or later (est. 1,737 beds needed)
> Date of first known case: Mar. 7, 2020
> Avg. new daily cases for week ending Aug. 23: 19 per 100,000 people — 9th most
> Cumulative confirmed COVID-19 cases as of Aug. 23: 1,225 per 100,000 people — 18th fewest (total: 75,050)
> COVID-19 related deaths as of Aug. 23: 23 per 100,000 people — 20th fewest (total: 1,426)

Montana
> Est. peak date, active infections: Dec. 1, 2020 or later (est. 391 active infections)
> Est. peak date, hospital beds needed: Aug. 2, 2020 (est. 77 beds needed)
> Date of first known case: Mar. 13, 2020
> Avg. new daily cases for week ending Aug. 23: 9 per 100,000 people — 18th fewest
> Cumulative confirmed COVID-19 cases as of Aug. 23: 605 per 100,000 people — 7th fewest (total: 6,429)
> COVID-19 related deaths as of Aug. 23: 8 per 100,000 people — 4th fewest (total: 90)
[in-text-ad]
Nebraska
> Est. peak date, active infections: Nov. 21, 2020 (est. 3,714 active infections)
> Est. peak date, hospital beds needed: Dec. 1, 2020 or later (est. 1,066 beds needed)
> Date of first known case: Feb. 17, 2020
> Avg. new daily cases for week ending Aug. 23: 13 per 100,000 people — 22nd most
> Cumulative confirmed COVID-19 cases as of Aug. 23: 1,647 per 100,000 people — 22nd most (total: 31,780)
> COVID-19 related deaths as of Aug. 23: 19 per 100,000 people — 16th fewest (total: 376)

Nevada
> Est. peak date, active infections: Sep. 26, 2020 (est. 5,020 active infections)
> Est. peak date, hospital beds needed: Oct. 10, 2020 (est. 1,372 beds needed)
> Date of first known case: Mar. 5, 2020
> Avg. new daily cases for week ending Aug. 23: 23 per 100,000 people — 4th most
> Cumulative confirmed COVID-19 cases as of Aug. 23: 2,162 per 100,000 people — 9th most (total: 65,601)
> COVID-19 related deaths as of Aug. 23: 39 per 100,000 people — 20th most (total: 1,197)

New Hampshire
> Est. peak date, active infections: Apr. 26, 2020 (est. 629 active infections)
> Est. peak date, hospital beds needed: May 14, 2020 (est. 83 beds needed)
> Date of first known case: Mar. 2, 2020
> Avg. new daily cases for week ending Aug. 23: 1 per 100,000 people — 3rd fewest
> Cumulative confirmed COVID-19 cases as of Aug. 23: 524 per 100,000 people — 5th fewest (total: 7,107)
> COVID-19 related deaths as of Aug. 23: 32 per 100,000 people — 25th most (total: 429)
[in-text-ad-2]

New Jersey
> Est. peak date, active infections: Apr. 1, 2020 (est. 34,973 active infections)
> Est. peak date, hospital beds needed: Apr. 22, 2020 (est. 10,868 beds needed)
> Date of first known case: Mar. 4, 2020
> Avg. new daily cases for week ending Aug. 23: 3 per 100,000 people — 7th fewest
> Cumulative confirmed COVID-19 cases as of Aug. 23: 2,127 per 100,000 people — 10th most (total: 189,494)
> COVID-19 related deaths as of Aug. 23: 179 per 100,000 people — the most (total: 15,946)
New Mexico
> Est. peak date, active infections: Dec. 1, 2020 or later (est. 4,211 active infections)
> Est. peak date, hospital beds needed: Dec. 1, 2020 or later (est. 523 beds needed)
> Date of first known case: Mar. 11, 2020
> Avg. new daily cases for week ending Aug. 23: 7 per 100,000 people — 12th fewest
> Cumulative confirmed COVID-19 cases as of Aug. 23: 1,164 per 100,000 people — 16th fewest (total: 24,396)
> COVID-19 related deaths as of Aug. 23: 36 per 100,000 people — 21st most (total: 745)
[in-text-ad]

New York
> Est. peak date, active infections: Mar. 24, 2020 (est. 102,754 active infections)
> Est. peak date, hospital beds needed: Apr. 13, 2020 (est. 29,850 beds needed)
> Date of first known case: Mar. 1, 2020
> Avg. new daily cases for week ending Aug. 23: 3 per 100,000 people — 6th fewest
> Cumulative confirmed COVID-19 cases as of Aug. 23: 2,199 per 100,000 people — 8th most (total: 429,737)
> COVID-19 related deaths as of Aug. 23: 129 per 100,000 people — 2nd most (total: 25,288)
North Carolina
> Est. peak date, active infections: Nov. 7, 2020 (est. 20,061 active infections)
> Est. peak date, hospital beds needed: Nov. 24, 2020 (est. 5,191 beds needed)
> Date of first known case: Mar. 3, 2020
> Avg. new daily cases for week ending Aug. 23: 13 per 100,000 people — 23rd most
> Cumulative confirmed COVID-19 cases as of Aug. 23: 1,494 per 100,000 people — 24th most (total: 155,113)
> COVID-19 related deaths as of Aug. 23: 24 per 100,000 people — 21st fewest (total: 2,531)
North Dakota
> Est. peak date, active infections: Dec. 1, 2020 or later (est. 705 active infections)
> Est. peak date, hospital beds needed: Dec. 1, 2020 or later (est. 112 beds needed)
> Date of first known case: Mar. 11, 2020
> Avg. new daily cases for week ending Aug. 23: 20 per 100,000 people — 7th most
> Cumulative confirmed COVID-19 cases as of Aug. 23: 1,299 per 100,000 people — 23rd fewest (total: 9,876)
> COVID-19 related deaths as of Aug. 23: 18 per 100,000 people — 12th fewest (total: 136)
[in-text-ad-2]
Ohio
> Est. peak date, active infections: Dec. 1, 2020 or later (est. 10,371 active infections)
> Est. peak date, hospital beds needed: Dec. 1, 2020 or later (est. 1,204 beds needed)
> Date of first known case: Mar. 9, 2020
> Avg. new daily cases for week ending Aug. 23: 8 per 100,000 people — 16th fewest
> Cumulative confirmed COVID-19 cases as of Aug. 23: 982 per 100,000 people — 13th fewest (total: 114,802)
> COVID-19 related deaths as of Aug. 23: 34 per 100,000 people — 22nd most (total: 3,978)
Oklahoma
> Est. peak date, active infections: Nov. 23, 2020 (est. 7,803 active infections)
> Est. peak date, hospital beds needed: Dec. 1, 2020 or later (est. 1,946 beds needed)
> Date of first known case: Mar. 6, 2020
> Avg. new daily cases for week ending Aug. 23: 17 per 100,000 people — 12th most
> Cumulative confirmed COVID-19 cases as of Aug. 23: 1,348 per 100,000 people — 25th fewest (total: 53,165)
> COVID-19 related deaths as of Aug. 23: 18 per 100,000 people — 14th fewest (total: 726)
[in-text-ad]

Oregon
> Est. peak date, active infections: Nov. 9, 2020 (est. 7,385 active infections)
> Est. peak date, hospital beds needed: Nov. 27, 2020 (est. 2,736 beds needed)
> Date of first known case: Feb. 28, 2020
> Avg. new daily cases for week ending Aug. 23: 6 per 100,000 people — 11th fewest
> Cumulative confirmed COVID-19 cases as of Aug. 23: 595 per 100,000 people — 6th fewest (total: 24,937)
> COVID-19 related deaths as of Aug. 23: 10 per 100,000 people — 8th fewest (total: 417)

Pennsylvania
> Est. peak date, active infections: Nov. 3, 2020 (est. 18,034 active infections)
> Est. peak date, hospital beds needed: Nov. 18, 2020 (est. 4,782 beds needed)
> Date of first known case: Mar. 6, 2020
> Avg. new daily cases for week ending Aug. 23: 5 per 100,000 people — 9th fewest
> Cumulative confirmed COVID-19 cases as of Aug. 23: 1,008 per 100,000 people — 14th fewest (total: 129,048)
> COVID-19 related deaths as of Aug. 23: 59 per 100,000 people — 13th most (total: 7,578)
Rhode Island
> Est. peak date, active infections: May 3, 2020 (est. 1,457 active infections)
> Est. peak date, hospital beds needed: May 21, 2020 (est. 465 beds needed)
> Date of first known case: Mar. 1, 2020
> Avg. new daily cases for week ending Aug. 23: 9 per 100,000 people — 17th fewest
> Cumulative confirmed COVID-19 cases as of Aug. 23: 1,988 per 100,000 people — 13th most (total: 21,022)
> COVID-19 related deaths as of Aug. 23: 97 per 100,000 people — 6th most (total: 1,030)
[in-text-ad-2]

South Carolina
> Est. peak date, active infections: Dec. 1, 2020 or later (est. 6,930 active infections)
> Est. peak date, hospital beds needed: Jul. 31, 2020 (est. 1,529 beds needed)
> Date of first known case: Mar. 6, 2020
> Avg. new daily cases for week ending Aug. 23: 16 per 100,000 people — 16th most
> Cumulative confirmed COVID-19 cases as of Aug. 23: 2,203 per 100,000 people — 7th most (total: 111,988)
> COVID-19 related deaths as of Aug. 23: 49 per 100,000 people — 14th most (total: 2,504)

South Dakota
> Est. peak date, active infections: Dec. 1, 2020 or later (est. 496 active infections)
> Est. peak date, hospital beds needed: Dec. 1, 2020 or later (est. 157 beds needed)
> Date of first known case: Mar. 10, 2020
> Avg. new daily cases for week ending Aug. 23: 14 per 100,000 people — 20th most
> Cumulative confirmed COVID-19 cases as of Aug. 23: 1,278 per 100,000 people — 21st fewest (total: 11,276)
> COVID-19 related deaths as of Aug. 23: 18 per 100,000 people — 13th fewest (total: 161)
[in-text-ad]

Tennessee
> Est. peak date, active infections: Nov. 7, 2020 (est. 9,861 active infections)
> Est. peak date, hospital beds needed: Nov. 22, 2020 (est. 3,420 beds needed)
> Date of first known case: Mar. 5, 2020
> Avg. new daily cases for week ending Aug. 23: 22 per 100,000 people — 5th most
> Cumulative confirmed COVID-19 cases as of Aug. 23: 2,099 per 100,000 people — 11th most (total: 142,083)
> COVID-19 related deaths as of Aug. 23: 23 per 100,000 people — 19th fewest (total: 1,563)
Texas
> Est. peak date, active infections: Aug. 25, 2020 (est. 41,244 active infections)
> Est. peak date, hospital beds needed: Sep. 8, 2020 (est. 11,319 beds needed)
> Date of first known case: Feb. 12, 2020
> Avg. new daily cases for week ending Aug. 23: 24 per 100,000 people — 3rd most
> Cumulative confirmed COVID-19 cases as of Aug. 23: 2,012 per 100,000 people — 12th most (total: 577,537)
> COVID-19 related deaths as of Aug. 23: 40 per 100,000 people — 19th most (total: 11,370)
Utah
> Est. peak date, active infections: Dec. 1, 2020 or later (est. 6,845 active infections)
> Est. peak date, hospital beds needed: Dec. 1, 2020 or later (est. 1,830 beds needed)
> Date of first known case: Feb. 25, 2020
> Avg. new daily cases for week ending Aug. 23: 11 per 100,000 people — 25th fewest
> Cumulative confirmed COVID-19 cases as of Aug. 23: 1,554 per 100,000 people — 23rd most (total: 49,115)
> COVID-19 related deaths as of Aug. 23: 12 per 100,000 people — 9th fewest (total: 385)
[in-text-ad-2]

Vermont
> Est. peak date, active infections: Mar. 30, 2020 (est. 130 active infections)
> Est. peak date, hospital beds needed: Apr. 16, 2020 (est. 42 beds needed)
> Date of first known case: Mar. 7, 2020
> Avg. new daily cases for week ending Aug. 23: 1 per 100,000 people — 2nd fewest
> Cumulative confirmed COVID-19 cases as of Aug. 23: 249 per 100,000 people — the fewest (total: 1,557)
> COVID-19 related deaths as of Aug. 23: 9 per 100,000 people — 5th fewest (total: 58)

Virginia
> Est. peak date, active infections: Dec. 1, 2020 or later (est. 3,874 active infections)
> Est. peak date, hospital beds needed: May 13, 2020 (est. 944 beds needed)
> Date of first known case: Mar. 7, 2020
> Avg. new daily cases for week ending Aug. 23: 11 per 100,000 people — 21st fewest
> Cumulative confirmed COVID-19 cases as of Aug. 23: 1,326 per 100,000 people — 24th fewest (total: 112,966)
> COVID-19 related deaths as of Aug. 23: 29 per 100,000 people — 23rd fewest (total: 2,467)
[in-text-ad]

Washington
> Est. peak date, active infections: Dec. 1, 2020 or later (est. 10,294 active infections)
> Est. peak date, hospital beds needed: Nov. 13, 2020 (est. 2,523 beds needed)
> Date of first known case: Jan. 21, 2020
> Avg. new daily cases for week ending Aug. 23: 7 per 100,000 people — 14th fewest
> Cumulative confirmed COVID-19 cases as of Aug. 23: 942 per 100,000 people — 10th fewest (total: 71,012)
> COVID-19 related deaths as of Aug. 23: 25 per 100,000 people — 22nd fewest (total: 1,863)
West Virginia
> Est. peak date, active infections: Dec. 1, 2020 or later (est. 797 active infections)
> Est. peak date, hospital beds needed: Dec. 1, 2020 or later (est. 168 beds needed)
> Date of first known case: Mar. 17, 2020
> Avg. new daily cases for week ending Aug. 23: 6 per 100,000 people — 10th fewest
> Cumulative confirmed COVID-19 cases as of Aug. 23: 513 per 100,000 people — 4th fewest (total: 9,272)
> COVID-19 related deaths as of Aug. 23: 10 per 100,000 people — 7th fewest (total: 178)
Wisconsin
> Est. peak date, active infections: Dec. 1, 2020 or later (est. 4,662 active infections)
> Est. peak date, hospital beds needed: Dec. 1, 2020 or later (est. 876 beds needed)
> Date of first known case: Feb. 5, 2020
> Avg. new daily cases for week ending Aug. 23: 12 per 100,000 people — 25th most
> Cumulative confirmed COVID-19 cases as of Aug. 23: 1,212 per 100,000 people — 17th fewest (total: 70,462)
> COVID-19 related deaths as of Aug. 23: 19 per 100,000 people — 15th fewest (total: 1,081)
[in-text-ad-2]

Wyoming
> Est. peak date, active infections: May 8, 2020 (est. 54 active infections)
> Est. peak date, hospital beds needed: May 28, 2020 (est. 21 beds needed)
> Date of first known case: Mar. 11, 2020
> Avg. new daily cases for week ending Aug. 23: 8 per 100,000 people — 15th fewest
> Cumulative confirmed COVID-19 cases as of Aug. 23: 619 per 100,000 people — 8th fewest (total: 3,579)
> COVID-19 related deaths as of Aug. 23: 6 per 100,000 people — 3rd fewest (total: 37)
The Average American Has No Idea How Much Money You Can Make Today (Sponsor)
The last few years made people forget how much banks and CD’s can pay. Meanwhile, interest rates have spiked and many can afford to pay you much more, but most are keeping yields low and hoping you won’t notice.
But there is good news. To win qualified customers, some accounts are paying almost 10x the national average! That’s an incredible way to keep your money safe and earn more at the same time. Our top pick for high yield savings accounts includes other benefits as well. You can earn up to 3.80% with a Checking & Savings Account today Sign up and get up to $300 with direct deposit. No account fees. FDIC Insured.
Click here to see how much more you could be earning on your savings today. It takes just a few minutes to open an account to make your money work for you.
Our top pick for high yield savings accounts includes other benefits as well. You can earn up to 4.00% with a Checking & Savings Account from Sofi. Sign up and get up to $300 with direct deposit. No account fees. FDIC Insured.
Thank you for reading! Have some feedback for us?
Contact the 24/7 Wall St. editorial team.


 24/7 Wall St.
 24/7 Wall St.


 24/7 Wall St.

 24/7 Wall St.




 24/7 Wall St.
