
After the U.S. set several new records for daily new COVID-19 cases in July, the spread of the virus appears to have slowed in August. Though infections are decreasing, some states have not yet seen the worst of the pandemic, according to one model. In fact, 35 states are not projected to hit their peak in terms of infections per capita until mid-September or later.
24/7 Wall St. reviewed projections from the Institute for Health Metrics and Evaluation — an independent global health research center at the University of Washington — on the estimated peak COVID-19 dates for every state, both in terms of the total number of estimated active infections and the total number of hospital beds needed to treat COVID-19 patients.
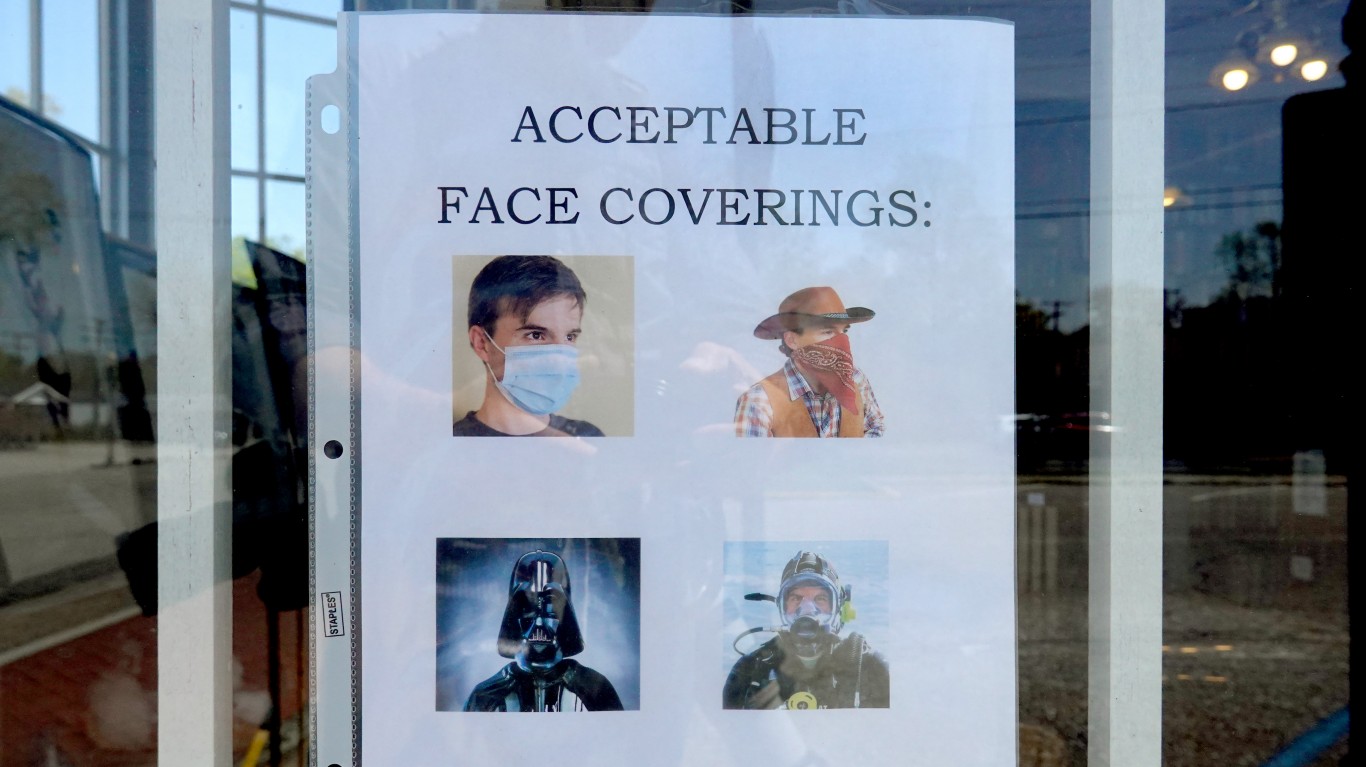
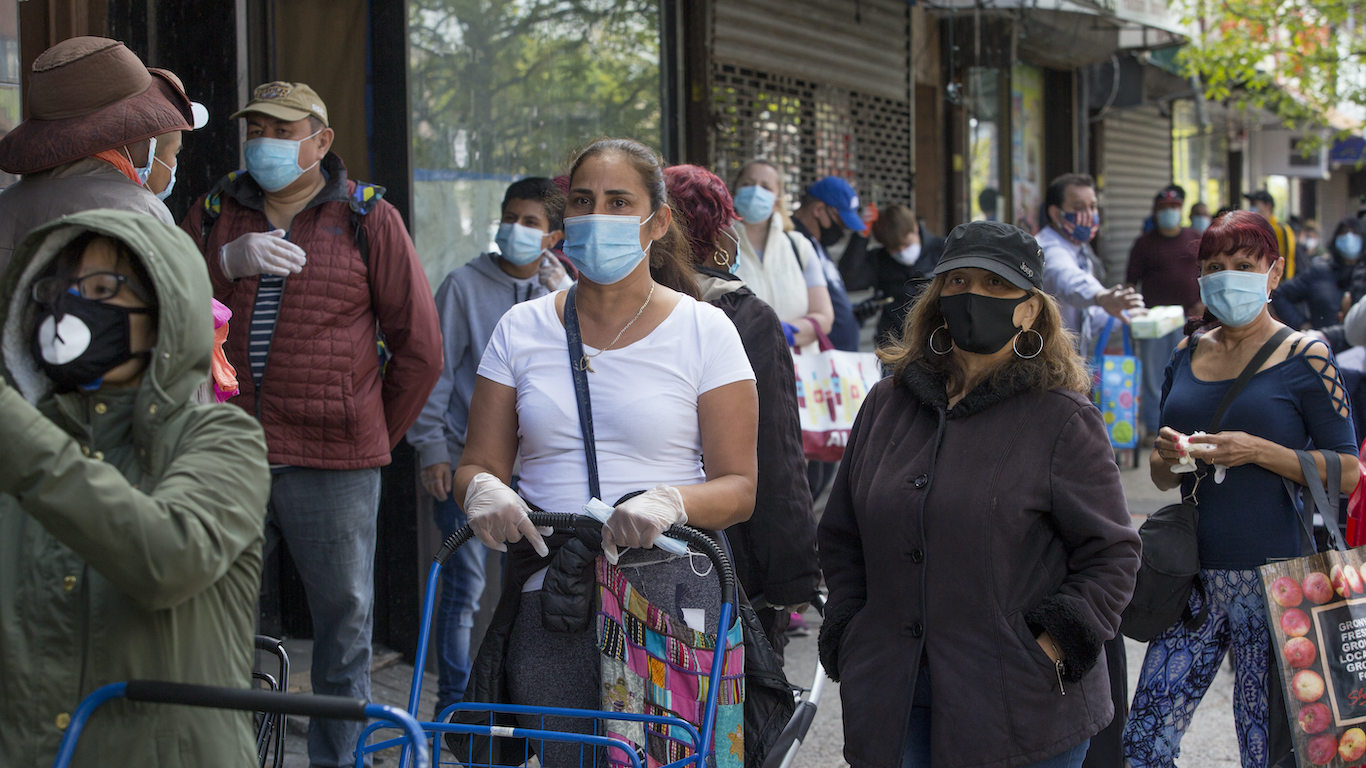
COVID-19 infections and the hospital capacity needed to treat patients are projected to increase in most states for a variety of reasons. The IHME reported that, while social distancing mandates have remained relatively unchanged in states over the past few weeks, mobility is up and mask usage has dropped to below 50%. The projections indicate that increased mask usage could reduce projected U.S. COVID-19 deaths from 317,000 to 250,000.
With no uniform federal guidelines on how to reduce the spread of the virus, states have determined their own best course of action. Some states have reported significant declines in the average number of daily new COVID-19 cases per capita last week as compared to the week before, while others have seen sharp increases. In one state, the number of confirmed cases per capita more than doubled week-over-week. These are the states where the spread of the virus is slowing, and where it is getting worse.
Click here to see COVID-19 peak dates for every state.

Alabama
> Est. peak date, active infections: Dec. 1, 2020 or later (est. 4,481 active infections)
> Est. peak date, hospital beds needed: July 28, 2020 (est. 773 beds needed)
> Date of first known case: March 13, 2020
> Avg. new daily cases for week ending Sep. 1: 39.5 per 100,000 people — the most
> Cumulative confirmed COVID-19 cases as of Sep. 1: 2,611 per 100,000 people — 5th most (total: 127,616)
> COVID-19 related deaths as of Sep. 1: 45 per 100,000 people — 18th most (total: 2,200)
[in-text-ad]

Alaska
> Est. peak date, active infections: March 16, 2020 (est. 94 active infections)
> Est. peak date, hospital beds needed: April 4, 2020 (est. 23 beds needed)
> Date of first known case: March 12, 2020
> Avg. new daily cases for week ending Sep. 1: 9.7 per 100,000 people — 21st fewest
> Cumulative confirmed COVID-19 cases as of Sep. 1: 835 per 100,000 people — 9th fewest (total: 6,160)
> COVID-19 related deaths as of Sep. 1: 5 per 100,000 people — 2nd fewest (total: 39)

Arizona
> Est. peak date, active infections: July 5, 2020 (est. 19,567 active infections)
> Est. peak date, hospital beds needed: July 24, 2020 (est. 3,027 beds needed)
> Date of first known case: Jan. 26, 2020
> Avg. new daily cases for week ending Sep. 1: 7.1 per 100,000 people — 16th fewest
> Cumulative confirmed COVID-19 cases as of Sep. 1: 2,821 per 100,000 people — 3rd most (total: 202,342)
> COVID-19 related deaths as of Sep. 1: 70 per 100,000 people — 8th most (total: 5,044)

Arkansas
> Est. peak date, active infections: Nov. 6, 2020 (est. 4,254 active infections)
> Est. peak date, hospital beds needed: Nov. 21, 2020 (est. 1,643 beds needed)
> Date of first known case: March 11, 2020
> Avg. new daily cases for week ending Sep. 1: 19.7 per 100,000 people — 9th most
> Cumulative confirmed COVID-19 cases as of Sep. 1: 2,040 per 100,000 people — 15th most (total: 61,497)
> COVID-19 related deaths as of Sep. 1: 27 per 100,000 people — 22nd fewest (total: 814)
[in-text-ad-2]

California
> Est. peak date, active infections: Nov. 3, 2020 (est. 66,037 active infections)
> Est. peak date, hospital beds needed: Nov. 26, 2020 (est. 17,782 beds needed)
> Date of first known case: Jan. 25, 2020
> Avg. new daily cases for week ending Sep. 1: 13.7 per 100,000 people — 24th most
> Cumulative confirmed COVID-19 cases as of Sep. 1: 1,789 per 100,000 people — 20th most (total: 707,797)
> COVID-19 related deaths as of Sep. 1: 33 per 100,000 people — 25th most (total: 13,018)

Colorado
> Est. peak date, active infections: Dec. 1, 2020 or later (est. 4,071 active infections)
> Est. peak date, hospital beds needed: April 25, 2020 (est. 871 beds needed)
> Date of first known case: March 5, 2020
> Avg. new daily cases for week ending Sep. 1: 5.2 per 100,000 people — 9th fewest
> Cumulative confirmed COVID-19 cases as of Sep. 1: 1,014 per 100,000 people — 11th fewest (total: 57,775)
> COVID-19 related deaths as of Sep. 1: 34 per 100,000 people — 24th most (total: 1,946)
[in-text-ad]
Connecticut
> Est. peak date, active infections: April 4, 2020 (est. 7,886 active infections)
> Est. peak date, hospital beds needed: April 23, 2020 (est. 2,188 beds needed)
> Date of first known case: March 8, 2020
> Avg. new daily cases for week ending Sep. 1: 3.8 per 100,000 people — 6th fewest
> Cumulative confirmed COVID-19 cases as of Sep. 1: 1,484 per 100,000 people — 23rd fewest (total: 53,006)
> COVID-19 related deaths as of Sep. 1: 125 per 100,000 people — 4th most (total: 4,466)

Delaware
> Est. peak date, active infections: April 16, 2020 (est. 2,189 active infections)
> Est. peak date, hospital beds needed: May 6, 2020 (est. 416 beds needed)
> Date of first known case: March 11, 2020
> Avg. new daily cases for week ending Sep. 1: 6.4 per 100,000 people — 14th fewest
> Cumulative confirmed COVID-19 cases as of Sep. 1: 1,813 per 100,000 people — 18th most (total: 17,535)
> COVID-19 related deaths as of Sep. 1: 63 per 100,000 people — 11th most (total: 605)

Florida
> Est. peak date, active infections: Oct. 10, 2020 (est. 27,665 active infections)
> Est. peak date, hospital beds needed: Oct. 24, 2020 (est. 8,485 beds needed)
> Date of first known case: March 1, 2020
> Avg. new daily cases for week ending Sep. 1: 15.3 per 100,000 people — 18th most
> Cumulative confirmed COVID-19 cases as of Sep. 1: 2,963 per 100,000 people — 2nd most (total: 631,040)
> COVID-19 related deaths as of Sep. 1: 54 per 100,000 people — 16th most (total: 11,521)
[in-text-ad-2]

Georgia
> Est. peak date, active infections: Oct. 9, 2020 (est. 19,631 active infections)
> Est. peak date, hospital beds needed: Oct. 23, 2020 (est. 5,669 beds needed)
> Date of first known case: March 2, 2020
> Avg. new daily cases for week ending Sep. 1: 20.9 per 100,000 people — 7th most
> Cumulative confirmed COVID-19 cases as of Sep. 1: 2,592 per 100,000 people — 6th most (total: 272,697)
> COVID-19 related deaths as of Sep. 1: 54 per 100,000 people — 14th most (total: 5,733)

Hawaii
> Est. peak date, active infections: Aug. 3, 2020 (est. 93 active infections)
> Est. peak date, hospital beds needed: Aug. 23, 2020 (est. 41 beds needed)
> Date of first known case: March 6, 2020
> Avg. new daily cases for week ending Sep. 1: 17.2 per 100,000 people — 12th most
> Cumulative confirmed COVID-19 cases as of Sep. 1: 596 per 100,000 people — 5th fewest (total: 8,472)
> COVID-19 related deaths as of Sep. 1: 5 per 100,000 people — the fewest (total: 70)
[in-text-ad]

Idaho
> Est. peak date, active infections: Oct. 29, 2020 (est. 2,556 active infections)
> Est. peak date, hospital beds needed: Nov. 13, 2020 (est. 569 beds needed)
> Date of first known case: March 13, 2020
> Avg. new daily cases for week ending Sep. 1: 16.3 per 100,000 people — 15th most
> Cumulative confirmed COVID-19 cases as of Sep. 1: 1,845 per 100,000 people — 17th most (total: 32,368)
> COVID-19 related deaths as of Sep. 1: 21 per 100,000 people — 16th fewest (total: 368)

Illinois
> Est. peak date, active infections: Nov. 3, 2020 (est. 24,131 active infections)
> Est. peak date, hospital beds needed: Nov. 18, 2020 (est. 5,910 beds needed)
> Date of first known case: Jan. 24, 2020
> Avg. new daily cases for week ending Sep. 1: 15.0 per 100,000 people — 19th most
> Cumulative confirmed COVID-19 cases as of Sep. 1: 1,856 per 100,000 people — 16th most (total: 236,515)
> COVID-19 related deaths as of Sep. 1: 63 per 100,000 people — 10th most (total: 8,064)
Indiana
> Est. peak date, active infections: Nov. 15, 2020 (est. 13,115 active infections)
> Est. peak date, hospital beds needed: Nov. 30, 2020 (est. 3,185 beds needed)
> Date of first known case: March 6, 2020
> Avg. new daily cases for week ending Sep. 1: 14.9 per 100,000 people — 20th most
> Cumulative confirmed COVID-19 cases as of Sep. 1: 1,418 per 100,000 people — 20th fewest (total: 94,891)
> COVID-19 related deaths as of Sep. 1: 46 per 100,000 people — 17th most (total: 3,093)
[in-text-ad-2]
Iowa
> Est. peak date, active infections: Oct. 12, 2020 (est. 4,053 active infections)
> Est. peak date, hospital beds needed: Oct. 27, 2020 (est. 1,040 beds needed)
> Date of first known case: March 8, 2020
> Avg. new daily cases for week ending Sep. 1: 31.9 per 100,000 people — 2nd most
> Cumulative confirmed COVID-19 cases as of Sep. 1: 2,072 per 100,000 people — 14th most (total: 65,397)
> COVID-19 related deaths as of Sep. 1: 36 per 100,000 people — 23rd most (total: 1,121)

Kansas
> Est. peak date, active infections: Dec. 1, 2020 or later (est. 4,032 active infections)
> Est. peak date, hospital beds needed: Dec. 1, 2020 or later (est. 692 beds needed)
> Date of first known case: March 7, 2020
> Avg. new daily cases for week ending Sep. 1: 20.4 per 100,000 people — 8th most
> Cumulative confirmed COVID-19 cases as of Sep. 1: 1,464 per 100,000 people — 22nd fewest (total: 42,612)
> COVID-19 related deaths as of Sep. 1: 15 per 100,000 people — 10th fewest (total: 446)
[in-text-ad]

Kentucky
> Est. peak date, active infections: Oct. 20, 2020 (est. 8,723 active infections)
> Est. peak date, hospital beds needed: Nov. 4, 2020 (est. 1,449 beds needed)
> Date of first known case: March 6, 2020
> Avg. new daily cases for week ending Sep. 1: 14.3 per 100,000 people — 22nd most
> Cumulative confirmed COVID-19 cases as of Sep. 1: 1,101 per 100,000 people — 14th fewest (total: 49,185)
> COVID-19 related deaths as of Sep. 1: 21 per 100,000 people — 17th fewest (total: 948)

Louisiana
> Est. peak date, active infections: March 26, 2020 (est. 9,901 active infections)
> Est. peak date, hospital beds needed: April 16, 2020 (est. 2,677 beds needed)
> Date of first known case: March 9, 2020
> Avg. new daily cases for week ending Sep. 1: 14.6 per 100,000 people — 21st most
> Cumulative confirmed COVID-19 cases as of Sep. 1: 3,195 per 100,000 people — the most (total: 148,882)
> COVID-19 related deaths as of Sep. 1: 103 per 100,000 people — 5th most (total: 4,821)

Maine
> Est. peak date, active infections: Dec. 1, 2020 or later (est. 253 active infections)
> Est. peak date, hospital beds needed: April 19, 2020 (est. 52 beds needed)
> Date of first known case: March 12, 2020
> Avg. new daily cases for week ending Sep. 1: 1.8 per 100,000 people — 3rd fewest
> Cumulative confirmed COVID-19 cases as of Sep. 1: 340 per 100,000 people — 2nd fewest (total: 4,548)
> COVID-19 related deaths as of Sep. 1: 10 per 100,000 people — 5th fewest (total: 132)
[in-text-ad-2]

Maryland
> Est. peak date, active infections: April 8, 2020 (est. 7,945 active infections)
> Est. peak date, hospital beds needed: April 29, 2020 (est. 1,779 beds needed)
> Date of first known case: March 5, 2020
> Avg. new daily cases for week ending Sep. 1: 8.9 per 100,000 people — 19th fewest
> Cumulative confirmed COVID-19 cases as of Sep. 1: 1,802 per 100,000 people — 19th most (total: 108,863)
> COVID-19 related deaths as of Sep. 1: 62 per 100,000 people — 12th most (total: 3,761)

Massachusetts
> Est. peak date, active infections: April 8, 2020 (est. 13,457 active infections)
> Est. peak date, hospital beds needed: April 27, 2020 (est. 2,711 beds needed)
> Date of first known case: 2/1, 2020
> Avg. new daily cases for week ending Sep. 1: 4.8 per 100,000 people — 7th fewest
> Cumulative confirmed COVID-19 cases as of Sep. 1: 1,726 per 100,000 people — 22nd most (total: 119,138)
> COVID-19 related deaths as of Sep. 1: 128 per 100,000 people — 3rd most (total: 8,831)
[in-text-ad]

Michigan
> Est. peak date, active infections: March 29, 2020 (est. 18,226 active infections)
> Est. peak date, hospital beds needed: April 18, 2020 (est. 5,078 beds needed)
> Date of first known case: March 10, 2020
> Avg. new daily cases for week ending Sep. 1: 8.0 per 100,000 people — 17th fewest
> Cumulative confirmed COVID-19 cases as of Sep. 1: 1,139 per 100,000 people — 15th fewest (total: 113,820)
> COVID-19 related deaths as of Sep. 1: 68 per 100,000 people — 9th most (total: 6,767)

Minnesota
> Est. peak date, active infections: Oct. 27, 2020 (est. 9,652 active infections)
> Est. peak date, hospital beds needed: Nov. 11, 2020 (est. 1,717 beds needed)
> Date of first known case: March 6, 2020
> Avg. new daily cases for week ending Sep. 1: 13.5 per 100,000 people — 25th most
> Cumulative confirmed COVID-19 cases as of Sep. 1: 1,361 per 100,000 people — 18th fewest (total: 76,355)
> COVID-19 related deaths as of Sep. 1: 32 per 100,000 people — 25th fewest (total: 1,823)

Mississippi
> Est. peak date, active infections: Nov. 29, 2020 (est. 5,370 active infections)
> Est. peak date, hospital beds needed: Aug. 7, 2020 (est. 873 beds needed)
> Date of first known case: March 11, 2020
> Avg. new daily cases for week ending Sep. 1: 24.0 per 100,000 people — 5th most
> Cumulative confirmed COVID-19 cases as of Sep. 1: 2,799 per 100,000 people — 4th most (total: 83,584)
> COVID-19 related deaths as of Sep. 1: 83 per 100,000 people — 7th most (total: 2,493)
[in-text-ad-2]

Missouri
> Est. peak date, active infections: Oct. 13, 2020 (est. 9,726 active infections)
> Est. peak date, hospital beds needed: Oct. 28, 2020 (est. 2,078 beds needed)
> Date of first known case: March 7, 2020
> Avg. new daily cases for week ending Sep. 1: 19.3 per 100,000 people — 10th most
> Cumulative confirmed COVID-19 cases as of Sep. 1: 1,399 per 100,000 people — 19th fewest (total: 85,739)
> COVID-19 related deaths as of Sep. 1: 25 per 100,000 people — 18th fewest (total: 1,538)

Montana
> Est. peak date, active infections: July 12, 2020 (est. 185 active infections)
> Est. peak date, hospital beds needed: July 31, 2020 (est. 75 beds needed)
> Date of first known case: March 13, 2020
> Avg. new daily cases for week ending Sep. 1: 11.8 per 100,000 people — 23rd fewest
> Cumulative confirmed COVID-19 cases as of Sep. 1: 707 per 100,000 people — 8th fewest (total: 7,509)
> COVID-19 related deaths as of Sep. 1: 10 per 100,000 people — 6th fewest (total: 105)
[in-text-ad]
Nebraska
> Est. peak date, active infections: Nov. 24, 2020 (est. 3,593 active infections)
> Est. peak date, hospital beds needed: Dec. 1, 2020 or later (est. 897 beds needed)
> Date of first known case: 2/17, 2020
> Avg. new daily cases for week ending Sep. 1: 13.9 per 100,000 people — 23rd most
> Cumulative confirmed COVID-19 cases as of Sep. 1: 1,777 per 100,000 people — 21st most (total: 34,287)
> COVID-19 related deaths as of Sep. 1: 21 per 100,000 people — 15th fewest (total: 397)

Nevada
> Est. peak date, active infections: Sept. 23, 2020 (est. 4,555 active infections)
> Est. peak date, hospital beds needed: Oct. 8, 2020 (est. 1,249 beds needed)
> Date of first known case: March 5, 2020
> Avg. new daily cases for week ending Sep. 1: 16.0 per 100,000 people — 16th most
> Cumulative confirmed COVID-19 cases as of Sep. 1: 2,295 per 100,000 people — 8th most (total: 69,633)
> COVID-19 related deaths as of Sep. 1: 43 per 100,000 people — 20th most (total: 1,313)
New Hampshire
> Est. peak date, active infections: April 26, 2020 (est. 485 active infections)
> Est. peak date, hospital beds needed: May 13, 2020 (est. 59 beds needed)
> Date of first known case: March 2, 2020
> Avg. new daily cases for week ending Sep. 1: 1.5 per 100,000 people — 2nd fewest
> Cumulative confirmed COVID-19 cases as of Sep. 1: 538 per 100,000 people — 3rd fewest (total: 7,297)
> COVID-19 related deaths as of Sep. 1: 32 per 100,000 people — 24th fewest (total: 432)
[in-text-ad-2]

New Jersey
> Est. peak date, active infections: April 1, 2020 (est. 45,479 active infections)
> Est. peak date, hospital beds needed: April 22, 2020 (est. 12,300 beds needed)
> Date of first known case: March 4, 2020
> Avg. new daily cases for week ending Sep. 1: 3.4 per 100,000 people — 5th fewest
> Cumulative confirmed COVID-19 cases as of Sep. 1: 2,158 per 100,000 people — 11th most (total: 192,290)
> COVID-19 related deaths as of Sep. 1: 179 per 100,000 people — the most (total: 15,950)

New Mexico
> Est. peak date, active infections: Nov. 18, 2020 (est. 4,025 active infections)
> Est. peak date, hospital beds needed: Dec. 1, 2020 or later (est. 938 beds needed)
> Date of first known case: March 11, 2020
> Avg. new daily cases for week ending Sep. 1: 6.3 per 100,000 people — 12th fewest
> Cumulative confirmed COVID-19 cases as of Sep. 1: 1,215 per 100,000 people — 16th fewest (total: 25,460)
> COVID-19 related deaths as of Sep. 1: 38 per 100,000 people — 21st most (total: 787)
[in-text-ad]
New York
> Est. peak date, active infections: March 24, 2020 (est. 112,007 active infections)
> Est. peak date, hospital beds needed: April 13, 2020 (est. 31,359 beds needed)
> Date of first known case: March 1, 2020
> Avg. new daily cases for week ending Sep. 1: 3.2 per 100,000 people — 4th fewest
> Cumulative confirmed COVID-19 cases as of Sep. 1: 2,229 per 100,000 people — 10th most (total: 435,510)
> COVID-19 related deaths as of Sep. 1: 130 per 100,000 people — 2nd most (total: 25,331)

North Carolina
> Est. peak date, active infections: Nov. 24, 2020 (est. 24,845 active infections)
> Est. peak date, hospital beds needed: Dec. 1, 2020 or later (est. 4,716 beds needed)
> Date of first known case: March 3, 2020
> Avg. new daily cases for week ending Sep. 1: 15.3 per 100,000 people — 17th most
> Cumulative confirmed COVID-19 cases as of Sep. 1: 1,632 per 100,000 people — 24th most (total: 169,424)
> COVID-19 related deaths as of Sep. 1: 26 per 100,000 people — 21st fewest (total: 2,741)

North Dakota
> Est. peak date, active infections: Nov. 14, 2020 (est. 880 active infections)
> Est. peak date, hospital beds needed: Nov. 28, 2020 (est. 184 beds needed)
> Date of first known case: March 11, 2020
> Avg. new daily cases for week ending Sep. 1: 31.8 per 100,000 people — 3rd most
> Cumulative confirmed COVID-19 cases as of Sep. 1: 1,579 per 100,000 people — 25th most (total: 12,000)
> COVID-19 related deaths as of Sep. 1: 19 per 100,000 people — 12th fewest (total: 145)
[in-text-ad-2]
Ohio
> Est. peak date, active infections: Dec. 1, 2020 or later (est. 16,637 active infections)
> Est. peak date, hospital beds needed: Dec. 1, 2020 or later (est. 1,781 beds needed)
> Date of first known case: March 9, 2020
> Avg. new daily cases for week ending Sep. 1: 8.7 per 100,000 people — 18th fewest
> Cumulative confirmed COVID-19 cases as of Sep. 1: 1,066 per 100,000 people — 13th fewest (total: 124,610)
> COVID-19 related deaths as of Sep. 1: 36 per 100,000 people — 22nd most (total: 4,165)

Oklahoma
> Est. peak date, active infections: Nov. 2, 2020 (est. 8,679 active infections)
> Est. peak date, hospital beds needed: Nov. 17, 2020 (est. 2,366 beds needed)
> Date of first known case: March 6, 2020
> Avg. new daily cases for week ending Sep. 1: 17.8 per 100,000 people — 11th most
> Cumulative confirmed COVID-19 cases as of Sep. 1: 1,506 per 100,000 people — 24th fewest (total: 59,399)
> COVID-19 related deaths as of Sep. 1: 21 per 100,000 people — 14th fewest (total: 809)
[in-text-ad]

Oregon
> Est. peak date, active infections: Nov. 30, 2020 (est. 8,618 active infections)
> Est. peak date, hospital beds needed: Dec. 1, 2020 or later (est. 1,498 beds needed)
> Date of first known case: 2/28, 2020
> Avg. new daily cases for week ending Sep. 1: 5.5 per 100,000 people — 10th fewest
> Cumulative confirmed COVID-19 cases as of Sep. 1: 643 per 100,000 people — 6th fewest (total: 26,946)
> COVID-19 related deaths as of Sep. 1: 11 per 100,000 people — 7th fewest (total: 465)

Pennsylvania
> Est. peak date, active infections: Nov. 6, 2020 (est. 20,984 active infections)
> Est. peak date, hospital beds needed: Nov. 22, 2020 (est. 5,244 beds needed)
> Date of first known case: March 6, 2020
> Avg. new daily cases for week ending Sep. 1: 5.0 per 100,000 people — 8th fewest
> Cumulative confirmed COVID-19 cases as of Sep. 1: 1,053 per 100,000 people — 12th fewest (total: 134,795)
> COVID-19 related deaths as of Sep. 1: 60 per 100,000 people — 13th most (total: 7,691)

Rhode Island
> Est. peak date, active infections: Nov. 11, 2020 (est. 1,740 active infections)
> Est. peak date, hospital beds needed: May 21, 2020 (est. 444 beds needed)
> Date of first known case: March 1, 2020
> Avg. new daily cases for week ending Sep. 1: 9.0 per 100,000 people — 20th fewest
> Cumulative confirmed COVID-19 cases as of Sep. 1: 2,081 per 100,000 people — 13th most (total: 22,002)
> COVID-19 related deaths as of Sep. 1: 99 per 100,000 people — 6th most (total: 1,050)
[in-text-ad-2]

South Carolina
> Est. peak date, active infections: Dec. 1, 2020 or later (est. 7,740 active infections)
> Est. peak date, hospital beds needed: July 31, 2020 (est. 1,752 beds needed)
> Date of first known case: March 6, 2020
> Avg. new daily cases for week ending Sep. 1: 16.7 per 100,000 people — 13th most
> Cumulative confirmed COVID-19 cases as of Sep. 1: 2,357 per 100,000 people — 7th most (total: 119,846)
> COVID-19 related deaths as of Sep. 1: 54 per 100,000 people — 15th most (total: 2,757)

South Dakota
> Est. peak date, active infections: Dec. 1, 2020 or later (est. 560 active infections)
> Est. peak date, hospital beds needed: Dec. 1, 2020 or later (est. 175 beds needed)
> Date of first known case: March 10, 2020
> Avg. new daily cases for week ending Sep. 1: 28.5 per 100,000 people — 4th most
> Cumulative confirmed COVID-19 cases as of Sep. 1: 1,558 per 100,000 people — 25th fewest (total: 13,749)
> COVID-19 related deaths as of Sep. 1: 19 per 100,000 people — 11th fewest (total: 167)
[in-text-ad]

Tennessee
> Est. peak date, active infections: Oct. 15, 2020 (est. 12,352 active infections)
> Est. peak date, hospital beds needed: Oct. 29, 2020 (est. 3,535 beds needed)
> Date of first known case: March 5, 2020
> Avg. new daily cases for week ending Sep. 1: 21.0 per 100,000 people — 6th most
> Cumulative confirmed COVID-19 cases as of Sep. 1: 2,289 per 100,000 people — 9th most (total: 154,933)
> COVID-19 related deaths as of Sep. 1: 26 per 100,000 people — 20th fewest (total: 1,754)
Texas
> Est. peak date, active infections: Sept. 17, 2020 (est. 47,223 active infections)
> Est. peak date, hospital beds needed: Sept. 30, 2020 (est. 12,192 beds needed)
> Date of first known case: 2/12, 2020
> Avg. new daily cases for week ending Sep. 1: 16.6 per 100,000 people — 14th most
> Cumulative confirmed COVID-19 cases as of Sep. 1: 2,151 per 100,000 people — 12th most (total: 617,333)
> COVID-19 related deaths as of Sep. 1: 44 per 100,000 people — 19th most (total: 12,681)

Utah
> Est. peak date, active infections: Dec. 1, 2020 or later (est. 5,637 active infections)
> Est. peak date, hospital beds needed: Dec. 1, 2020 or later (est. 1,569 beds needed)
> Date of first known case: 2/25, 2020
> Avg. new daily cases for week ending Sep. 1: 11.9 per 100,000 people — 24th fewest
> Cumulative confirmed COVID-19 cases as of Sep. 1: 1,658 per 100,000 people — 23rd most (total: 52,403)
> COVID-19 related deaths as of Sep. 1: 13 per 100,000 people — 9th fewest (total: 409)
[in-text-ad-2]

Vermont
> Est. peak date, active infections: March 30, 2020 (est. 134 active infections)
> Est. peak date, hospital beds needed: April 16, 2020 (est. 36 beds needed)
> Date of first known case: March 7, 2020
> Avg. new daily cases for week ending Sep. 1: 1.2 per 100,000 people — the fewest
> Cumulative confirmed COVID-19 cases as of Sep. 1: 261 per 100,000 people — the fewest (total: 1,635)
> COVID-19 related deaths as of Sep. 1: 9 per 100,000 people — 4th fewest (total: 58)

Virginia
> Est. peak date, active infections: April 26, 2020 (est. 2,936 active infections)
> Est. peak date, hospital beds needed: May 12, 2020 (est. 779 beds needed)
> Date of first known case: March 7, 2020
> Avg. new daily cases for week ending Sep. 1: 11.3 per 100,000 people — 22nd fewest
> Cumulative confirmed COVID-19 cases as of Sep. 1: 1,428 per 100,000 people — 21st fewest (total: 121,615)
> COVID-19 related deaths as of Sep. 1: 31 per 100,000 people — 23rd fewest (total: 2,612)
[in-text-ad]

Washington
> Est. peak date, active infections: Nov. 6, 2020 (est. 12,624 active infections)
> Est. peak date, hospital beds needed: Nov. 28, 2020 (est. 2,979 beds needed)
> Date of first known case: Jan. 21, 2020
> Avg. new daily cases for week ending Sep. 1: 6.4 per 100,000 people — 13th fewest
> Cumulative confirmed COVID-19 cases as of Sep. 1: 994 per 100,000 people — 10th fewest (total: 74,939)
> COVID-19 related deaths as of Sep. 1: 26 per 100,000 people — 19th fewest (total: 1,931)

West Virginia
> Est. peak date, active infections: Dec. 1, 2020 or later (est. 624 active infections)
> Est. peak date, hospital beds needed: Dec. 1, 2020 or later (est. 109 beds needed)
> Date of first known case: March 17, 2020
> Avg. new daily cases for week ending Sep. 1: 6.6 per 100,000 people — 15th fewest
> Cumulative confirmed COVID-19 cases as of Sep. 1: 582 per 100,000 people — 4th fewest (total: 10,507)
> COVID-19 related deaths as of Sep. 1: 12 per 100,000 people — 8th fewest (total: 222)

Wisconsin
> Est. peak date, active infections: Dec. 1, 2020 or later (est. 9,982 active infections)
> Est. peak date, hospital beds needed: Dec. 1, 2020 or later (est. 1,558 beds needed)
> Date of first known case: 2/5, 2020
> Avg. new daily cases for week ending Sep. 1: 12.0 per 100,000 people — 25th fewest
> Cumulative confirmed COVID-19 cases as of Sep. 1: 1,317 per 100,000 people — 17th fewest (total: 76,584)
> COVID-19 related deaths as of Sep. 1: 19 per 100,000 people — 13th fewest (total: 1,130)
[in-text-ad-2]

Wyoming
> Est. peak date, active infections: Oct. 13, 2020 (est. 1,344 active infections)
> Est. peak date, hospital beds needed: May 28, 2020 (est. 20 beds needed)
> Date of first known case: March 11, 2020
> Avg. new daily cases for week ending Sep. 1: 5.8 per 100,000 people — 11th fewest
> Cumulative confirmed COVID-19 cases as of Sep. 1: 669 per 100,000 people — 7th fewest (total: 3,866)
> COVID-19 related deaths as of Sep. 1: 7 per 100,000 people — 3rd fewest (total: 41)
It’s Your Money, Your Future—Own It (sponsor)
Retirement can be daunting, but it doesn’t need to be.
Imagine having an expert in your corner to help you with your financial goals. Someone to help you determine if you’re ahead, behind, or right on track. With SmartAsset, that’s not just a dream—it’s reality. This free tool connects you with pre-screened financial advisors who work in your best interests. It’s quick, it’s easy, so take the leap today and start planning smarter!
Don’t waste another minute; get started right here and help your retirement dreams become a retirement reality.
Thank you for reading! Have some feedback for us?
Contact the 24/7 Wall St. editorial team.
 24/7 Wall St.
 24/7 Wall St.


 24/7 Wall St.