
Even though the pandemic and subsequent lockdowns seem to have made many people avid wine drinkers, according to data from Nielsen, beer is still the most preferred alcoholic beverage in the United States. A 2018 Gallup poll among American adults put the beverage at the very top, even as beer consumption has declined slightly over the last decade.
Beer consumption tends to vary considerably across the country. The only common characteristic among all 50 states is that fewer gallons of the beverage per capita were consumed in 2019 than in 2015.
24/7 Tempo reviewed annual beer consumption data per capita provided by Beer Marketer’s Insights, a brewing industry trade publisher, to determine the states where people drink the most and least amounts of beer.
Annual shipments of beer per capita range from almost 40 gallons in one state to less than 20 in another. Generally, residents of states in the Midwest tend to be the biggest beer drinkers, while residents of states in the Northeast consume the least beer with a few notable exceptions. Two New England states actually rank among the biggest beer drinkers in the country.
One reason why beer consumption appears to differ from state to state is a difference in purchasing laws and taxes. Nine of the 15 states with the lowest beer consumption per capita have some of the highest beer taxes in the country. States levy different levels of taxes on beer. They range from just $0.02 a gallon to almost $1.30 a gallon.
One of the most immediate risks associated with excessive drinking is fatal motor vehicle accidents. Nationwide, 28.0% of all driving deaths involve alcohol. The alcohol-related driving death rate is higher than the national rate in 31 states, and 12 of them are among the states where beer consumption is the highest. In Montana, the state with the highest beer consumption rate, 45.1% of driving deaths are alcohol related, the largest share of any state.
People may be drinking less beer overall, but sales of specialty brews are rising. The country’s 7,500-plus craft breweries shipped a total of 25.9 million barrels in 2018, up from 9.1 million a decade earlier — these are the most popular beer brands in America.
Click here for states where people drink the most beer
Click here for our methodology

50. Utah
> Per capita consumption among adults in 2019: 18.4 gallons of beer
> 5 yr. consumption change (2015-2019): -2.6% — 9th smallest decrease
> Beer tax rate: $0.41 per gallon — 14th highest
> Adults reporting excessive drinking: 12.2% — the lowest
> Driving deaths involving alcohol: 22.5% — 7th lowest
[in-text-ad]

49. Maryland
> Per capita consumption among adults in 2019: 19.2 gallons of beer
> 5 yr. consumption change (2015-2019): -9.0% — 5th largest decrease
> Beer tax rate: $0.55 per gallon — 7th highest
> Adults reporting excessive drinking: 16.6% — 11th lowest
> Driving deaths involving alcohol: 28.9% — 20th lowest

48. Connecticut
> Per capita consumption among adults in 2019: 19.8 gallons of beer
> 5 yr. consumption change (2015-2019): -6.6% — 20th largest decrease
> Beer tax rate: $0.23 per gallon — 24th lowest
> Adults reporting excessive drinking: 17.1% — 15th lowest
> Driving deaths involving alcohol: 32.0% — 16th highest

47. New Jersey
> Per capita consumption among adults in 2019: 20.5 gallons of beer
> 5 yr. consumption change (2015-2019): -4.7% — 19th smallest decrease
> Beer tax rate: $0.12 per gallon — 9th lowest
> Adults reporting excessive drinking: 18.1% — 22nd lowest
> Driving deaths involving alcohol: 21.9% — 6th lowest
[in-text-ad-2]

46. New York
> Per capita consumption among adults in 2019: 21.7 gallons of beer
> 5 yr. consumption change (2015-2019): -4.4% — 17th smallest decrease
> Beer tax rate: $0.14 per gallon — 12th lowest
> Adults reporting excessive drinking: 18.8% — 25th lowest
> Driving deaths involving alcohol: 20.9% — 3rd lowest

45. Rhode Island
> Per capita consumption among adults in 2019: 22.1 gallons of beer
> 5 yr. consumption change (2015-2019): -9.8% — 2nd largest decrease
> Beer tax rate: $0.12 per gallon — 10th lowest
> Adults reporting excessive drinking: 19.6% — 17th highest
> Driving deaths involving alcohol: 36.2% — 7th highest
[in-text-ad]

44. Massachusetts
> Per capita consumption among adults in 2019: 22.9 gallons of beer
> 5 yr. consumption change (2015-2019): -6.5% — 21st largest decrease
> Beer tax rate: $0.11 per gallon — 7th lowest
> Adults reporting excessive drinking: 21.3% — 7th highest
> Driving deaths involving alcohol: 30.0% — 25th lowest

43. Kentucky
> Per capita consumption among adults in 2019: 23.1 gallons of beer
> 5 yr. consumption change (2015-2019): -8.0% — 14th largest decrease
> Beer tax rate: $0.85 per gallon — 4th highest
> Adults reporting excessive drinking: 17.3% — 17th lowest
> Driving deaths involving alcohol: 26.1% — 11th lowest

40. Arkansas
> Per capita consumption among adults in 2019: 23.2 gallons of beer
> 5 yr. consumption change (2015-2019): -4.9% — 20th smallest decrease
> Beer tax rate: $0.34 per gallon — 19th highest
> Adults reporting excessive drinking: 15.8% — 8th lowest
> Driving deaths involving alcohol: 26.3% — 12th lowest
[in-text-ad-2]

40. Georgia
> Per capita consumption among adults in 2019: 23.2 gallons of beer
> 5 yr. consumption change (2015-2019): -6.1% — 24th smallest decrease
> Beer tax rate: $0.48 per gallon — 10th highest
> Adults reporting excessive drinking: 14.4% — 7th lowest
> Driving deaths involving alcohol: 21.5% — 4th lowest

40. Indiana
> Per capita consumption among adults in 2019: 23.2 gallons of beer
> 5 yr. consumption change (2015-2019): -2.9% — 10th smallest decrease
> Beer tax rate: $0.12 per gallon — 8th lowest
> Adults reporting excessive drinking: 17.6% — 21st lowest
> Driving deaths involving alcohol: 19.7% — the lowest
[in-text-ad]

39. Washington
> Per capita consumption among adults in 2019: 23.4 gallons of beer
> 5 yr. consumption change (2015-2019): -7.5% — 15th largest decrease
> Beer tax rate: $0.18 per gallon — 16th lowest
> Adults reporting excessive drinking: 17.4% — 20th lowest
> Driving deaths involving alcohol: 32.1% — 15th highest

38. Michigan
> Per capita consumption among adults in 2019: 23.9 gallons of beer
> 5 yr. consumption change (2015-2019): -8.1% — 12th largest decrease
> Beer tax rate: $0.20 per gallon — 22nd lowest
> Adults reporting excessive drinking: 19.6% — 18th highest
> Driving deaths involving alcohol: 29.0% — 21st lowest

37. Virginia
> Per capita consumption among adults in 2019: 24.2 gallons of beer
> 5 yr. consumption change (2015-2019): -4.3% — 16th smallest decrease
> Beer tax rate: $0.26 per gallon — 25th lowest
> Adults reporting excessive drinking: 17.4% — 19th lowest
> Driving deaths involving alcohol: 30.2% — 24th highest
[in-text-ad-2]

36. Tennessee
> Per capita consumption among adults in 2019: 24.3 gallons of beer
> 5 yr. consumption change (2015-2019): -4.0% — 15th smallest decrease
> Beer tax rate: $1.29 per gallon — the highest
> Adults reporting excessive drinking: 14.3% — 6th lowest
> Driving deaths involving alcohol: 25.1% — 9th lowest

35. Oklahoma
> Per capita consumption among adults in 2019: 24.4 gallons of beer
> 5 yr. consumption change (2015-2019): -6.2% — 25th largest decrease
> Beer tax rate: $0.40 per gallon — 16th highest
> Adults reporting excessive drinking: 14.1% — 5th lowest
> Driving deaths involving alcohol: 26.4% — 13th lowest
[in-text-ad]

34. Idaho
> Per capita consumption among adults in 2019: 24.6 gallons of beer
> 5 yr. consumption change (2015-2019): -8.9% — 6th largest decrease
> Beer tax rate: $0.15 per gallon — 13th lowest
> Adults reporting excessive drinking: 16.6% — 10th lowest
> Driving deaths involving alcohol: 30.2% — 23rd highest

33. California
> Per capita consumption among adults in 2019: 24.7 gallons of beer
> 5 yr. consumption change (2015-2019): -5.0% — 21st smallest decrease
> Beer tax rate: $0.20 per gallon — 21st lowest
> Adults reporting excessive drinking: 19.2% — 23rd highest
> Driving deaths involving alcohol: 29.6% — 24th lowest

32. North Carolina
> Per capita consumption among adults in 2019: 24.8 gallons of beer
> 5 yr. consumption change (2015-2019): -2.4% — 6th smallest decrease
> Beer tax rate: $0.62 per gallon — 6th highest
> Adults reporting excessive drinking: 16.9% — 14th lowest
> Driving deaths involving alcohol: 29.5% — 23rd lowest
[in-text-ad-2]

31. Florida
> Per capita consumption among adults in 2019: 25.0 gallons of beer
> 5 yr. consumption change (2015-2019): -8.4% — 9th largest decrease
> Beer tax rate: $0.48 per gallon — 10th highest
> Adults reporting excessive drinking: 17.1% — 16th lowest
> Driving deaths involving alcohol: 23.3% — 8th lowest
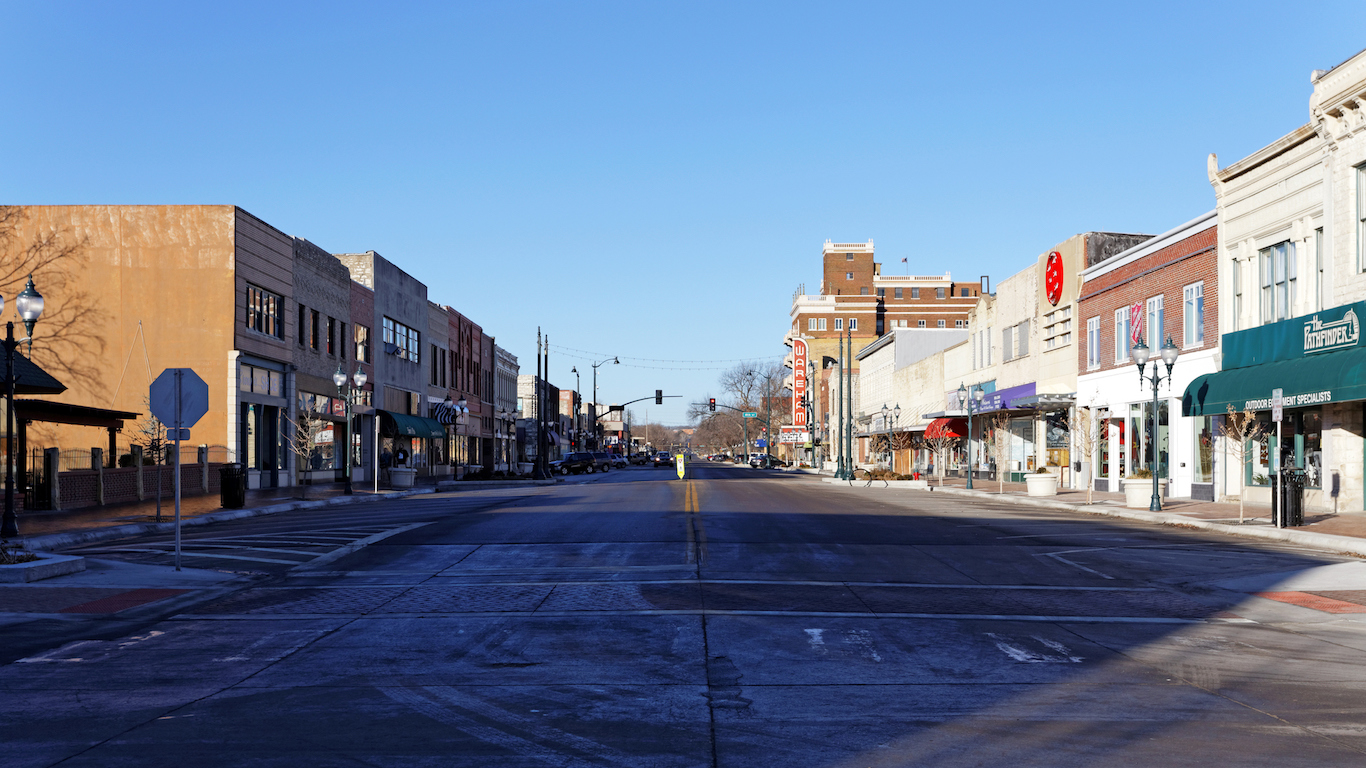
30. Kansas
> Per capita consumption among adults in 2019: 25.6 gallons of beer
> 5 yr. consumption change (2015-2019): -6.2% — 23rd largest decrease
> Beer tax rate: $0.18 per gallon — 18th lowest
> Adults reporting excessive drinking: 18.7% — 24th lowest
> Driving deaths involving alcohol: 21.9% — 5th lowest
[in-text-ad]

29. Arizona
> Per capita consumption among adults in 2019: 25.7 gallons of beer
> 5 yr. consumption change (2015-2019): -6.2% — 24th largest decrease
> Beer tax rate: $0.16 per gallon — 15th lowest
> Adults reporting excessive drinking: 16.7% — 12th lowest
> Driving deaths involving alcohol: 25.4% — 10th lowest
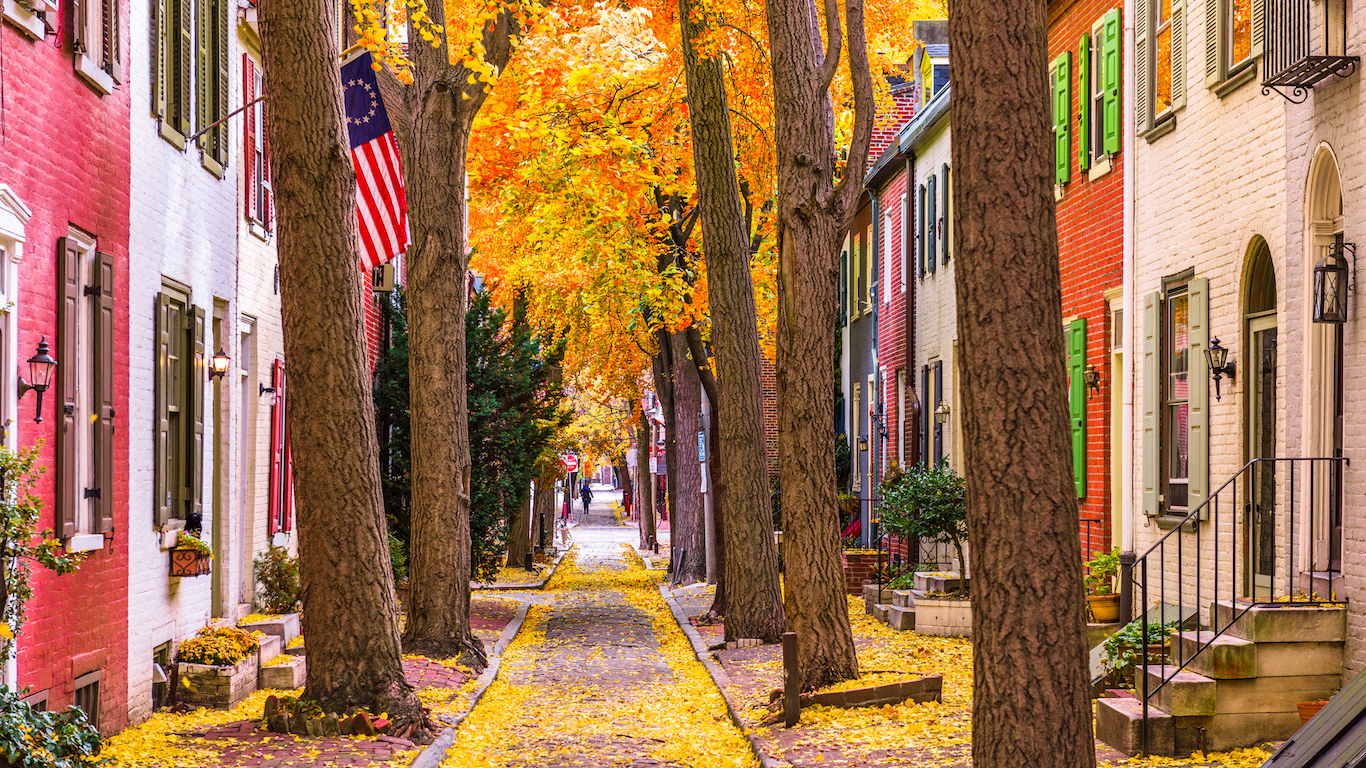
28. Pennsylvania
> Per capita consumption among adults in 2019: 26.0 gallons of beer
> 5 yr. consumption change (2015-2019): -3.3% — 12th smallest decrease
> Beer tax rate: $0.08 per gallon — 5th lowest
> Adults reporting excessive drinking: 19.2% — 24th highest
> Driving deaths involving alcohol: 26.8% — 14th lowest

27. Ohio
> Per capita consumption among adults in 2019: 26.4 gallons of beer
> 5 yr. consumption change (2015-2019): -8.0% — 13th largest decrease
> Beer tax rate: $0.18 per gallon — 17th lowest
> Adults reporting excessive drinking: 20.2% — 14th highest
> Driving deaths involving alcohol: 32.7% — 14th highest
[in-text-ad-2]

26. Illinois
> Per capita consumption among adults in 2019: 26.5 gallons of beer
> 5 yr. consumption change (2015-2019): -6.7% — 19th largest decrease
> Beer tax rate: $0.23 per gallon — 23rd lowest
> Adults reporting excessive drinking: 21.4% — 6th highest
> Driving deaths involving alcohol: 31.9% — 17th highest

25. Missouri
> Per capita consumption among adults in 2019: 26.8 gallons of beer
> 5 yr. consumption change (2015-2019): -7.3% — 16th largest decrease
> Beer tax rate: $0.06 per gallon — 2nd lowest
> Adults reporting excessive drinking: 19.8% — 16th highest
> Driving deaths involving alcohol: 27.4% — 18th lowest
[in-text-ad]

24. West Virginia
> Per capita consumption among adults in 2019: 27.0 gallons of beer
> 5 yr. consumption change (2015-2019): -5.3% — 22nd smallest decrease
> Beer tax rate: $0.26 per gallon — 25th highest
> Adults reporting excessive drinking: 12.3% — 2nd lowest
> Driving deaths involving alcohol: 27.4% — 17th lowest

22. Alaska
> Per capita consumption among adults in 2019: 27.6 gallons of beer
> 5 yr. consumption change (2015-2019): -4.5% — 18th smallest decrease
> Beer tax rate: $1.07 per gallon — 2nd highest
> Adults reporting excessive drinking: 21.3% — 8th highest
> Driving deaths involving alcohol: 38.1% — 3rd highest

22. New Mexico
> Per capita consumption among adults in 2019: 27.6 gallons of beer
> 5 yr. consumption change (2015-2019): -9.2% — 4th largest decrease
> Beer tax rate: $0.41 per gallon — 15th highest
> Adults reporting excessive drinking: 16.2% — 9th lowest
> Driving deaths involving alcohol: 30.5% — 20th highest
[in-text-ad-2]

21. Delaware
> Per capita consumption among adults in 2019: 27.8 gallons of beer
> 5 yr. consumption change (2015-2019): -8.6% — 8th largest decrease
> Beer tax rate: $0.26 per gallon — 24th highest
> Adults reporting excessive drinking: 16.8% — 13th lowest
> Driving deaths involving alcohol: 30.3% — 22nd highest

19. Louisiana
> Per capita consumption among adults in 2019: 27.9 gallons of beer
> 5 yr. consumption change (2015-2019): -10.9% — the largest decrease
> Beer tax rate: $0.40 per gallon — 16th highest
> Adults reporting excessive drinking: 19.6% — 19th highest
> Driving deaths involving alcohol: 33.1% — 13th highest
[in-text-ad]

19. Minnesota
> Per capita consumption among adults in 2019: 27.9 gallons of beer
> 5 yr. consumption change (2015-2019): -3.8% — 14th smallest decrease
> Beer tax rate: $0.51 per gallon — 9th highest
> Adults reporting excessive drinking: 21.7% — 5th highest
> Driving deaths involving alcohol: 30.0% — 25th highest

18. Colorado
> Per capita consumption among adults in 2019: 28.6 gallons of beer
> 5 yr. consumption change (2015-2019): -0.7% — 2nd smallest decrease
> Beer tax rate: $0.08 per gallon — 5th lowest
> Adults reporting excessive drinking: 20.5% — 12th highest
> Driving deaths involving alcohol: 34.1% — 10th highest

17. Alabama
> Per capita consumption among adults in 2019: 29.0 gallons of beer
> 5 yr. consumption change (2015-2019): -1.0% — 3rd smallest decrease
> Beer tax rate: $0.53 per gallon — 8th highest
> Adults reporting excessive drinking: 13.9% — 4th lowest
> Driving deaths involving alcohol: 27.6% — 19th lowest
[in-text-ad-2]

15. Hawaii
> Per capita consumption among adults in 2019: 29.4 gallons of beer
> 5 yr. consumption change (2015-2019): -0.3% — the smallest decrease
> Beer tax rate: $0.93 per gallon — 3rd highest
> Adults reporting excessive drinking: 21.1% — 9th highest
> Driving deaths involving alcohol: 31.2% — 18th highest

15. South Carolina
> Per capita consumption among adults in 2019: 29.4 gallons of beer
> 5 yr. consumption change (2015-2019): -6.4% — 22nd largest decrease
> Beer tax rate: $0.77 per gallon — 5th highest
> Adults reporting excessive drinking: 17.4% — 18th lowest
> Driving deaths involving alcohol: 33.1% — 12th highest
[in-text-ad]

14. Mississippi
> Per capita consumption among adults in 2019: 29.5 gallons of beer
> 5 yr. consumption change (2015-2019): -9.2% — 3rd largest decrease
> Beer tax rate: $0.43 per gallon — 13th highest
> Adults reporting excessive drinking: 13.6% — 3rd lowest
> Driving deaths involving alcohol: 20.0% — 2nd lowest

13. Oregon
> Per capita consumption among adults in 2019: 29.6 gallons of beer
> 5 yr. consumption change (2015-2019): -2.6% — 8th smallest decrease
> Beer tax rate: $0.08 per gallon — 6th lowest
> Adults reporting excessive drinking: 18.6% — 23rd lowest
> Driving deaths involving alcohol: 30.9% — 19th highest

11. Iowa
> Per capita consumption among adults in 2019: 30.6 gallons of beer
> 5 yr. consumption change (2015-2019): -6.7% — 18th largest decrease
> Beer tax rate: $0.19 per gallon — 19th lowest
> Adults reporting excessive drinking: 22.1% — 3rd highest
> Driving deaths involving alcohol: 26.9% — 16th lowest
[in-text-ad-2]
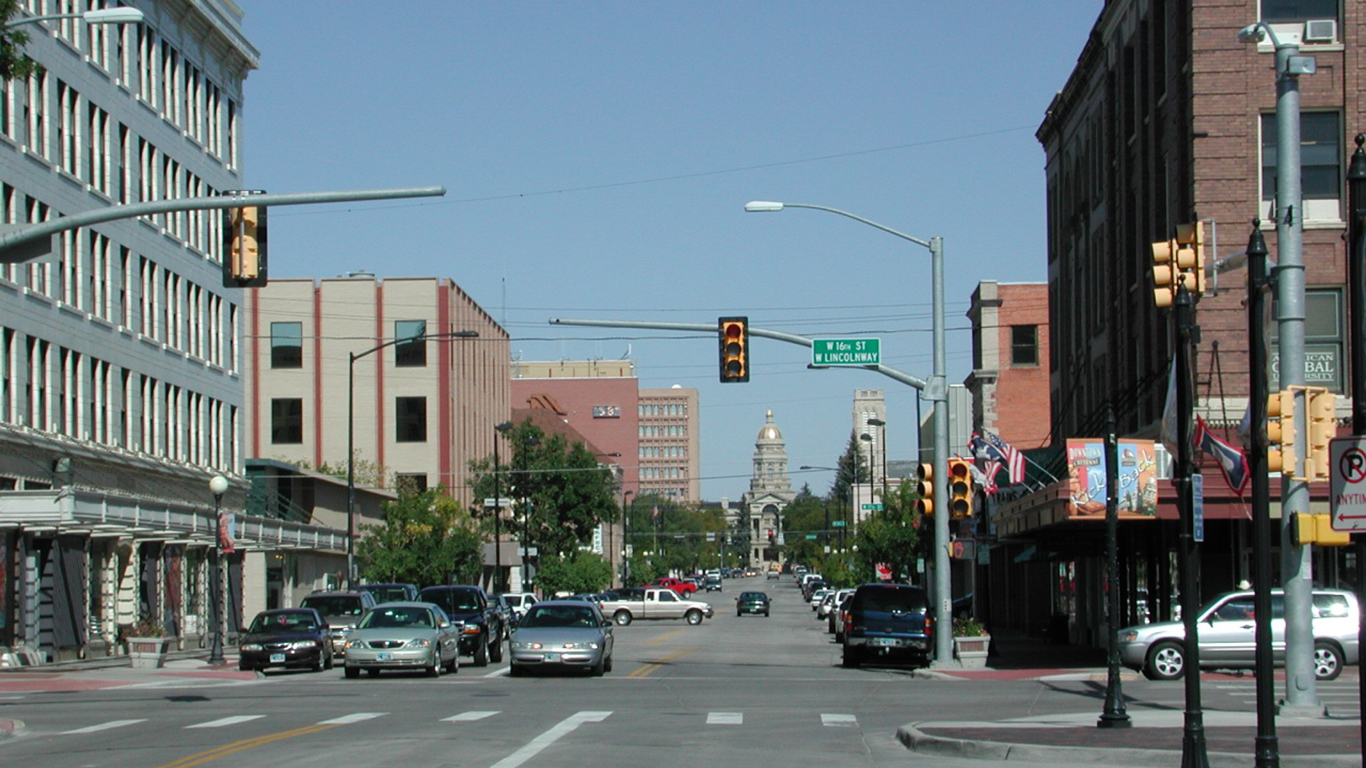
11. Wyoming
> Per capita consumption among adults in 2019: 30.6 gallons of beer
> 5 yr. consumption change (2015-2019): -1.9% — 4th smallest decrease
> Beer tax rate: $0.02 per gallon — the lowest
> Adults reporting excessive drinking: 19.8% — 15th highest
> Driving deaths involving alcohol: 34.2% — 9th highest

10. Texas
> Per capita consumption among adults in 2019: 31.1 gallons of beer
> 5 yr. consumption change (2015-2019): -3.7% — 13th smallest decrease
> Beer tax rate: $0.20 per gallon — 20th lowest
> Adults reporting excessive drinking: 19.5% — 20th highest
> Driving deaths involving alcohol: 26.9% — 15th lowest
[in-text-ad]

8. Nebraska
> Per capita consumption among adults in 2019: 31.7 gallons of beer
> 5 yr. consumption change (2015-2019): -7.0% — 17th largest decrease
> Beer tax rate: $0.31 per gallon — 20th highest
> Adults reporting excessive drinking: 21.7% — 4th highest
> Driving deaths involving alcohol: 34.0% — 11th highest

8. Nevada
> Per capita consumption among adults in 2019: 31.7 gallons of beer
> 5 yr. consumption change (2015-2019): -8.1% — 10th largest decrease
> Beer tax rate: $0.16 per gallon — 15th lowest
> Adults reporting excessive drinking: 19.3% — 22nd highest
> Driving deaths involving alcohol: 29.4% — 22nd lowest

7. Maine
> Per capita consumption among adults in 2019: 33.1 gallons of beer
> 5 yr. consumption change (2015-2019): -3.2% — 11th smallest decrease
> Beer tax rate: $0.35 per gallon — 18th highest
> Adults reporting excessive drinking: 20.2% — 13th highest
> Driving deaths involving alcohol: 36.7% — 5th highest
[in-text-ad-2]

6. Vermont
> Per capita consumption among adults in 2019: 33.3 gallons of beer
> 5 yr. consumption change (2015-2019): -2.3% — 5th smallest decrease
> Beer tax rate: $0.27 per gallon — 23rd highest
> Adults reporting excessive drinking: 19.5% — 21st highest
> Driving deaths involving alcohol: 34.7% — 8th highest

5. Wisconsin
> Per capita consumption among adults in 2019: 33.6 gallons of beer
> 5 yr. consumption change (2015-2019): -6.1% — 25th smallest decrease
> Beer tax rate: $0.06 per gallon — 3rd lowest
> Adults reporting excessive drinking: 24.2% — the highest
> Driving deaths involving alcohol: 36.2% — 6th highest
[in-text-ad]

4. South Dakota
> Per capita consumption among adults in 2019: 36.6 gallons of beer
> 5 yr. consumption change (2015-2019): -5.7% — 23rd smallest decrease
> Beer tax rate: $0.27 per gallon — 22nd highest
> Adults reporting excessive drinking: 19.0% — 25th highest
> Driving deaths involving alcohol: 36.7% — 4th highest

3. North Dakota
> Per capita consumption among adults in 2019: 37.5 gallons of beer
> 5 yr. consumption change (2015-2019): -8.1% — 11th largest decrease
> Beer tax rate: $0.45 per gallon — 12th highest
> Adults reporting excessive drinking: 24.1% — 2nd highest
> Driving deaths involving alcohol: 43.2% — 2nd highest

2. New Hampshire
> Per capita consumption among adults in 2019: 39.0 gallons of beer
> 5 yr. consumption change (2015-2019): -8.9% — 7th largest decrease
> Beer tax rate: $0.30 per gallon — 21st highest
> Adults reporting excessive drinking: 20.7% — 11th highest
> Driving deaths involving alcohol: 30.5% — 21st highest
[in-text-ad-2]
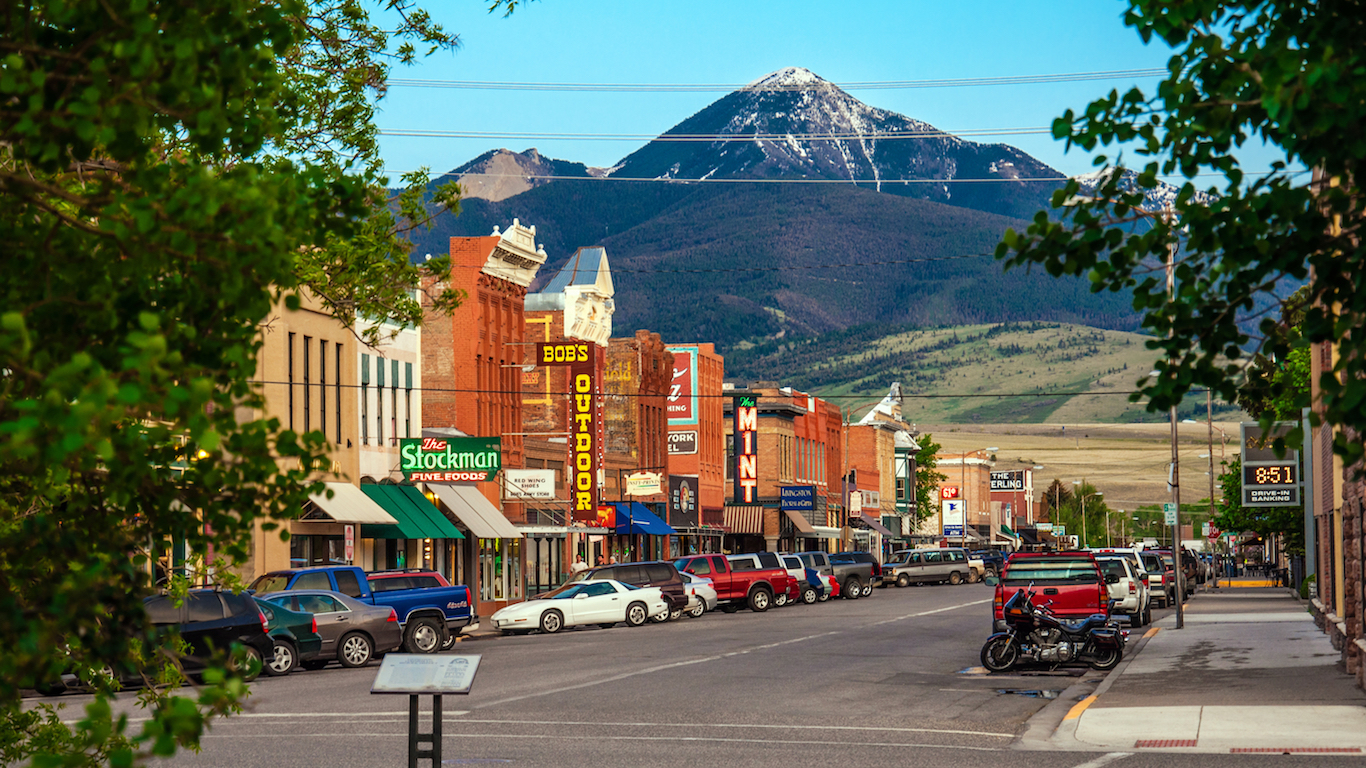
1. Montana
> Per capita consumption among adults in 2019: 39.8 gallons of beer
> 5 yr. consumption change (2015-2019): -2.5% — 7th smallest decrease
> Beer tax rate: $0.14 per gallon — 11th lowest
> Adults reporting excessive drinking: 20.9% — 10th highest
> Driving deaths involving alcohol: 45.1% — the highest
Methodology
To identify the states drinking the most beer, 24/7 Tempo reviewed beer consumption data per capita in 2015 through 2019 provided by Beer Marketer’s Insights, a brewing industry trade publisher. States are ranked on consumption figures in gallons per adult — people 18 and over — in each state for 2019. Consumption is based on shipment volumes to each state.
Alcohol-related driving fatalities came from 2020 County Health Rankings & Roadmaps (CHR), a Robert Wood Johnson Foundation and University of Wisconsin Population Health Institute joint program. Data on adults reporting excessive drinking of any form of alcohol, not just beer, also came from the CHR. Information on beer tax came from the Tax Foundation, a think tank that tracks U.S. tax policies.
Are You Ahead, or Behind on Retirement? (sponsor)
If you’re one of the over 4 Million Americans set to retire this year, you may want to pay attention.
Finding a financial advisor who puts your interest first can be the difference between a rich retirement and barely getting by, and today it’s easier than ever. SmartAsset’s free tool matches you with up to three fiduciary financial advisors that serve your area in minutes. Each advisor has been carefully vetted, and must act in your best interests. Start your search now.
Don’t waste another minute; get started right here and help your retirement dreams become a retirement reality.
Thank you for reading! Have some feedback for us?
Contact the 24/7 Wall St. editorial team.
 24/7 Wall St.
 24/7 Wall St.
 24/7 Wall St.
 24/7 Wall St.
