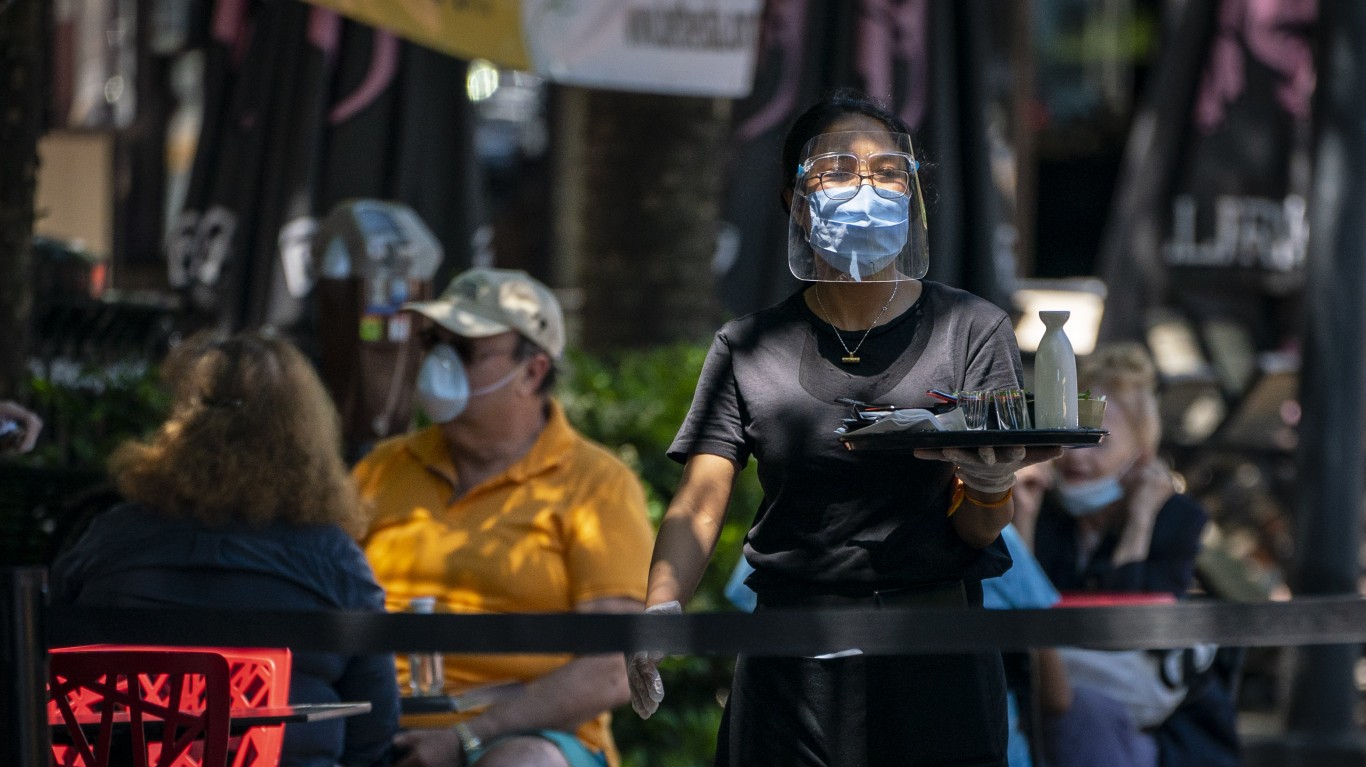
The spread of COVID-19 appears to be slowing across the U.S. Though daily new cases reported nationwide over the past month tended to be much higher than they were in April and May, they were lower than when the pandemic surged peaked in July.
However, this national trend of declining daily COVID-19 cases is not uniform across the country. In fact, there are two dozen major metro areas where cases have been surging. These areas reported more confirmed COVID-19 cases in the past month than they did in the previous five months combined, dating back to the start of the pandemic.
Using data from state and local health departments, 24/7 Wall St. determined the major U.S. metro areas in which the number of total confirmed COVID-19 cases doubled from Aug. 13 to Sept. 13.
The vast majority of these metro areas — 17 out of 24 — are in the Midwest. There are three apiece in the West and South, and one is in the Northeast. A number of Midwestern states are reporting very high rates of new daily cases per capita, compared to the country overall. Even though many Midwestern cities have reported week-over-week declines in average daily COVID-19 cases per capita, several Midwestern states have reported two or even three times as many new daily cases per capita in the past week than the U.S. overall. These are the states where the virus is spreading and where it is getting worse.
There is another factor linking most of the places on this list — the majority are home to at least one major college or university. Most colleges closed down in the earlier months of the pandemic, cutting their semesters short or turning to online education. Now that some schools are letting students back on campus for the fall, cases are spiking in the small, close-knit campus communities, causing COVID-19 cases in the surrounding areas to increase as well. These are the colleges that reopened and then saw a spike in cases.
Click here to see the cities where cases have doubled in the last month

24. Beckley, WV
> Pct. increase in total COVID-19 cases from Aug. 13 to Sept. 13: 103.0%
> Cases as of Aug. 13: 362 per 100,000 people (total: 436)
> Cases as of Sept. 13: 735 per 100,000 people (total: 885)
> COVID-19 related deaths as of Sept. 13: 12 per 100,000 people (total: 15)
> Population: 117,272
> Cases in West Virginia as of Sept. 13: 703 per 100,000 people (total: 12,699)
[in-text-ad]

23. Appleton, WI
> Pct. increase in total COVID-19 cases from Aug. 13 to Sept. 13: 103.1%
> Cases as of Aug. 13: 717 per 100,000 people (total: 1,681)
> Cases as of Sept. 13: 1,455 per 100,000 people (total: 3,414)
> COVID-19 related deaths as of Sept. 13: 11 per 100,000 people (total: 26)
> Population: 237,524
> Cases in Wisconsin as of Sept. 13: 1,534 per 100,000 people (total: 89,185)
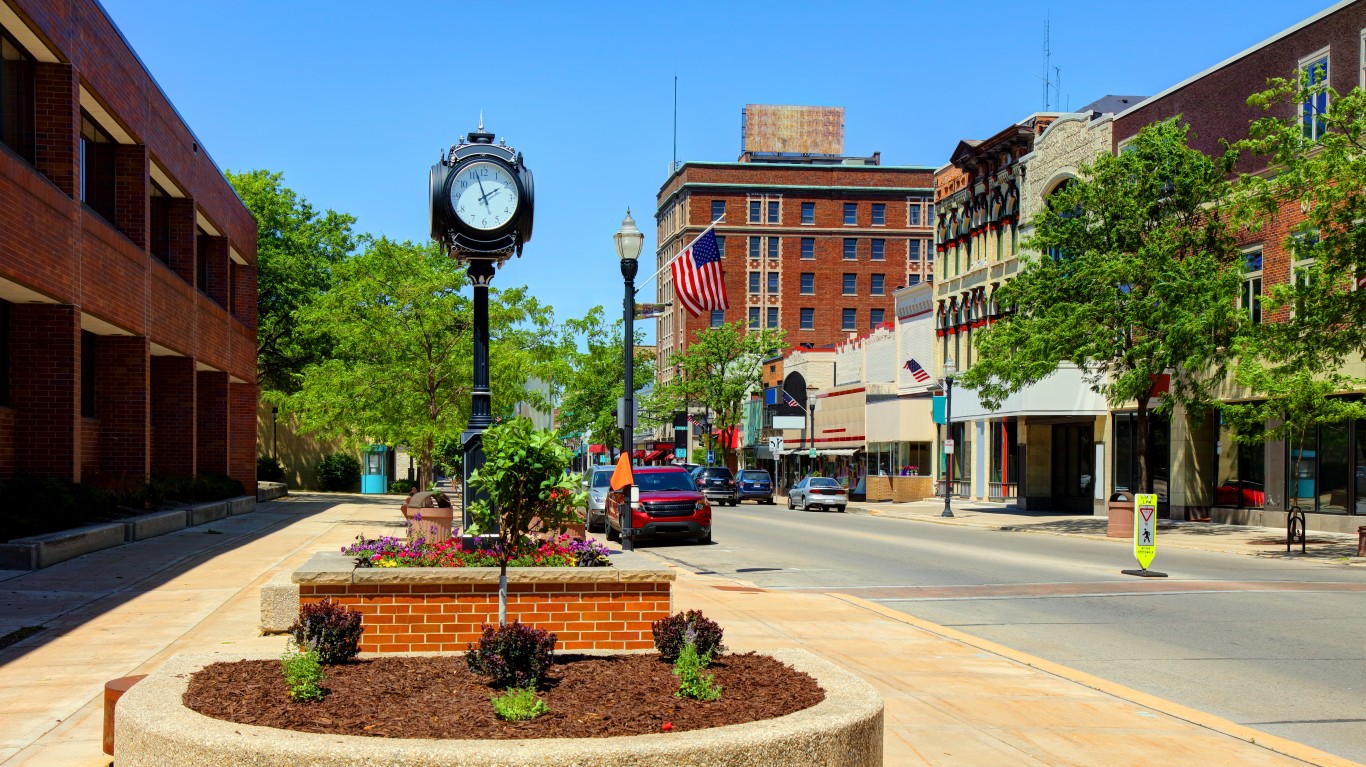
22. Fond du Lac, WI
> Pct. increase in total COVID-19 cases from Aug. 13 to Sept. 13: 103.2%
> Cases as of Aug. 13: 696 per 100,000 people (total: 712)
> Cases as of Sept. 13: 1,414 per 100,000 people (total: 1,447)
> COVID-19 related deaths as of Sept. 13: 12 per 100,000 people (total: 12)
> Population: 103,066
> Cases in Wisconsin as of Sept. 13: 1,534 per 100,000 people (total: 89,185)
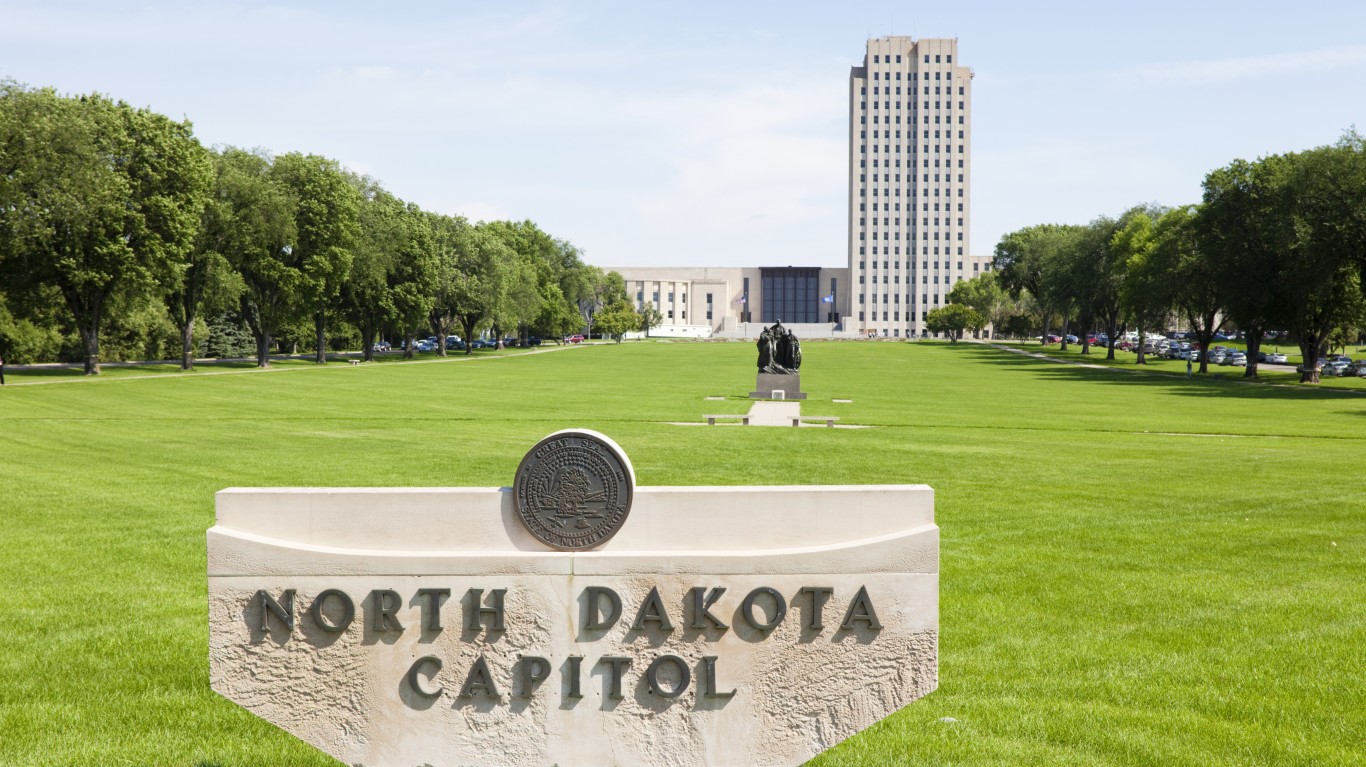
21. Bismarck, ND
> Pct. increase in total COVID-19 cases from Aug. 13 to Sept. 13: 107.0%
> Cases as of Aug. 13: 1,369 per 100,000 people (total: 1,726)
> Cases as of Sept. 13: 2,833 per 100,000 people (total: 3,573)
> COVID-19 related deaths as of Sept. 13: 26 per 100,000 people (total: 33)
> Population: 132,317
> Cases in North Dakota as of Sept. 13: 2,049 per 100,000 people (total: 15,577)
[in-text-ad-2]

20. Terre Haute, IN
> Pct. increase in total COVID-19 cases from Aug. 13 to Sept. 13: 109.9%
> Cases as of Aug. 13: 622 per 100,000 people (total: 1,165)
> Cases as of Sept. 13: 1,305 per 100,000 people (total: 2,445)
> COVID-19 related deaths as of Sept. 13: 21 per 100,000 people (total: 39)
> Population: 168,679
> Cases in Indiana as of Sept. 13: 1,581 per 100,000 people (total: 105,804)
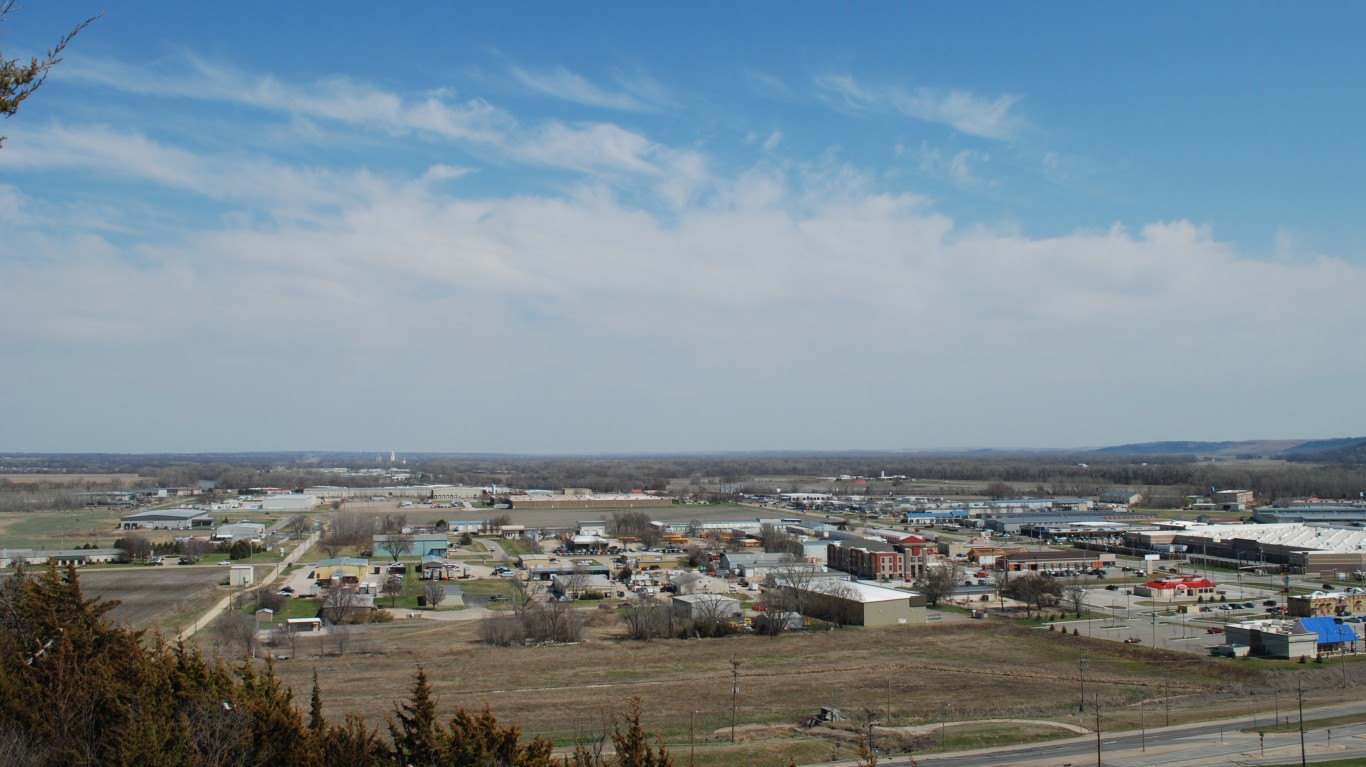
19. Manhattan, KS
> Pct. increase in total COVID-19 cases from Aug. 13 to Sept. 13: 110.2%
> Cases as of Aug. 13: 564 per 100,000 people (total: 754)
> Cases as of Sept. 13: 1,185 per 100,000 people (total: 1,585)
> COVID-19 related deaths as of Sept. 13: 00 per 100,000 people (total: 00)
> Population: 97,980
> Cases in Kansas as of Sept. 13: 1,662 per 100,000 people (total: 48,386)
[in-text-ad]
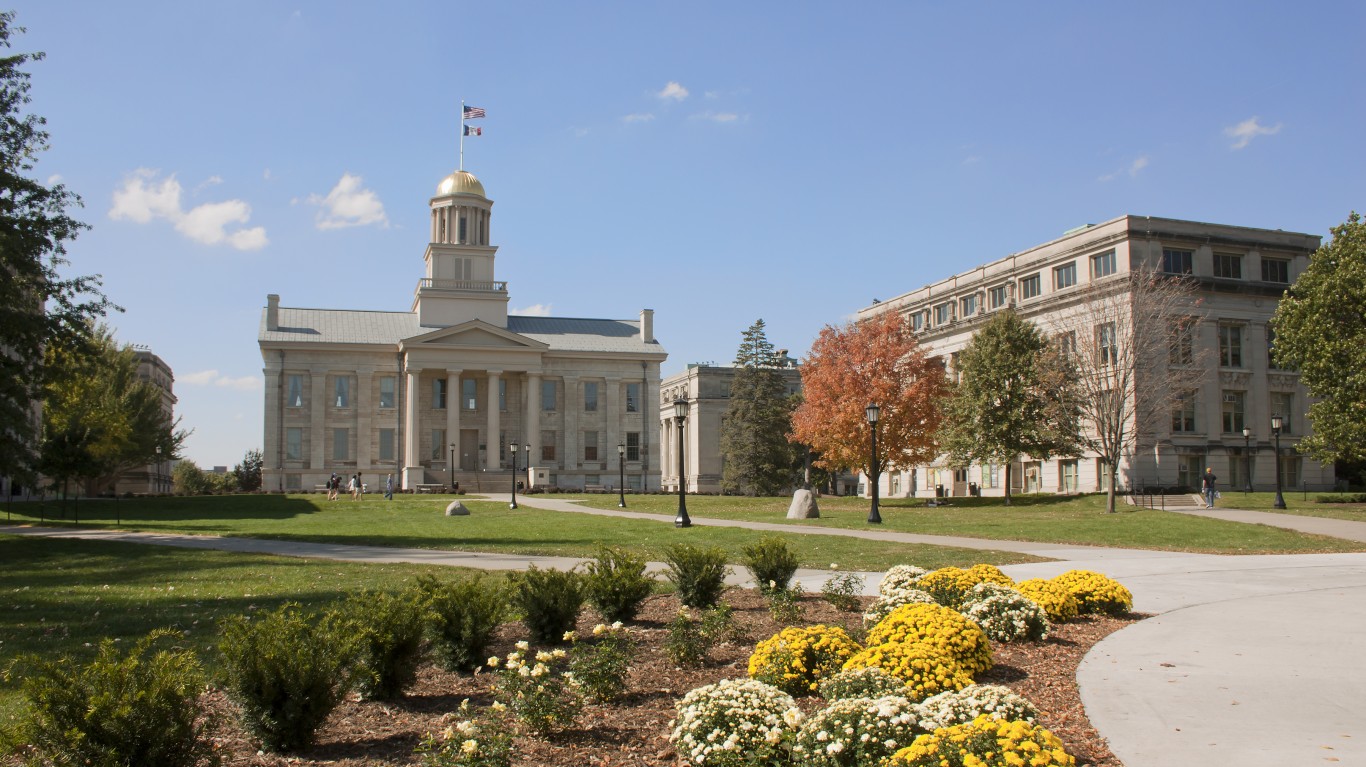
18. Iowa City, IA
> Pct. increase in total COVID-19 cases from Aug. 13 to Sept. 13: 112.8%
> Cases as of Aug. 13: 1,440 per 100,000 people (total: 2,436)
> Cases as of Sept. 13: 3,064 per 100,000 people (total: 5,183)
> COVID-19 related deaths as of Sept. 13: 22 per 100,000 people (total: 37)
> Population: 173,401
> Cases in Iowa as of Sept. 13: 2,356 per 100,000 people (total: 74,361)

17. Rapid City, SD
> Pct. increase in total COVID-19 cases from Aug. 13 to Sept. 13: 115.1%
> Cases as of Aug. 13: 741 per 100,000 people (total: 1,013)
> Cases as of Sept. 13: 1,594 per 100,000 people (total: 2,179)
> COVID-19 related deaths as of Sept. 13: 26 per 100,000 people (total: 36)
> Population: 147,316
> Cases in South Dakota as of Sept. 13: 1,886 per 100,000 people (total: 16,638)

16. Lewiston, ID-WA
> Pct. increase in total COVID-19 cases from Aug. 13 to Sept. 13: 118.6%
> Cases as of Aug. 13: 318 per 100,000 people (total: 199)
> Cases as of Sept. 13: 696 per 100,000 people (total: 435)
> COVID-19 related deaths as of Sept. 13: 35 per 100,000 people (total: 22)
> Population: 63,018
> Cases in Idaho as of Sept. 13: 2,011 per 100,000 people (total: 35,279)
[in-text-ad-2]

15. Muncie, IN
> Pct. increase in total COVID-19 cases from Aug. 13 to Sept. 13: 123.6%
> Cases as of Aug. 13: 664 per 100,000 people (total: 768)
> Cases as of Sept. 13: 1,485 per 100,000 people (total: 1,717)
> COVID-19 related deaths as of Sept. 13: 51 per 100,000 people (total: 59)
> Population: 114,772
> Cases in Indiana as of Sept. 13: 1,581 per 100,000 people (total: 105,804)
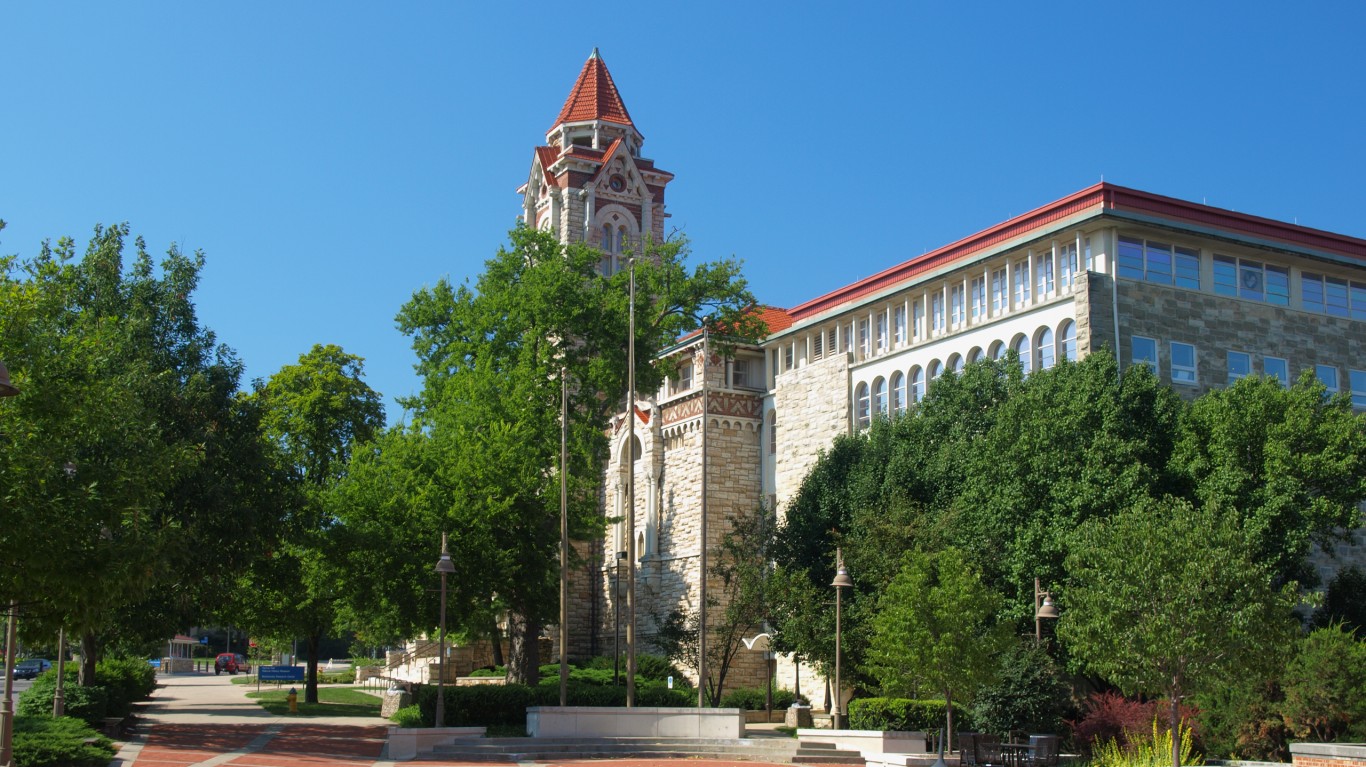
14. Lawrence, KS
> Pct. increase in total COVID-19 cases from Aug. 13 to Sept. 13: 123.9%
> Cases as of Aug. 13: 620 per 100,000 people (total: 740)
> Cases as of Sept. 13: 1,389 per 100,000 people (total: 1,657)
> COVID-19 related deaths as of Sept. 13: 00 per 100,000 people (total: 00)
> Population: 121,436
> Cases in Kansas as of Sept. 13: 1,662 per 100,000 people (total: 48,386)
[in-text-ad]

13. Champaign-Urbana, IL
> Pct. increase in total COVID-19 cases from Aug. 13 to Sept. 13: 131.5%
> Cases as of Aug. 13: 794 per 100,000 people (total: 1,794)
> Cases as of Sept. 13: 1,839 per 100,000 people (total: 4,154)
> COVID-19 related deaths as of Sept. 13: 09 per 100,000 people (total: 20)
> Population: 237,356
> Cases in Illinois as of Sept. 13: 2,051 per 100,000 people (total: 261,371)

12. Jefferson City, MO
> Pct. increase in total COVID-19 cases from Aug. 13 to Sept. 13: 138.4%
> Cases as of Aug. 13: 566 per 100,000 people (total: 855)
> Cases as of Sept. 13: 1,348 per 100,000 people (total: 2,038)
> COVID-19 related deaths as of Sept. 13: 09 per 100,000 people (total: 14)
> Population: 150,243
> Cases in Missouri as of Sept. 13: 1,676 per 100,000 people (total: 102,706)
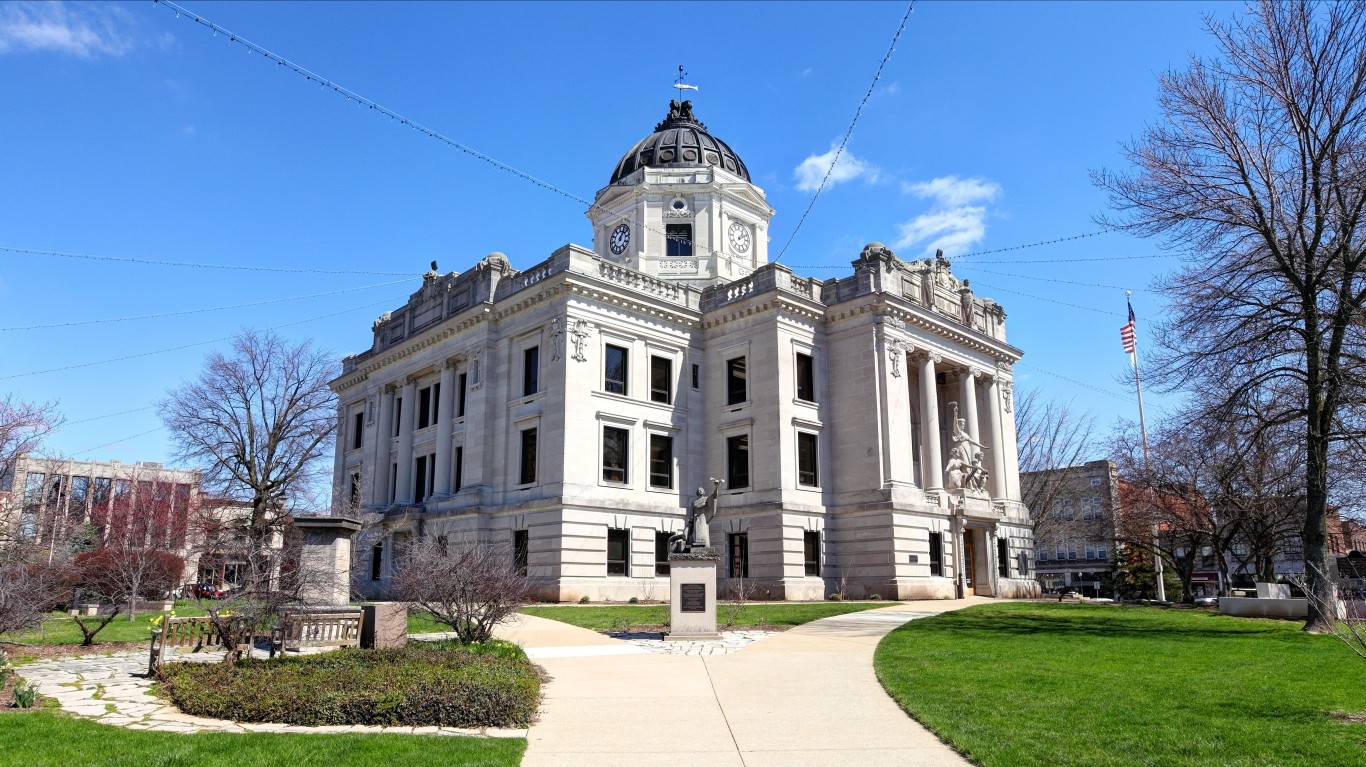
11. Bloomington, IN
> Pct. increase in total COVID-19 cases from Aug. 13 to Sept. 13: 142.1%
> Cases as of Aug. 13: 533 per 100,000 people (total: 887)
> Cases as of Sept. 13: 1,291 per 100,000 people (total: 2,147)
> COVID-19 related deaths as of Sept. 13: 22 per 100,000 people (total: 37)
> Population: 167,762
> Cases in Indiana as of Sept. 13: 1,581 per 100,000 people (total: 105,804)
[in-text-ad-2]
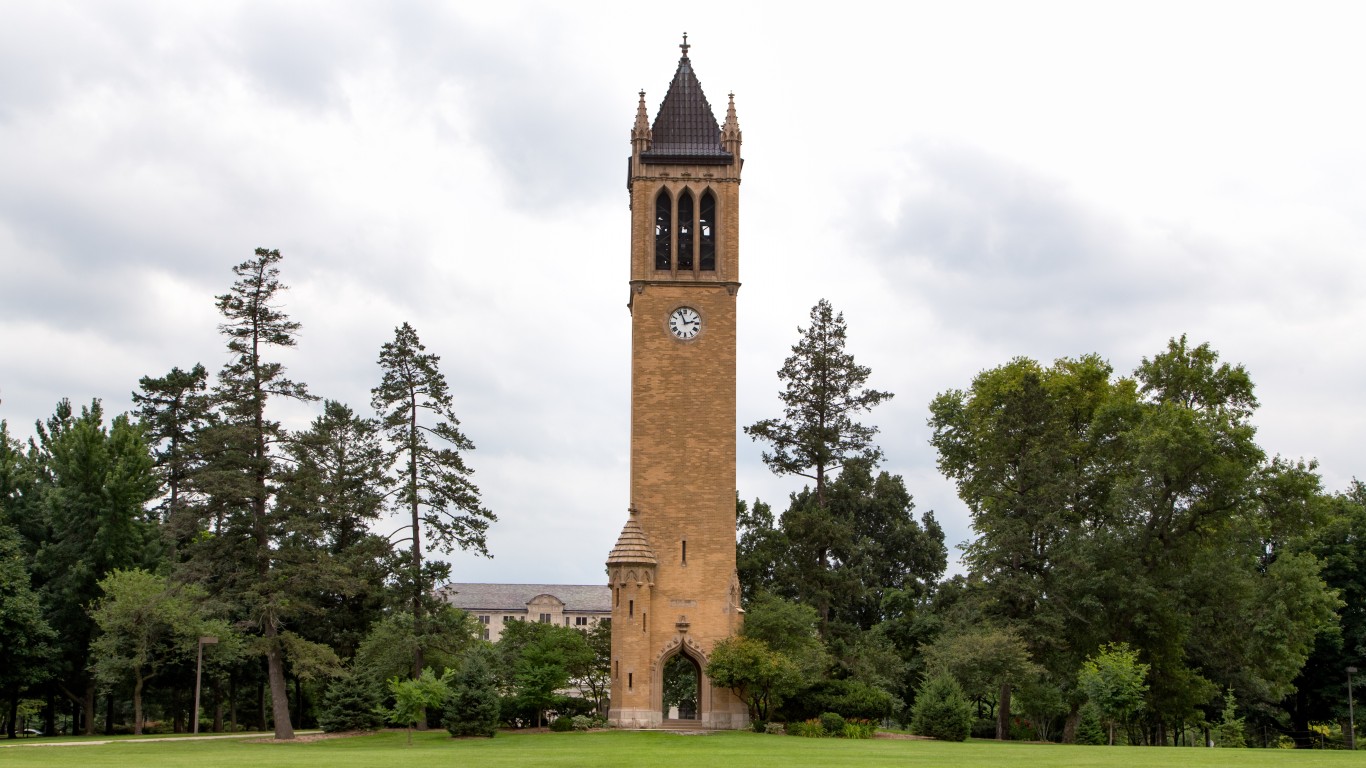
10. Ames, IA
> Pct. increase in total COVID-19 cases from Aug. 13 to Sept. 13: 142.6%
> Cases as of Aug. 13: 1,177 per 100,000 people (total: 1,452)
> Cases as of Sept. 13: 2,857 per 100,000 people (total: 3,523)
> COVID-19 related deaths as of Sept. 13: 18 per 100,000 people (total: 22)
> Population: 98,105
> Cases in Iowa as of Sept. 13: 2,356 per 100,000 people (total: 74,361)

9. Grand Forks, ND-MN
> Pct. increase in total COVID-19 cases from Aug. 13 to Sept. 13: 142.8%
> Cases as of Aug. 13: 867 per 100,000 people (total: 884)
> Cases as of Sept. 13: 2,104 per 100,000 people (total: 2,146)
> COVID-19 related deaths as of Sept. 13: 16 per 100,000 people (total: 16)
> Population: 102,299
> Cases in North Dakota as of Sept. 13: 2,049 per 100,000 people (total: 15,577)
[in-text-ad]

8. Urban Honolulu, HI
> Pct. increase in total COVID-19 cases from Aug. 13 to Sept. 13: 147.5%
> Cases as of Aug. 13: 395 per 100,000 people (total: 3,900)
> Cases as of Sept. 13: 977 per 100,000 people (total: 9,654)
> COVID-19 related deaths as of Sept. 13: 09 per 100,000 people (total: 86)
> Population: 980,080
> Cases in Hawaii as of Sept. 13: 745 per 100,000 people (total: 10,588)
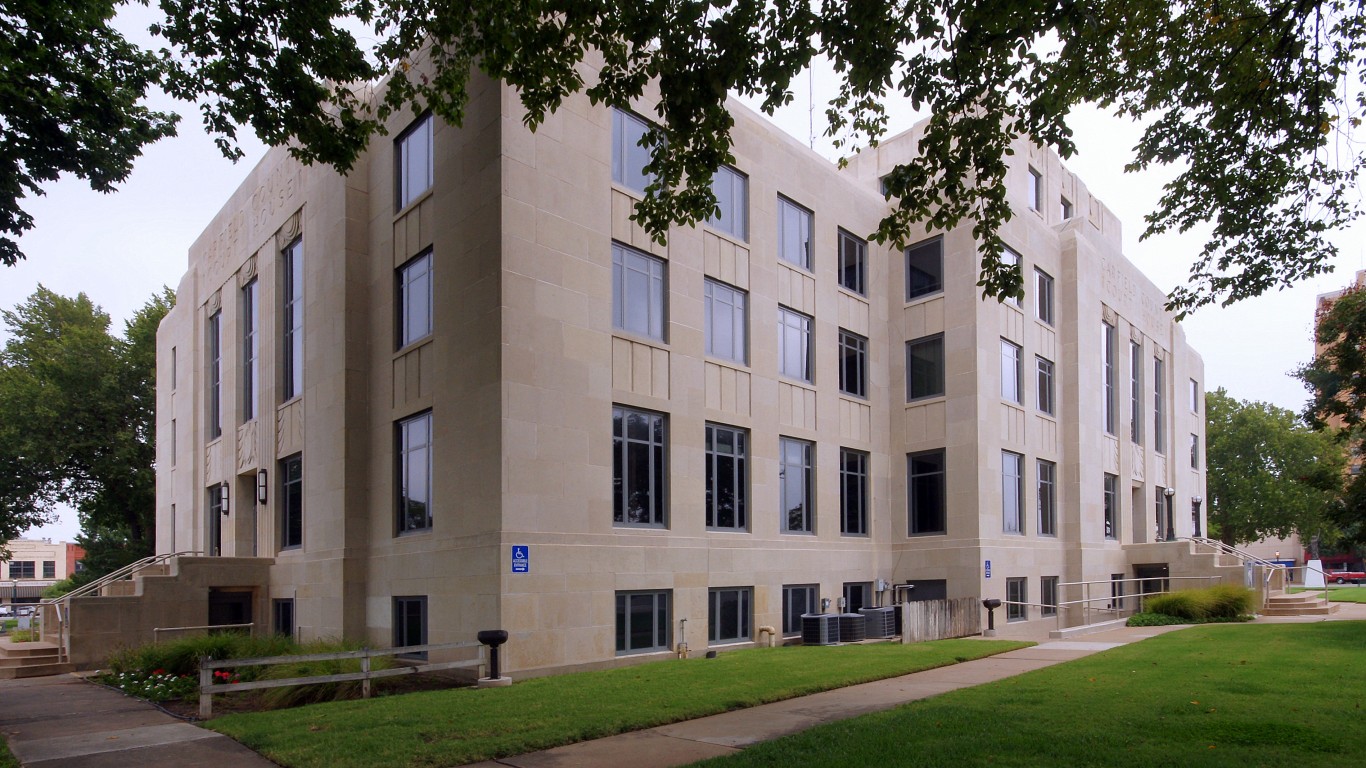
7. Enid, OK
> Pct. increase in total COVID-19 cases from Aug. 13 to Sept. 13: 148.6%
> Cases as of Aug. 13: 851 per 100,000 people (total: 529)
> Cases as of Sept. 13: 2,114 per 100,000 people (total: 1,315)
> COVID-19 related deaths as of Sept. 13: 27 per 100,000 people (total: 17)
> Population: 60,913
> Cases in Oklahoma as of Sept. 13: 1,759 per 100,000 people (total: 69,354)
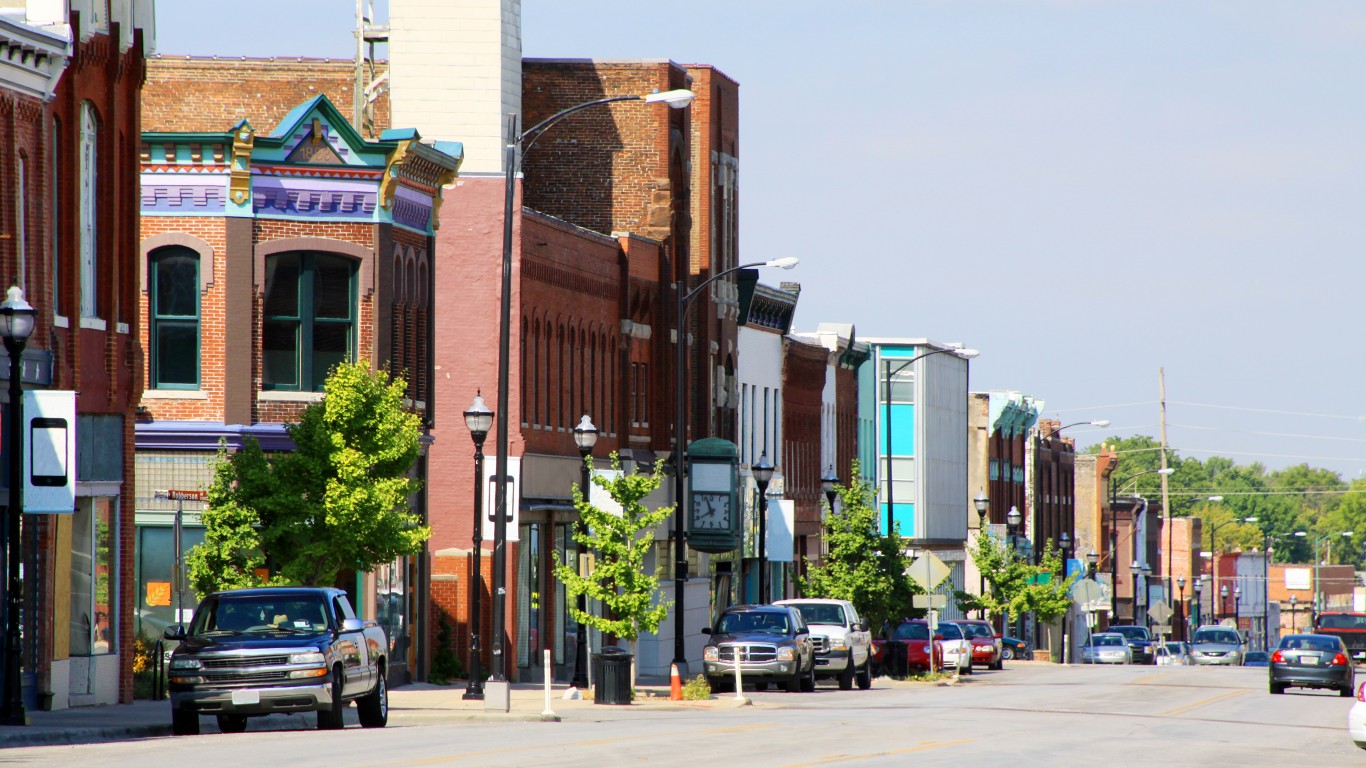
6. Springfield, MO
> Pct. increase in total COVID-19 cases from Aug. 13 to Sept. 13: 156.3%
> Cases as of Aug. 13: 561 per 100,000 people (total: 2,575)
> Cases as of Sept. 13: 1,439 per 100,000 people (total: 6,601)
> COVID-19 related deaths as of Sept. 13: 06 per 100,000 people (total: 26)
> Population: 468,126
> Cases in Missouri as of Sept. 13: 1,676 per 100,000 people (total: 102,706)
[in-text-ad-2]

5. Great Falls, MT
> Pct. increase in total COVID-19 cases from Aug. 13 to Sept. 13: 161.2%
> Cases as of Aug. 13: 208 per 100,000 people (total: 170)
> Cases as of Sept. 13: 543 per 100,000 people (total: 444)
> COVID-19 related deaths as of Sept. 13: 06 per 100,000 people (total: 05)
> Population: 81,643
> Cases in Montana as of Sept. 13: 849 per 100,000 people (total: 9,021)

4. Columbia, MO
> Pct. increase in total COVID-19 cases from Aug. 13 to Sept. 13: 166.7%
> Cases as of Aug. 13: 836 per 100,000 people (total: 1,708)
> Cases as of Sept. 13: 2,230 per 100,000 people (total: 4,555)
> COVID-19 related deaths as of Sept. 13: 05 per 100,000 people (total: 10)
> Population: 180,005
> Cases in Missouri as of Sept. 13: 1,676 per 100,000 people (total: 102,706)
[in-text-ad]

3. State College, PA
> Pct. increase in total COVID-19 cases from Aug. 13 to Sept. 13: 198.7%
> Cases as of Aug. 13: 235 per 100,000 people (total: 380)
> Cases as of Sept. 13: 703 per 100,000 people (total: 1,135)
> COVID-19 related deaths as of Sept. 13: 07 per 100,000 people (total: 11)
> Population: 162,805
> Cases in Pennsylvania as of Sept. 13: 1,123 per 100,000 people (total: 143,881)
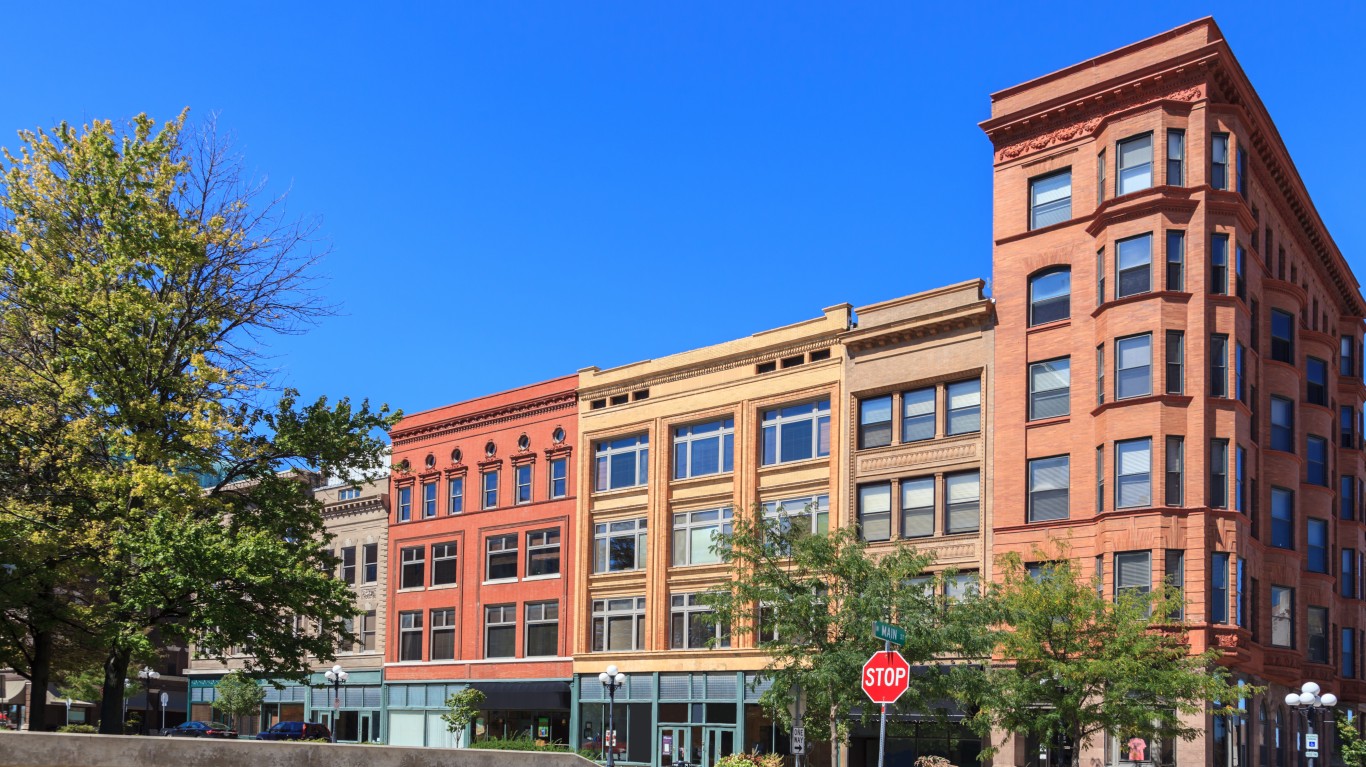
2. Bloomington, IL
> Pct. increase in total COVID-19 cases from Aug. 13 to Sept. 13: 313.8%
> Cases as of Aug. 13: 406 per 100,000 people (total: 703)
> Cases as of Sept. 13: 1,679 per 100,000 people (total: 2,909)
> COVID-19 related deaths as of Sept. 13: 10 per 100,000 people (total: 18)
> Population: 190,884
> Cases in Illinois as of Sept. 13: 2,051 per 100,000 people (total: 261,371)
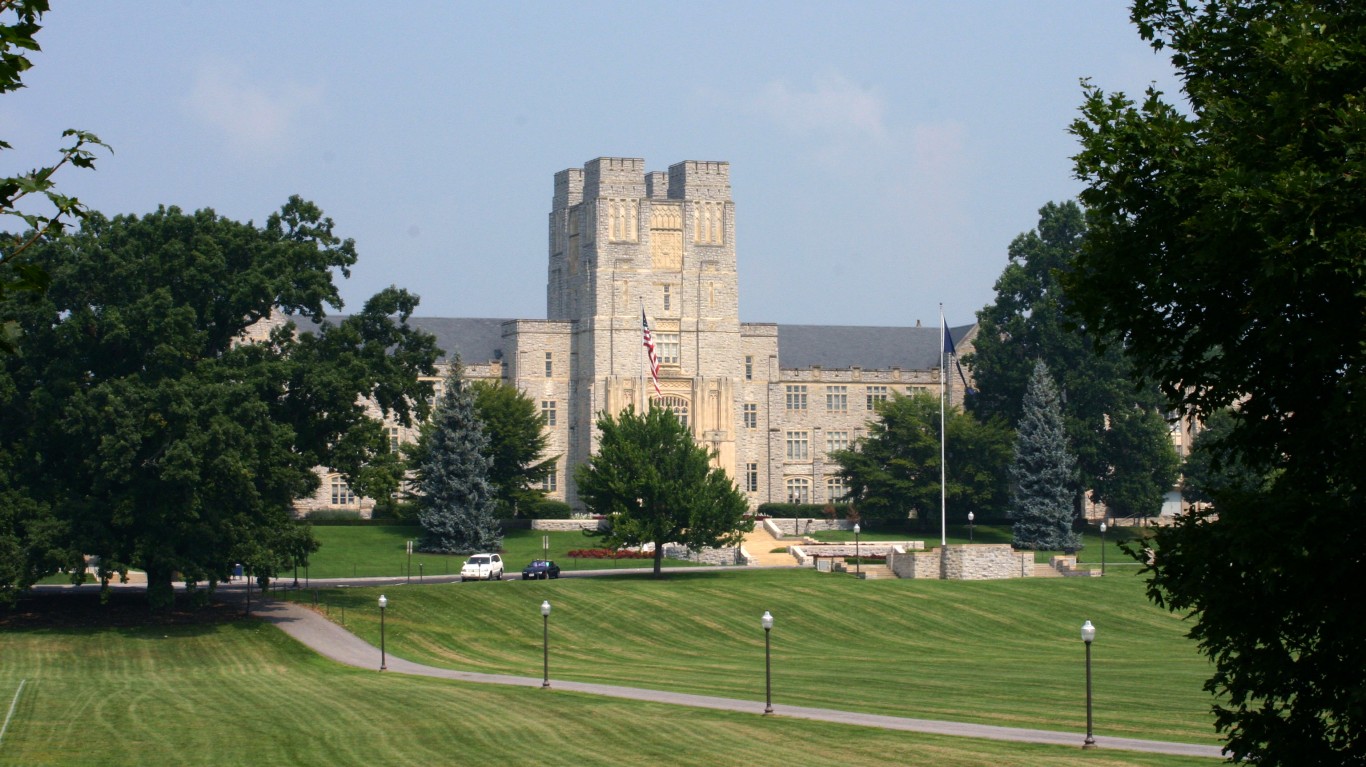
1. Blacksburg-Christiansburg, VA
> Pct. increase in total COVID-19 cases from Aug. 13 to Sept. 13: 369.0%
> Cases as of Aug. 13: 294 per 100,000 people (total: 490)
> Cases as of Sept. 13: 1,379 per 100,000 people (total: 2,298)
> COVID-19 related deaths as of Sept. 13: 04 per 100,000 people (total: 07)
> Population: 181,926
> Cases in Virginia as of Sept. 13: 1,571 per 100,000 people (total: 133,814)
Thank you for reading! Have some feedback for us?
Contact the 24/7 Wall St. editorial team.
 24/7 Wall St.
 24/7 Wall St.
 24/7 Wall St.