The typical U.S. household earned $65,712 in 2019 — up by nearly $3,000 from the previous year, according to recently released data from the U.S. Census Bureau. The increase in household income continues nearly a decade of uninterrupted year-over-year income growth in the United States since the last recession.
Though median household income stands at an all time high, in much of the country, incomes are much lower than the national benchmark. Even in major metropolitan areas — places that are often considered drivers of regional economies — most households earn far less than what is typical nationwide.
Using median household income data from the Census Bureau’s 2019 American Community Survey for all 384 metropolitan areas, 24/7 Wall St. identified America’s poorest cities. In each of the metro areas on this list, the median household income is below $50,000.
Supplemental data on median home value, the percentage of adults age 25 and older with at least a bachelor’s degree, and median household income in 2018 also came from the 2019 ACS. Data on 2019 unemployment came from the Bureau of Labor Statistics. For context, we noted when metro areas fell within the highest and lowest 10% and 25% of all U.S. metro areas for each supplemental measure. If no context is provided for a given measure, the metro area falls in the middle two quartiles.
The vast majority of metro areas on this list — 35 out of 50 — are located in the South. By contrast, only one of the poorest metropolitan areas — Johnstown, Pennsylvania — is located in the Northeast.
Incomes tend to rise with educational attainment, and these cities and their surrounding areas also tend to have relatively small college-educated populations. Gainesville, Florida, is the only metro area on this list where the share of adults with a bachelor’s degree exceeds the 33.1% national average. Here is a look at the most educated city in every state.
Real estate values often reflect incomes in a given city or town. And with relatively low incomes, homes in the metro areas on this list are generally inexpensive. In all but eleven of the poorest U.S. metro areas, most homes are worth less than $150,000. With a median home value of $293,100, Grants Pass, Oregon, is the only metro area on this list where the typical home is worth more than the national median home value of $240,500. Here is a look at the least expensive place to live by state.
It is important to note that in every metro area on this list, the COVID-19 recession has pushed the jobless rate higher than the 2019 average. The impact that the climbing unemployment will have on incomes in these cities remains to be seen.
Click here to see America’s poorest cities

50. Jacksonville, NC
> Median household income: $49,544
> Median income change 2018 to 2019: -$1,407 (-2.8%)
> Median home value: $165,300
> Adults with a bachelor’s degree: 24.7%
> 2019 unemployment: 4.6% (highest 25% of US metros)
[in-text-ad]

49. Weirton-Steubenville, WV-OH
> Median household income: $49,510
> Median income change 2018 to 2019: +$5,167 (+11.7%)
> Median home value: $95,400 (lowest 10% of US metros)
> Adults with a bachelor’s degree: 17.5% (lowest 10% of US metros)
> 2019 unemployment: 5.6% (highest 10% of US metros)

48. Sumter, SC
> Median household income: $49,263
> Median income change 2018 to 2019: +$2,033 (+4.3%)
> Median home value: $126,600 (lowest 10% of US metros)
> Adults with a bachelor’s degree: 20.1% (lowest 25% of US metros)
> 2019 unemployment: 3.4%

47. Johnstown, PA
> Median household income: $49,076
> Median income change 2018 to 2019: +$3,037 (+6.6%)
> Median home value: $96,800 (lowest 10% of US metros)
> Adults with a bachelor’s degree: 20.6% (lowest 25% of US metros)
> 2019 unemployment: 5.3% (highest 25% of US metros)
[in-text-ad-2]

46. Battle Creek, MI
> Median household income: $49,055
> Median income change 2018 to 2019: +$664 (+1.4%)
> Median home value: $115,700 (lowest 10% of US metros)
> Adults with a bachelor’s degree: 20.2% (lowest 25% of US metros)
> 2019 unemployment: 4.1%

45. Columbus, GA-AL
> Median household income: $49,013
> Median income change 2018 to 2019: -$1,134 (-2.3%)
> Median home value: $145,900 (lowest 25% of US metros)
> Adults with a bachelor’s degree: 23.1%
> 2019 unemployment: 4.0%
[in-text-ad]
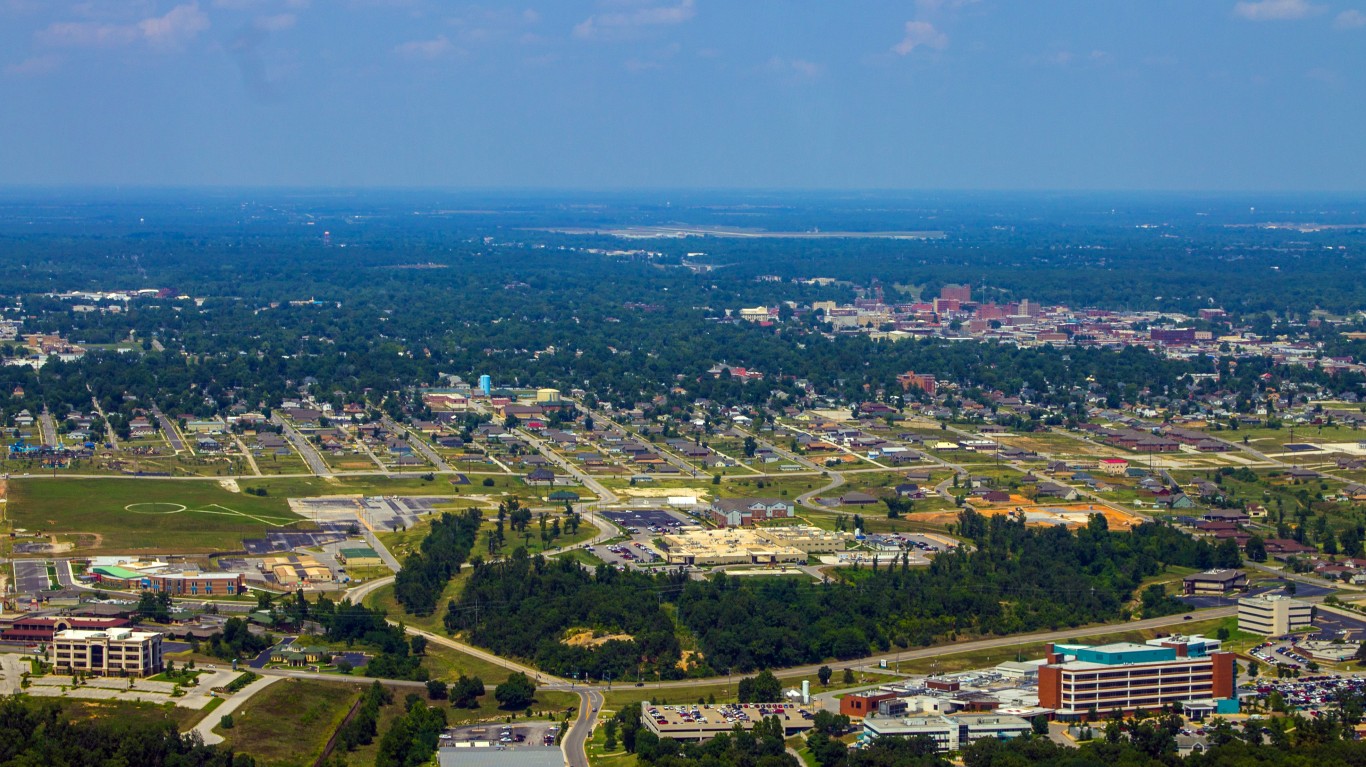
44. Joplin, MO
> Median household income: $48,909
> Median income change 2018 to 2019: +$873 (+1.8%)
> Median home value: $127,800 (lowest 10% of US metros)
> Adults with a bachelor’s degree: 22.8%
> 2019 unemployment: 3.1%
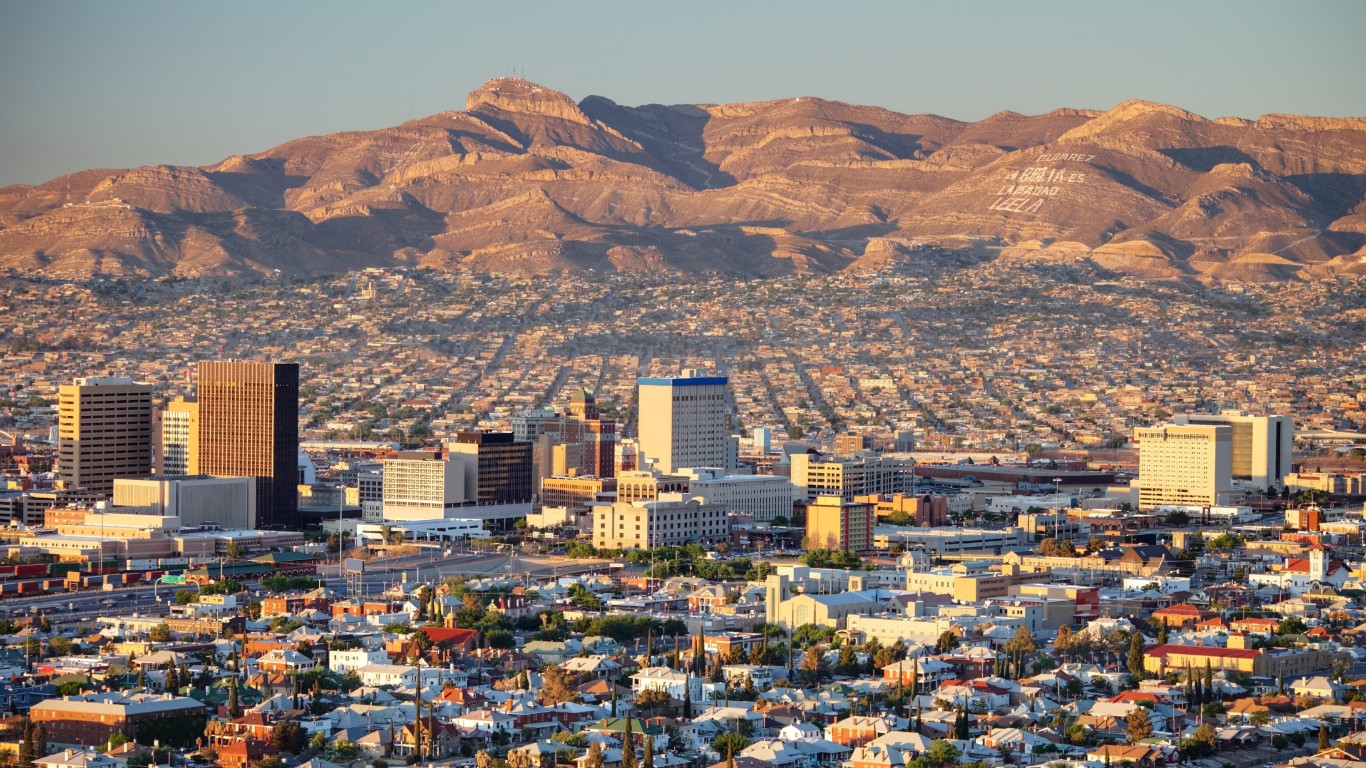
43. El Paso, TX
> Median household income: $48,823
> Median income change 2018 to 2019: +$3,959 (+8.8%)
> Median home value: $125,100 (lowest 10% of US metros)
> Adults with a bachelor’s degree: 23.3%
> 2019 unemployment: 3.8%

42. Jackson, TN
> Median household income: $48,700
> Median income change 2018 to 2019: +$2,394 (+5.2%)
> Median home value: $121,400 (lowest 10% of US metros)
> Adults with a bachelor’s degree: 22.5% (lowest 25% of US metros)
> 2019 unemployment: 3.5%
[in-text-ad-2]

41. Sebring-Avon Park, FL
> Median household income: $48,698
> Median income change 2018 to 2019: +$8,140 (+20.1%)
> Median home value: $144,900 (lowest 25% of US metros)
> Adults with a bachelor’s degree: 16.7% (lowest 10% of US metros)
> 2019 unemployment: 4.5% (highest 25% of US metros)

40. Parkersburg-Vienna, WV
> Median household income: $48,680
> Median income change 2018 to 2019: +$3,599 (+8.0%)
> Median home value: $129,900 (lowest 25% of US metros)
> Adults with a bachelor’s degree: 20.0% (lowest 25% of US metros)
> 2019 unemployment: 5.3% (highest 25% of US metros)
[in-text-ad]

39. Kingsport-Bristol, TN-VA
> Median household income: $48,615
> Median income change 2018 to 2019: +$6,321 (+14.9%)
> Median home value: $149,200 (lowest 25% of US metros)
> Adults with a bachelor’s degree: 23.0%
> 2019 unemployment: 3.7%

38. Youngstown-Warren-Boardman, OH-PA
> Median household income: $48,558
> Median income change 2018 to 2019: +$424 (+0.9%)
> Median home value: $108,900 (lowest 10% of US metros)
> Adults with a bachelor’s degree: 22.8%
> 2019 unemployment: 5.7% (highest 10% of US metros)
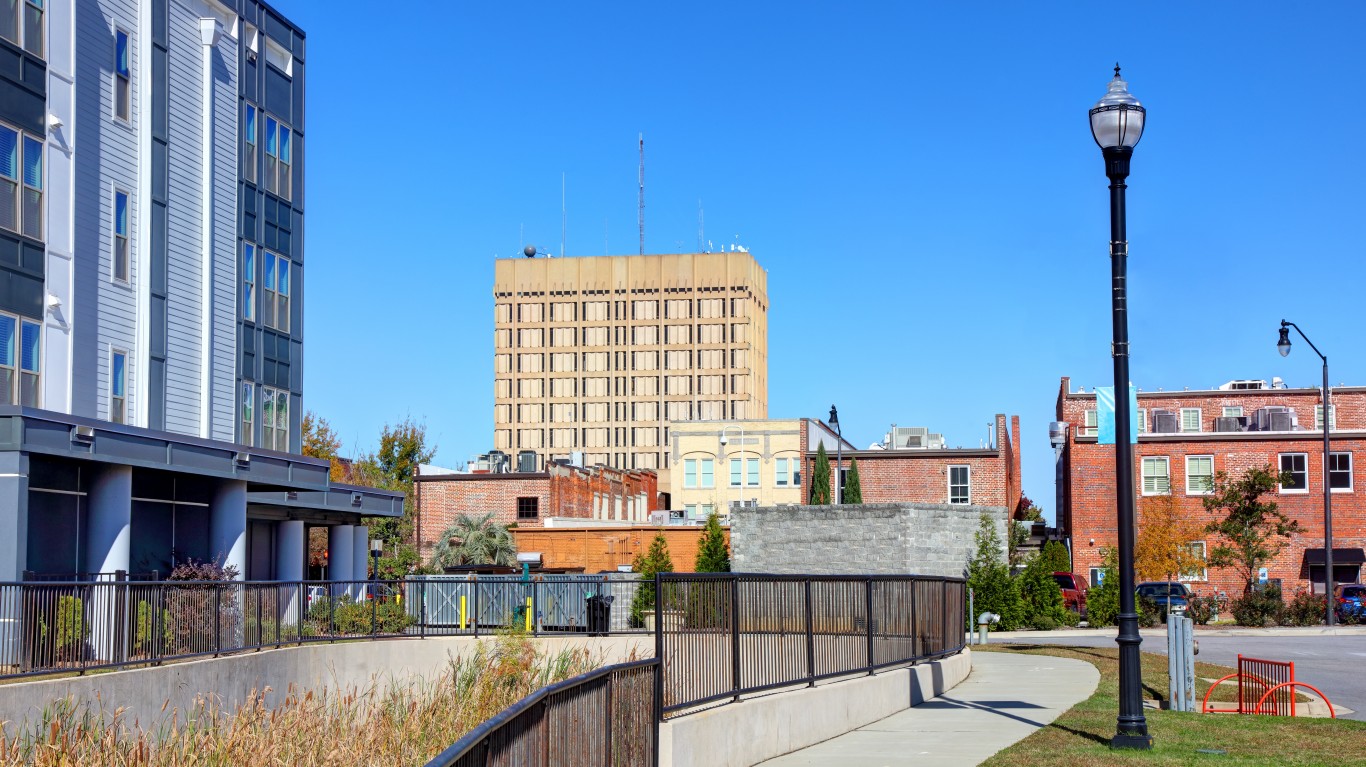
37. Florence, SC
> Median household income: $48,547
> Median income change 2018 to 2019: +$4,696 (+10.7%)
> Median home value: $128,500 (lowest 25% of US metros)
> Adults with a bachelor’s degree: 23.1%
> 2019 unemployment: 3.1%
[in-text-ad-2]

36. Sierra Vista-Douglas, AZ
> Median household income: $48,484
> Median income change 2018 to 2019: -$3,283 (-6.3%)
> Median home value: $154,000
> Adults with a bachelor’s degree: 25.0%
> 2019 unemployment: 5.7% (highest 10% of US metros)

35. El Centro, CA
> Median household income: $48,472
> Median income change 2018 to 2019: -$1,204 (-2.4%)
> Median home value: $229,600
> Adults with a bachelor’s degree: 18.4% (lowest 10% of US metros)
> 2019 unemployment: 18.3% (highest 10% of US metros)
[in-text-ad]

34. Macon-Bibb County, GA
> Median household income: $48,435
> Median income change 2018 to 2019: +$5,291 (+12.3%)
> Median home value: $125,200 (lowest 10% of US metros)
> Adults with a bachelor’s degree: 24.1%
> 2019 unemployment: 3.7%
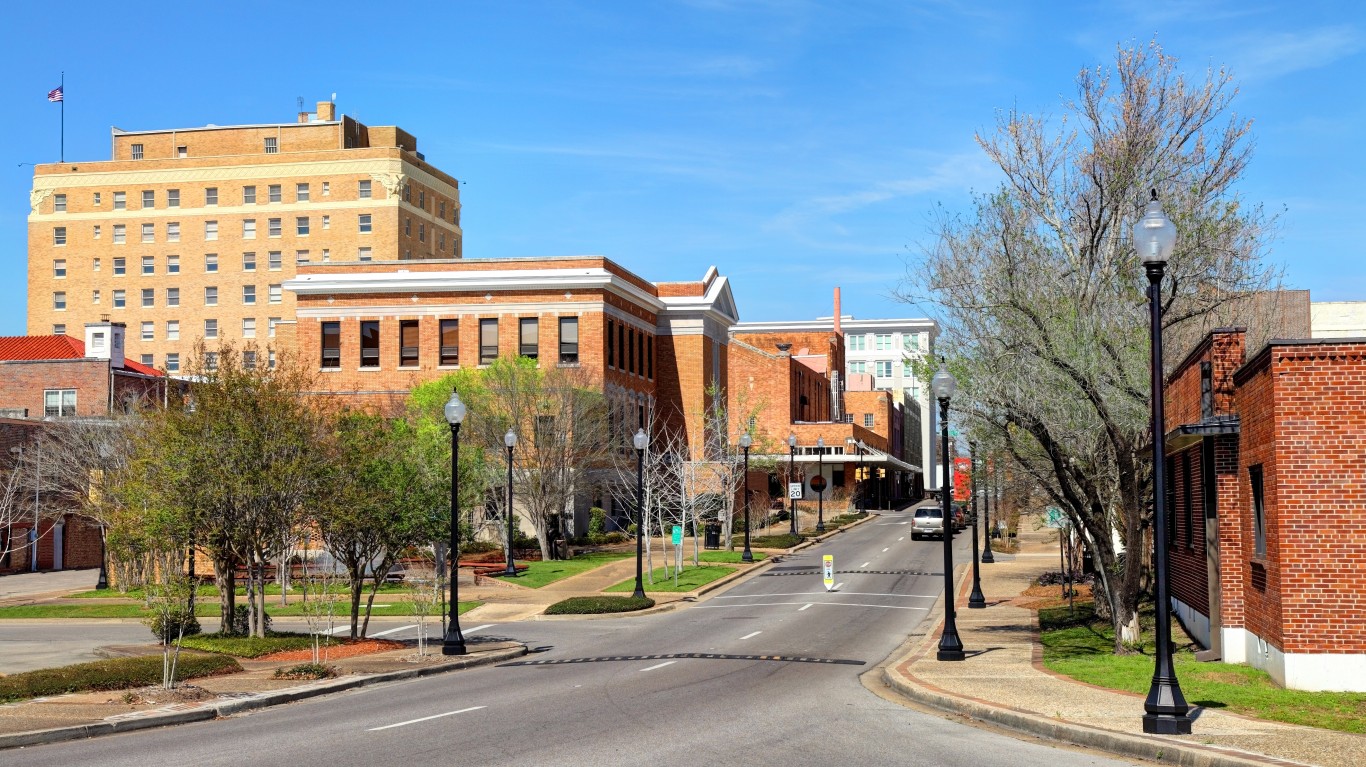
33. Hattiesburg, MS
> Median household income: $48,359
> Median income change 2018 to 2019: +$2,614 (+5.7%)
> Median home value: $145,300 (lowest 25% of US metros)
> Adults with a bachelor’s degree: 25.5%
> 2019 unemployment: 4.8% (highest 25% of US metros)

32. Huntington-Ashland, WV-KY-OH
> Median household income: $48,329
> Median income change 2018 to 2019: +$1,987 (+4.3%)
> Median home value: $128,800 (lowest 25% of US metros)
> Adults with a bachelor’s degree: 21.4% (lowest 25% of US metros)
> 2019 unemployment: 5.0% (highest 25% of US metros)
[in-text-ad-2]

31. Saginaw, MI
> Median household income: $48,303
> Median income change 2018 to 2019: -$1,361 (-2.7%)
> Median home value: $108,300 (lowest 10% of US metros)
> Adults with a bachelor’s degree: 21.8% (lowest 25% of US metros)
> 2019 unemployment: 4.8% (highest 25% of US metros)
30. Anniston-Oxford, AL
> Median household income: $48,156
> Median income change 2018 to 2019: +$1,189 (+2.5%)
> Median home value: $121,600 (lowest 10% of US metros)
> Adults with a bachelor’s degree: 19.3% (lowest 10% of US metros)
> 2019 unemployment: 3.5%
[in-text-ad]
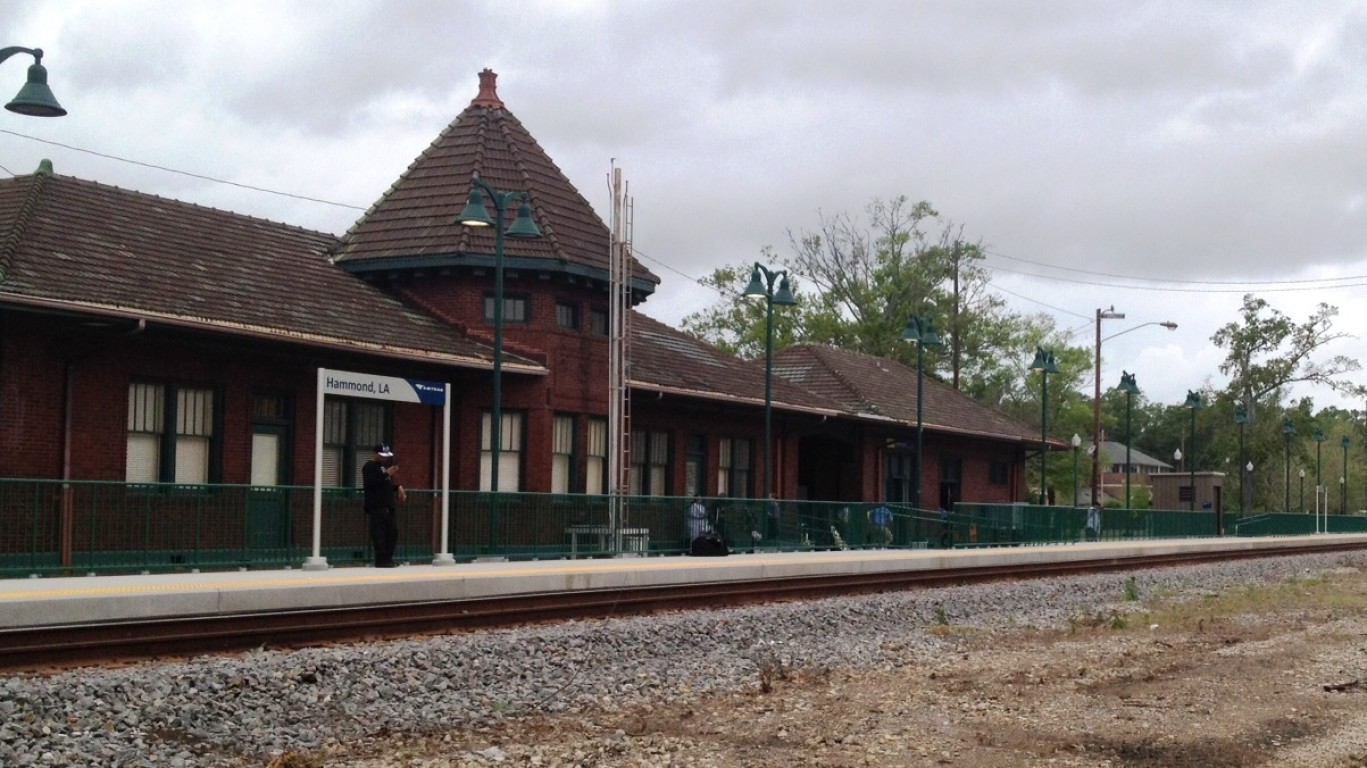
29. Hammond, LA
> Median household income: $47,825
> Median income change 2018 to 2019: -$1,205 (-2.5%)
> Median home value: $179,800
> Adults with a bachelor’s degree: 24.8%
> 2019 unemployment: 5.5% (highest 10% of US metros)
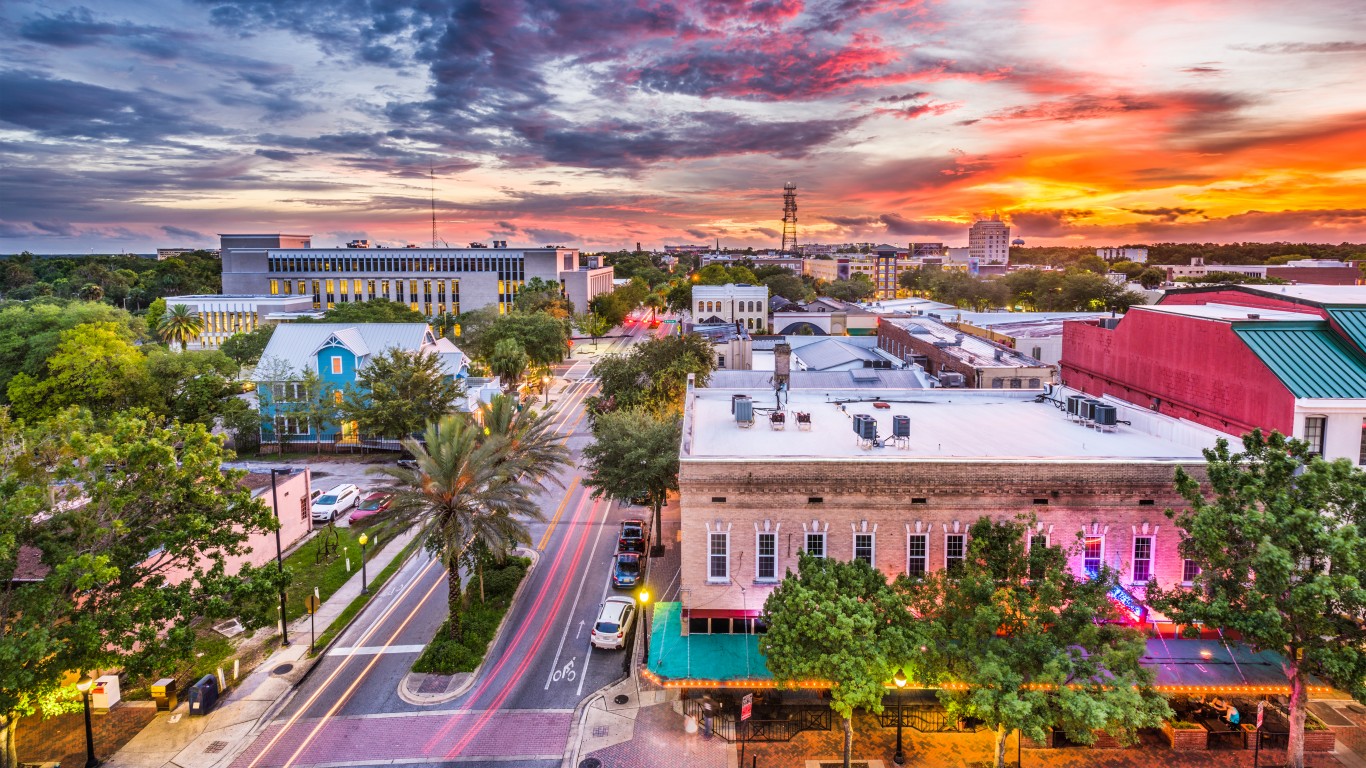
28. Gainesville, FL
> Median household income: $47,762
> Median income change 2018 to 2019: -$3,243 (-6.4%)
> Median home value: $191,700
> Adults with a bachelor’s degree: 38.9% (highest 25% of US metros)
> 2019 unemployment: 3.0%

27. Fayetteville, NC
> Median household income: $47,597
> Median income change 2018 to 2019: +$389 (+0.8%)
> Median home value: $144,800 (lowest 25% of US metros)
> Adults with a bachelor’s degree: 23.8%
> 2019 unemployment: 5.1% (highest 25% of US metros)
[in-text-ad-2]
26. Grants Pass, OR
> Median household income: $47,573
> Median income change 2018 to 2019: -$1,765 (-3.6%)
> Median home value: $293,100 (highest 25% of US metros)
> Adults with a bachelor’s degree: 16.8% (lowest 10% of US metros)
> 2019 unemployment: 5.0% (highest 25% of US metros)

25. Charleston, WV
> Median household income: $47,500
> Median income change 2018 to 2019: +$6,185 (+15.0%)
> Median home value: $105,200 (lowest 10% of US metros)
> Adults with a bachelor’s degree: 22.6% (lowest 25% of US metros)
> 2019 unemployment: 4.8% (highest 25% of US metros)
[in-text-ad]

24. Shreveport-Bossier City, LA
> Median household income: $47,447
> Median income change 2018 to 2019: +$4,560 (+10.6%)
> Median home value: $160,500
> Adults with a bachelor’s degree: 22.8%
> 2019 unemployment: 5.1% (highest 25% of US metros)
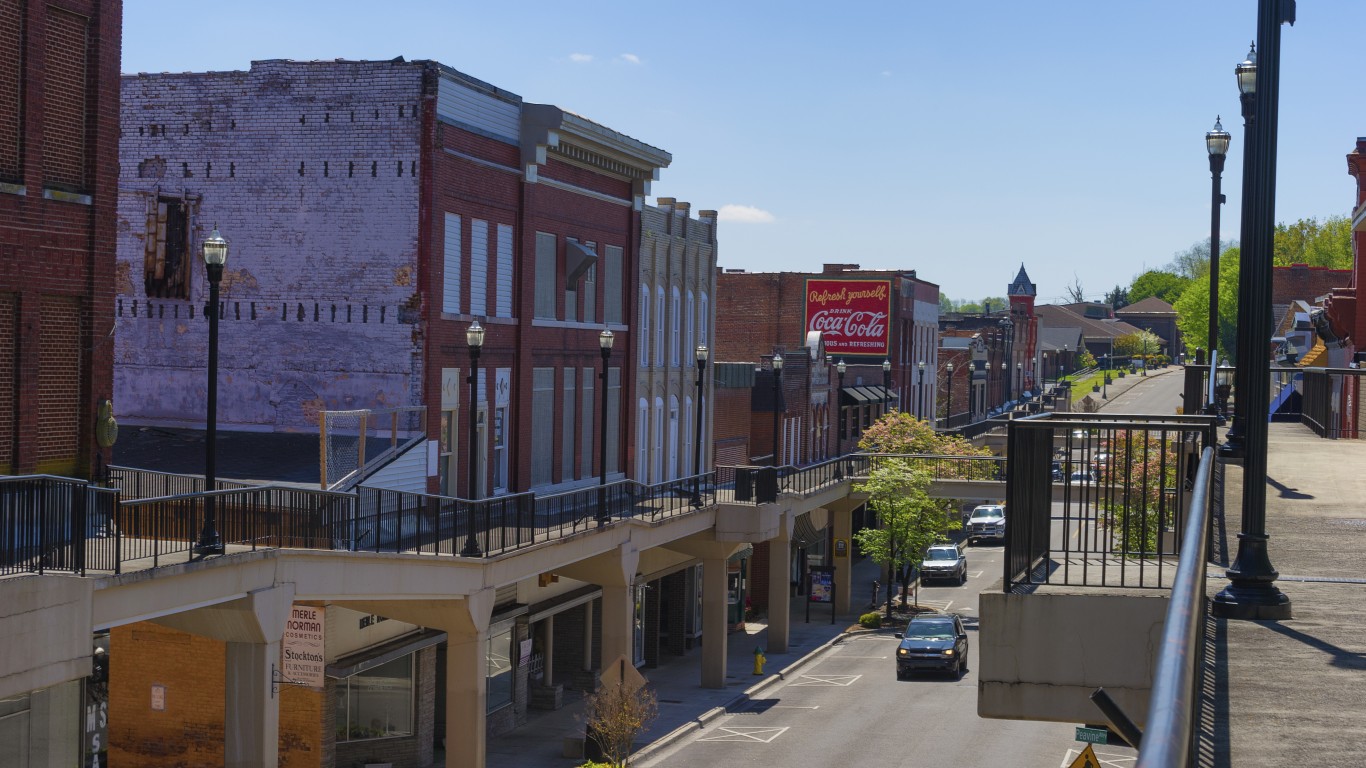
23. Morristown, TN
> Median household income: $47,326
> Median income change 2018 to 2019: -$708 (-1.5%)
> Median home value: $145,700 (lowest 25% of US metros)
> Adults with a bachelor’s degree: 19.3% (lowest 10% of US metros)
> 2019 unemployment: 3.8%

22. Springfield, MO
> Median household income: $47,034
> Median income change 2018 to 2019: -$324 (-0.7%)
> Median home value: $161,700
> Adults with a bachelor’s degree: 27.5%
> 2019 unemployment: 2.9% (lowest 25% of US metros)
[in-text-ad-2]
21. Carbondale-Marion, IL
> Median household income: $46,882
> Median income change 2018 to 2019: +$3,745 (+8.7%)
> Median home value: $115,500 (lowest 10% of US metros)
> Adults with a bachelor’s degree: 28.2%
> 2019 unemployment: 4.1%
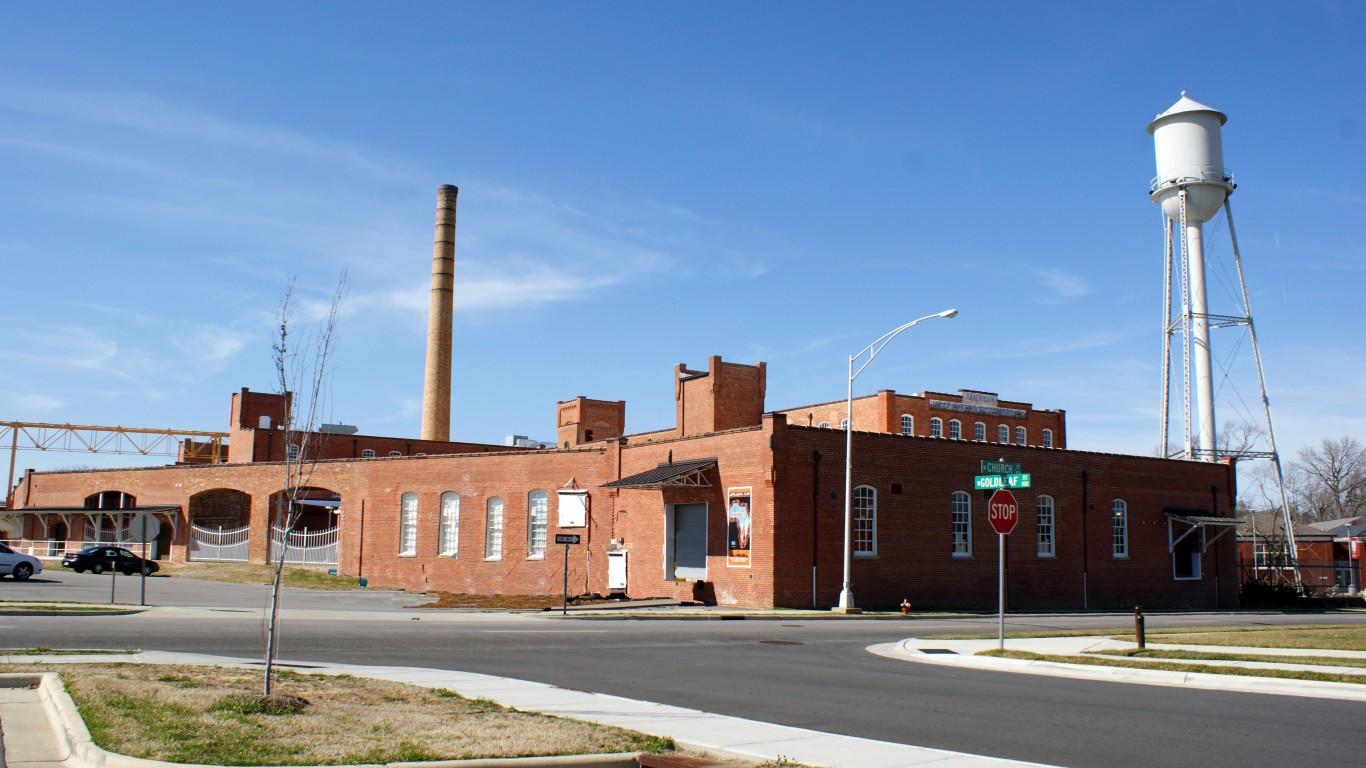
20. Rocky Mount, NC
> Median household income: $46,466
> Median income change 2018 to 2019: -$1,073 (-2.3%)
> Median home value: $113,900 (lowest 10% of US metros)
> Adults with a bachelor’s degree: 17.4% (lowest 10% of US metros)
> 2019 unemployment: 5.2% (highest 25% of US metros)
[in-text-ad]
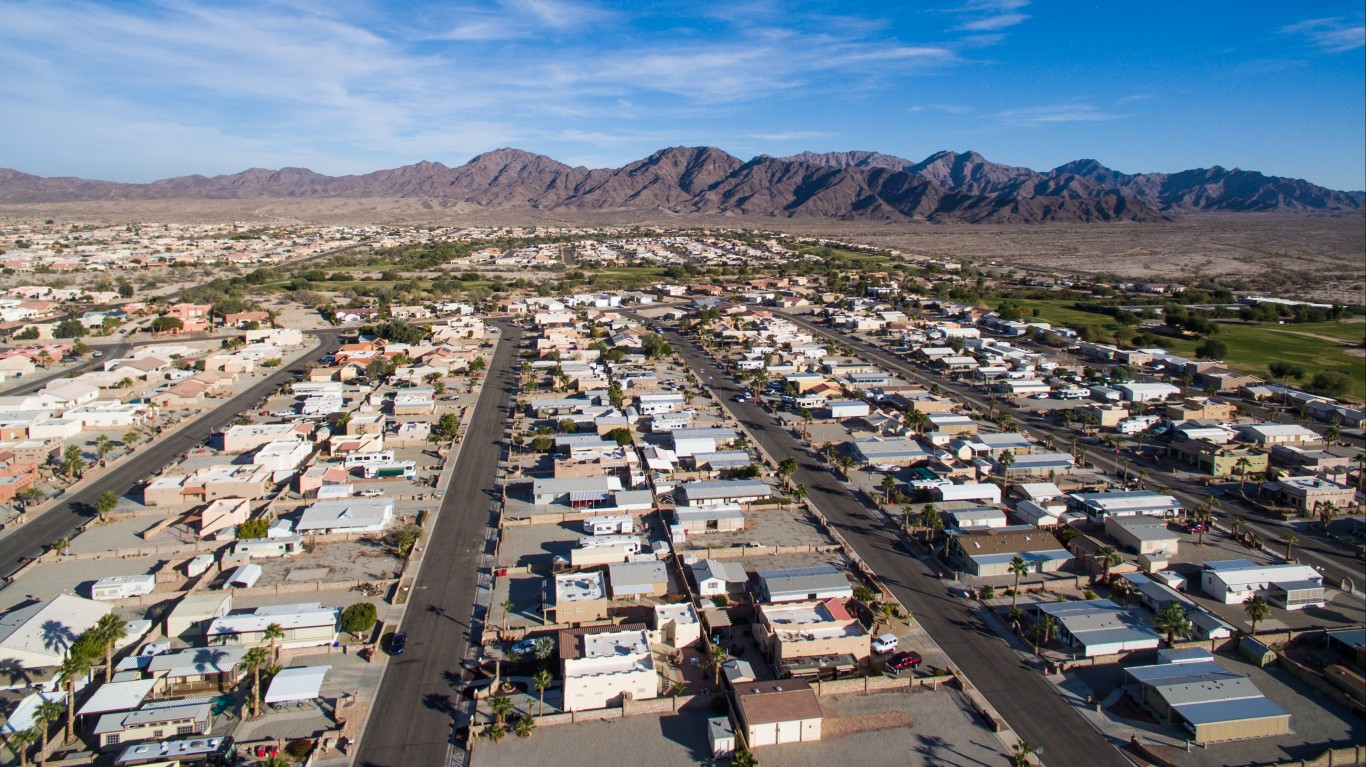
19. Yuma, AZ
> Median household income: $46,419
> Median income change 2018 to 2019: +$2,396 (+5.4%)
> Median home value: $139,100 (lowest 25% of US metros)
> Adults with a bachelor’s degree: 14.2% (lowest 10% of US metros)
> 2019 unemployment: 16.4% (highest 10% of US metros)
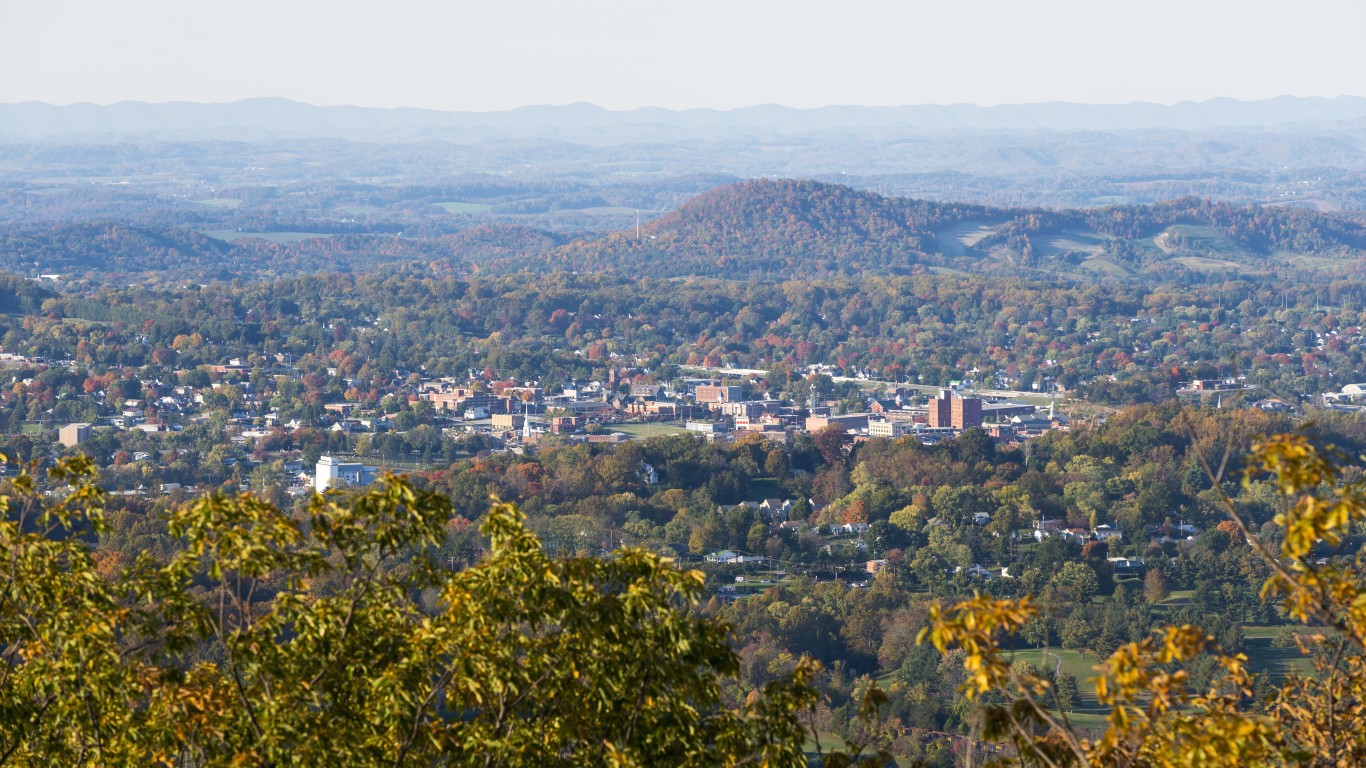
18. Johnson City, TN
> Median household income: $45,917
> Median income change 2018 to 2019: -$706 (-1.5%)
> Median home value: $156,400
> Adults with a bachelor’s degree: 26.5%
> 2019 unemployment: 3.7%
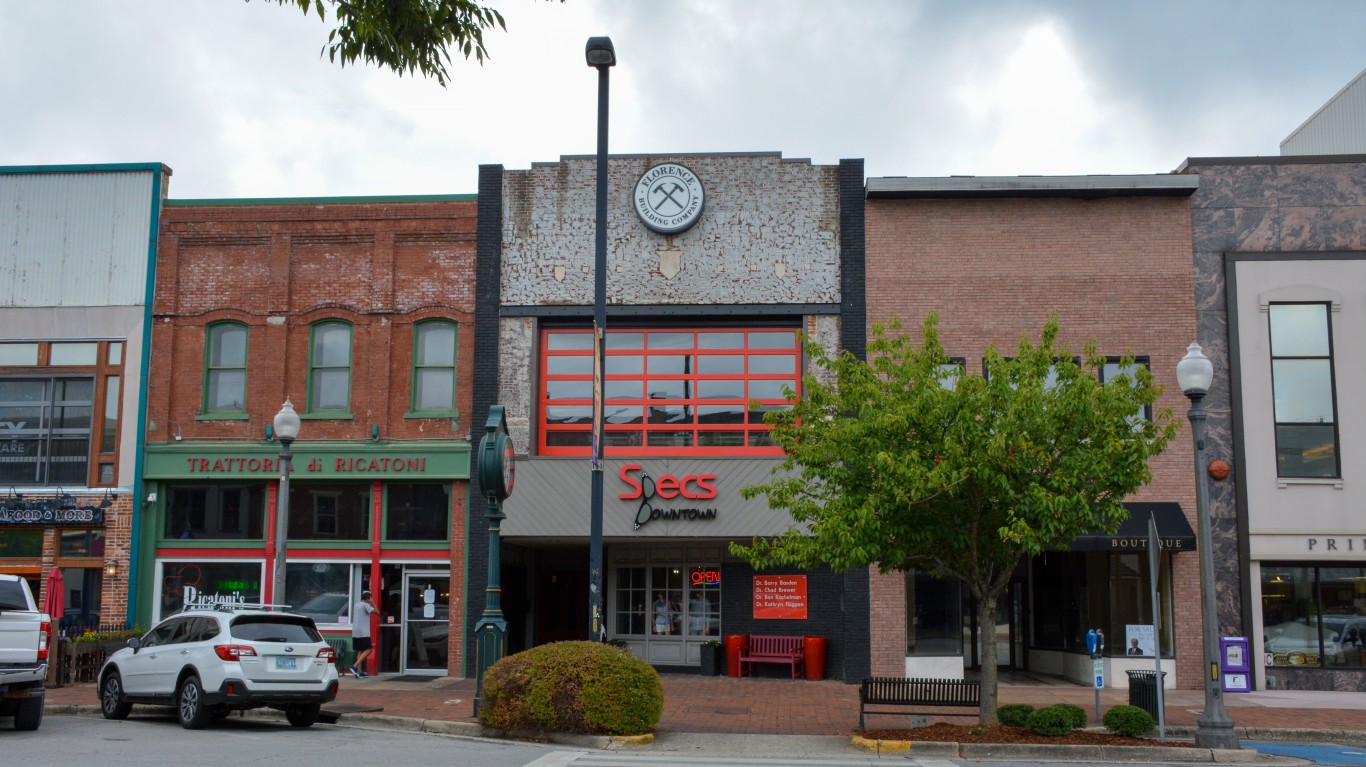
17. Florence-Muscle Shoals, AL
> Median household income: $45,824
> Median income change 2018 to 2019: -$4,559 (-9.0%)
> Median home value: $145,500 (lowest 25% of US metros)
> Adults with a bachelor’s degree: 20.2% (lowest 25% of US metros)
> 2019 unemployment: 3.4%
[in-text-ad-2]

16. Hot Springs, AR
> Median household income: $45,265
> Median income change 2018 to 2019: +$1,207 (+2.7%)
> Median home value: $139,100 (lowest 25% of US metros)
> Adults with a bachelor’s degree: 28.6%
> 2019 unemployment: 3.7%
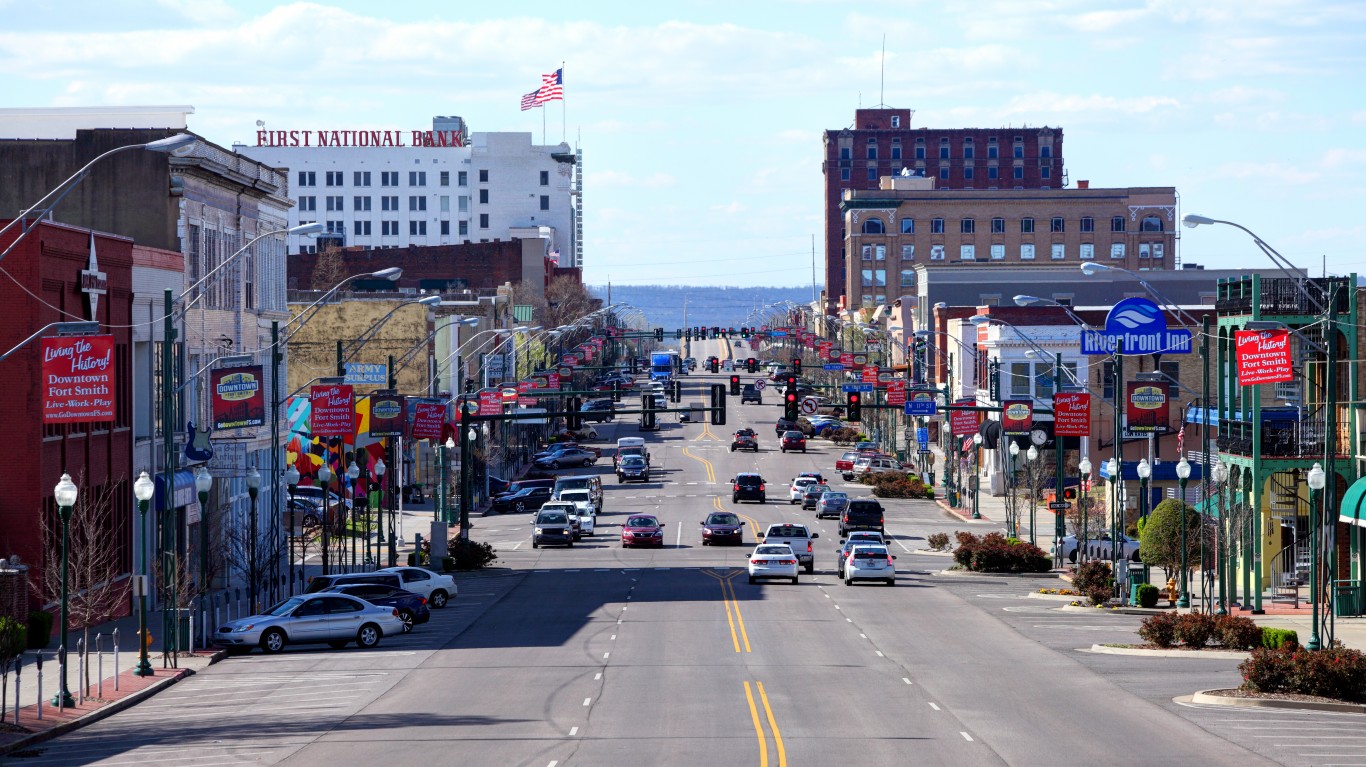
15. Fort Smith, AR-OK
> Median household income: $45,157
> Median income change 2018 to 2019: -$09 (+0.0%)
> Median home value: $126,200 (lowest 10% of US metros)
> Adults with a bachelor’s degree: 21.0% (lowest 25% of US metros)
> 2019 unemployment: 3.6%
[in-text-ad]

14. Muncie, IN
> Median household income: $45,065
> Median income change 2018 to 2019: +$2,553 (+6.0%)
> Median home value: $101,800 (lowest 10% of US metros)
> Adults with a bachelor’s degree: 22.6% (lowest 25% of US metros)
> 2019 unemployment: 3.9%

13. Jonesboro, AR
> Median household income: $44,998
> Median income change 2018 to 2019: +$395 (+0.9%)
> Median home value: $144,900 (lowest 25% of US metros)
> Adults with a bachelor’s degree: 23.5%
> 2019 unemployment: 2.9% (lowest 25% of US metros)

12. Beckley, WV
> Median household income: $44,785
> Median income change 2018 to 2019: +$5,454 (+13.9%)
> Median home value: $99,400 (lowest 10% of US metros)
> Adults with a bachelor’s degree: 17.8% (lowest 10% of US metros)
> 2019 unemployment: 5.0% (highest 25% of US metros)
[in-text-ad-2]
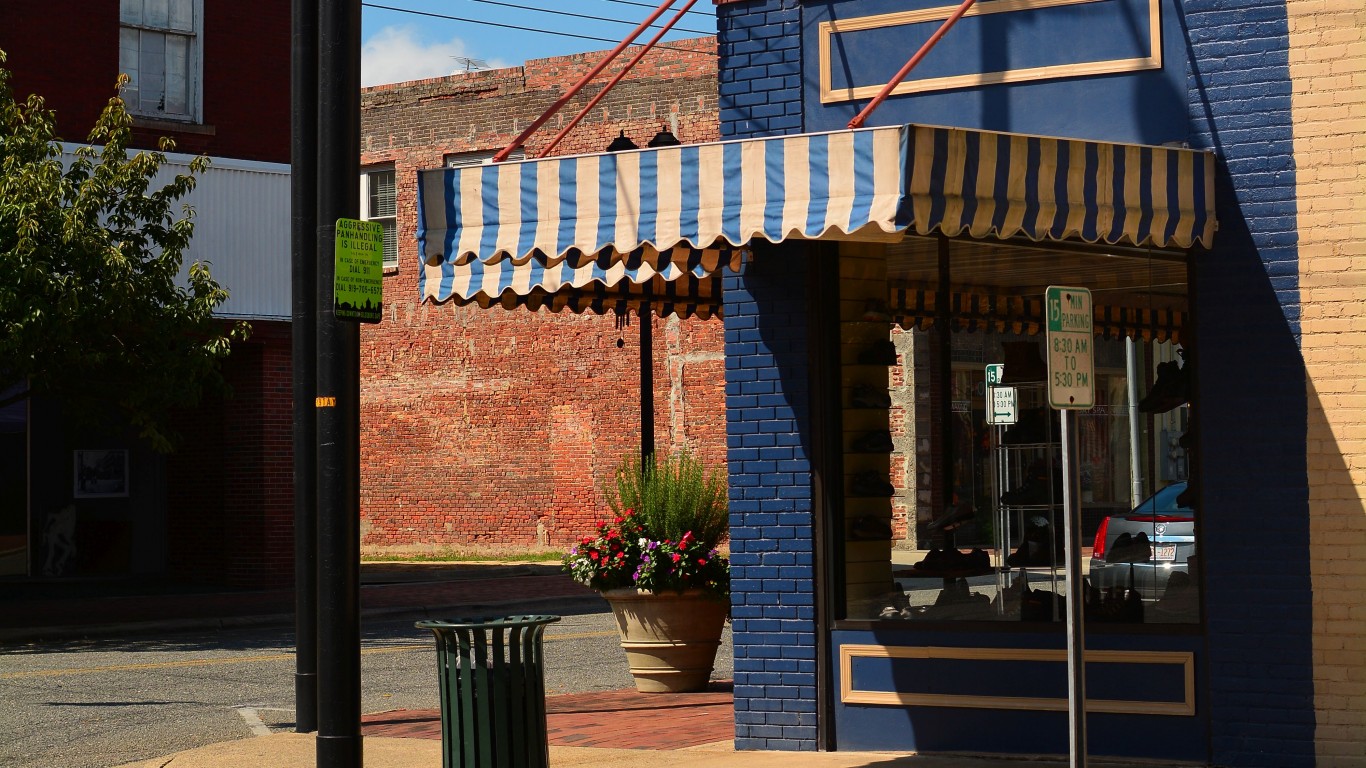
11. Goldsboro, NC
> Median household income: $44,596
> Median income change 2018 to 2019: +$3,306 (+8.0%)
> Median home value: $118,400 (lowest 10% of US metros)
> Adults with a bachelor’s degree: 18.1% (lowest 10% of US metros)
> 2019 unemployment: 4.1%

10. Farmington, NM
> Median household income: $44,321
> Median income change 2018 to 2019: -$1,220 (-2.7%)
> Median home value: $154,200
> Adults with a bachelor’s degree: 14.4% (lowest 10% of US metros)
> 2019 unemployment: 5.7% (highest 10% of US metros)
[in-text-ad]
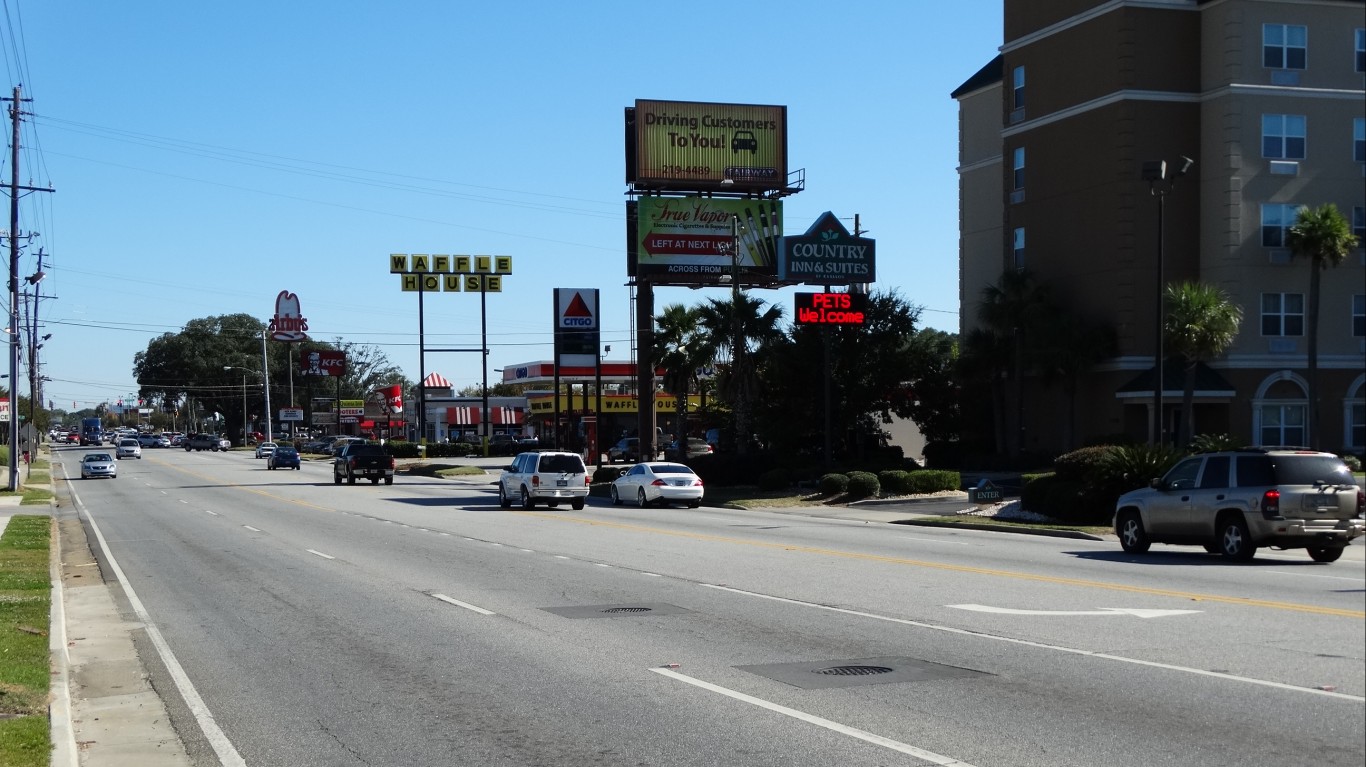
9. Valdosta, GA
> Median household income: $43,787
> Median income change 2018 to 2019: +$8,459 (+23.9%)
> Median home value: $131,200 (lowest 25% of US metros)
> Adults with a bachelor’s degree: 23.4%
> 2019 unemployment: 3.5%
8. Danville, IL
> Median household income: $43,111
> Median income change 2018 to 2019: -$1,056 (-2.4%)
> Median home value: $80,100 (lowest 10% of US metros)
> Adults with a bachelor’s degree: 12.1% (lowest 10% of US metros)
> 2019 unemployment: 5.1% (highest 25% of US metros)
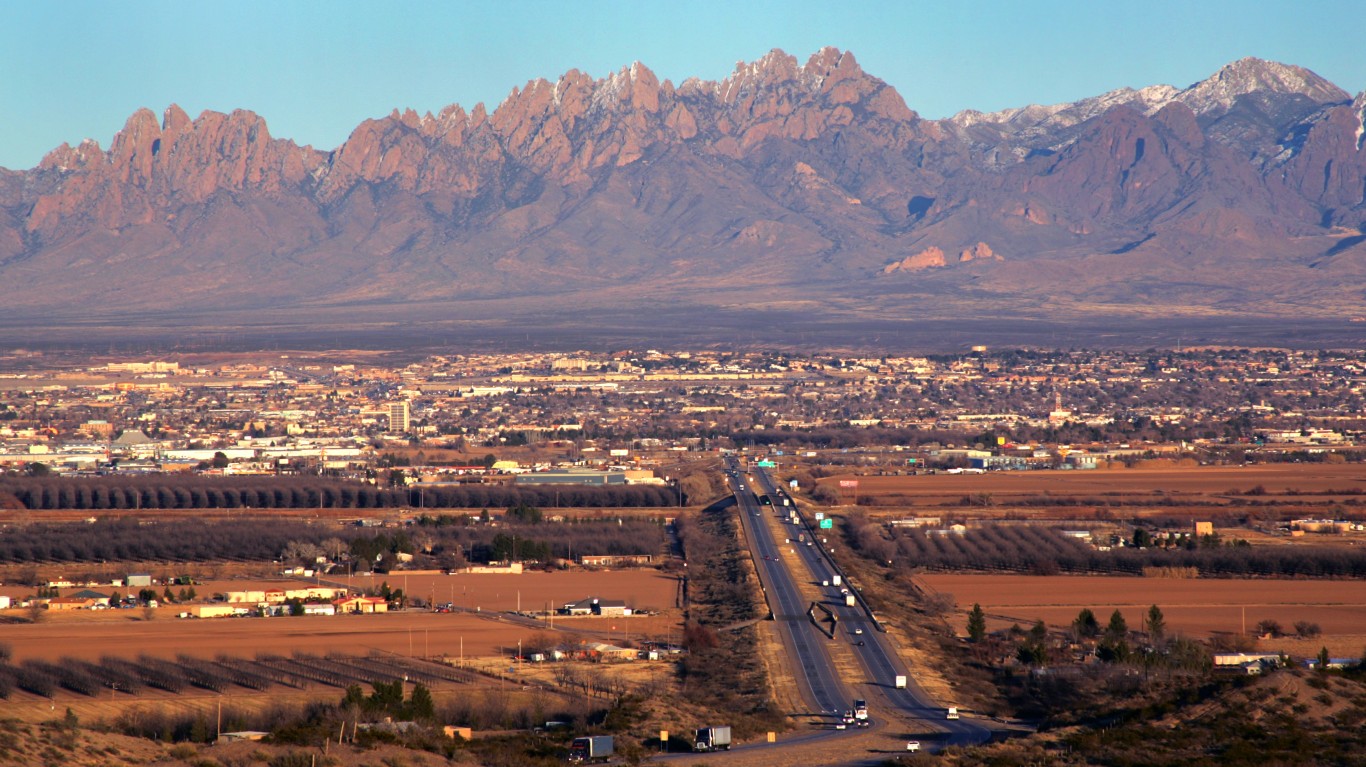
7. Las Cruces, NM
> Median household income: $43,038
> Median income change 2018 to 2019: +$7,383 (+20.7%)
> Median home value: $157,300
> Adults with a bachelor’s degree: 27.2%
> 2019 unemployment: 5.7% (highest 10% of US metros)
[in-text-ad-2]
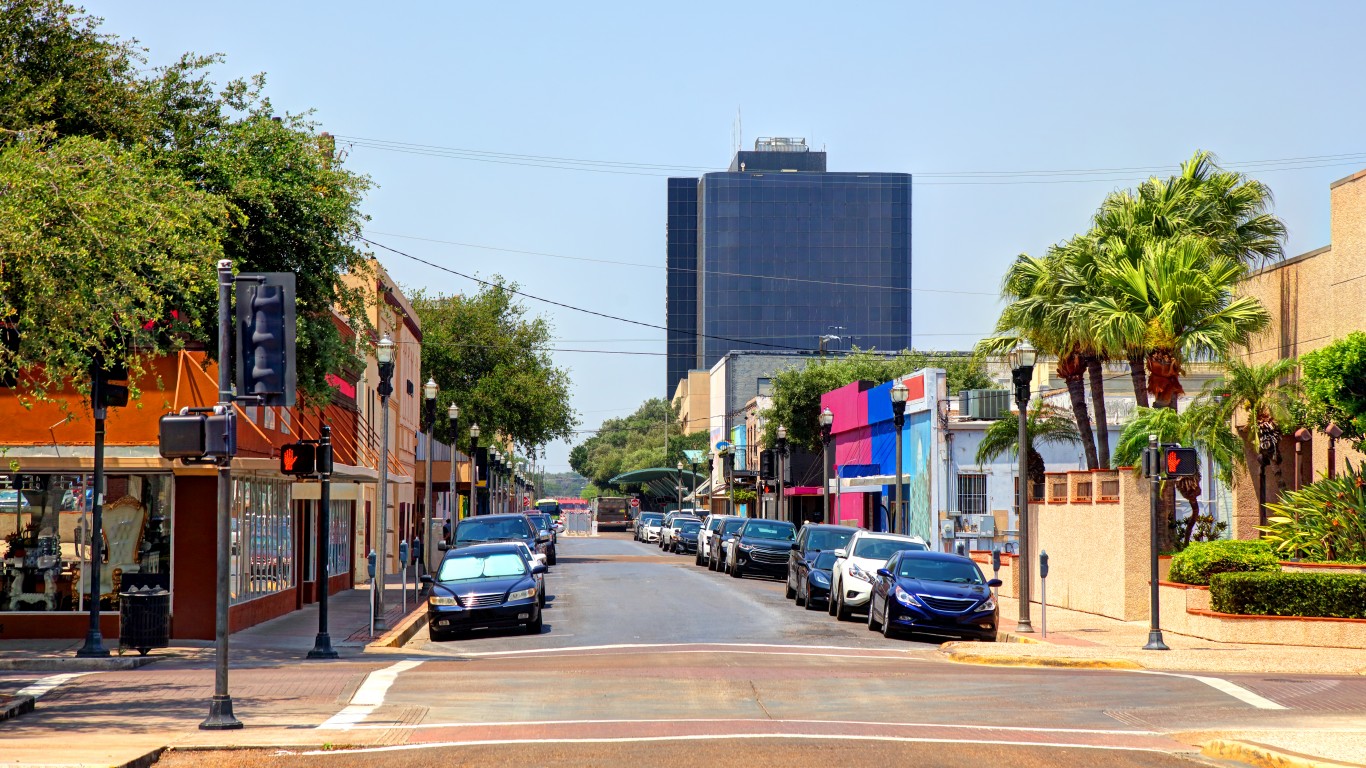
6. McAllen-Edinburg-Mission, TX
> Median household income: $41,800
> Median income change 2018 to 2019: +$2,097 (+5.3%)
> Median home value: $93,400 (lowest 10% of US metros)
> Adults with a bachelor’s degree: 19.0% (lowest 10% of US metros)
> 2019 unemployment: 6.2% (highest 10% of US metros)
5. Pine Bluff, AR
> Median household income: $41,541
> Median income change 2018 to 2019: +$3,664 (+9.7%)
> Median home value: $83,500 (lowest 10% of US metros)
> Adults with a bachelor’s degree: 16.4% (lowest 10% of US metros)
> 2019 unemployment: 5.2% (highest 25% of US metros)
[in-text-ad]
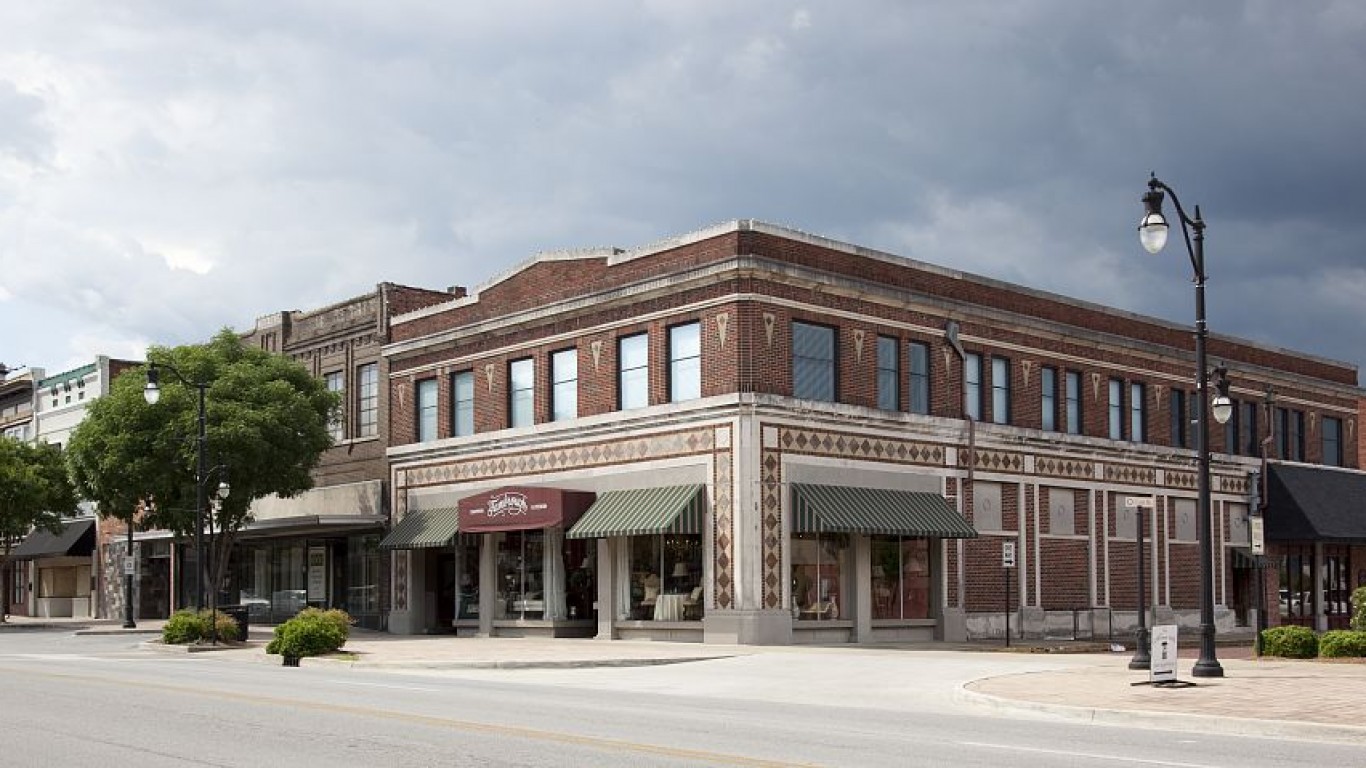
4. Gadsden, AL
> Median household income: $41,447
> Median income change 2018 to 2019: -$4,987 (-10.7%)
> Median home value: $127,500 (lowest 10% of US metros)
> Adults with a bachelor’s degree: 17.2% (lowest 10% of US metros)
> 2019 unemployment: 3.3%
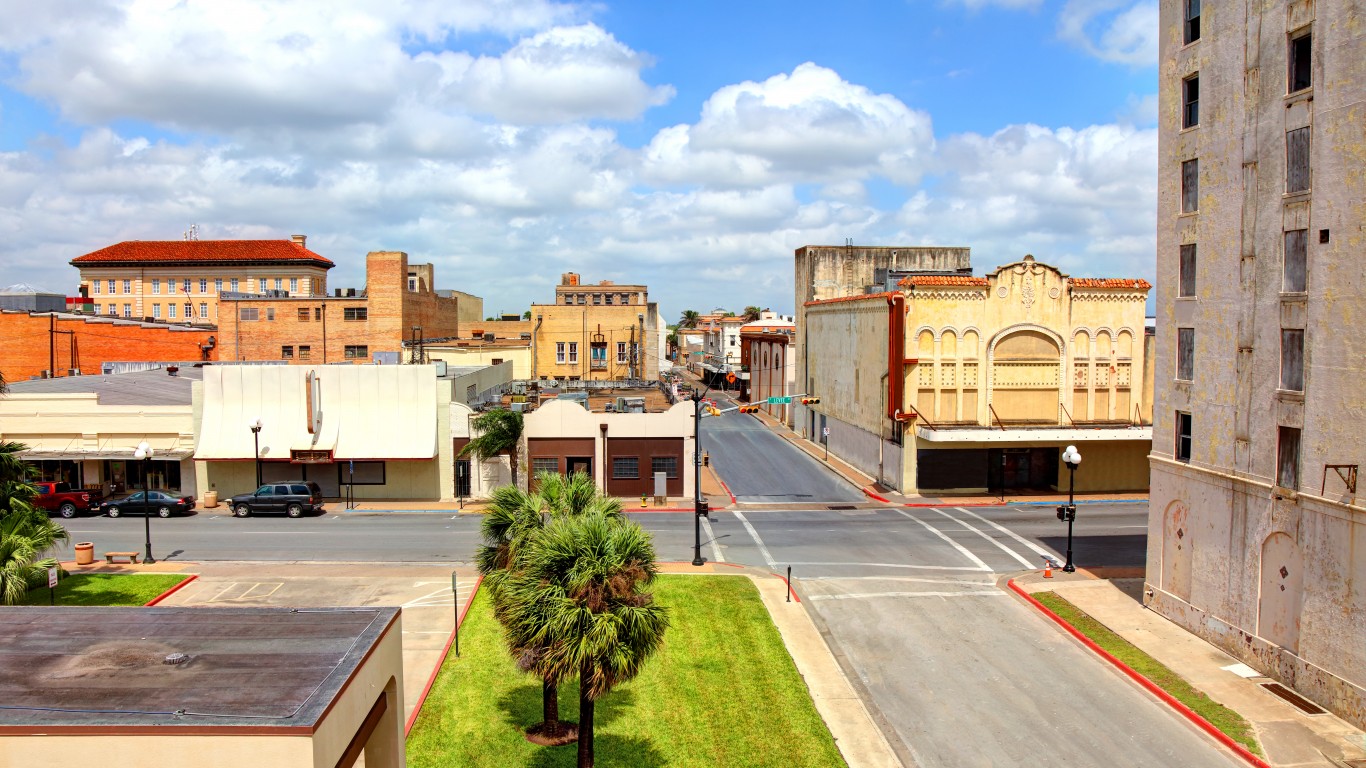
3. Brownsville-Harlingen, TX
> Median household income: $41,123
> Median income change 2018 to 2019: +$2,191 (+5.6%)
> Median home value: $89,000 (lowest 10% of US metros)
> Adults with a bachelor’s degree: 17.1% (lowest 10% of US metros)
> 2019 unemployment: 5.5% (highest 10% of US metros)
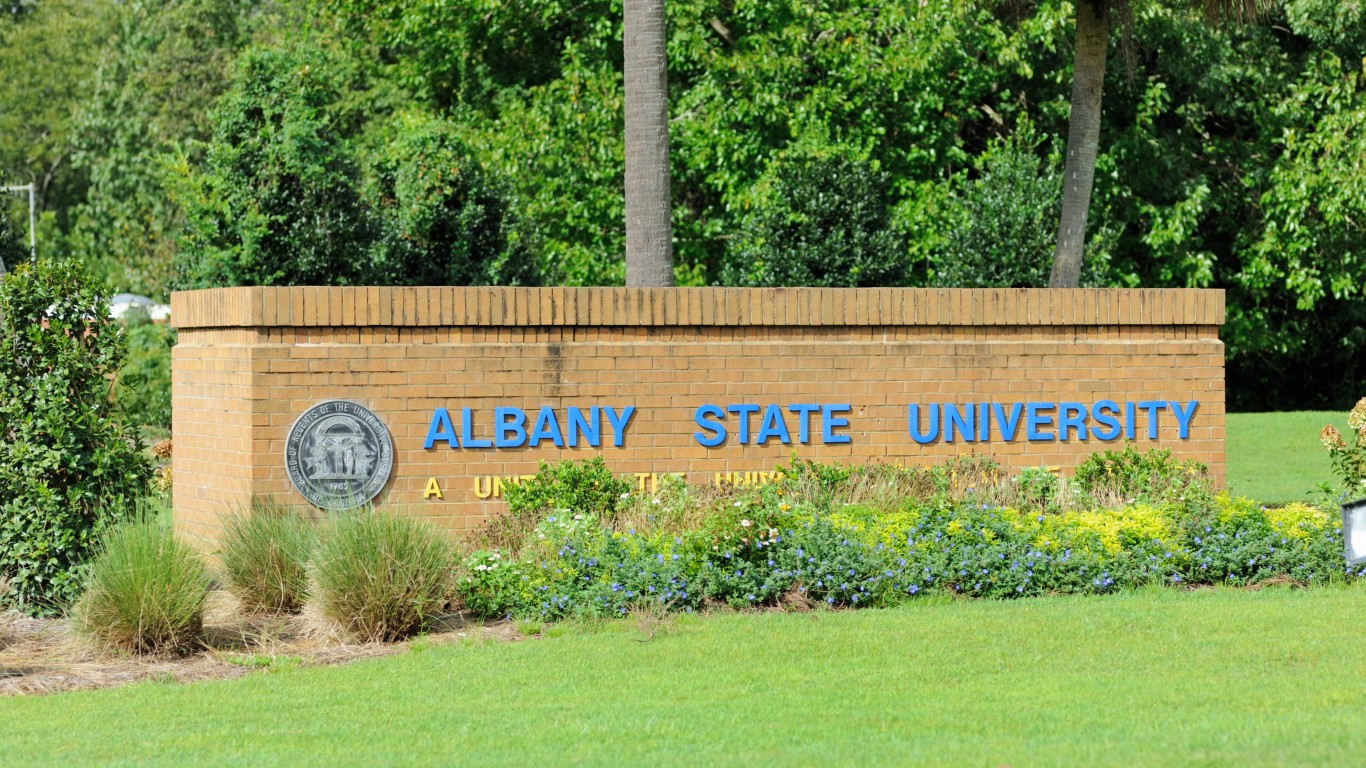
2. Albany, GA
> Median household income: $40,625
> Median income change 2018 to 2019: -$5,147 (-11.2%)
> Median home value: $125,600 (lowest 10% of US metros)
> Adults with a bachelor’s degree: 19.7% (lowest 25% of US metros)
> 2019 unemployment: 4.3%
[in-text-ad-2]

1. Monroe, LA
> Median household income: $40,136
> Median income change 2018 to 2019: -$4,773 (-10.6%)
> Median home value: $128,200 (lowest 25% of US metros)
> Adults with a bachelor’s degree: 23.2%
> 2019 unemployment: 5.4% (highest 10% of US metros)
Cash Back Credit Cards Have Never Been This Good
Credit card companies are at war, handing out free rewards and benefits to win the best customers. A good cash back card can be worth thousands of dollars a year in free money, not to mention other perks like travel, insurance, and access to fancy lounges. See our top picks for the best credit cards today. You won’t want to miss some of these offers.
Flywheel Publishing has partnered with CardRatings for our coverage of credit card products. Flywheel Publishing and CardRatings may receive a commission from card issuers.
Thank you for reading! Have some feedback for us?
Contact the 24/7 Wall St. editorial team.

 24/7 Wall St.