
As of Sept. 21, nearly 7 million Americans have been infected with the novel coronavirus. While in general, the states with the highest infection rates have the highest death rates, there are a host of other factors that may lead to higher (and lower) death rates.
Factors that may affect COVID-19 case fatality include age, race and ethnicity, underlying medical conditions, poverty, and concentration of employment in high-risk occupations, according to the Centers for Disease Control and Prevention.
The case fatality rate for COVID-19 — related deaths as a percentage of cases — ranges from 0.1% in Idaho to 8.0% in New Jersey.
In one recent study from June 2020, researchers from the MIT Sloan school of Management found that the percentage of Black residents in a county is positively correlated with a higher COVID-19 death rate, even after accounting for income, health insurance coverage, diabetes, and obesity. In 11 of the 15 states with the highest COVID-19 deaths per capita, the share of residents who are Black is greater than the 12.4% national share. Here is how COVID-19 has disproportionately affected minority communities in every state.
As more Americans return to work and students return to school, the U.S. case — and unfortunately death — count will rise. According to the most recent projections from University of Washington’s Institute for Health Metrics and Evaluation, daily deaths will peak some time in December, with various states peaking before and after. Here are the COVID-19 peak dates for every state.
Click here to see the states where the most people have died from COVID-19
Click here to read our methodology
50. Idaho
> COVID-19 deaths as of Sep 19: 2 per 100,000 (38 total)
> Deaths from all causes, Mar 1 to Sep 19: 470 per 100,000 (8,238 total)
> COVID-19 deaths as pct. of all deaths, Mar 1 to Sep 19: 0.5% — the lowest
> COVID-19 cases as of Sep 19: 2,123 per 100,000 (37,247 total)
> COVID-19 deaths as pct. of all cases: 0.1% — the lowest
> Population: 1.8 million
[in-text-ad]
49. Alaska
> COVID-19 deaths as of Sep 19: 6 per 100,000 (45 total)
> Deaths from all causes, Mar 1 to Sep 19: 303 per 100,000 (2,231 total)
> COVID-19 deaths as pct. of all deaths, Mar 1 to Sep 19: 2.0% — 6th lowest
> COVID-19 cases as of Sep 19: 1,041 per 100,000 (7,674 total)
> COVID-19 deaths as pct. of all cases: 0.6% — 2nd lowest
> Population: 731,545
48. Hawaii
> COVID-19 deaths as of Sep 19: 8 per 100,000 (120 total)
> Deaths from all causes, Mar 1 to Sep 19: 433 per 100,000 (6,150 total)
> COVID-19 deaths as pct. of all deaths, Mar 1 to Sep 19: 2.0% — 5th lowest
> COVID-19 cases as of Sep 19: 790 per 100,000 (11,217 total)
> COVID-19 deaths as pct. of all cases: 1.1% — 5th lowest
> Population: 1.4 million

47. Wyoming
> COVID-19 deaths as of Sep 19: 8 per 100,000 (49 total)
> Deaths from all causes, Mar 1 to Sep 19: 448 per 100,000 (2,588 total)
> COVID-19 deaths as pct. of all deaths, Mar 1 to Sep 19: 1.9% — 4th lowest
> COVID-19 cases as of Sep 19: 827 per 100,000 (4,780 total)
> COVID-19 deaths as pct. of all cases: 1.0% — 4th lowest
> Population: 578,759
[in-text-ad-2]
46. Vermont
> COVID-19 deaths as of Sep 19: 9 per 100,000 (58 total)
> Deaths from all causes, Mar 1 to Sep 19: 515 per 100,000 (3,226 total)
> COVID-19 deaths as pct. of all deaths, Mar 1 to Sep 19: 1.8% — 3rd lowest
> COVID-19 cases as of Sep 19: 273 per 100,000 (1,710 total)
> COVID-19 deaths as pct. of all cases: 3.4% — 9th highest
> Population: 623,989

45. Maine
> COVID-19 deaths as of Sep 19: 10 per 100,000 (139 total)
> Deaths from all causes, Mar 1 to Sep 19: 604 per 100,000 (8,085 total)
> COVID-19 deaths as pct. of all deaths, Mar 1 to Sep 19: 1.7% — 2nd lowest
> COVID-19 cases as of Sep 19: 376 per 100,000 (5,035 total)
> COVID-19 deaths as pct. of all cases: 2.7% — 19th highest
> Population: 1.3 million
[in-text-ad]
44. Oregon
> COVID-19 deaths as of Sep 19: 13 per 100,000 (525 total)
> Deaths from all causes, Mar 1 to Sep 19: 470 per 100,000 (19,697 total)
> COVID-19 deaths as pct. of all deaths, Mar 1 to Sep 19: 2.7% — 7th lowest
> COVID-19 cases as of Sep 19: 730 per 100,000 (30,599 total)
> COVID-19 deaths as pct. of all cases: 1.7% — 19th lowest
> Population: 4.2 million
43. Utah
> COVID-19 deaths as of Sep 19: 14 per 100,000 (440 total)
> Deaths from all causes, Mar 1 to Sep 19: 356 per 100,000 (11,238 total)
> COVID-19 deaths as pct. of all deaths, Mar 1 to Sep 19: 3.9% — 10th lowest
> COVID-19 cases as of Sep 19: 1,988 per 100,000 (62,852 total)
> COVID-19 deaths as pct. of all cases: 0.7% — 3rd lowest
> Population: 3.2 million
42. Montana
> COVID-19 deaths as of Sep 19: 15 per 100,000 (156 total)
> Deaths from all causes, Mar 1 to Sep 19: 518 per 100,000 (5,498 total)
> COVID-19 deaths as pct. of all deaths, Mar 1 to Sep 19: 2.9% — 8th lowest
> COVID-19 cases as of Sep 19: 957 per 100,000 (10,163 total)
> COVID-19 deaths as pct. of all cases: 1.5% — 13th lowest
> Population: 1.1 million
[in-text-ad-2]
41. West Virginia
> COVID-19 deaths as of Sep 19: 17 per 100,000 (308 total)
> Deaths from all causes, Mar 1 to Sep 19: 591 per 100,000 (10,664 total)
> COVID-19 deaths as pct. of all deaths, Mar 1 to Sep 19: 2.9% — 9th lowest
> COVID-19 cases as of Sep 19: 768 per 100,000 (13,874 total)
> COVID-19 deaths as pct. of all cases: 2.2% — 23rd highest
> Population: 1.8 million
40. Kansas
> COVID-19 deaths as of Sep 19: 20 per 100,000 (596 total)
> Deaths from all causes, Mar 1 to Sep 19: 498 per 100,000 (14,503 total)
> COVID-19 deaths as pct. of all deaths, Mar 1 to Sep 19: 4.1% — 12th lowest
> COVID-19 cases as of Sep 19: 1,796 per 100,000 (52,285 total)
> COVID-19 deaths as pct. of all cases: 1.1% — 9th lowest
> Population: 2.9 million
[in-text-ad]
39. Wisconsin
> COVID-19 deaths as of Sep 19: 21 per 100,000 (1,220 total)
> Deaths from all causes, Mar 1 to Sep 19: 514 per 100,000 (29,890 total)
> COVID-19 deaths as pct. of all deaths, Mar 1 to Sep 19: 4.1% — 11th lowest
> COVID-19 cases as of Sep 19: 1,571 per 100,000 (91,304 total)
> COVID-19 deaths as pct. of all cases: 1.3% — 12th lowest
> Population: 5.8 million

38. South Dakota
> COVID-19 deaths as of Sep 19: 23 per 100,000 (200 total)
> Deaths from all causes, Mar 1 to Sep 19: 488 per 100,000 (4,303 total)
> COVID-19 deaths as pct. of all deaths, Mar 1 to Sep 19: 4.7% — 15th lowest
> COVID-19 cases as of Sep 19: 2,091 per 100,000 (18,444 total)
> COVID-19 deaths as pct. of all cases: 1.1% — 7th lowest
> Population: 884,659
37. Nebraska
> COVID-19 deaths as of Sep 19: 23 per 100,000 (442 total)
> Deaths from all causes, Mar 1 to Sep 19: 481 per 100,000 (9,282 total)
> COVID-19 deaths as pct. of all deaths, Mar 1 to Sep 19: 4.8% — 16th lowest
> COVID-19 cases as of Sep 19: 2,115 per 100,000 (40,797 total)
> COVID-19 deaths as pct. of all cases: 1.1% — 8th lowest
> Population: 1.9 million
[in-text-ad-2]
36. Oklahoma
> COVID-19 deaths as of Sep 19: 24 per 100,000 (943 total)
> Deaths from all causes, Mar 1 to Sep 19: 542 per 100,000 (21,360 total)
> COVID-19 deaths as pct. of all deaths, Mar 1 to Sep 19: 4.4% — 14th lowest
> COVID-19 cases as of Sep 19: 1,922 per 100,000 (75,804 total)
> COVID-19 deaths as pct. of all cases: 1.2% — 11th lowest
> Population: 4.0 million
35. Kentucky
> COVID-19 deaths as of Sep 19: 25 per 100,000 (1,108 total)
> Deaths from all causes, Mar 1 to Sep 19: 573 per 100,000 (25,593 total)
> COVID-19 deaths as pct. of all deaths, Mar 1 to Sep 19: 4.3% — 13th lowest
> COVID-19 cases as of Sep 19: 1,368 per 100,000 (61,106 total)
> COVID-19 deaths as pct. of all cases: 1.8% — 20th lowest
> Population: 4.5 million
[in-text-ad]
34. North Dakota
> COVID-19 deaths as of Sep 19: 25 per 100,000 (192 total)
> Deaths from all causes, Mar 1 to Sep 19: 488 per 100,000 (3,712 total)
> COVID-19 deaths as pct. of all deaths, Mar 1 to Sep 19: 5.2% — 19th lowest
> COVID-19 cases as of Sep 19: 2,316 per 100,000 (17,607 total)
> COVID-19 deaths as pct. of all cases: 1.1% — 6th lowest
> Population: 762,062

33. Washington
> COVID-19 deaths as of Sep 19: 27 per 100,000 (2,037 total)
> Deaths from all causes, Mar 1 to Sep 19: 429 per 100,000 (32,304 total)
> COVID-19 deaths as pct. of all deaths, Mar 1 to Sep 19: 6.3% — 21st lowest
> COVID-19 cases as of Sep 19: 1,091 per 100,000 (82,199 total)
> COVID-19 deaths as pct. of all cases: 2.5% — 21st highest
> Population: 7.6 million
32. Missouri
> COVID-19 deaths as of Sep 19: 29 per 100,000 (1,793 total)
> Deaths from all causes, Mar 1 to Sep 19: 569 per 100,000 (34,839 total)
> COVID-19 deaths as pct. of all deaths, Mar 1 to Sep 19: 5.2% — 18th lowest
> COVID-19 cases as of Sep 19: 1,820 per 100,000 (111,473 total)
> COVID-19 deaths as pct. of all cases: 1.6% — 16th lowest
> Population: 6.1 million
[in-text-ad-2]
31. North Carolina
> COVID-19 deaths as of Sep 19: 31 per 100,000 (3,235 total)
> Deaths from all causes, Mar 1 to Sep 19: 412 per 100,000 (42,785 total)
> COVID-19 deaths as pct. of all deaths, Mar 1 to Sep 19: 7.6% — 25th highest
> COVID-19 cases as of Sep 19: 1,851 per 100,000 (192,248 total)
> COVID-19 deaths as pct. of all cases: 1.7% — 17th lowest
> Population: 10.5 million
30. New Hampshire
> COVID-19 deaths as of Sep 19: 32 per 100,000 (438 total)
> Deaths from all causes, Mar 1 to Sep 19: 527 per 100,000 (7,145 total)
> COVID-19 deaths as pct. of all deaths, Mar 1 to Sep 19: 6.1% — 20th lowest
> COVID-19 cases as of Sep 19: 584 per 100,000 (7,920 total)
> COVID-19 deaths as pct. of all cases: 5.5% — 5th highest
> Population: 1.4 million
[in-text-ad]
29. Tennessee
> COVID-19 deaths as of Sep 19: 32 per 100,000 (2,196 total)
> Deaths from all causes, Mar 1 to Sep 19: 633 per 100,000 (42,877 total)
> COVID-19 deaths as pct. of all deaths, Mar 1 to Sep 19: 5.2% — 17th lowest
> COVID-19 cases as of Sep 19: 2,666 per 100,000 (180,497 total)
> COVID-19 deaths as pct. of all cases: 1.2% — 10th lowest
> Population: 6.8 million

28. Minnesota
> COVID-19 deaths as of Sep 19: 35 per 100,000 (1,963 total)
> Deaths from all causes, Mar 1 to Sep 19: 454 per 100,000 (25,459 total)
> COVID-19 deaths as pct. of all deaths, Mar 1 to Sep 19: 7.7% — 24th highest
> COVID-19 cases as of Sep 19: 1,581 per 100,000 (88,721 total)
> COVID-19 deaths as pct. of all cases: 2.2% — 24th highest
> Population: 5.6 million

27. Virginia
> COVID-19 deaths as of Sep 19: 35 per 100,000 (2,990 total)
> Deaths from all causes, Mar 1 to Sep 19: 477 per 100,000 (40,628 total)
> COVID-19 deaths as pct. of all deaths, Mar 1 to Sep 19: 7.4% — 24th lowest
> COVID-19 cases as of Sep 19: 1,640 per 100,000 (139,655 total)
> COVID-19 deaths as pct. of all cases: 2.1% — 25th lowest
> Population: 8.5 million
[in-text-ad-2]

26. Colorado
> COVID-19 deaths as of Sep 19: 35 per 100,000 (2,013 total)
> Deaths from all causes, Mar 1 to Sep 19: 421 per 100,000 (23,958 total)
> COVID-19 deaths as pct. of all deaths, Mar 1 to Sep 19: 8.4% — 21st highest
> COVID-19 cases as of Sep 19: 1,130 per 100,000 (64,356 total)
> COVID-19 deaths as pct. of all cases: 3.1% — 14th highest
> Population: 5.8 million

25. California
> COVID-19 deaths as of Sep 19: 38 per 100,000 (14,912 total)
> Deaths from all causes, Mar 1 to Sep 19: 403 per 100,000 (159,274 total)
> COVID-19 deaths as pct. of all deaths, Mar 1 to Sep 19: 9.4% — 19th highest
> COVID-19 cases as of Sep 19: 1,957 per 100,000 (774,135 total)
> COVID-19 deaths as pct. of all cases: 1.9% — 21st lowest
> Population: 39.5 million
[in-text-ad]

24. Arkansas
> COVID-19 deaths as of Sep 19: 39 per 100,000 (1,181 total)
> Deaths from all causes, Mar 1 to Sep 19: 607 per 100,000 (18,295 total)
> COVID-19 deaths as pct. of all deaths, Mar 1 to Sep 19: 6.5% — 22nd lowest
> COVID-19 cases as of Sep 19: 2,494 per 100,000 (75,160 total)
> COVID-19 deaths as pct. of all cases: 1.6% — 14th lowest
> Population: 3.0 million
23. Ohio
> COVID-19 deaths as of Sep 19: 39 per 100,000 (4,612 total)
> Deaths from all causes, Mar 1 to Sep 19: 576 per 100,000 (67,323 total)
> COVID-19 deaths as pct. of all deaths, Mar 1 to Sep 19: 6.9% — 23rd lowest
> COVID-19 cases as of Sep 19: 1,228 per 100,000 (143,547 total)
> COVID-19 deaths as pct. of all cases: 3.2% — 13th highest
> Population: 11.7 million
22. Iowa
> COVID-19 deaths as of Sep 19: 40 per 100,000 (1,264 total)
> Deaths from all causes, Mar 1 to Sep 19: 533 per 100,000 (16,827 total)
> COVID-19 deaths as pct. of all deaths, Mar 1 to Sep 19: 7.5% — 25th lowest
> COVID-19 cases as of Sep 19: 2,507 per 100,000 (79,128 total)
> COVID-19 deaths as pct. of all cases: 1.6% — 15th lowest
> Population: 3.2 million
[in-text-ad-2]

21. New Mexico
> COVID-19 deaths as of Sep 19: 40 per 100,000 (847 total)
> Deaths from all causes, Mar 1 to Sep 19: 509 per 100,000 (10,656 total)
> COVID-19 deaths as pct. of all deaths, Mar 1 to Sep 19: 8.0% — 22nd highest
> COVID-19 cases as of Sep 19: 1,313 per 100,000 (27,512 total)
> COVID-19 deaths as pct. of all cases: 3.1% — 15th highest
> Population: 2.1 million

20. Indiana
> COVID-19 deaths as of Sep 19: 49 per 100,000 (3,278 total)
> Deaths from all causes, Mar 1 to Sep 19: 569 per 100,000 (38,088 total)
> COVID-19 deaths as pct. of all deaths, Mar 1 to Sep 19: 8.6% — 20th highest
> COVID-19 cases as of Sep 19: 1,655 per 100,000 (110,759 total)
> COVID-19 deaths as pct. of all cases: 2.9% — 18th highest
> Population: 6.7 million
[in-text-ad]
19. Alabama
> COVID-19 deaths as of Sep 19: 50 per 100,000 (2,437 total)
> Deaths from all causes, Mar 1 to Sep 19: 638 per 100,000 (31,170 total)
> COVID-19 deaths as pct. of all deaths, Mar 1 to Sep 19: 7.8% — 23rd highest
> COVID-19 cases as of Sep 19: 2,949 per 100,000 (144,164 total)
> COVID-19 deaths as pct. of all cases: 1.7% — 18th lowest
> Population: 4.9 million
18. Nevada
> COVID-19 deaths as of Sep 19: 50 per 100,000 (1,528 total)
> Deaths from all causes, Mar 1 to Sep 19: 510 per 100,000 (15,489 total)
> COVID-19 deaths as pct. of all deaths, Mar 1 to Sep 19: 9.9% — 18th highest
> COVID-19 cases as of Sep 19: 2,485 per 100,000 (75,419 total)
> COVID-19 deaths as pct. of all cases: 2.0% — 23rd lowest
> Population: 3.1 million

17. Texas
> COVID-19 deaths as of Sep 19: 52 per 100,000 (14,848 total)
> Deaths from all causes, Mar 1 to Sep 19: 439 per 100,000 (125,866 total)
> COVID-19 deaths as pct. of all deaths, Mar 1 to Sep 19: 11.9% — 12th highest
> COVID-19 cases as of Sep 19: 2,390 per 100,000 (686,068 total)
> COVID-19 deaths as pct. of all cases: 2.1% — 24th lowest
> Population: 29.0 million
[in-text-ad-2]
16. Pennsylvania
> COVID-19 deaths as of Sep 19: 62 per 100,000 (7,956 total)
> Deaths from all causes, Mar 1 to Sep 19: 608 per 100,000 (77,890 total)
> COVID-19 deaths as pct. of all deaths, Mar 1 to Sep 19: 10.3% — 17th highest
> COVID-19 cases as of Sep 19: 1,170 per 100,000 (149,845 total)
> COVID-19 deaths as pct. of all cases: 5.3% — 7th highest
> Population: 12.8 million

15. South Carolina
> COVID-19 deaths as of Sep 19: 63 per 100,000 (3,188 total)
> Deaths from all causes, Mar 1 to Sep 19: 590 per 100,000 (30,005 total)
> COVID-19 deaths as pct. of all deaths, Mar 1 to Sep 19: 10.7% — 15th highest
> COVID-19 cases as of Sep 19: 2,699 per 100,000 (137,240 total)
> COVID-19 deaths as pct. of all cases: 2.3% — 22nd highest
> Population: 5.1 million
[in-text-ad]
14. Georgia
> COVID-19 deaths as of Sep 19: 63 per 100,000 (6,599 total)
> Deaths from all causes, Mar 1 to Sep 19: 484 per 100,000 (50,946 total)
> COVID-19 deaths as pct. of all deaths, Mar 1 to Sep 19: 13.0% — 9th highest
> COVID-19 cases as of Sep 19: 2,900 per 100,000 (305,021 total)
> COVID-19 deaths as pct. of all cases: 2.1% — 25th highest
> Population: 10.6 million

13. Florida
> COVID-19 deaths as of Sep 19: 63 per 100,000 (13,450 total)
> Deaths from all causes, Mar 1 to Sep 19: 611 per 100,000 (130,113 total)
> COVID-19 deaths as pct. of all deaths, Mar 1 to Sep 19: 10.4% — 16th highest
> COVID-19 cases as of Sep 19: 3,198 per 100,000 (681,233 total)
> COVID-19 deaths as pct. of all cases: 2.0% — 22nd lowest
> Population: 21.5 million

12. Maryland
> COVID-19 deaths as of Sep 19: 64 per 100,000 (3,876 total)
> Deaths from all causes, Mar 1 to Sep 19: 529 per 100,000 (31,959 total)
> COVID-19 deaths as pct. of all deaths, Mar 1 to Sep 19: 12.1% — 11th highest
> COVID-19 cases as of Sep 19: 1,982 per 100,000 (119,744 total)
> COVID-19 deaths as pct. of all cases: 3.2% — 11th highest
> Population: 6.0 million
[in-text-ad-2]

11. Delaware
> COVID-19 deaths as of Sep 19: 64 per 100,000 (621 total)
> Deaths from all causes, Mar 1 to Sep 19: 559 per 100,000 (5,404 total)
> COVID-19 deaths as pct. of all deaths, Mar 1 to Sep 19: 11.6% — 14th highest
> COVID-19 cases as of Sep 19: 2,011 per 100,000 (19,449 total)
> COVID-19 deaths as pct. of all cases: 3.2% — 12th highest
> Population: 973,764

10. Illinois
> COVID-19 deaths as of Sep 19: 66 per 100,000 (8,436 total)
> Deaths from all causes, Mar 1 to Sep 19: 521 per 100,000 (66,406 total)
> COVID-19 deaths as pct. of all deaths, Mar 1 to Sep 19: 12.7% — 10th highest
> COVID-19 cases as of Sep 19: 2,142 per 100,000 (272,856 total)
> COVID-19 deaths as pct. of all cases: 3.1% — 16th highest
> Population: 12.7 million
[in-text-ad]

9. Michigan
> COVID-19 deaths as of Sep 19: 70 per 100,000 (6,969 total)
> Deaths from all causes, Mar 1 to Sep 19: 597 per 100,000 (59,642 total)
> COVID-19 deaths as pct. of all deaths, Mar 1 to Sep 19: 11.7% — 13th highest
> COVID-19 cases as of Sep 19: 1,281 per 100,000 (128,087 total)
> COVID-19 deaths as pct. of all cases: 5.4% — 6th highest
> Population: 10.0 million
8. Arizona
> COVID-19 deaths as of Sep 19: 76 per 100,000 (5,467 total)
> Deaths from all causes, Mar 1 to Sep 19: 571 per 100,000 (40,964 total)
> COVID-19 deaths as pct. of all deaths, Mar 1 to Sep 19: 13.4% — 8th highest
> COVID-19 cases as of Sep 19: 2,978 per 100,000 (213,551 total)
> COVID-19 deaths as pct. of all cases: 2.6% — 20th highest
> Population: 7.3 million
7. Mississippi
> COVID-19 deaths as of Sep 19: 94 per 100,000 (2,809 total)
> Deaths from all causes, Mar 1 to Sep 19: 678 per 100,000 (20,251 total)
> COVID-19 deaths as pct. of all deaths, Mar 1 to Sep 19: 13.9% — 7th highest
> COVID-19 cases as of Sep 19: 3,117 per 100,000 (93,087 total)
> COVID-19 deaths as pct. of all cases: 3.0% — 17th highest
> Population: 3.0 million
[in-text-ad-2]
6. Rhode Island
> COVID-19 deaths as of Sep 19: 103 per 100,000 (1,088 total)
> Deaths from all causes, Mar 1 to Sep 19: 574 per 100,000 (6,067 total)
> COVID-19 deaths as pct. of all deaths, Mar 1 to Sep 19: 18.1% — 5th highest
> COVID-19 cases as of Sep 19: 2,234 per 100,000 (23,620 total)
> COVID-19 deaths as pct. of all cases: 4.6% — 8th highest
> Population: 1.1 million
5. Louisiana
> COVID-19 deaths as of Sep 19: 111 per 100,000 (5,172 total)
> Deaths from all causes, Mar 1 to Sep 19: 620 per 100,000 (28,876 total)
> COVID-19 deaths as pct. of all deaths, Mar 1 to Sep 19: 18.0% — 6th highest
> COVID-19 cases as of Sep 19: 3,440 per 100,000 (160,283 total)
> COVID-19 deaths as pct. of all cases: 3.2% — 10th highest
> Population: 4.6 million
[in-text-ad]

4. Connecticut
> COVID-19 deaths as of Sep 19: 126 per 100,000 (4,492 total)
> Deaths from all causes, Mar 1 to Sep 19: 498 per 100,000 (17,788 total)
> COVID-19 deaths as pct. of all deaths, Mar 1 to Sep 19: 25.3% — 3rd highest
> COVID-19 cases as of Sep 19: 1,554 per 100,000 (55,527 total)
> COVID-19 deaths as pct. of all cases: 8.0% — 2nd highest
> Population: 3.6 million
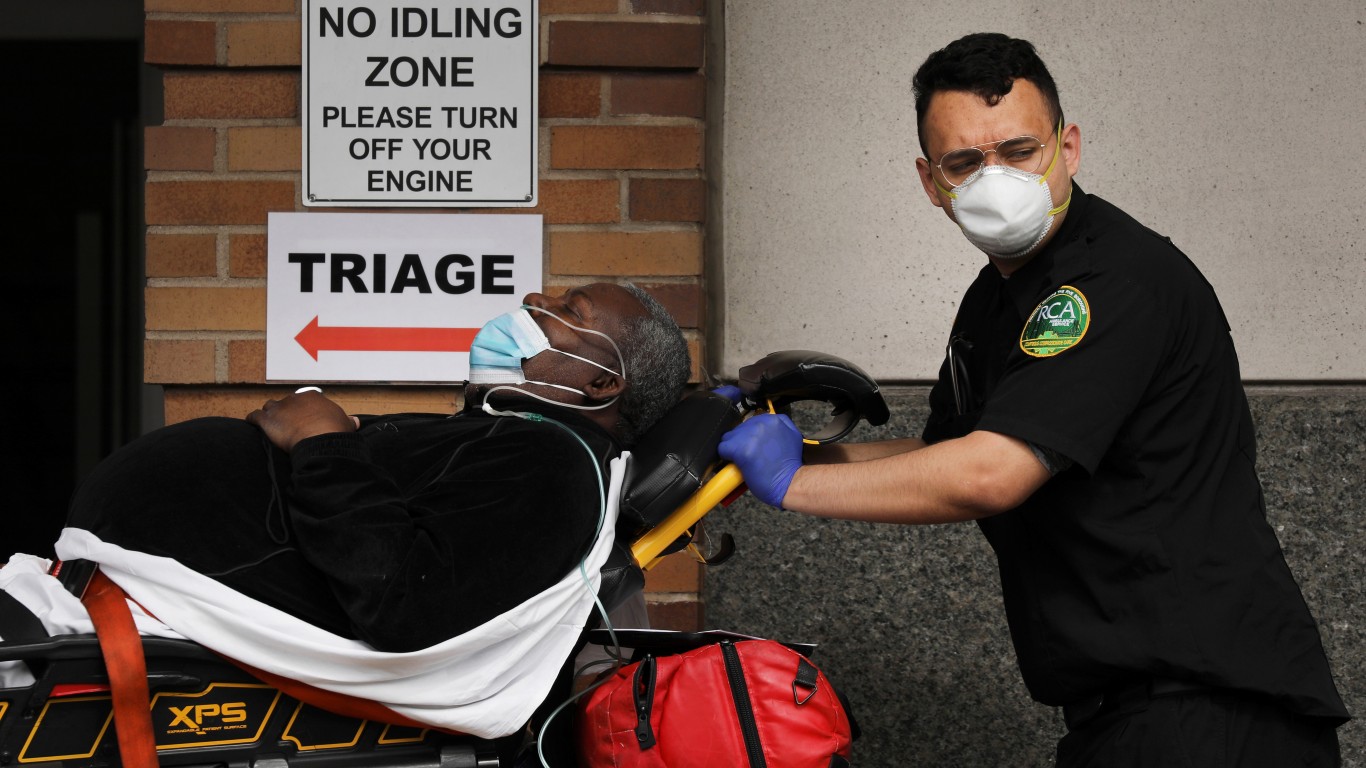
3. New York
> COVID-19 deaths as of Sep 19: 130 per 100,000 (25,425 total)
> Deaths from all causes, Mar 1 to Sep 19: 340 per 100,000 (66,359 total)
> COVID-19 deaths as pct. of all deaths, Mar 1 to Sep 19: 38.3% — the highest
> COVID-19 cases as of Sep 19: 2,298 per 100,000 (449,038 total)
> COVID-19 deaths as pct. of all cases: 5.6% — 4th highest
> Population: 19.5 million

2. Massachusetts
> COVID-19 deaths as of Sep 19: 132 per 100,000 (9,085 total)
> Deaths from all causes, Mar 1 to Sep 19: 556 per 100,000 (38,399 total)
> COVID-19 deaths as pct. of all deaths, Mar 1 to Sep 19: 23.7% — 4th highest
> COVID-19 cases as of Sep 19: 1,813 per 100,000 (125,139 total)
> COVID-19 deaths as pct. of all cases: 7.2% — 3rd highest
> Population: 6.9 million
[in-text-ad-2]

1. New Jersey
> COVID-19 deaths as of Sep 19: 180 per 100,000 (16,064 total)
> Deaths from all causes, Mar 1 to Sep 19: 629 per 100,000 (56,014 total)
> COVID-19 deaths as pct. of all deaths, Mar 1 to Sep 19: 28.7% — 2nd highest
> COVID-19 cases as of Sep 19: 2,237 per 100,000 (199,309 total)
> COVID-19 deaths as pct. of all cases: 8.0% — the highest
> Population: 8.9 million
Methodology
To determine the states where the most people have died from COVID-19, 24/7 Wall St. reviewed COVID-19 case and death counts compiled by state and local health departments. States were ranked based on the number of COVID-19 deaths as of Sept. 19, 2020 adjusted for population using data from the U.S. Census Bureau’s 2019 American Community Survey. Data on deaths from all causes from March 1 to Sept. 19, 2020 came from the Centers for Disease Control and Prevention and were adjusted for population using 2019 ACS data. Deaths as a percentage of cases, or case fatality rate, was calculated using case and death data from state and local health departments.
Travel Cards Are Getting Too Good To Ignore (sponsored)
Credit card companies are pulling out all the stops, with the issuers are offering insane travel rewards and perks.
We’re talking huge sign-up bonuses, points on every purchase, and benefits like lounge access, travel credits, and free hotel nights. For travelers, these rewards can add up to thousands of dollars in flights, upgrades, and luxury experiences every year.
It’s like getting paid to travel — and it’s available to qualified borrowers who know where to look.
We’ve rounded up some of the best travel credit cards on the market. Click here to see the list. Don’t miss these offers — they won’t be this good forever.
Thank you for reading! Have some feedback for us?
Contact the 24/7 Wall St. editorial team.


 24/7 Wall St.










 24/7 Wall St.



 24/7 Wall St.


 24/7 Wall St.