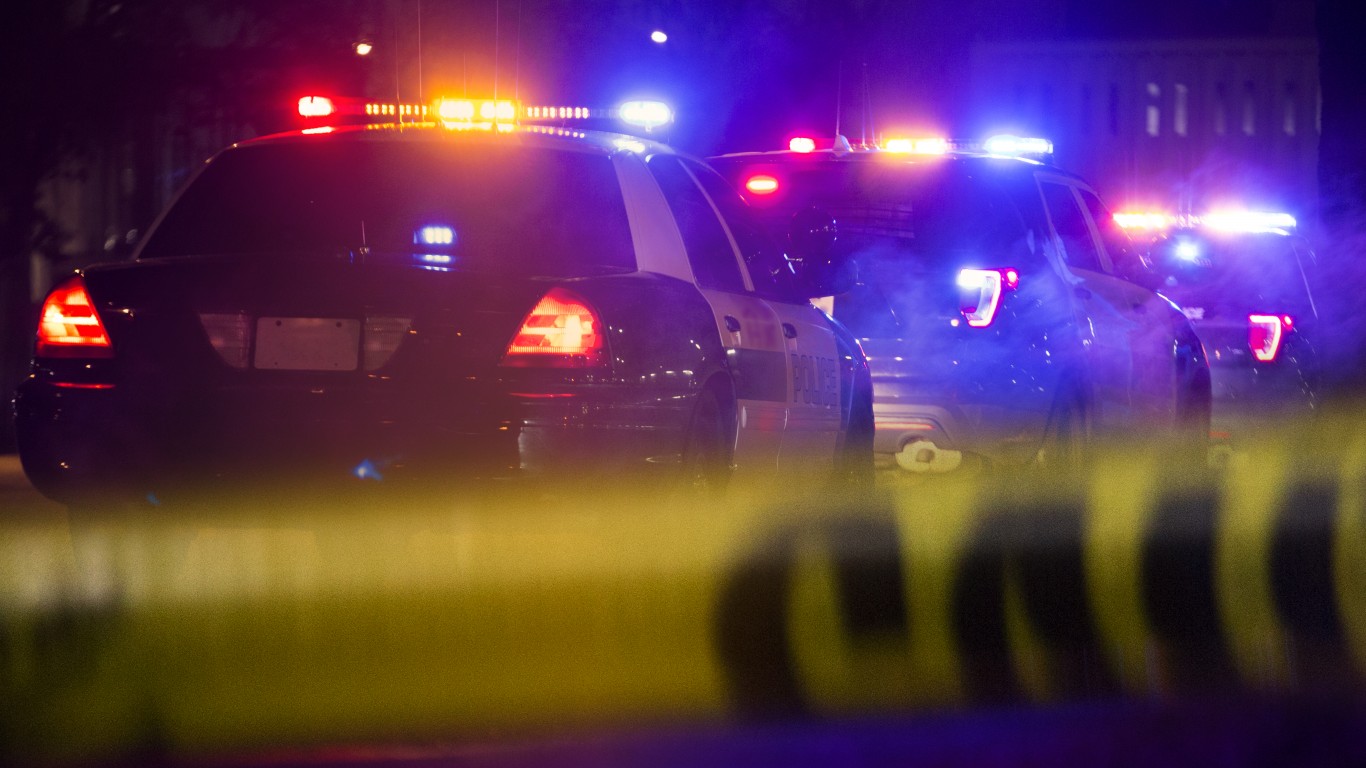
The police killings of George Floyd and Breonna Taylor earlier this year sparked one of the largest protest movements in U.S. history and have inspired a national conversation on police conduct. And while the use of force by police is now under more scrutiny than ever, there is a relative lack of data on incidents involving police that hinders discussion around the issue.
Federal officials have acknowledged the incomplete nature of tools that track police shootings around the country. Since 2015, however, The Washington Post has combed through local news reports, law enforcement websites, and social media to establish a database on all fatal police killings in the United States. The database reveals the wide variance in violence by police from city to city.
While in general the most fatal police shootings occur in the largest cities, a different trend emerges when the data is adjusted for population. The cities with the most fatal police shootings per capita are mostly midsize cities and include Pueblo, Colorado; Las Cruces, New Mexico; St. Louis, Missouri; Billings, Montana; and Westminster, Colorado.
Violent crime is more common in cities with the most fatal police shootings. In 18 of the 20 cities with the most fatal police shootings per capita, the violent crime rate is greater than the national rate of 366.7 incidents per 100,000 Americans. These are America’s most dangerous cities.
But while crime is higher in places with more police violence, police are not necessarily in greater danger during conflicts that result in deadly shootings. In 57.6% of fatal police shooting incidents nationwide, shooting victims were armed with a gun. In 64.7% of incidents, victims were attacking the police. Across cities where police have shot and killed at least 10 people since 2015, there is no discernible correlation between fatal shootings per capita and the percentage of shootings where the victim had a gun or was attacking.
In a majority of cities, a disproportionate share of victims of fatal police shootings are minorities. While 12.3% of the U.S. population is Black or African American, 23.7% of fatal police shooting victims are Black — a nearly two-to-one ratio. These are the worst cities for Black Americans. See also how COVID-19 has disproportionately affected minority communities in every state.
To determine the states where police shoot the most people, 24/7 Wall St. reviewed data on fatal police shootings in the United States since 2015 from The Washington Post. The database includes data on race, age, and additional details for all fatal shootings by a police officer in the line of duty since Jan. 1, 2015, and is collected from local news reports, law enforcement websites, and additional reporting. We adjusted police shooting tallies for population using data from the U.S. Census Bureau’s 2019 American Community Survey. Data on the percentage of shootings in which the victim was armed with a gun and the percentage of shootings in which the victim was fleeing were calculated using WaPo data. Data on violent crime rates in 2019 came from the FBI’s Uniform Crime Reporting program.
Click here to see the cities where police shoot the most people.
Click here to read our methodology.

30. San Diego, CA
> Total fatal police shootings tally since 2015: 18
> Avg. annual fatal police shootings since 2015: 2.2 per million people
> Victims were armed with gun in: 38.9% of fatal shootings
> Victims were fleeing in: 22.2% of fatal shootings
> Violent crime rate in 2019: 361.7 incidents per 100,000 people
> Population: 1.4 million
[in-text-ad]
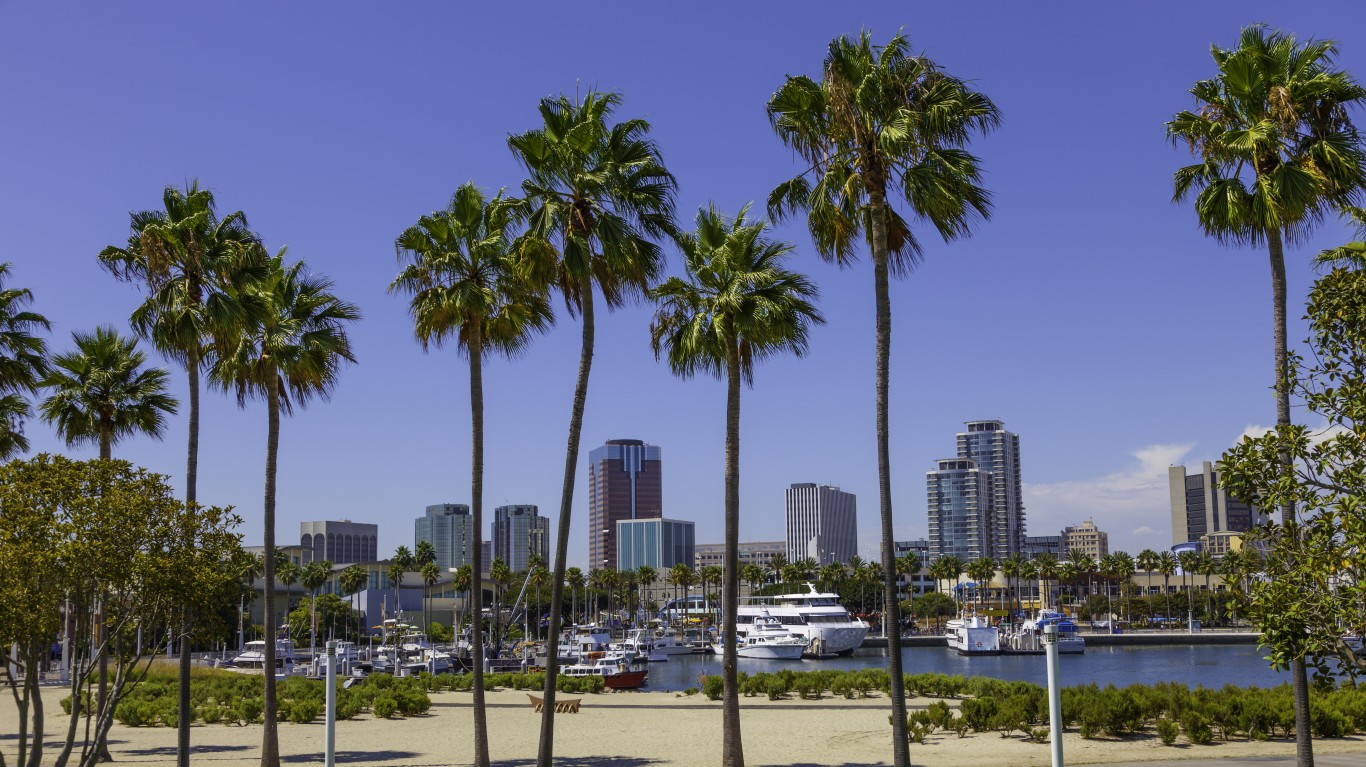
29. Long Beach, CA
> Total fatal police shootings tally since 2015: 18
> Avg. annual fatal police shootings since 2015: 6.4 per million people
> Victims were armed with gun in: 33.3% of fatal shootings
> Victims were fleeing in: 16.7% of fatal shootings
> Violent crime rate in 2019: 506.2 incidents per 100,000 people
> Population: 468,883
[recirclink id=587549]
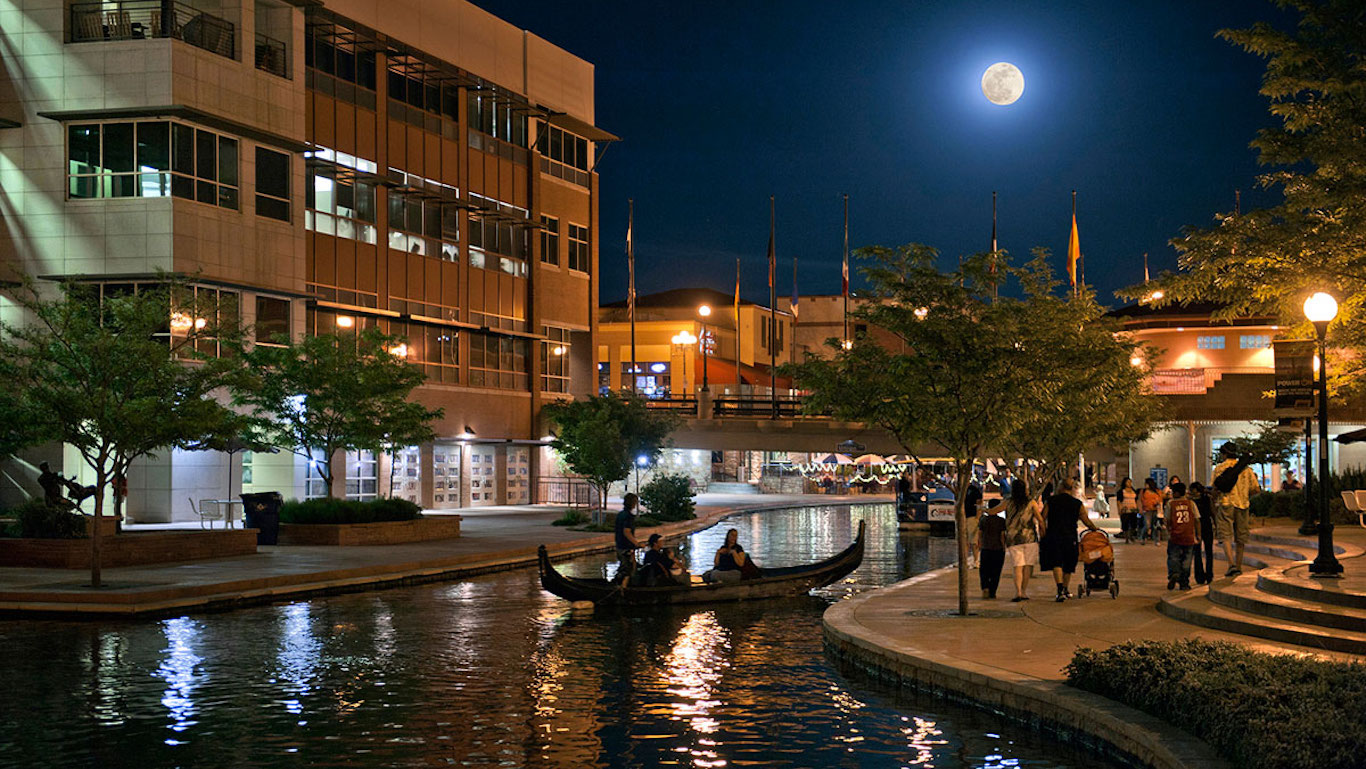
28. Pueblo, CO
> Total fatal police shootings tally since 2015: 18
> Avg. annual fatal police shootings since 2015: 27.5 per million people
> Victims were armed with gun in: 66.7% of fatal shootings
> Victims were fleeing in: 50.0% of fatal shootings
> Violent crime rate in 2019: N/A
> Population: 109,985

27. Indianapolis, IN
> Total fatal police shootings tally since 2015: 19
> Avg. annual fatal police shootings since 2015: 3.7 per million people
> Victims were armed with gun in: 68.4% of fatal shootings
> Victims were fleeing in: 31.6% of fatal shootings
> Violent crime rate in 2019: N/A
> Population: 857,637
[in-text-ad-2]
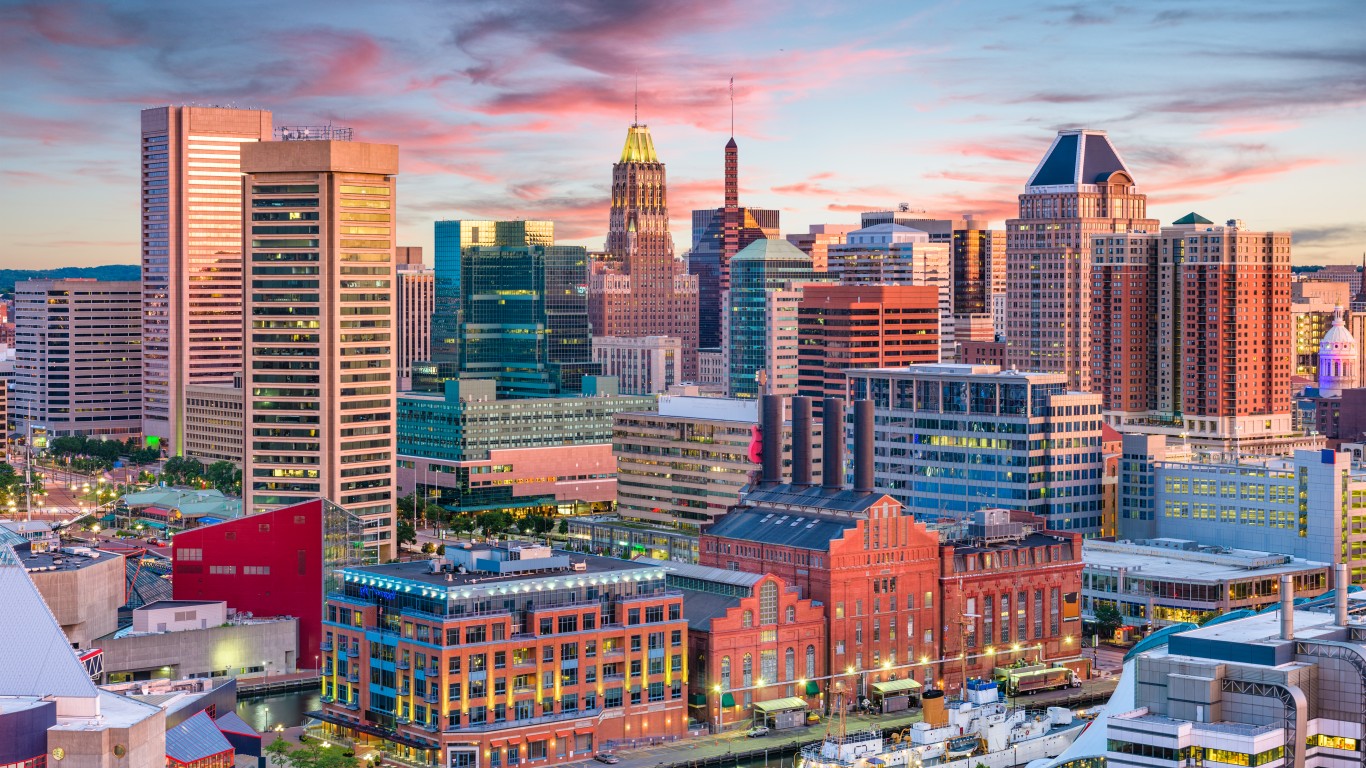
26. Baltimore, MD
> Total fatal police shootings tally since 2015: 19
> Avg. annual fatal police shootings since 2015: 5.1 per million people
> Victims were armed with gun in: 73.7% of fatal shootings
> Victims were fleeing in: 21.1% of fatal shootings
> Violent crime rate in 2019: 1,858.7 incidents per 100,000 people
> Population: 614,700

25. Fresno, CA
> Total fatal police shootings tally since 2015: 19
> Avg. annual fatal police shootings since 2015: 6.1 per million people
> Victims were armed with gun in: 36.8% of fatal shootings
> Victims were fleeing in: 21.1% of fatal shootings
> Violent crime rate in 2019: N/A
> Population: 522,277
[in-text-ad]
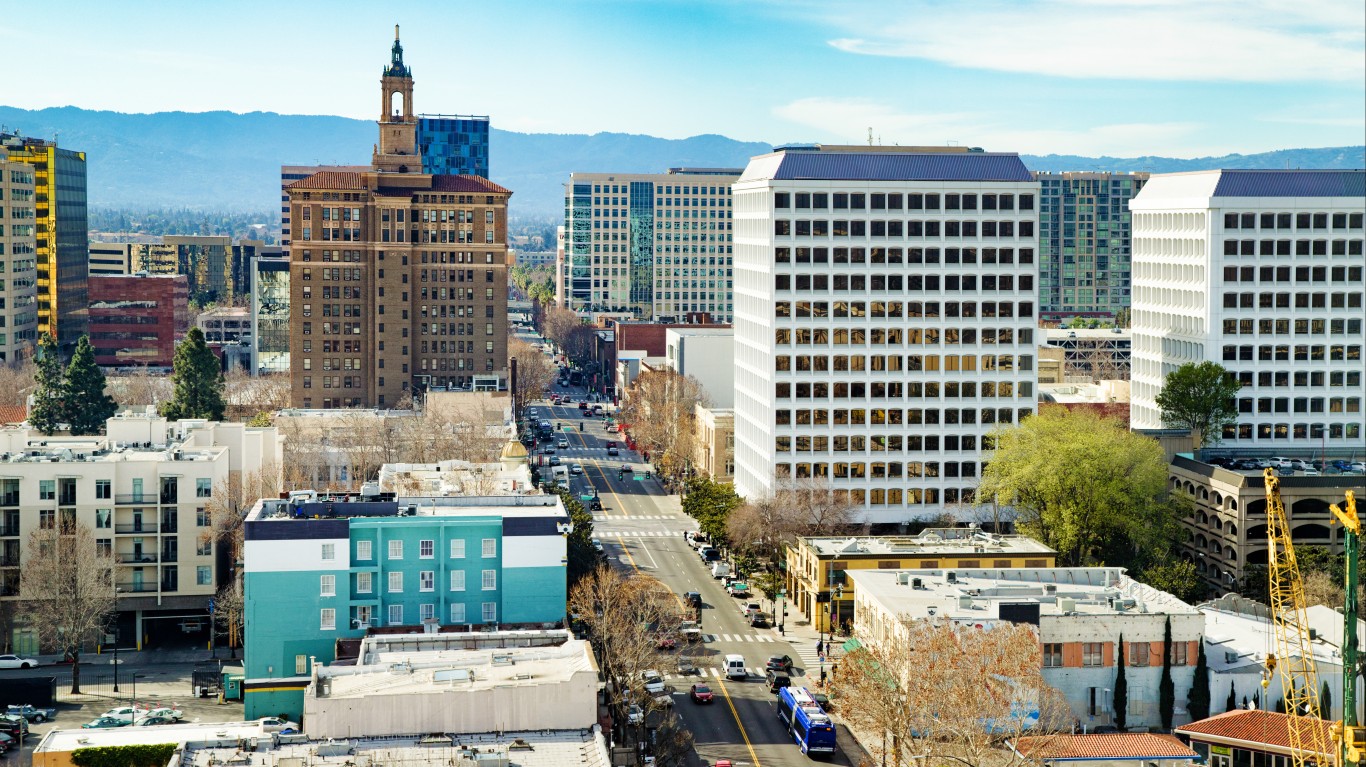
24. San Jose, CA
> Total fatal police shootings tally since 2015: 20
> Avg. annual fatal police shootings since 2015: 3.3 per million people
> Victims were armed with gun in: 35.0% of fatal shootings
> Victims were fleeing in: 30.0% of fatal shootings
> Violent crime rate in 2019: 438.4 incidents per 100,000 people
> Population: 1.0 million
[recirclink id=769984]
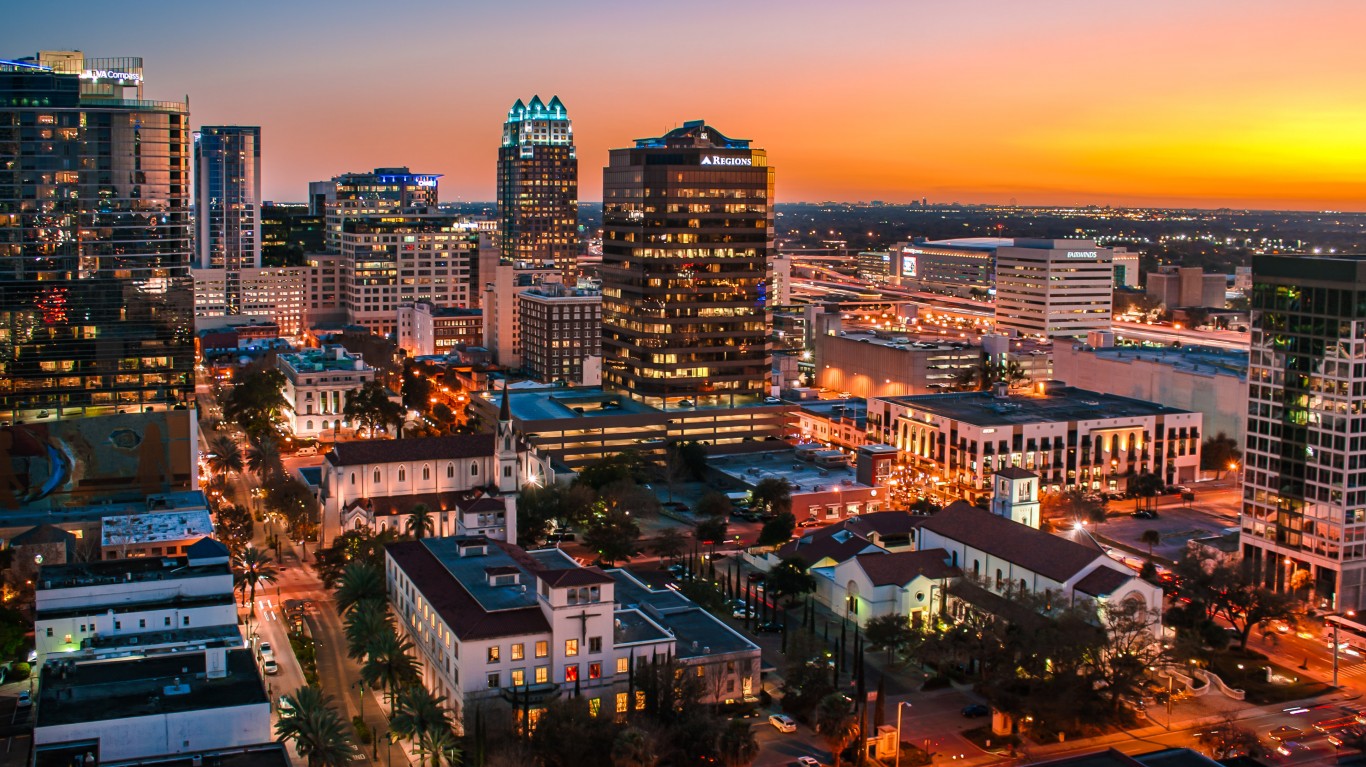
23. Orlando, FL
> Total fatal police shootings tally since 2015: 21
> Avg. annual fatal police shootings since 2015: 13.0 per million people
> Victims were armed with gun in: 57.1% of fatal shootings
> Victims were fleeing in: 23.8% of fatal shootings
> Violent crime rate in 2019: 738.4 incidents per 100,000 people
> Population: 275,690
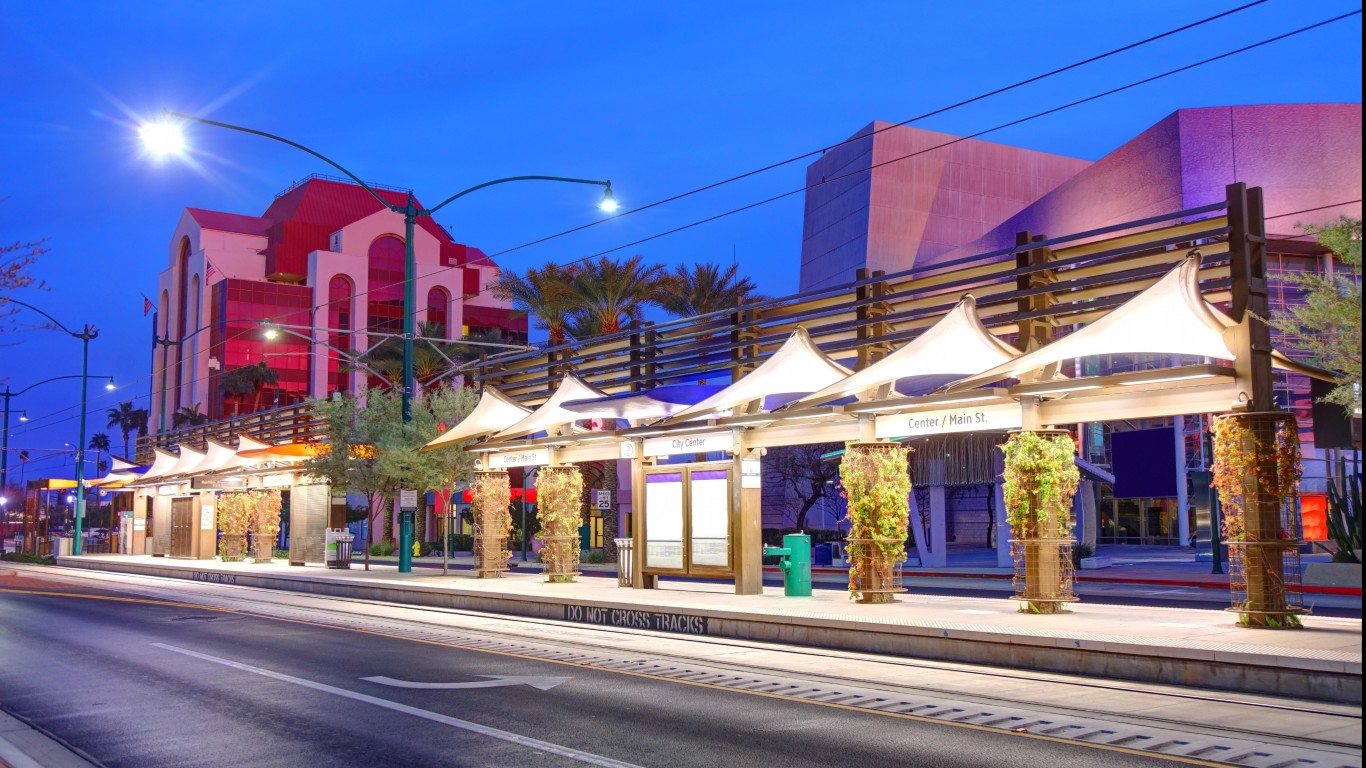
22. Mesa, AZ
> Total fatal police shootings tally since 2015: 22
> Avg. annual fatal police shootings since 2015: 7.6 per million people
> Victims were armed with gun in: 59.1% of fatal shootings
> Victims were fleeing in: 13.6% of fatal shootings
> Violent crime rate in 2019: 376.9 incidents per 100,000 people
> Population: 491,194
[in-text-ad-2]
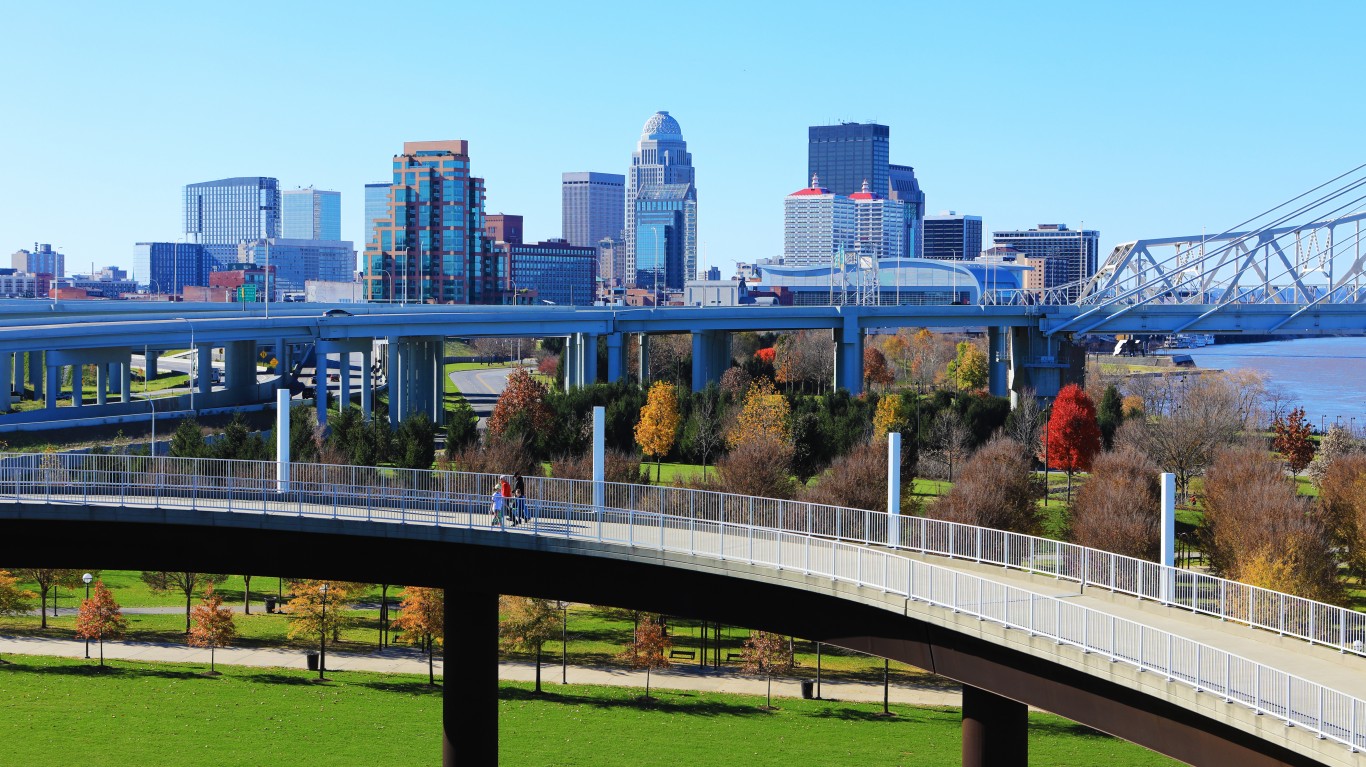
21. Louisville, KY
> Total fatal police shootings tally since 2015: 23
> Avg. annual fatal police shootings since 2015: 6.2 per million people
> Victims were armed with gun in: 52.2% of fatal shootings
> Victims were fleeing in: 13.0% of fatal shootings
> Violent crime rate in 2019: 686.9 incidents per 100,000 people
> Population: 617,032
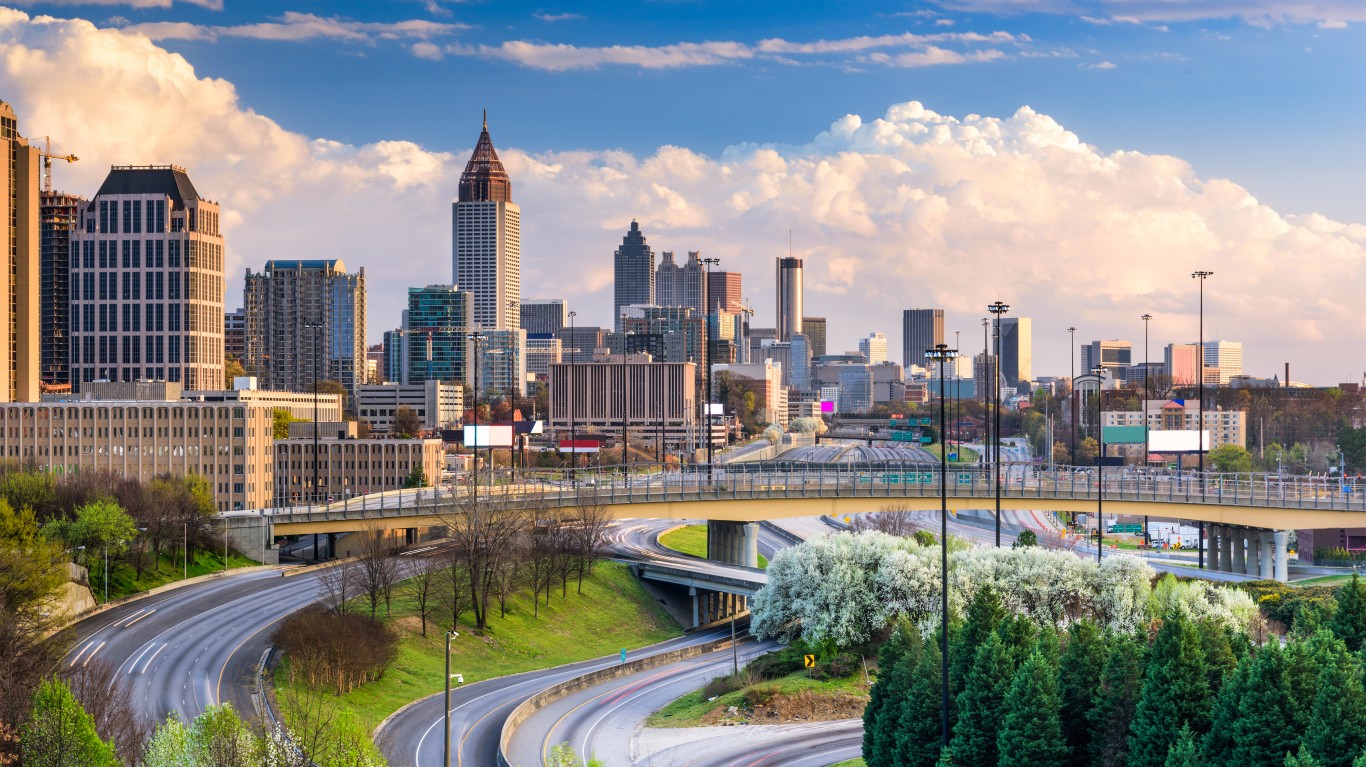
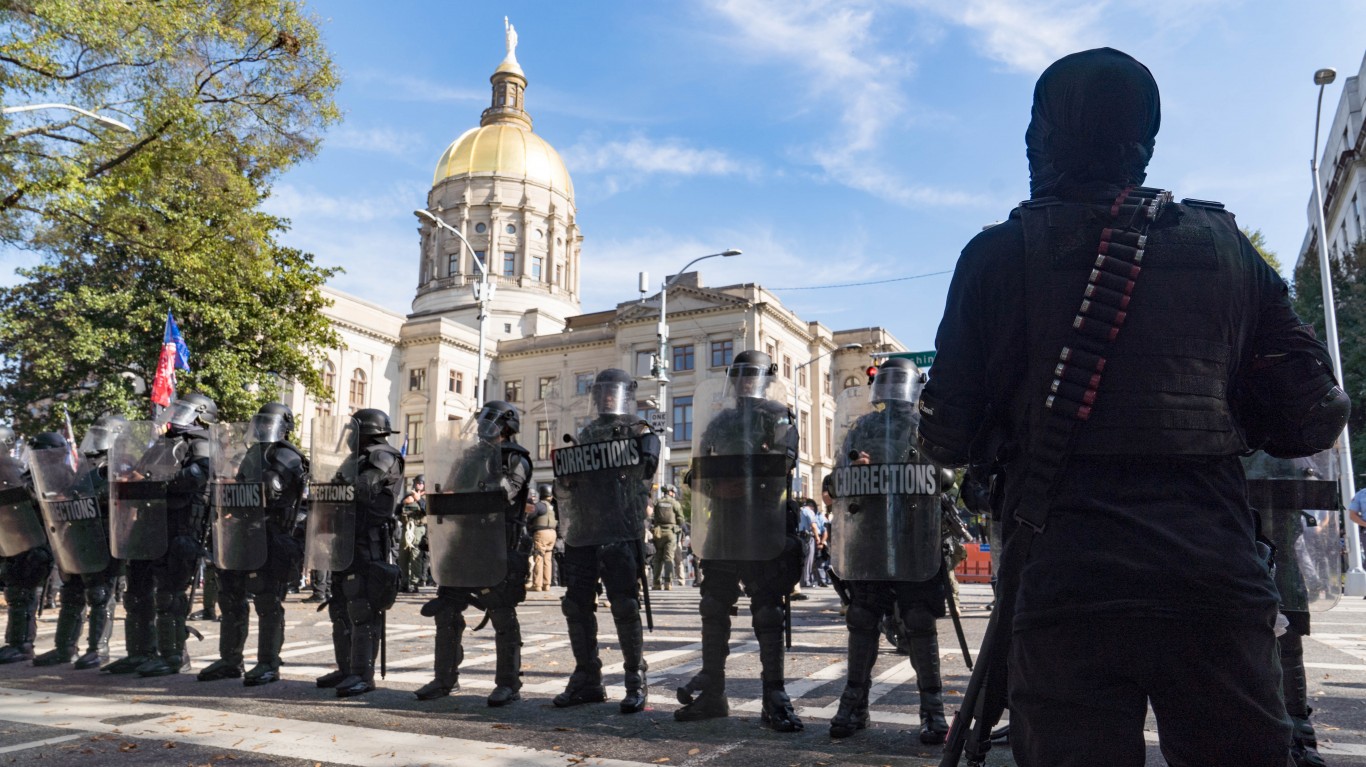
20. Atlanta, GA
> Total fatal police shootings tally since 2015: 23
> Avg. annual fatal police shootings since 2015: 8.2 per million people
> Victims were armed with gun in: 47.8% of fatal shootings
> Victims were fleeing in: 47.8% of fatal shootings
> Violent crime rate in 2019: N/A
> Population: 479,655
[in-text-ad]
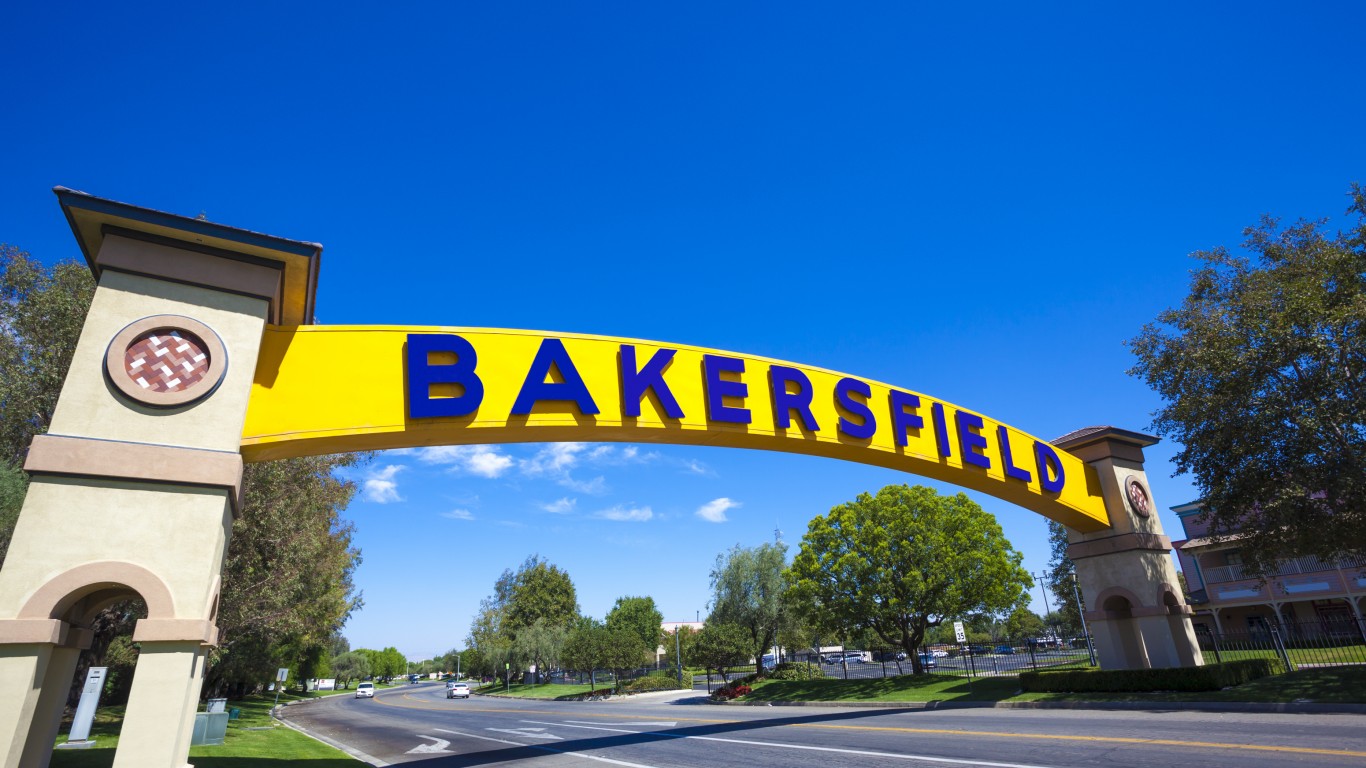
19. Bakersfield, CA
> Total fatal police shootings tally since 2015: 23
> Avg. annual fatal police shootings since 2015: 10.3 per million people
> Victims were armed with gun in: 39.1% of fatal shootings
> Victims were fleeing in: 39.1% of fatal shootings
> Violent crime rate in 2019: 455.1 incidents per 100,000 people
> Population: 375,699
[recirclink id=769957]
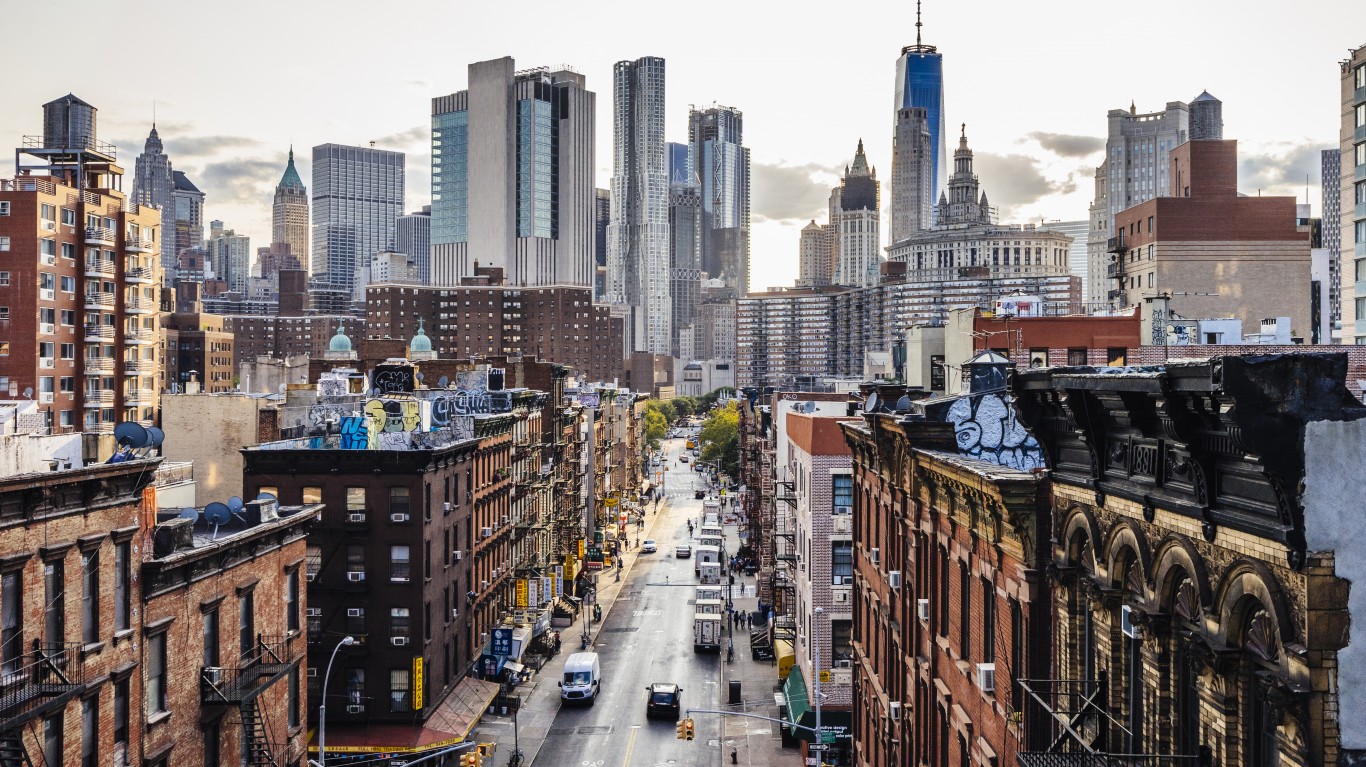
18. New York, NY
> Total fatal police shootings tally since 2015: 25
> Avg. annual fatal police shootings since 2015: 0.5 per million people
> Victims were armed with gun in: 56.0% of fatal shootings
> Victims were fleeing in: 44.0% of fatal shootings
> Violent crime rate in 2019: 570.7 incidents per 100,000 people
> Population: 8.4 million

17. Tulsa, OK
> Total fatal police shootings tally since 2015: 26
> Avg. annual fatal police shootings since 2015: 10.8 per million people
> Victims were armed with gun in: 46.2% of fatal shootings
> Victims were fleeing in: 30.8% of fatal shootings
> Violent crime rate in 2019: 986.8 incidents per 100,000 people
> Population: 402,223
[in-text-ad-2]
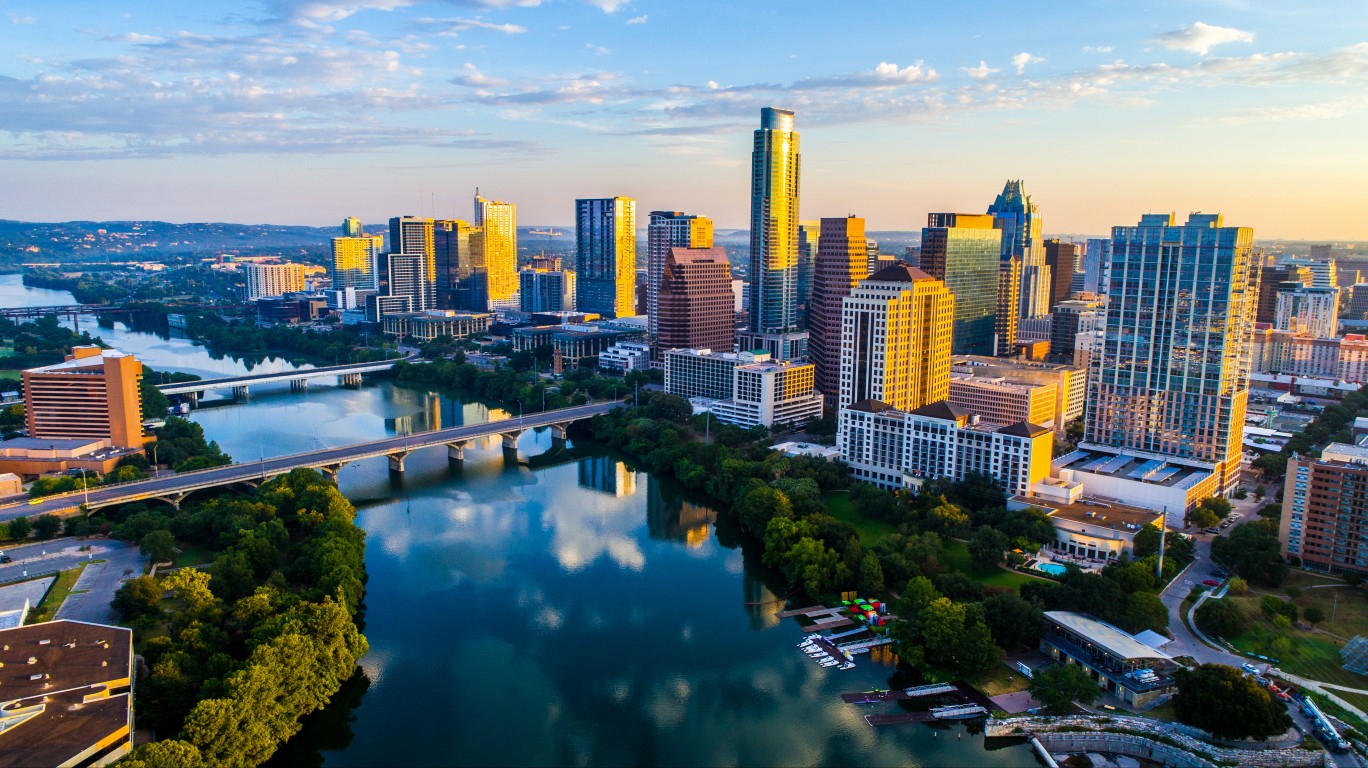
16. Austin, TX
> Total fatal police shootings tally since 2015: 27
> Avg. annual fatal police shootings since 2015: 4.9 per million people
> Victims were armed with gun in: 66.7% of fatal shootings
> Victims were fleeing in: 37.0% of fatal shootings
> Violent crime rate in 2019: 400.9 incidents per 100,000 people
> Population: 935,755
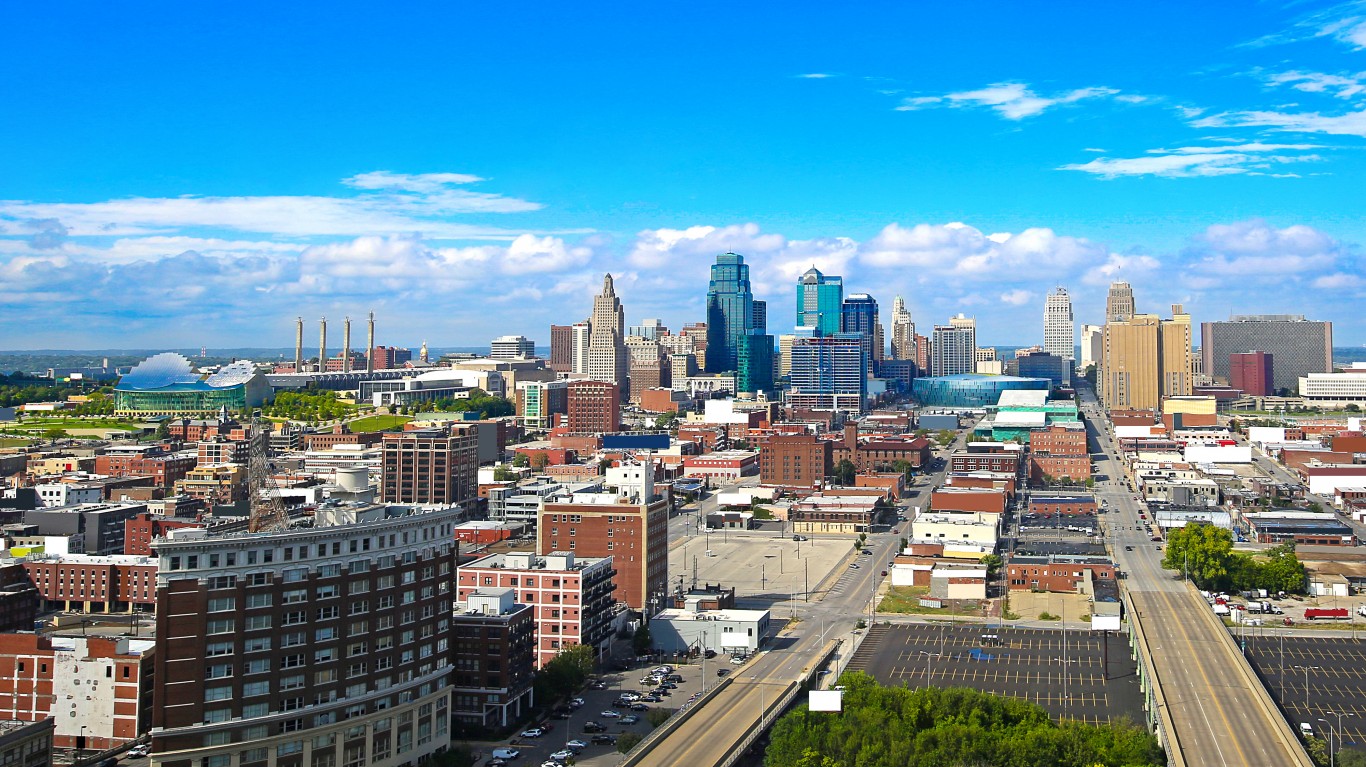
15. Kansas City, MO
> Total fatal police shootings tally since 2015: 29
> Avg. annual fatal police shootings since 2015: 10.1 per million people
> Victims were armed with gun in: 86.2% of fatal shootings
> Victims were fleeing in: 37.9% of fatal shootings
> Violent crime rate in 2019: 1,431.4 incidents per 100,000 people
> Population: 481,417
[in-text-ad]
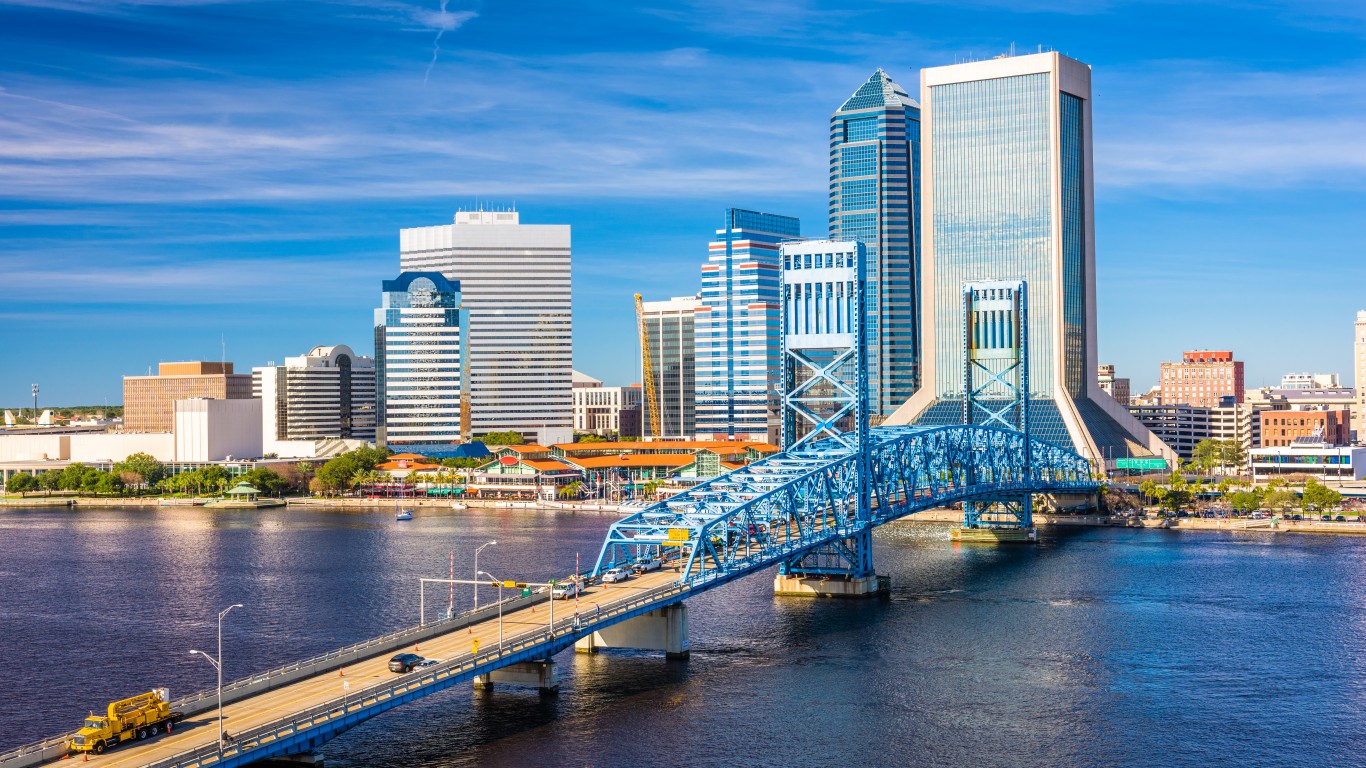
14. Jacksonville, FL
> Total fatal police shootings tally since 2015: 30
> Avg. annual fatal police shootings since 2015: 5.8 per million people
> Victims were armed with gun in: 60.0% of fatal shootings
> Victims were fleeing in: 33.3% of fatal shootings
> Violent crime rate in 2019: 647.4 incidents per 100,000 people
> Population: 878,907
[recirclink id=799937]
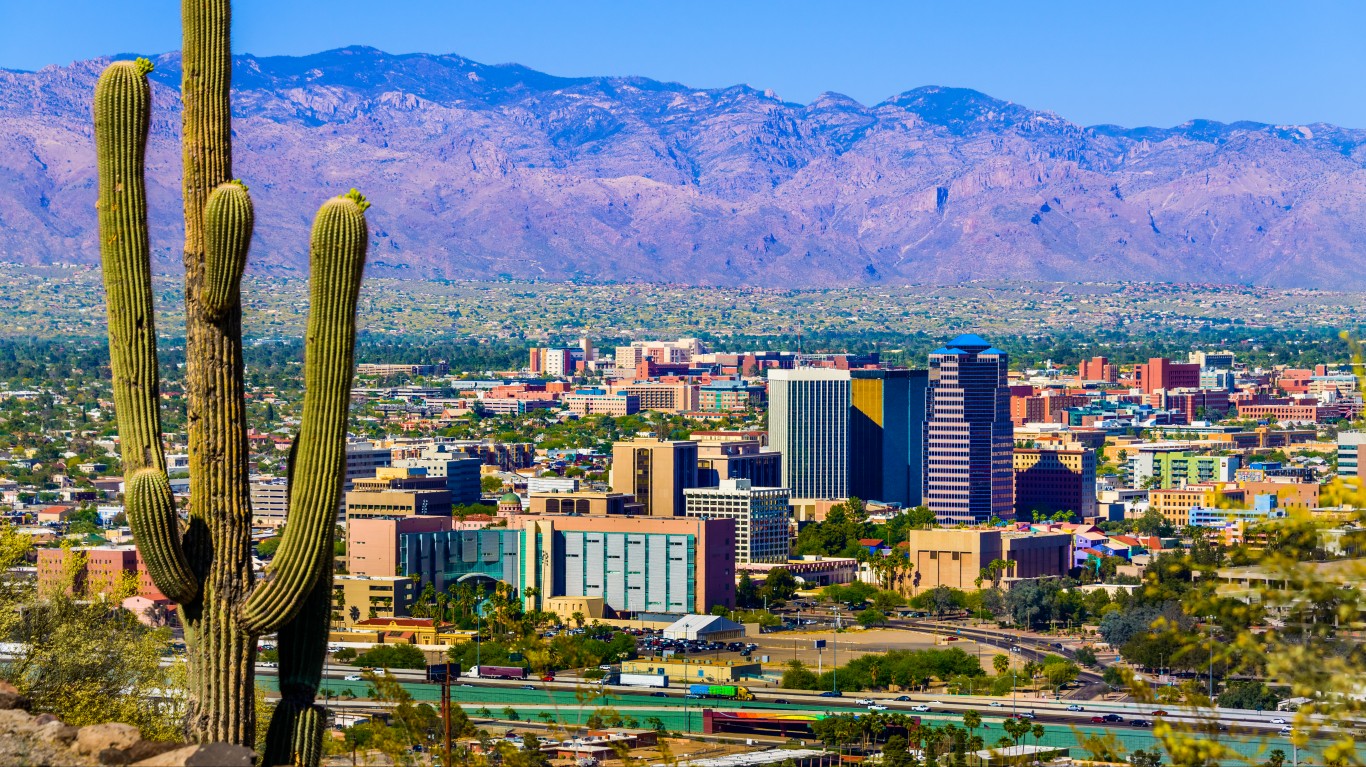
13. Tucson, AZ
> Total fatal police shootings tally since 2015: 30
> Avg. annual fatal police shootings since 2015: 9.4 per million people
> Victims were armed with gun in: 66.7% of fatal shootings
> Victims were fleeing in: 26.7% of fatal shootings
> Violent crime rate in 2019: 688.4 incidents per 100,000 people
> Population: 539,216
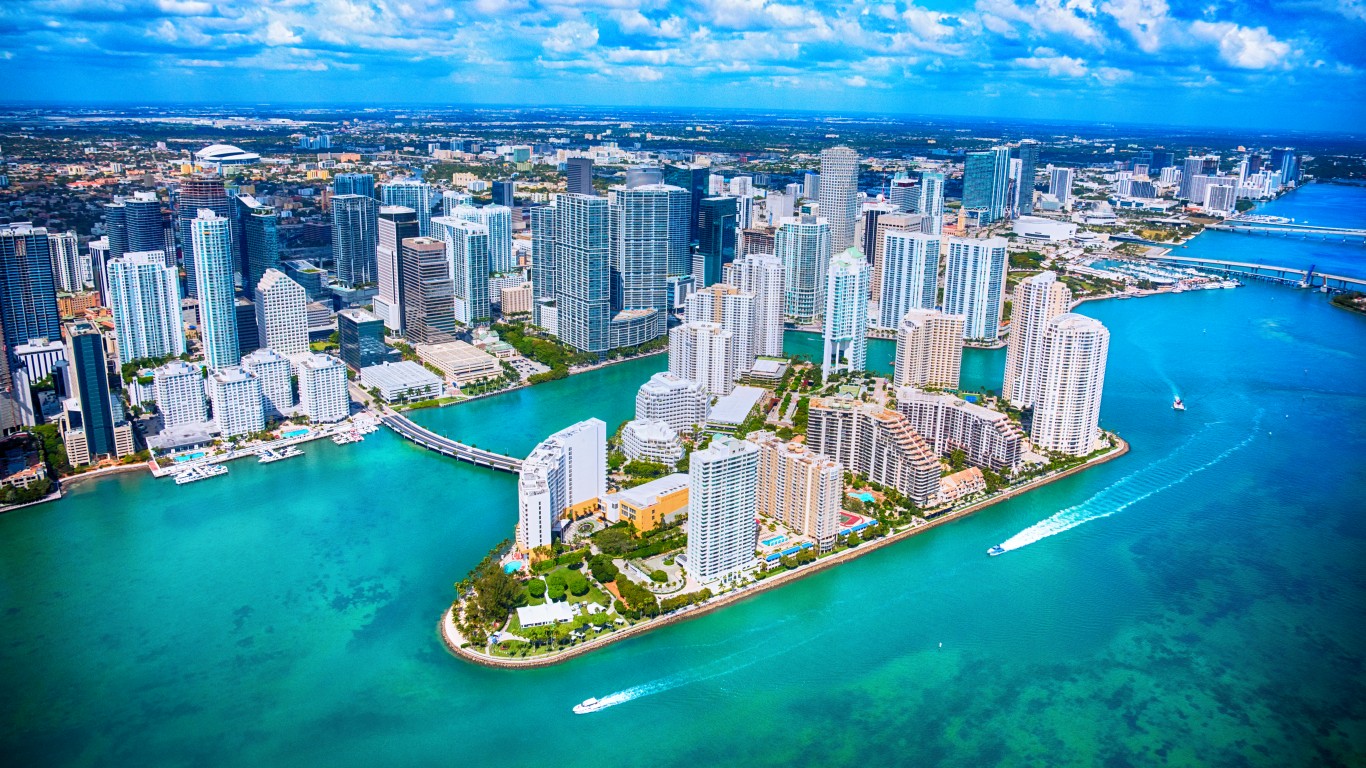
12. Miami, FL
> Total fatal police shootings tally since 2015: 30
> Avg. annual fatal police shootings since 2015: 11.3 per million people
> Victims were armed with gun in: 56.7% of fatal shootings
> Victims were fleeing in: 43.3% of fatal shootings
> Violent crime rate in 2019: 593.1 incidents per 100,000 people
> Population: 451,214
[in-text-ad-2]
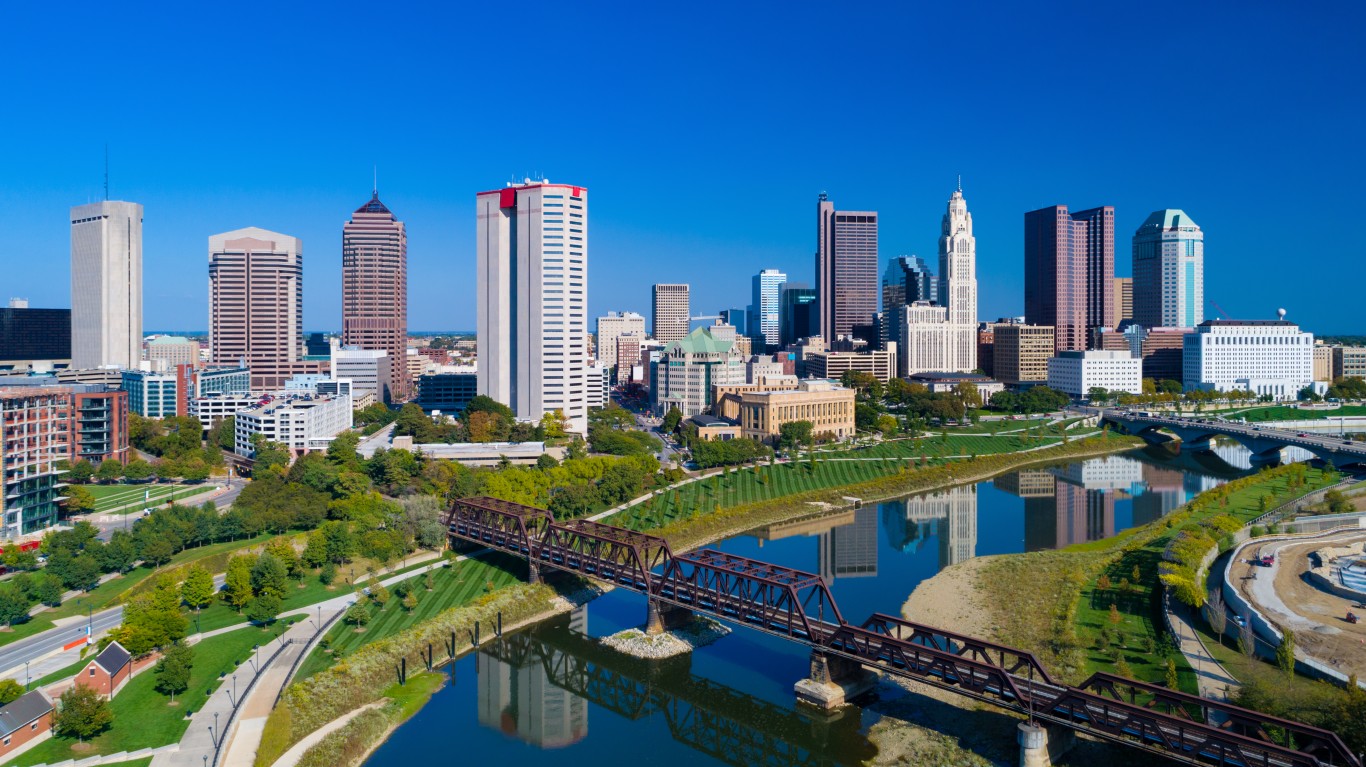
11. Columbus, OH
> Total fatal police shootings tally since 2015: 31
> Avg. annual fatal police shootings since 2015: 6.1 per million people
> Victims were armed with gun in: 67.7% of fatal shootings
> Victims were fleeing in: 29.0% of fatal shootings
> Violent crime rate in 2019: 503.4 incidents per 100,000 people
> Population: 867,628

10. Oklahoma City, OK
> Total fatal police shootings tally since 2015: 31
> Avg. annual fatal police shootings since 2015: 8.2 per million people
> Victims were armed with gun in: 61.3% of fatal shootings
> Victims were fleeing in: 19.4% of fatal shootings
> Violent crime rate in 2019: 722.2 incidents per 100,000 people
> Population: 637,284
[in-text-ad]

9. St. Louis, MO
> Total fatal police shootings tally since 2015: 31
> Avg. annual fatal police shootings since 2015: 16.5 per million people
> Victims were armed with gun in: 87.1% of fatal shootings
> Victims were fleeing in: 41.9% of fatal shootings
> Violent crime rate in 2019: 1,927.3 incidents per 100,000 people
> Population: 311,273
[recirclink id=738002]

8. Denver, CO
> Total fatal police shootings tally since 2015: 34
> Avg. annual fatal police shootings since 2015: 8.4 per million people
> Victims were armed with gun in: 58.8% of fatal shootings
> Victims were fleeing in: 41.2% of fatal shootings
> Violent crime rate in 2019: 748.9 incidents per 100,000 people
> Population: 693,417
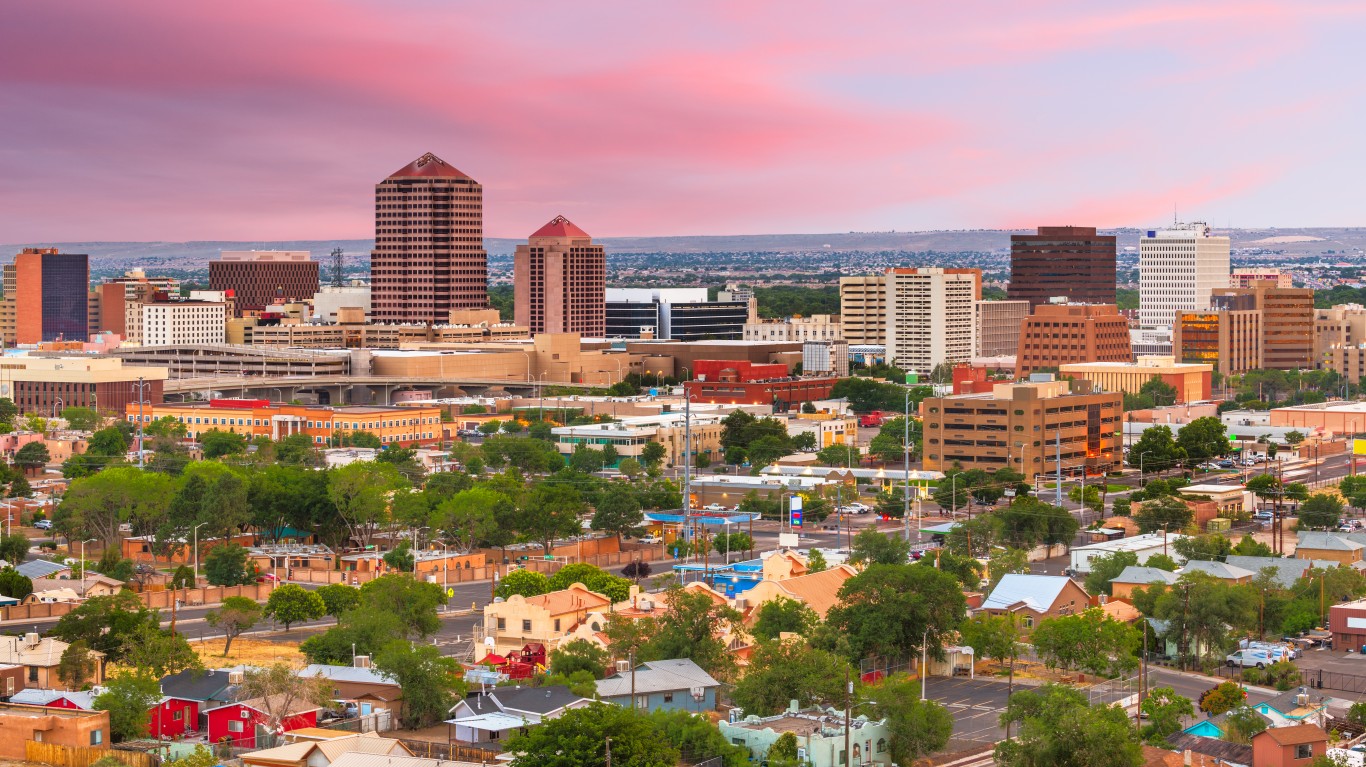
7. Albuquerque, NM
> Total fatal police shootings tally since 2015: 38
> Avg. annual fatal police shootings since 2015: 11.4 per million people
> Victims were armed with gun in: 71.1% of fatal shootings
> Victims were fleeing in: 42.1% of fatal shootings
> Violent crime rate in 2019: 1,351.8 incidents per 100,000 people
> Population: 559,202
[in-text-ad-2]

6. Chicago, IL
> Total fatal police shootings tally since 2015: 40
> Avg. annual fatal police shootings since 2015: 2.5 per million people
> Victims were armed with gun in: 70.0% of fatal shootings
> Victims were fleeing in: 52.5% of fatal shootings
> Violent crime rate in 2019: 943.2 incidents per 100,000 people
> Population: 2.7 million

5. San Antonio, TX
> Total fatal police shootings tally since 2015: 46
> Avg. annual fatal police shootings since 2015: 5.2 per million people
> Victims were armed with gun in: 69.6% of fatal shootings
> Victims were fleeing in: 23.9% of fatal shootings
> Violent crime rate in 2019: 708.5 incidents per 100,000 people
> Population: 1.5 million
[in-text-ad]

4. Las Vegas, NV
> Total fatal police shootings tally since 2015: 50
> Avg. annual fatal police shootings since 2015: 13.4 per million people
> Victims were armed with gun in: 62.0% of fatal shootings
> Victims were fleeing in: 28.0% of fatal shootings
> Violent crime rate in 2019: 531.2 incidents per 100,000 people
> Population: 626,637
[recirclink id=587549]
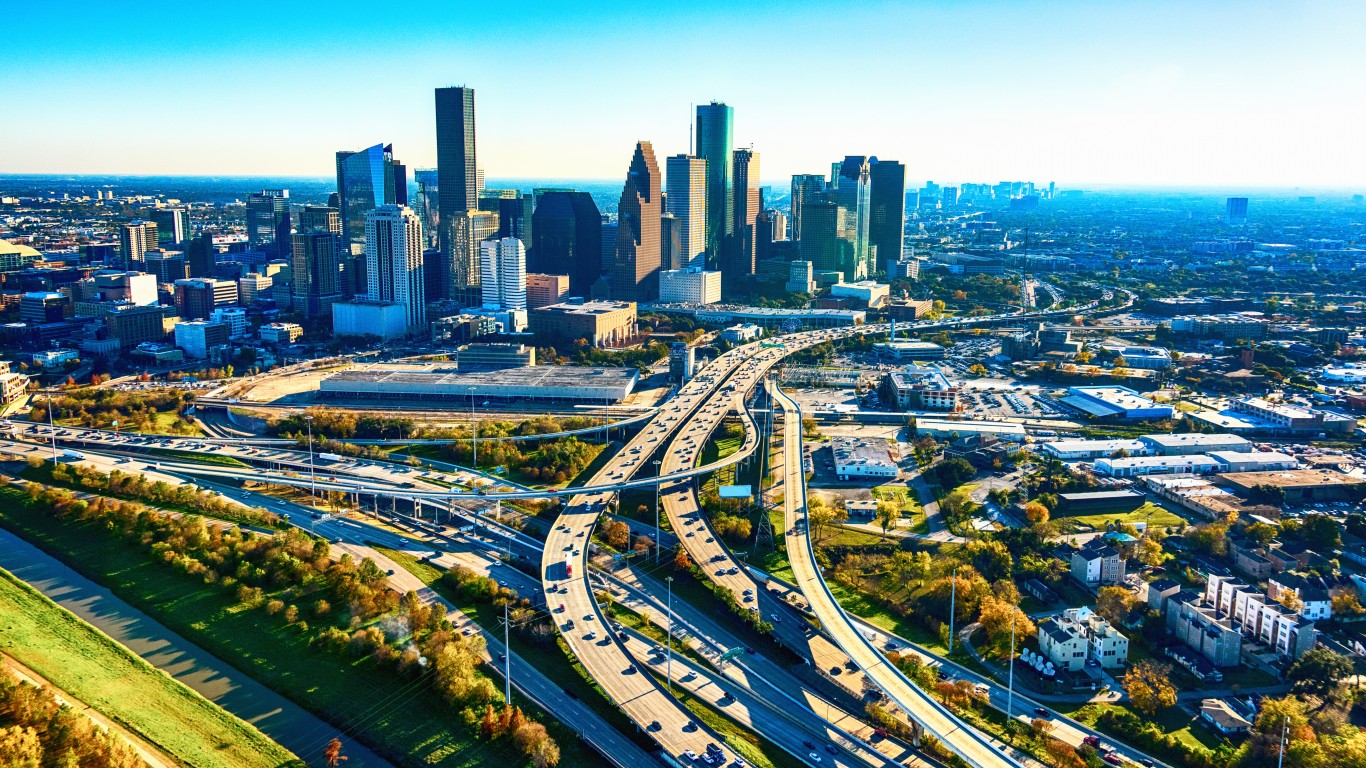
3. Houston, TX
> Total fatal police shootings tally since 2015: 59
> Avg. annual fatal police shootings since 2015: 4.3 per million people
> Victims were armed with gun in: 61.0% of fatal shootings
> Victims were fleeing in: 37.3% of fatal shootings
> Violent crime rate in 2019: 1,072.2 incidents per 100,000 people
> Population: 2.3 million
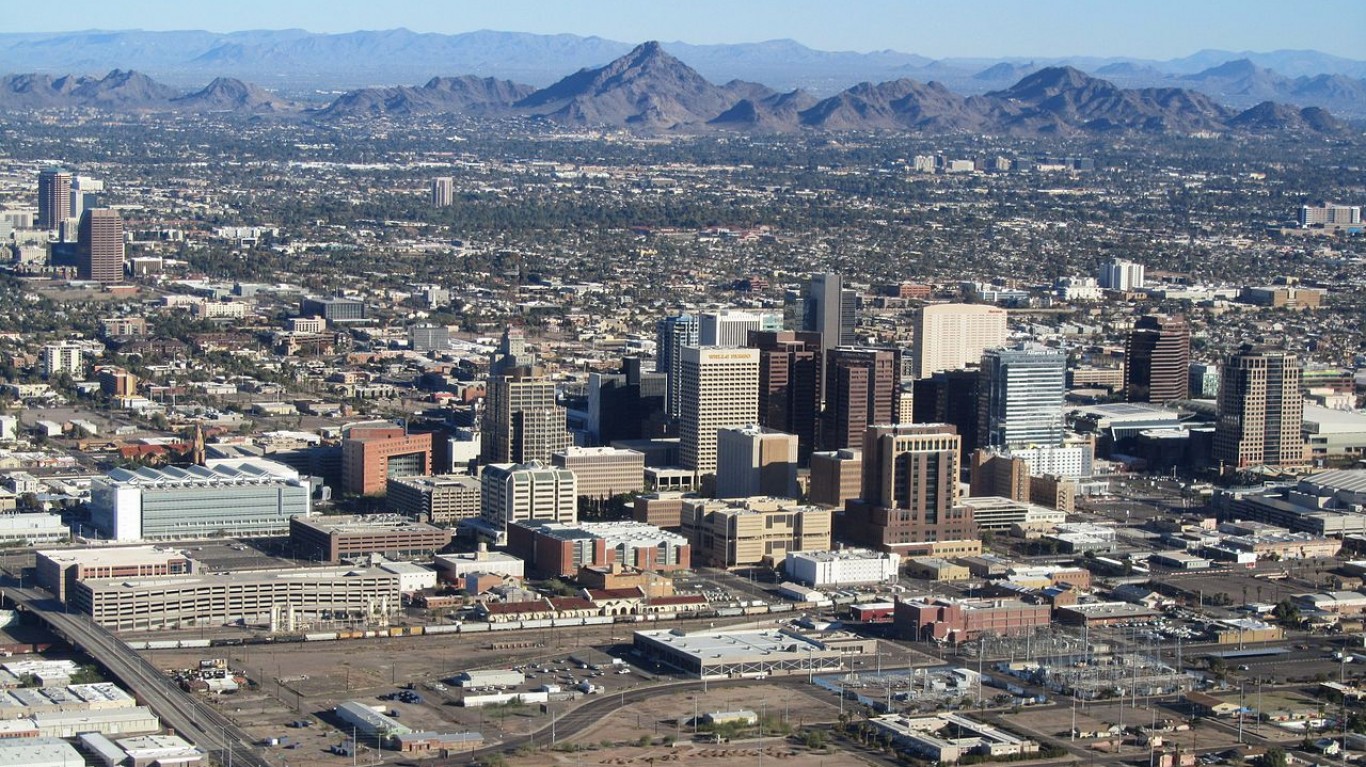
2. Phoenix, AZ
> Total fatal police shootings tally since 2015: 79
> Avg. annual fatal police shootings since 2015: 8.3 per million people
> Victims were armed with gun in: 64.6% of fatal shootings
> Victims were fleeing in: 31.6% of fatal shootings
> Violent crime rate in 2019: 698.9 incidents per 100,000 people
> Population: 1.6 million
[in-text-ad-2]
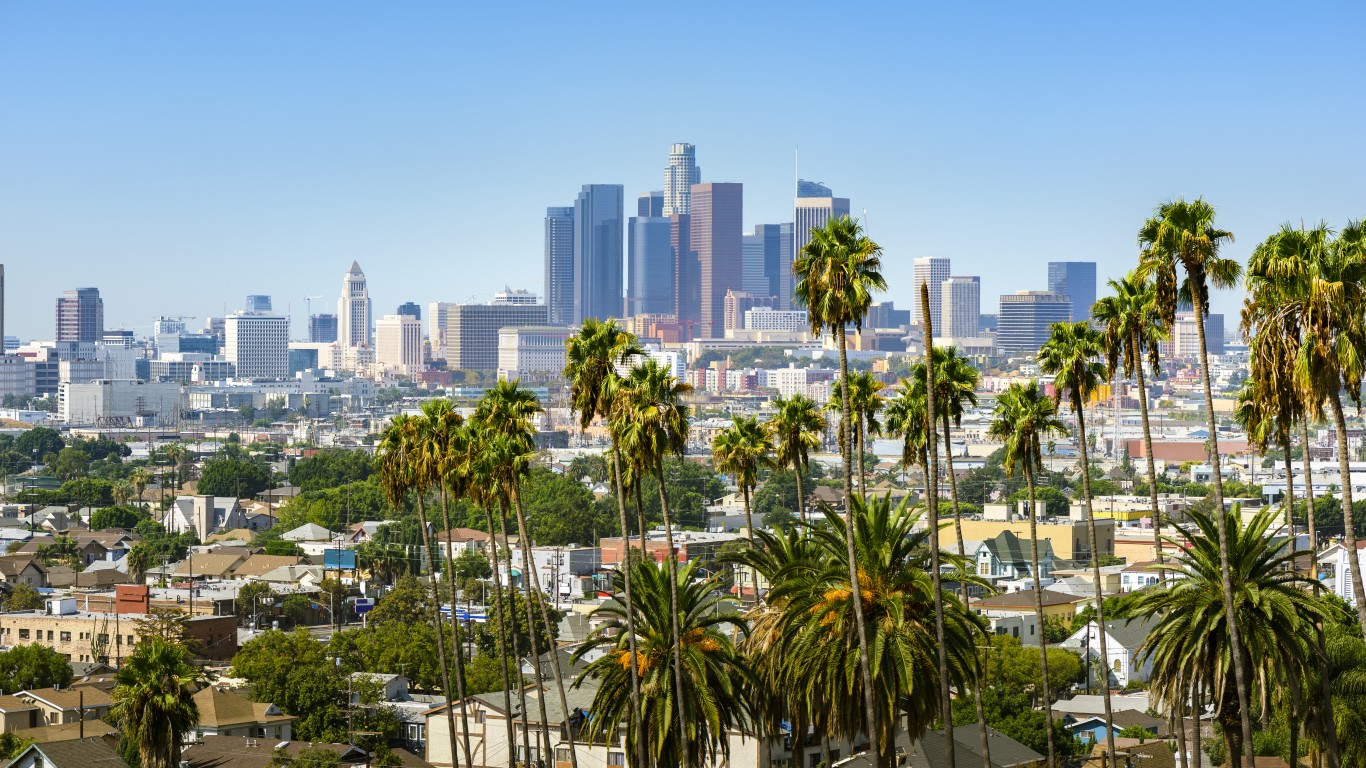
1. Los Angeles, CA
> Total fatal police shootings tally since 2015: 87
> Avg. annual fatal police shootings since 2015: 3.7 per million people
> Victims were armed with gun in: 52.9% of fatal shootings
> Victims were fleeing in: 36.8% of fatal shootings
> Violent crime rate in 2019: 732.2 incidents per 100,000 people
> Population: 4.0 million