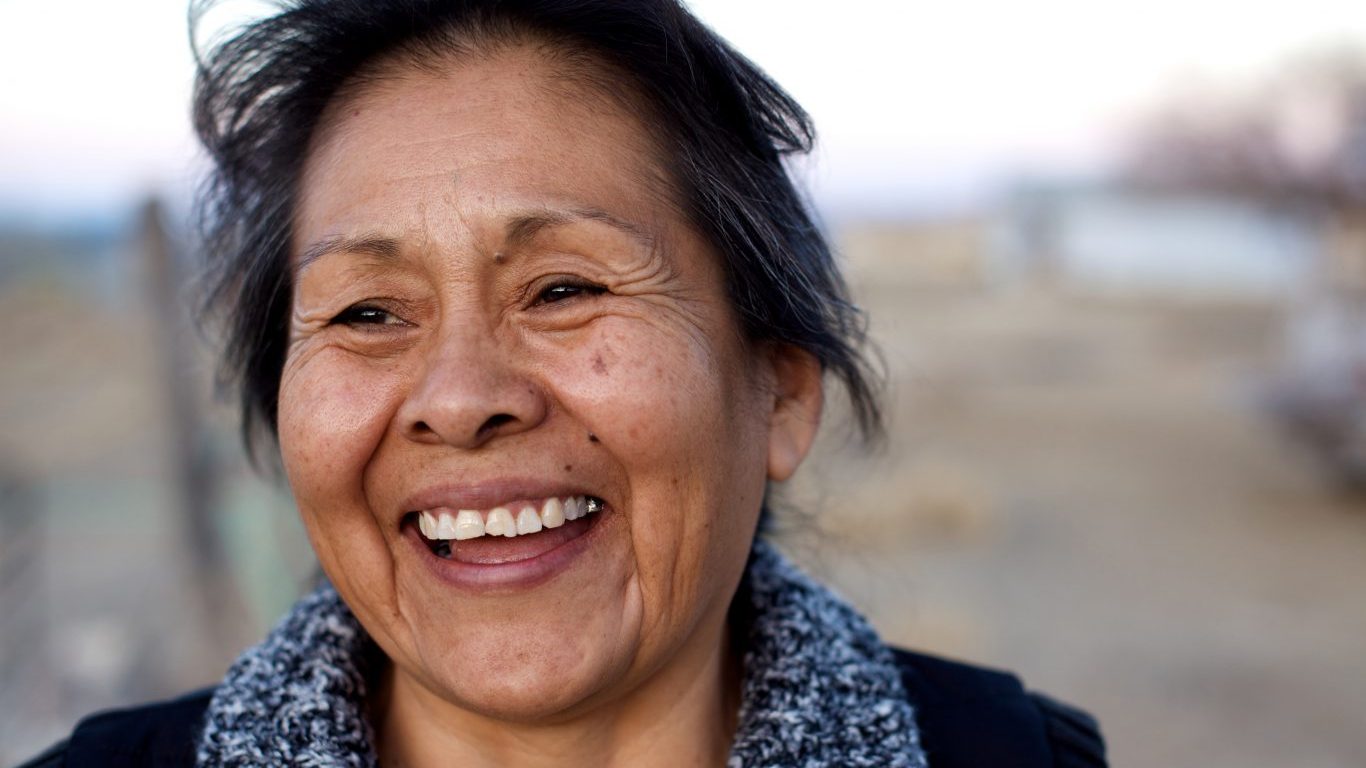
Thousands of years before Leif Erikson and Christopher Columbus arrived in North America, a different group of people came to the continent. While there are different theories as to how people first came to North America, the crossing of the Bering Land Bridge that connected Asia and North America is the most widely accepted one.
Scholars estimate that by the time Europeans began to settle the continent, nearly 10 million people had already been living in the continental United States. That number fell sharply after colonization, because of wars and the spread of diseases.
As of 2018, there were approximately 5.8 million Native Americans (alone or in combination) in the United States, comprising about 1.7% of the total population, according to Census data. Today, the Native American population is concentrated in the nation’s 574 federally recognized Native American and Alaska Native tribes and villages across the country, but millions of Americans identify as having a Native American heritage.
24/7 Tempo reviewed the U.S. Census Bureau’s 2018 five-year American Community Survey to identify the states with the largest share of Native American population. This includes those who self-identify as Native American or report having Native American heritage, not necessarily people who live on a reservation or tribal area or are active members of a tribe or nation.
Click here to see the largest Native American population in every state.
Click here for our detailed methodology.
Currently, the state with the largest share of Native population is California, with Oklahoma, Arizona, Texas, and New Mexico rounding out the top five.
Native American tribes and nations in the country face a range of threats to their sovereignty from federal and state governments. Some of the biggest concerns are lack of federal funding for tribal programs, voter suppression, and not expanding tribal authority to administer justice, according to the National Congress of American Indians President Fawn Sharp in her annual State of Indian Nations address.
Today, American Indians have one of the highest poverty rates among major racial groups in the country. In 2018, one in four native Americans lived below the poverty line. The national poverty rate in 2018 was 14.1%. Additionally, the median household income of single-race American Indian and Alaska Native households in 2018 was $41,879, compared with $60,293 for the nation as a whole.
The vast majority of reservations and tribal areas are located in the Southern and Western parts of the country — these are the states with the most Indian reservations and tribal areas.
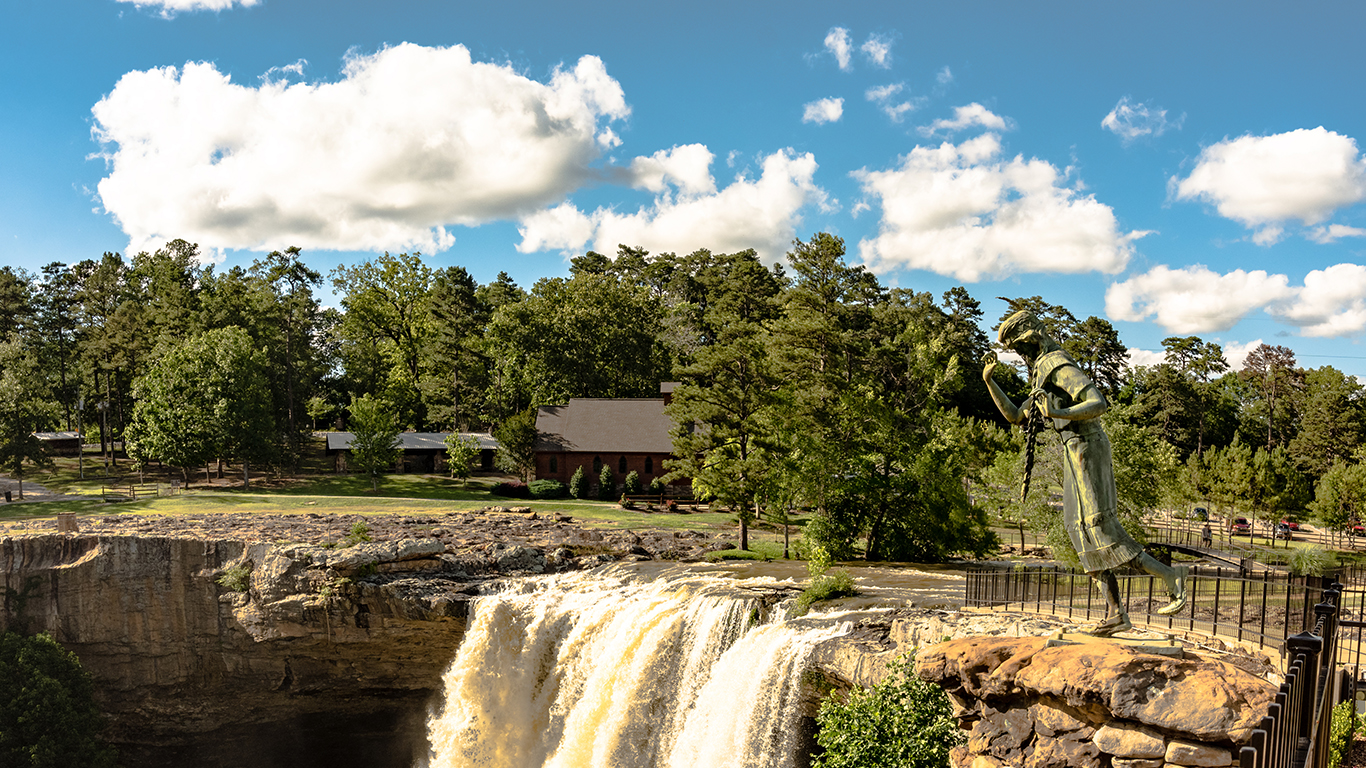
Alabama
> Largest native population: Cherokee (pop: 29,187)
> Second largest native population: Creek (pop: 7,857)
> State residents who self-identify as American Indian: 1.0% — 25th lowest (total: 51,007)
> Median household income: Native pop: $48,188; State: $48,486
> Poverty rate: Native pop: 16.8%; State: 17.5%
> State population: 4,864,680 — 24th largest
[in-text-ad]
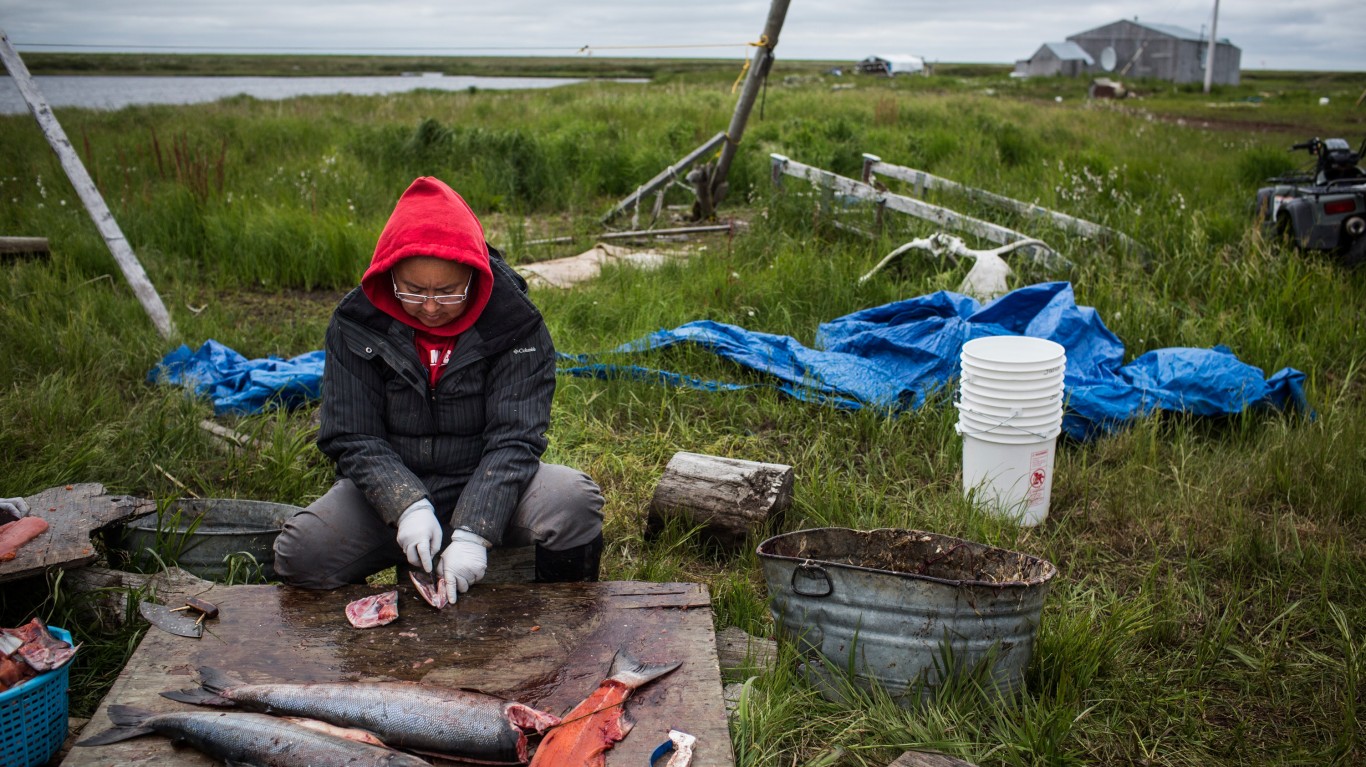
Alaska
> Largest native population: Yup’ik (pop: 39,350)
> Second largest native population: Inupiat (pop: 31,426)
> State residents who self-identify as American Indian: 2.2% — 10th highest (total: 15,914)
> Median household income: Native pop: $49,834; State: $76,715
> Poverty rate: Native pop: 23.8%; State: 10.8%
> State population: 738,516 — 3rd smallest
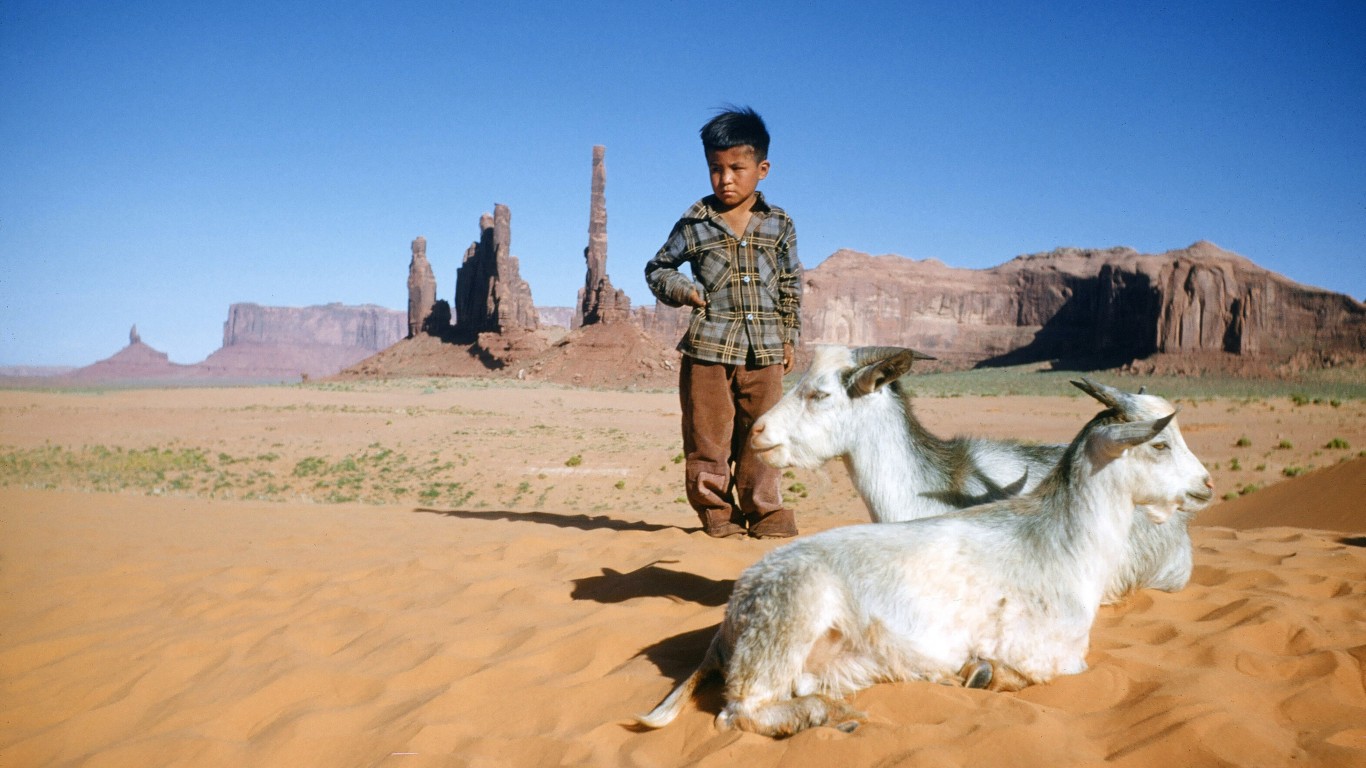
Arizona
> Largest native population: Navajo (pop: 161,558)
> Second largest native population: Apache (pop: 36,039)
> State residents who self-identify as American Indian: 5.2% — 6th highest (total: 362,637)
> Median household income: Native pop: $35,251; State: $56,213
> Poverty rate: Native pop: 34.9%; State: 16.1%
> State population: 6,946,685 — 14th largest
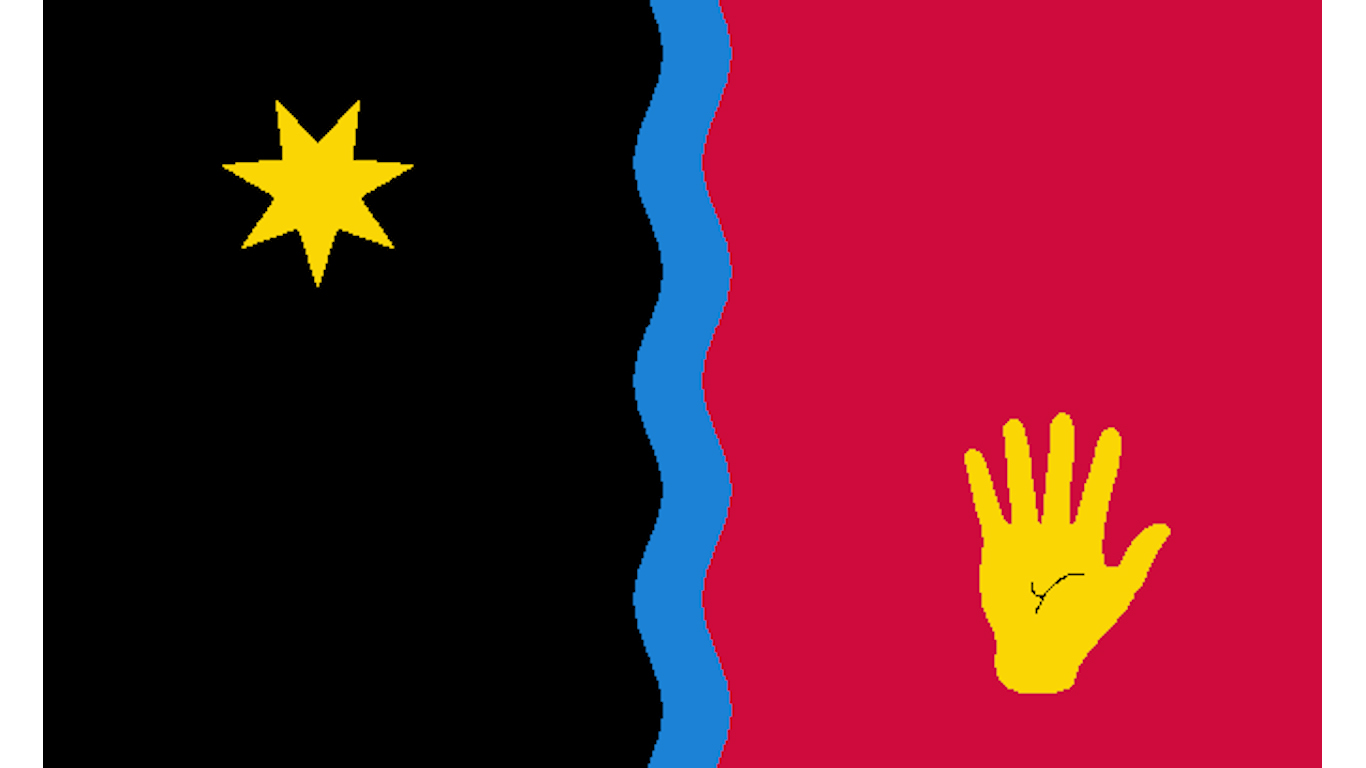
Arkansas
> Largest native population: Cherokee (pop: 28,039)
> Second largest native population: Choctaw (pop: 7,701)
> State residents who self-identify as American Indian: 1.6% — 18th highest (total: 46,841)
> Median household income: Native pop: $37,801; State: $45,726
> Poverty rate: Native pop: 23.9%; State: 17.6%
> State population: 2,990,671 — 19th smallest
[in-text-ad-2]
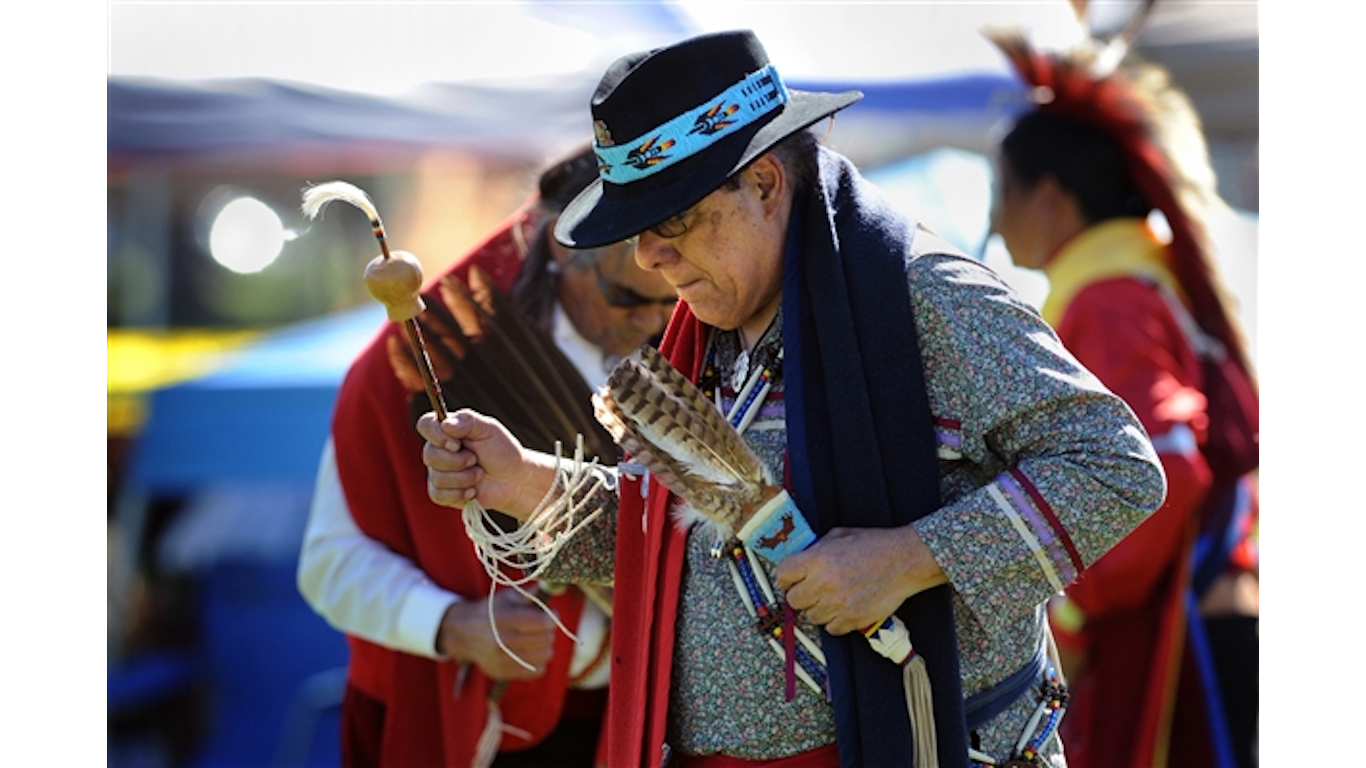
California
> Largest native population: Cherokee (pop: 123,805)
> Second largest native population: Mexican American Indian (pop: 75,172)
> State residents who self-identify as American Indian: 1.4% — 20th highest (total: 558,149)
> Median household income: Native pop: $53,019; State: $71,228
> Poverty rate: Native pop: 20.4%; State: 14.3%
> State population: 39,148,760 — the largest
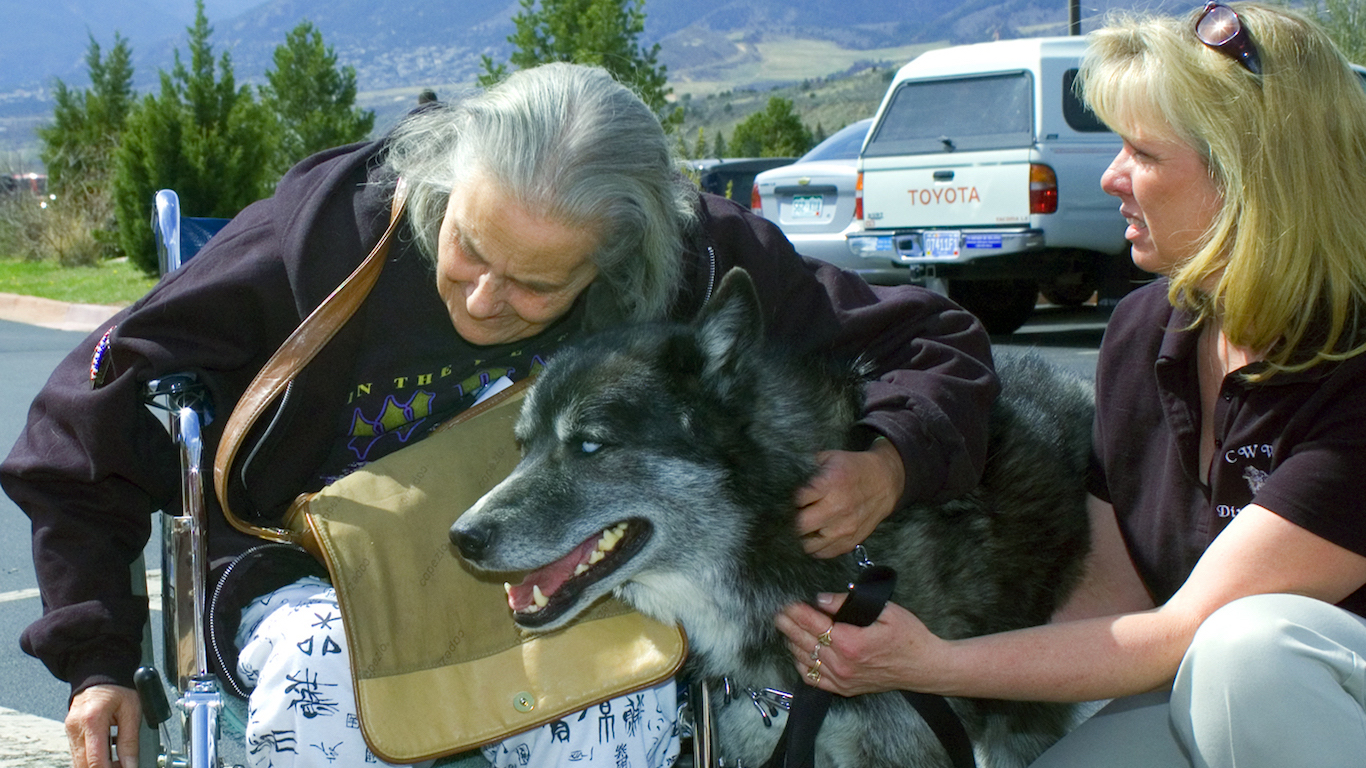
Colorado
> Largest native population: Cherokee (pop: 21,283)
> Second largest native population: Navajo (pop: 12,642)
> State residents who self-identify as American Indian: 1.7% — 15th highest (total: 92,388)
> Median household income: Native pop: $46,082; State: $68,811
> Poverty rate: Native pop: 20.3%; State: 10.9%
> State population: 5,531,141 — 21st largest
[in-text-ad]
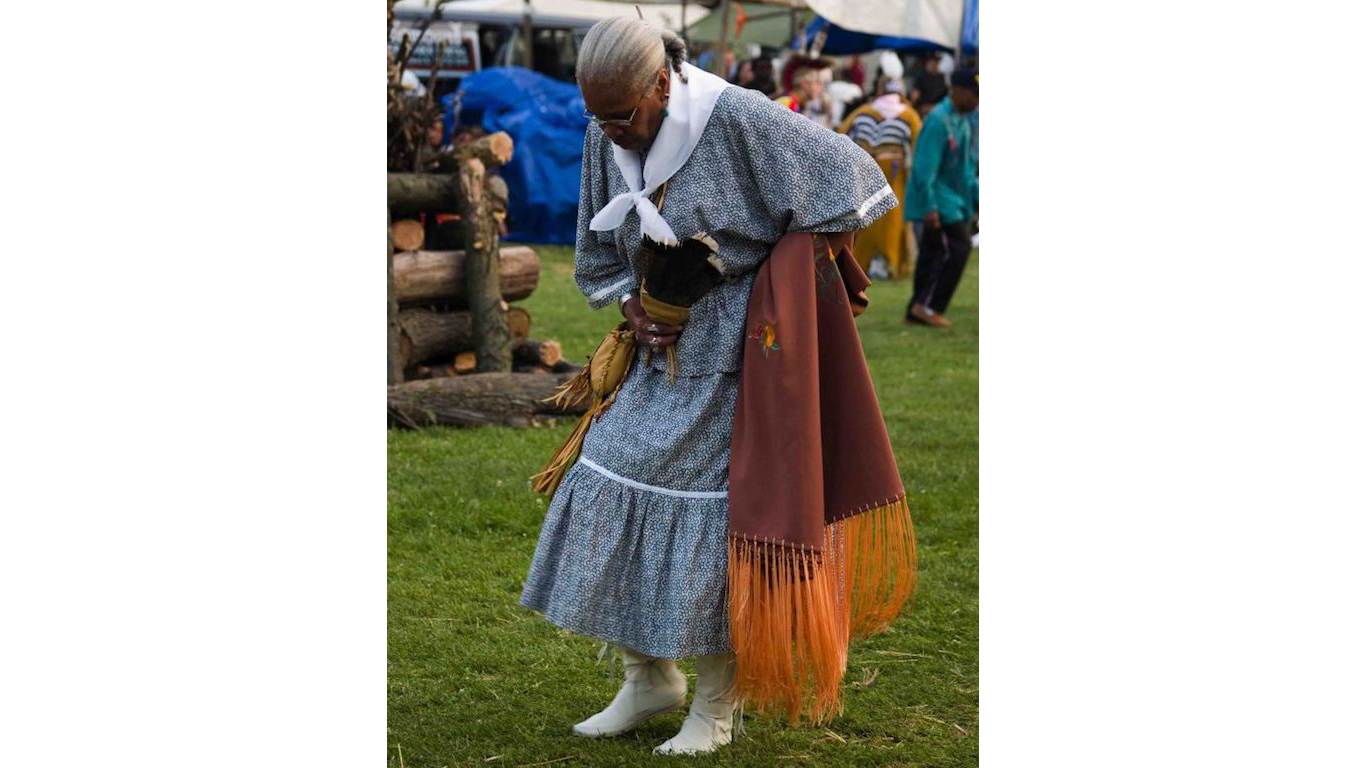
Connecticut
> Largest native population: Cherokee (pop: 4,748)
> Second largest native population: South American Indian (pop: 3,742)
> State residents who self-identify as American Indian: 0.7% — 13th lowest (total: 24,200)
> Median household income: Native pop: $41,094; State: $76,106
> Poverty rate: Native pop: 17.0%; State: 10.0%
> State population: 3,581,504 — 22nd smallest
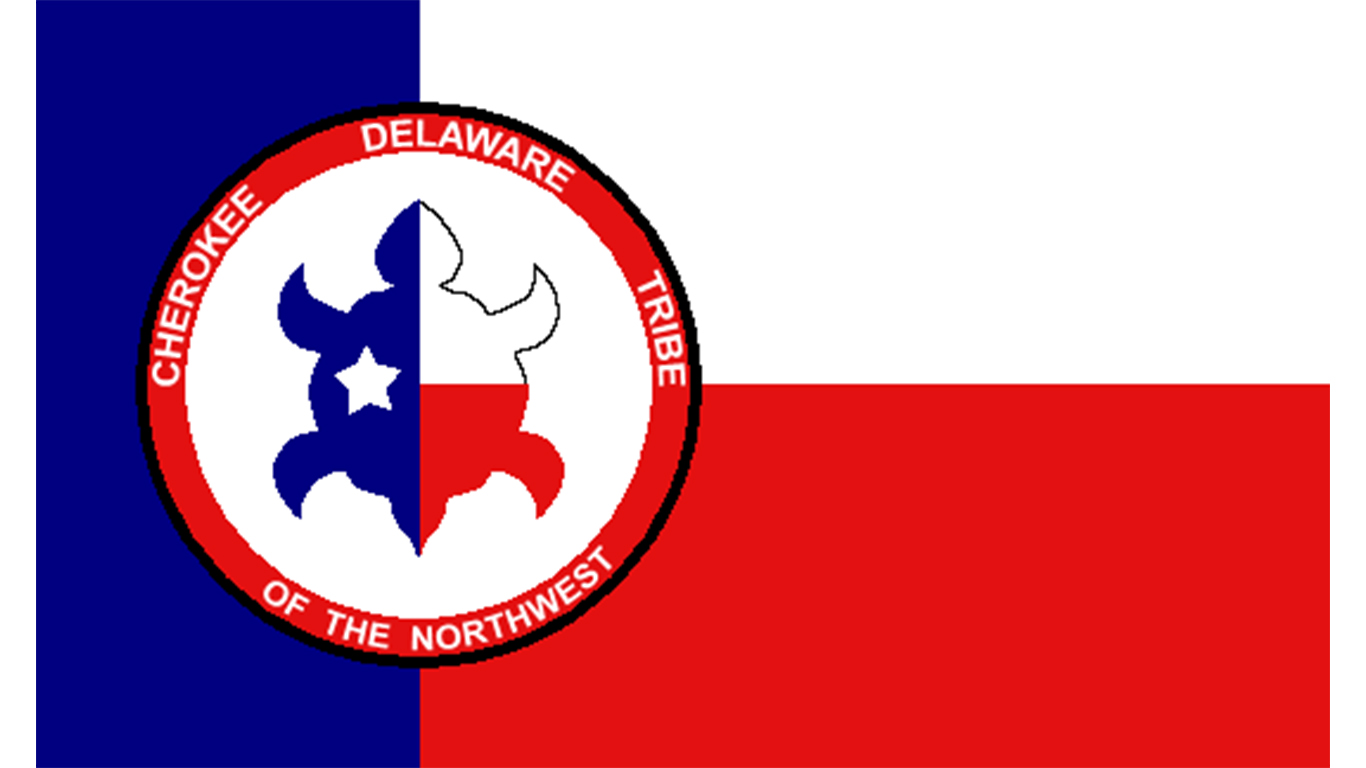
Delaware
> Largest native population: Cherokee (pop: 2,294)
> Second largest native population: South American Indian (pop: 548)
> State residents who self-identify as American Indian: 0.7% — 16th lowest (total: 6,802)
> Median household income: Native pop: $45,227; State: $65,627
> Poverty rate: Native pop: 22.6%; State: 11.9%
> State population: 949,495 — 6th smallest
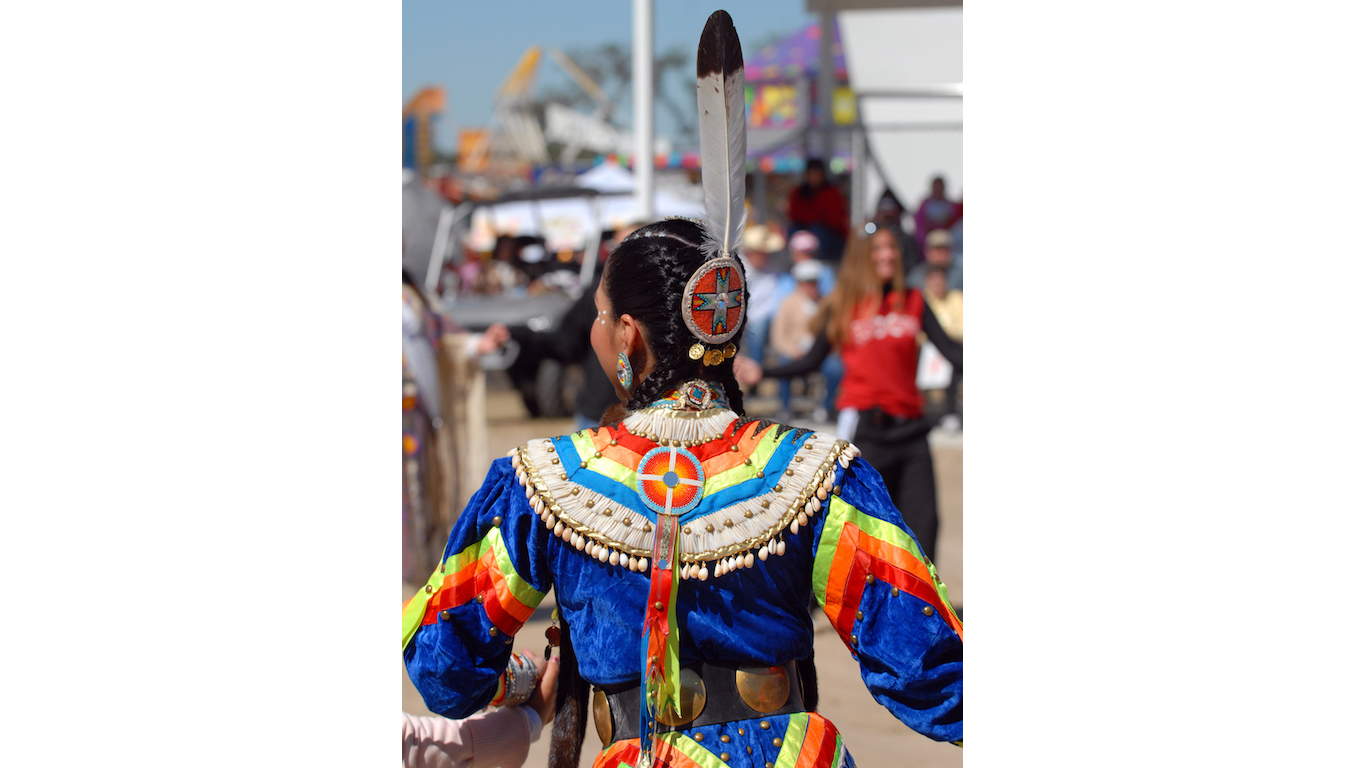
Florida
> Largest native population: Cherokee (pop: 44,925)
> Second largest native population: South American Indian (pop: 10,052)
> State residents who self-identify as American Indian: 0.6% — 8th lowest (total: 127,032)
> Median household income: Native pop: $45,307; State: $53,267
> Poverty rate: Native pop: 18.1%; State: 14.8%
> State population: 20,598,139 — 3rd largest
[in-text-ad-2]
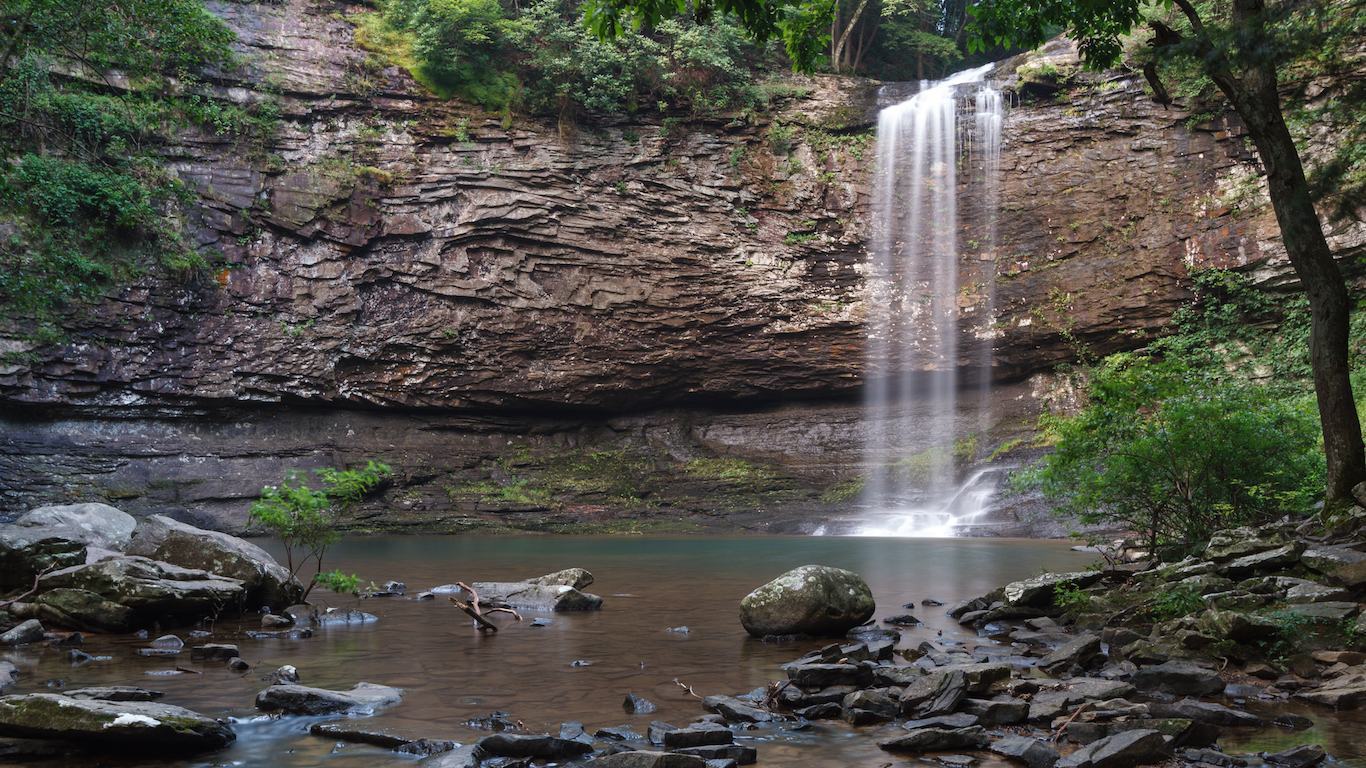
Georgia
> Largest native population: Cherokee (pop: 36,049)
> Second largest native population: Mexican American Indian (pop: 10,434)
> State residents who self-identify as American Indian: 0.7% — 17th lowest (total: 74,076)
> Median household income: Native pop: $38,167; State: $55,679
> Poverty rate: Native pop: 25.3%; State: 16.0%
> State population: 10,297,484 — 8th largest
Hawaii
> Largest native population: Cherokee (pop: 11,223)
> Second largest native population: Apache (pop: 2,238)
> State residents who self-identify as American Indian: 1.8% — 13th highest (total: 25,621)
> Median household income: Native pop: $47,298; State: $78,084
> Poverty rate: Native pop: 24.2%; State: 9.9%
> State population: 1,422,029 — 11th smallest
[in-text-ad]
Idaho
> Largest native population: Cherokee (pop: 5,471)
> Second largest native population: Sioux (pop: 1,893)
> State residents who self-identify as American Indian: 2.0% — 11th highest (total: 34,249)
> Median household income: Native pop: $40,898; State: $53,089
> Poverty rate: Native pop: 25.3%; State: 13.8%
> State population: 1,687,809 — 12th smallest
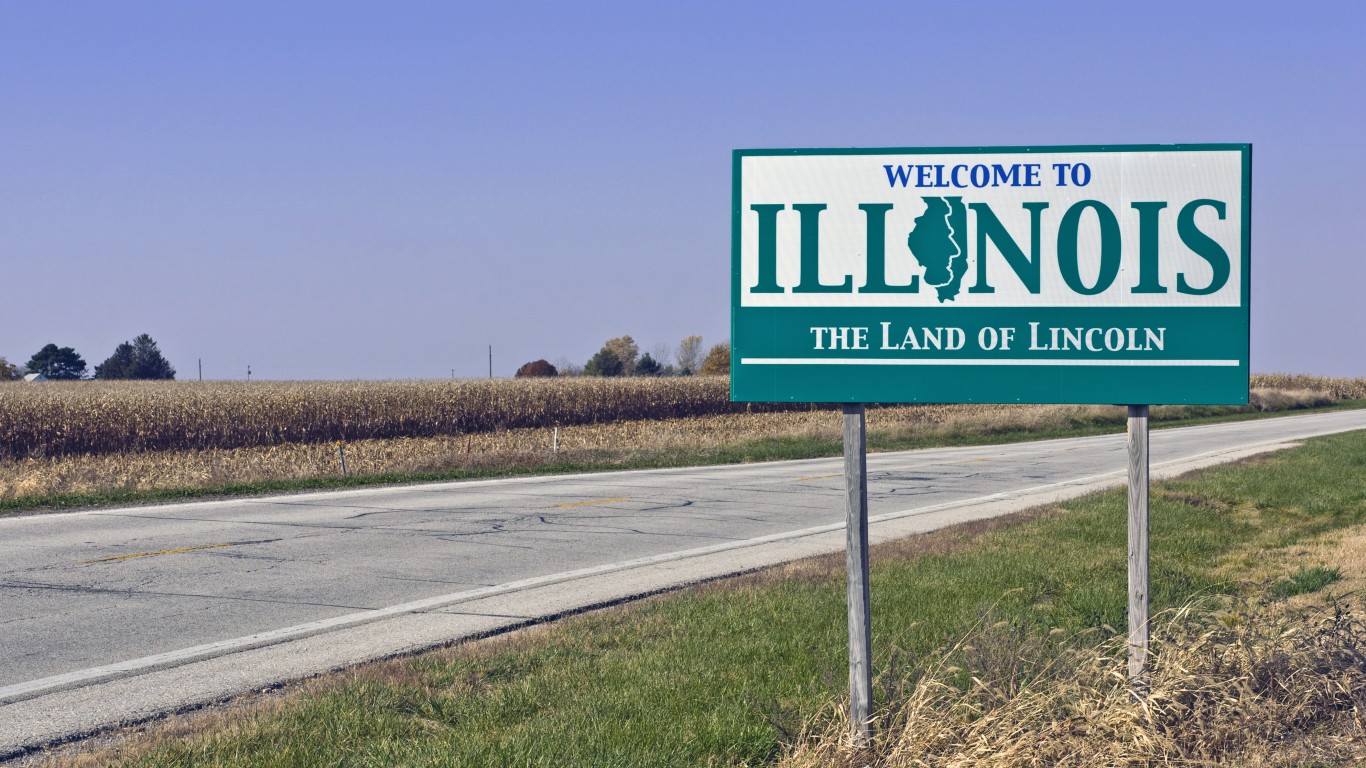
Illinois
> Largest native population: Cherokee (pop: 23,876)
> Second largest native population: Mexican American Indian (pop: 8,528)
> State residents who self-identify as American Indian: 0.5% — 3rd lowest (total: 64,967)
> Median household income: Native pop: $47,573; State: $63,575
> Poverty rate: Native pop: 16.3%; State: 13.1%
> State population: 12,821,497 — 5th largest
Indiana
> Largest native population: Cherokee (pop: 17,957)
> Second largest native population: Blackfeet (pop: 2,967)
> State residents who self-identify as American Indian: 0.6% — 6th lowest (total: 38,709)
> Median household income: Native pop: $41,801; State: $54,325
> Poverty rate: Native pop: 19.1%; State: 14.1%
> State population: 6,637,426 — 17th largest
[in-text-ad-2]
Iowa
> Largest native population: Cherokee (pop: 4,195)
> Second largest native population: Sioux (pop: 3,612)
> State residents who self-identify as American Indian: 0.7% — 10th lowest (total: 20,399)
> Median household income: Native pop: $36,941; State: $58,580
> Poverty rate: Native pop: 24.6%; State: 11.7%
> State population: 3,132,499 — 21st smallest
Kansas
> Largest native population: Cherokee (pop: 19,551)
> Second largest native population: Potawatomi (pop: 4,706)
> State residents who self-identify as American Indian: 1.9% — 12th highest (total: 55,059)
> Median household income: Native pop: $43,943; State: $57,422
> Poverty rate: Native pop: 20.2%; State: 12.4%
> State population: 2,908,776 — 16th smallest
[in-text-ad]
Kentucky
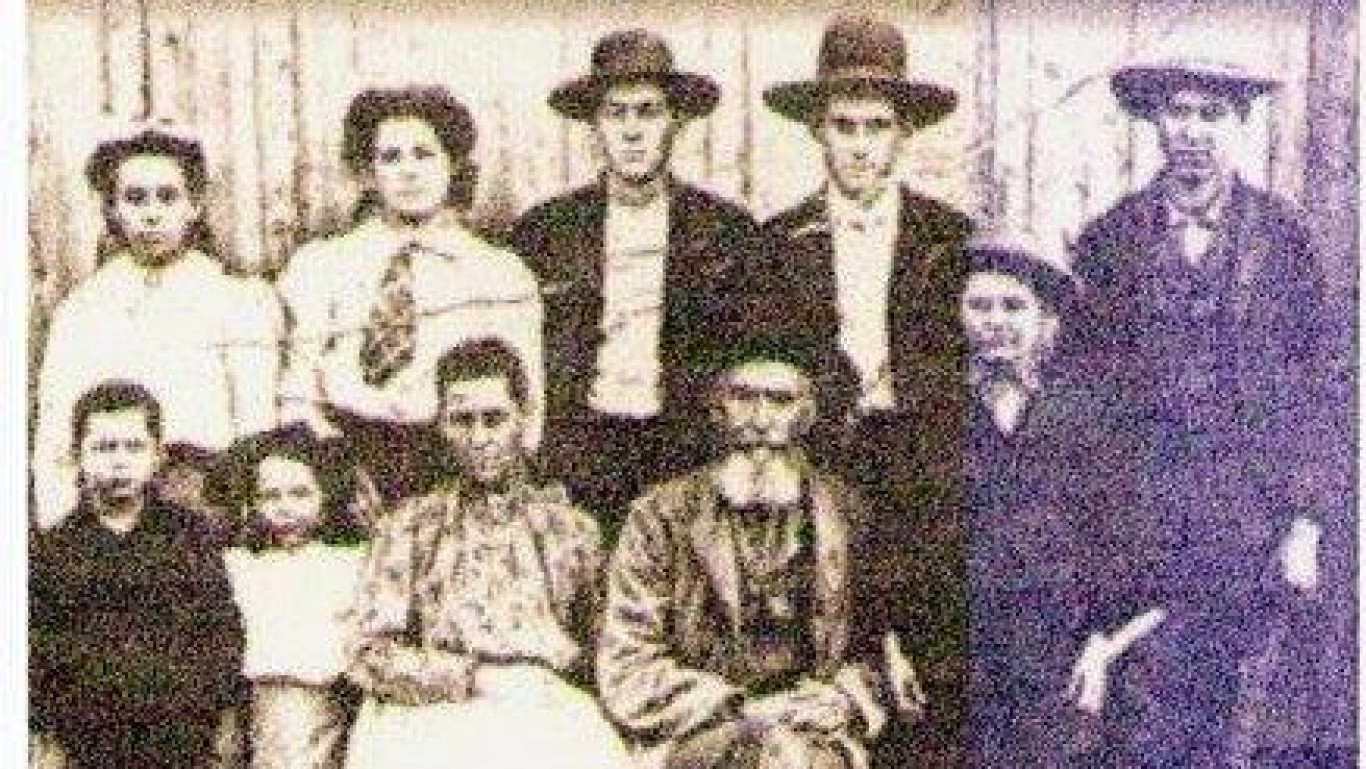
> Largest native population: Cherokee (pop: 14,738)
> Second largest native population: Blackfeet (pop: 1,558)
> State residents who self-identify as American Indian: 0.6% — 7th lowest (total: 25,938)
> Median household income: Native pop: $33,200; State: $48,392
> Poverty rate: Native pop: 27.9%; State: 17.9%
> State population: 4,440,204 — 25th smallest
Louisiana
> Largest native population: Houma (pop: 12,903)
> Second largest native population: Cherokee (pop: 10,339)
> State residents who self-identify as American Indian: 1.0% — 22nd lowest (total: 45,564)
> Median household income: Native pop: $41,664; State: $47,942
> Poverty rate: Native pop: 24.1%; State: 19.4%
> State population: 4,663,616 — 25th largest
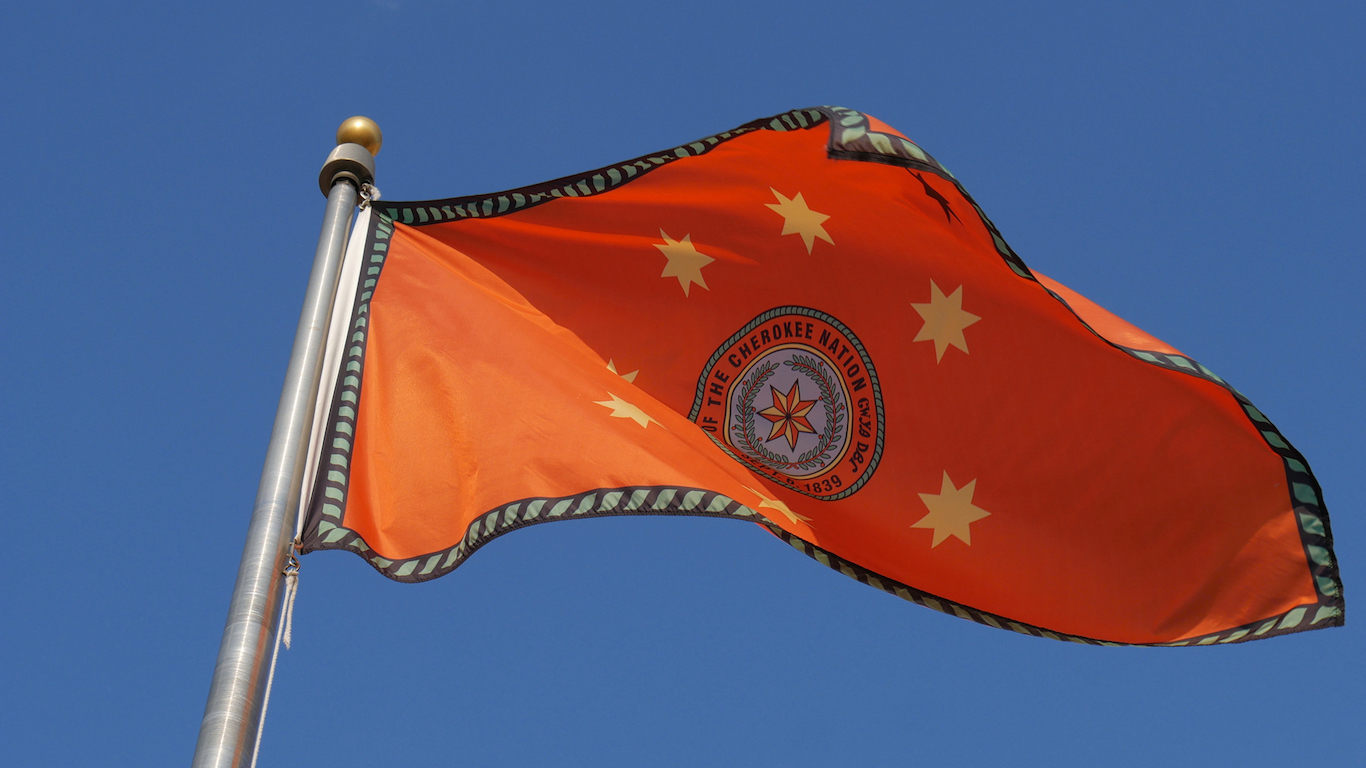
Maine
> Largest native population: Cherokee (pop: 1,434)
> Second largest native population: Blackfeet (pop: 599)
> State residents who self-identify as American Indian: 1.2% — 23rd highest (total: 15,951)
> Median household income: Native pop: $32,670; State: $55,425
> Poverty rate: Native pop: 34.4%; State: 12.5%
> State population: 1,332,813 — 9th smallest
[in-text-ad-2]
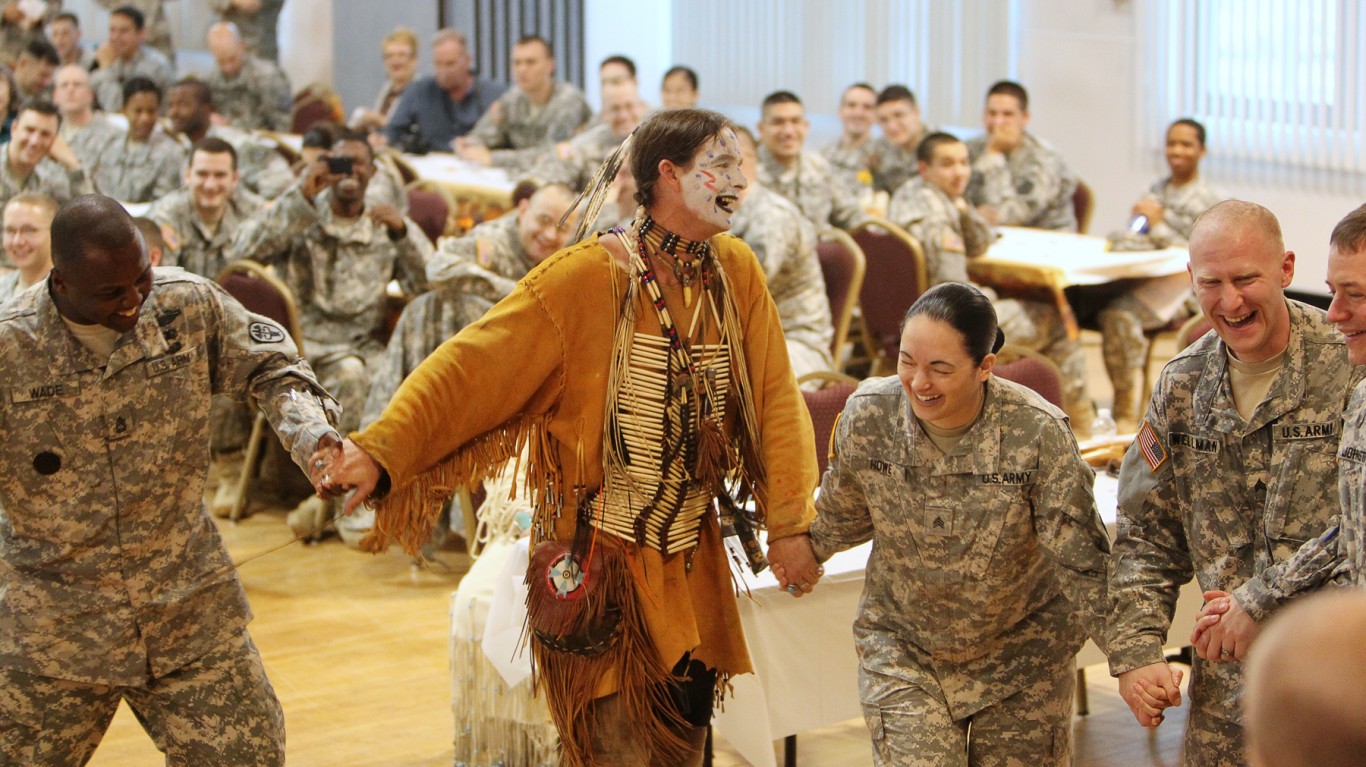
Maryland
> Largest native population: Cherokee (pop: 14,098)
> Second largest native population: Blackfeet (pop: 4,169)
> State residents who self-identify as American Indian: 0.7% — 15th lowest (total: 42,939)
> Median household income: Native pop: $69,955; State: $81,868
> Poverty rate: Native pop: 13.6%; State: 9.4%
> State population: 6,003,435 — 19th largest
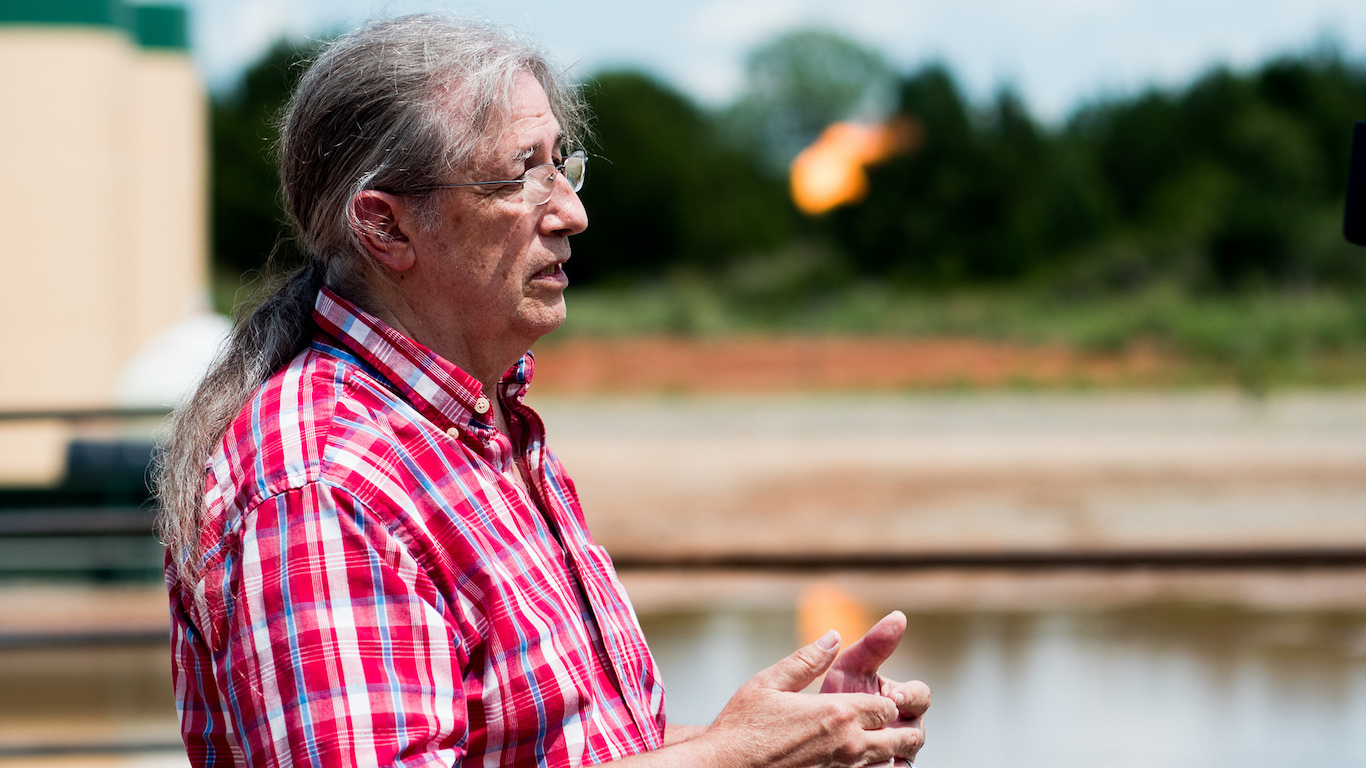
Massachusetts
> Largest native population: Cherokee (pop: 6,987)
> Second largest native population: South American Indian (pop: 3,400)
> State residents who self-identify as American Indian: 0.5% — 2nd lowest (total: 33,514)
> Median household income: Native pop: $42,686; State: $77,378
> Poverty rate: Native pop: 22.2%; State: 10.8%
> State population: 6,830,193 — 15th largest
[in-text-ad]
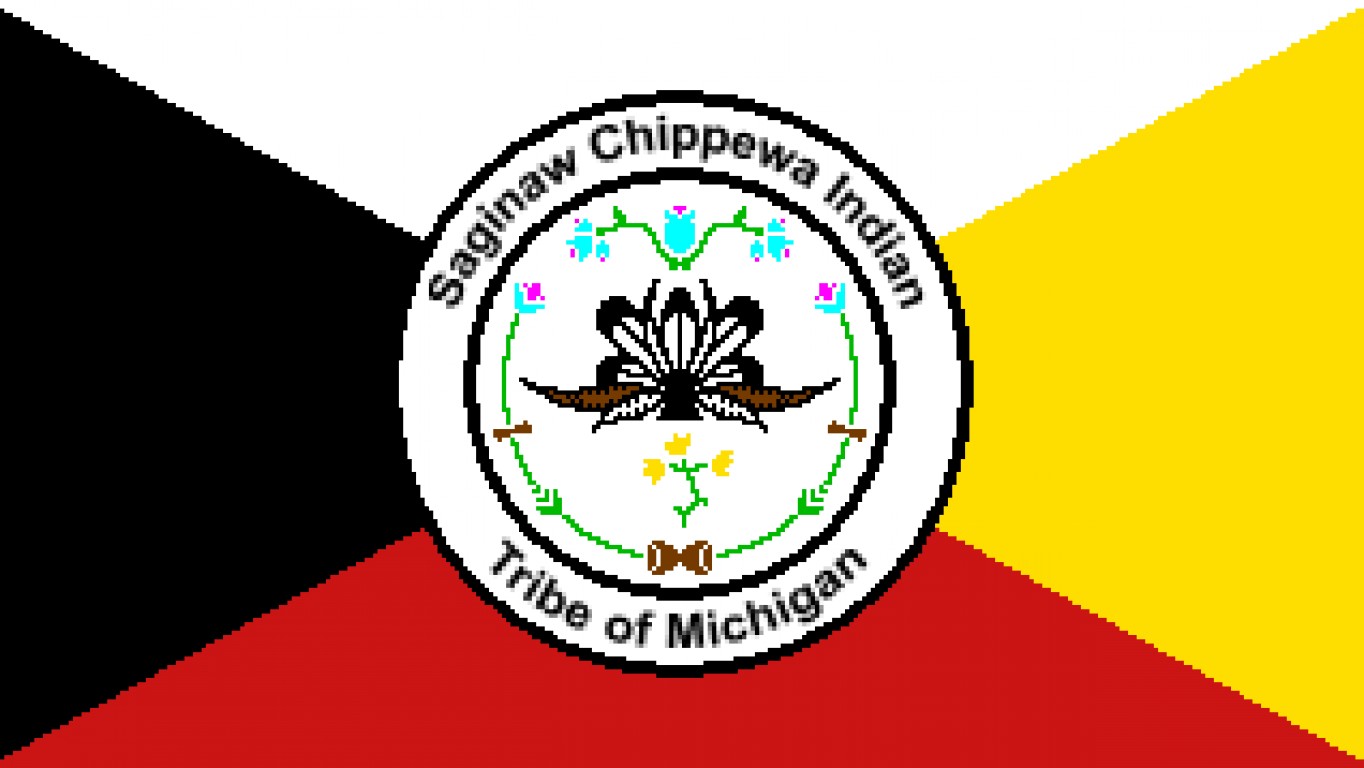
Michigan
> Largest native population: Chippewa (pop: 43,716)
> Second largest native population: Cherokee (pop: 25,319)
> State residents who self-identify as American Indian: 1.2% — 24th highest (total: 116,773)
> Median household income: Native pop: $42,336; State: $54,938
> Poverty rate: Native pop: 22.2%; State: 15.0%
> State population: 9,957,488 — 10th largest
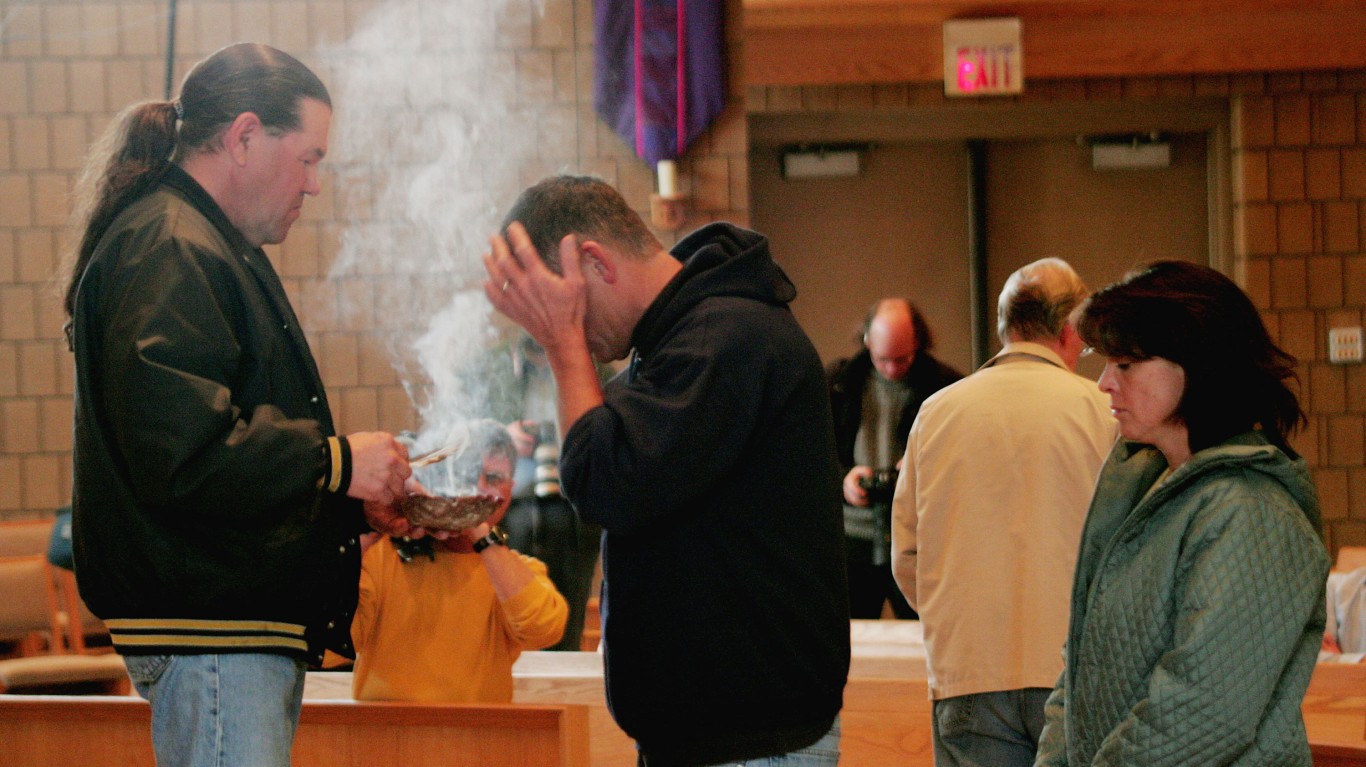
Minnesota
> Largest native population: Chippewa (pop: 55,048)
> Second largest native population: Sioux (pop: 11,120)
> State residents who self-identify as American Indian: 1.5% — 19th highest (total: 83,130)
> Median household income: Native pop: $36,429; State: $68,411
> Poverty rate: Native pop: 31.3%; State: 10.1%
> State population: 5,527,358 — 22nd largest
Mississippi
> Largest native population: Choctaw (pop: 11,904)
> Second largest native population: Cherokee (pop: 4,194)
> State residents who self-identify as American Indian: 0.7% — 12th lowest (total: 20,185)
> Median household income: Native pop: $33,297; State: $43,567
> Poverty rate: Native pop: 31.3%; State: 20.8%
> State population: 2,988,762 — 18th smallest
[in-text-ad-2]
Missouri
> Largest native population: Cherokee (pop: 34,375)
> Second largest native population: Choctaw (pop: 3,730)
> State residents who self-identify as American Indian: 1.1% — 25th highest (total: 65,764)
> Median household income: Native pop: $40,824; State: $53,560
> Poverty rate: Native pop: 20.3%; State: 14.2%
> State population: 6,090,062 — 18th largest
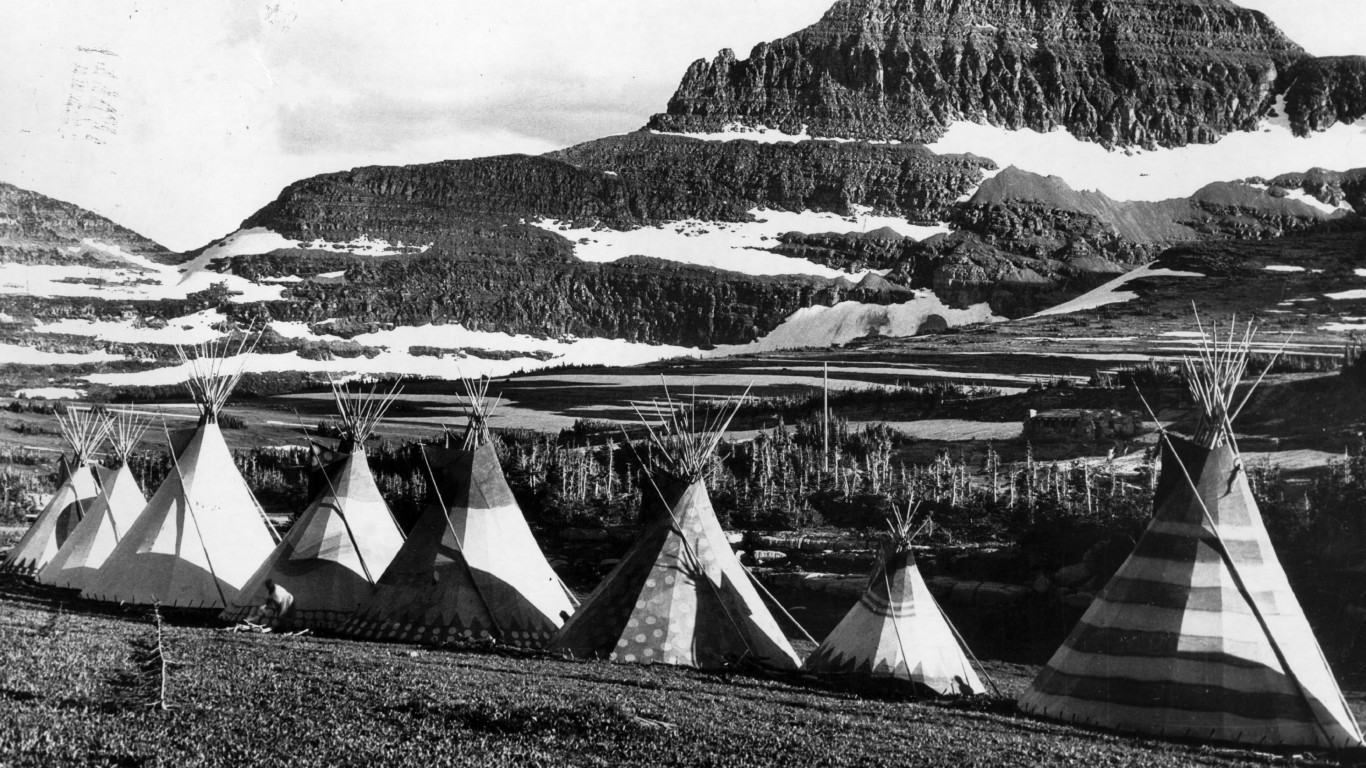
Montana
> Largest native population: Blackfeet (pop: 14,940)
> Second largest native population: Crow (pop: 10,434)
> State residents who self-identify as American Indian: 7.6% — 4th highest (total: 79,225)
> Median household income: Native pop: $32,072; State: $52,559
> Poverty rate: Native pop: 34.1%; State: 13.7%
> State population: 1,041,732 — 7th smallest
[in-text-ad]
Nebraska
> Largest native population: Sioux (pop: 7,354)
> Second largest native population: Cherokee (pop: 3,775)
> State residents who self-identify as American Indian: 1.3% — 22nd highest (total: 25,698)
> Median household income: Native pop: $37,398; State: $59,116
> Poverty rate: Native pop: 31.0%; State: 11.6%
> State population: 1,904,760 — 14th smallest
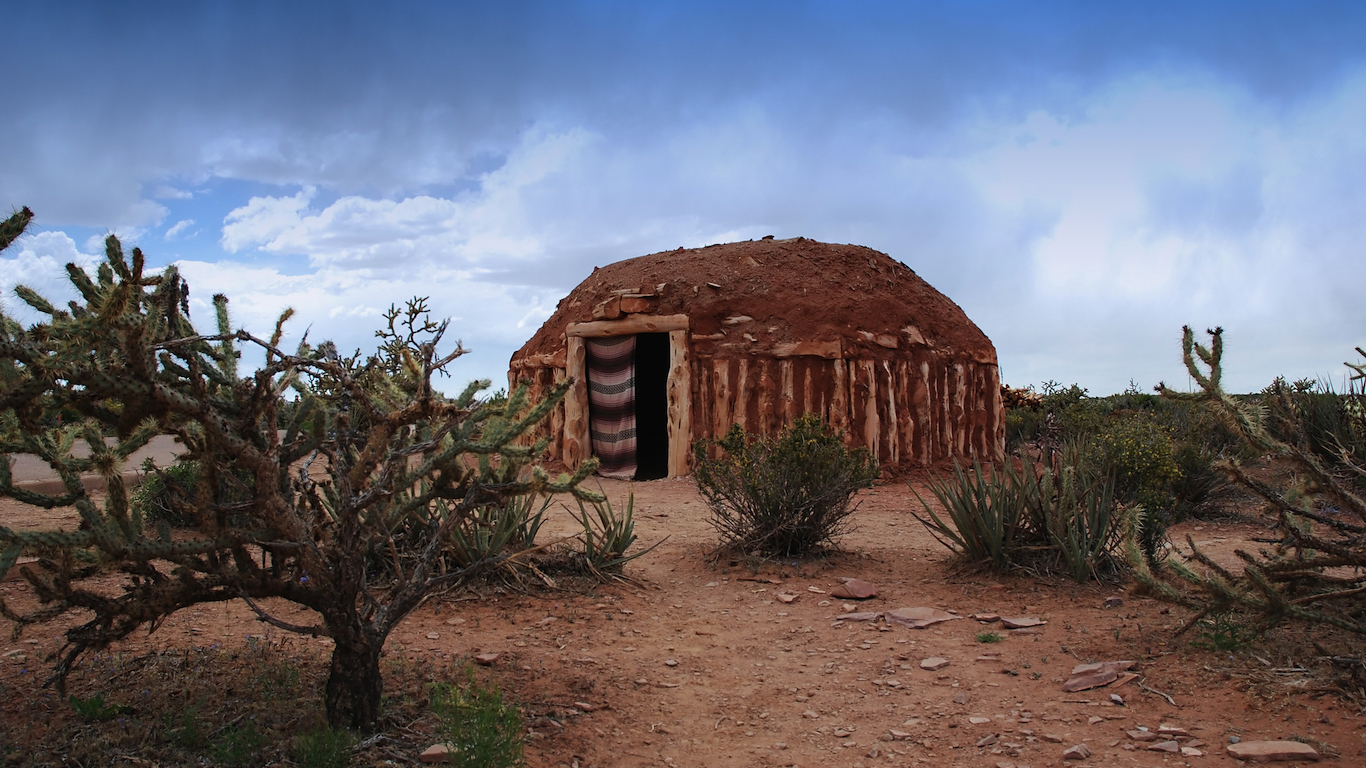
Nevada
> Largest native population: Cherokee (pop: 8,827)
> Second largest native population: Paiute (pop: 7,869)
> State residents who self-identify as American Indian: 1.8% — 14th highest (total: 51,270)
> Median household income: Native pop: $41,478; State: $57,598
> Poverty rate: Native pop: 26.5%; State: 13.7%
> State population: 2,922,849 — 17th smallest
New Hampshire
> Largest native population: Cherokee (pop: 2,413)
> Second largest native population: Blackfeet (pop: 889)
> State residents who self-identify as American Indian: 0.6% — 9th lowest (total: 8,339)
> Median household income: Native pop: $47,902; State: $74,057
> Poverty rate: Native pop: 13.1%; State: 7.9%
> State population: 1,343,622 — 10th smallest
[in-text-ad-2]
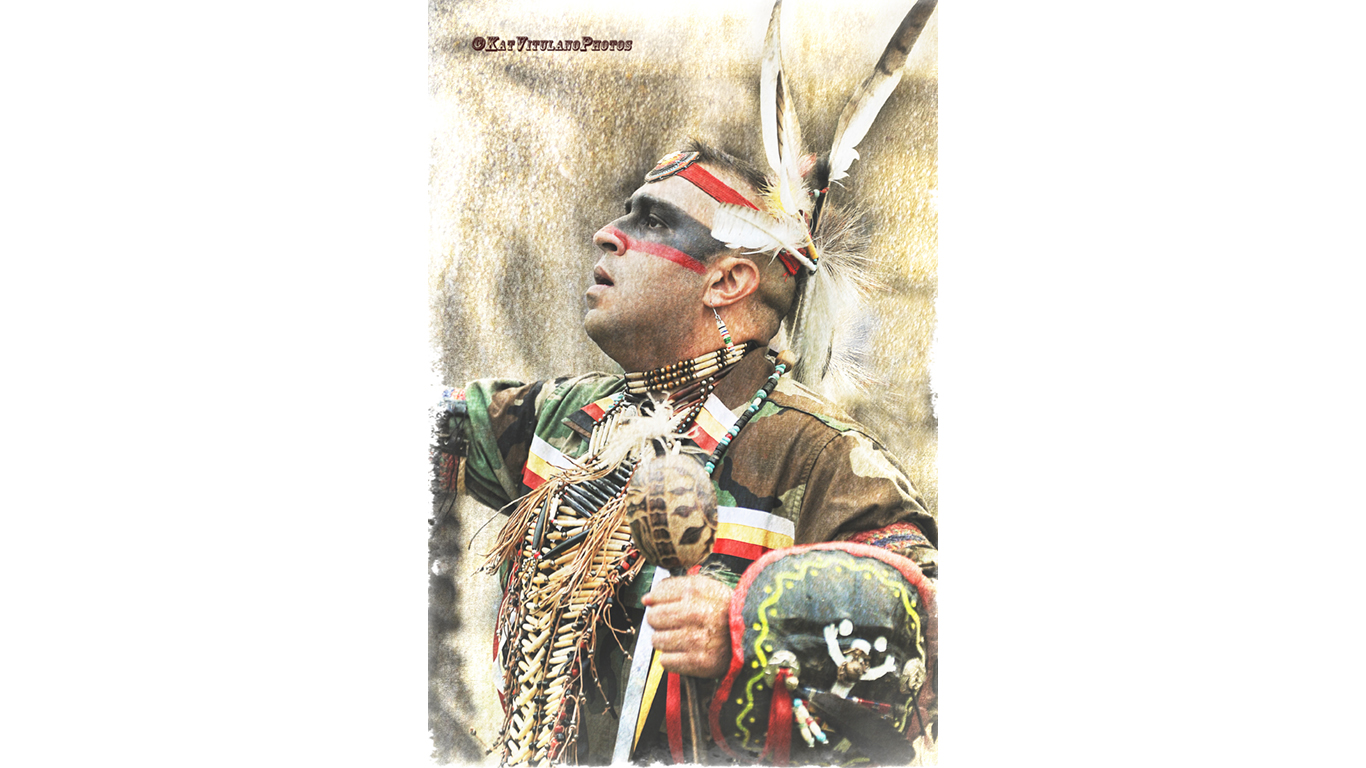
New Jersey
> Largest native population: Cherokee (pop: 11,660)
> Second largest native population: South American Indian (pop: 5,623)
> State residents who self-identify as American Indian: 0.5% — the lowest (total: 41,791)
> Median household income: Native pop: $53,507; State: $79,363
> Poverty rate: Native pop: 19.3%; State: 10.4%
> State population: 8,881,845 — 11th largest
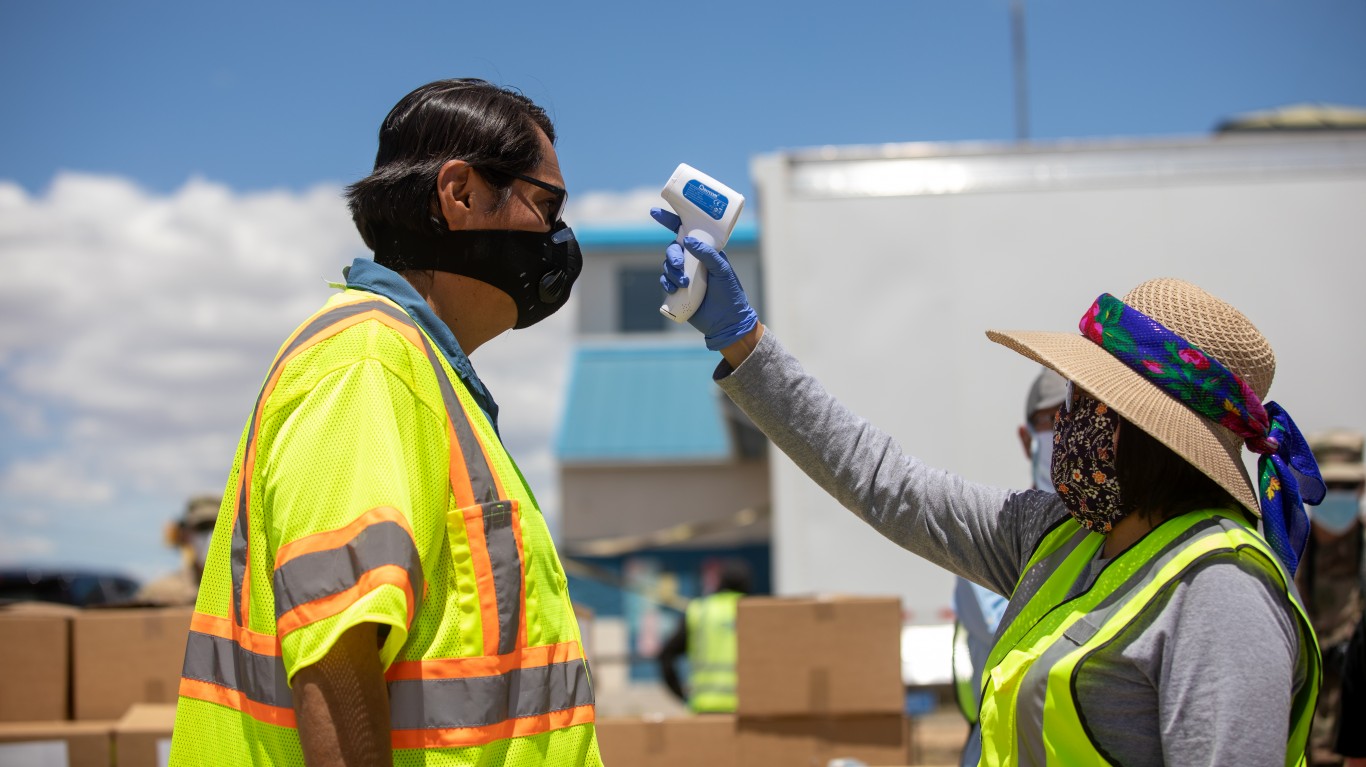
New Mexico
> Largest native population: Navajo (pop: 132,241)
> Second largest native population: Pueblo (pop: 52,369)
> State residents who self-identify as American Indian: 10.3% — 2nd highest (total: 216,287)
> Median household income: Native pop: $33,552; State: $48,059
> Poverty rate: Native pop: 33.0%; State: 20.0%
> State population: 2,092,434 — 15th smallest
[in-text-ad]
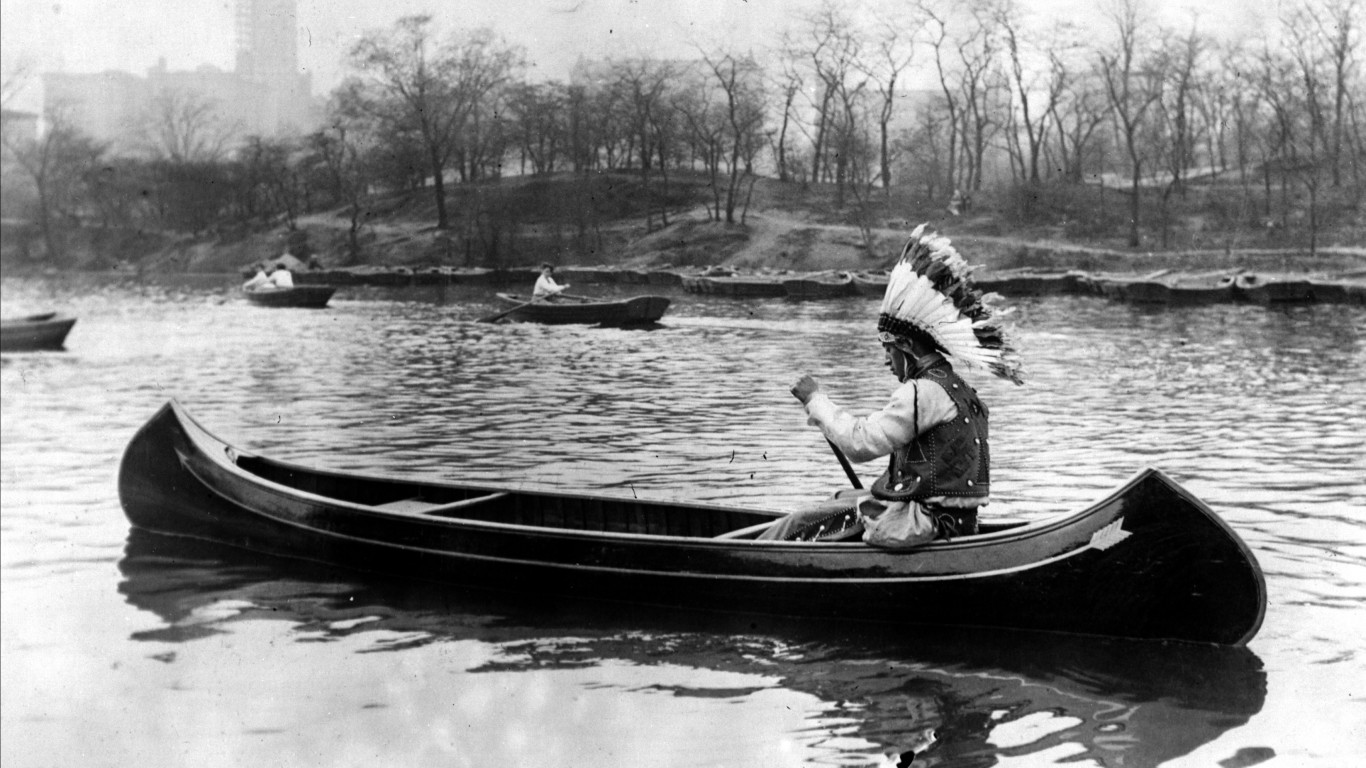
New York
> Largest native population: Iroquois (pop: 36,844)
> Second largest native population: Cherokee (pop: 24,840)
> State residents who self-identify as American Indian: 0.7% — 14th lowest (total: 138,098)
> Median household income: Native pop: $41,267; State: $65,323
> Poverty rate: Native pop: 23.2%; State: 14.6%
> State population: 19,618,453 — 4th largest
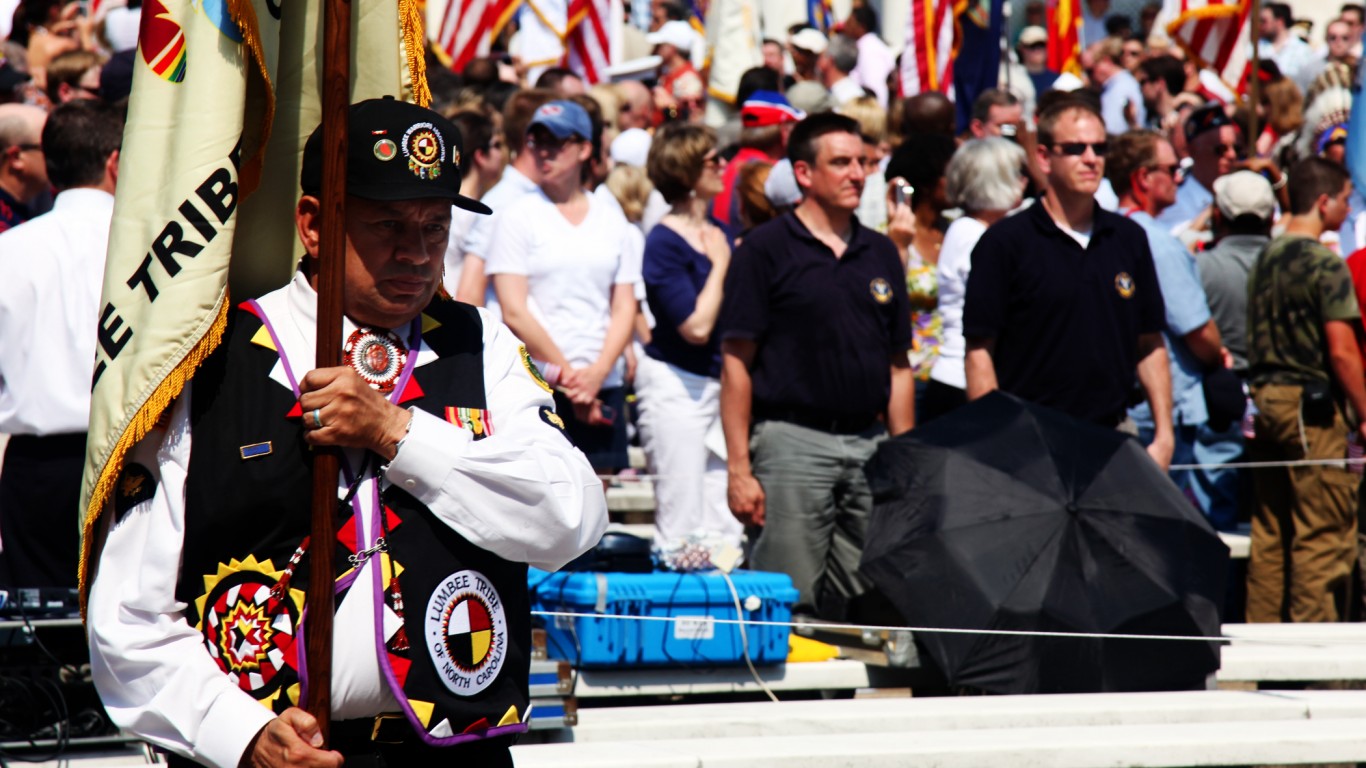
North Carolina
> Largest native population: Lumbee (pop: 75,244)
> Second largest native population: Cherokee (pop: 47,736)
> State residents who self-identify as American Indian: 1.7% — 16th highest (total: 168,502)
> Median household income: Native pop: $38,206; State: $52,413
> Poverty rate: Native pop: 25.1%; State: 15.4%
> State population: 10,155,624 — 9th largest
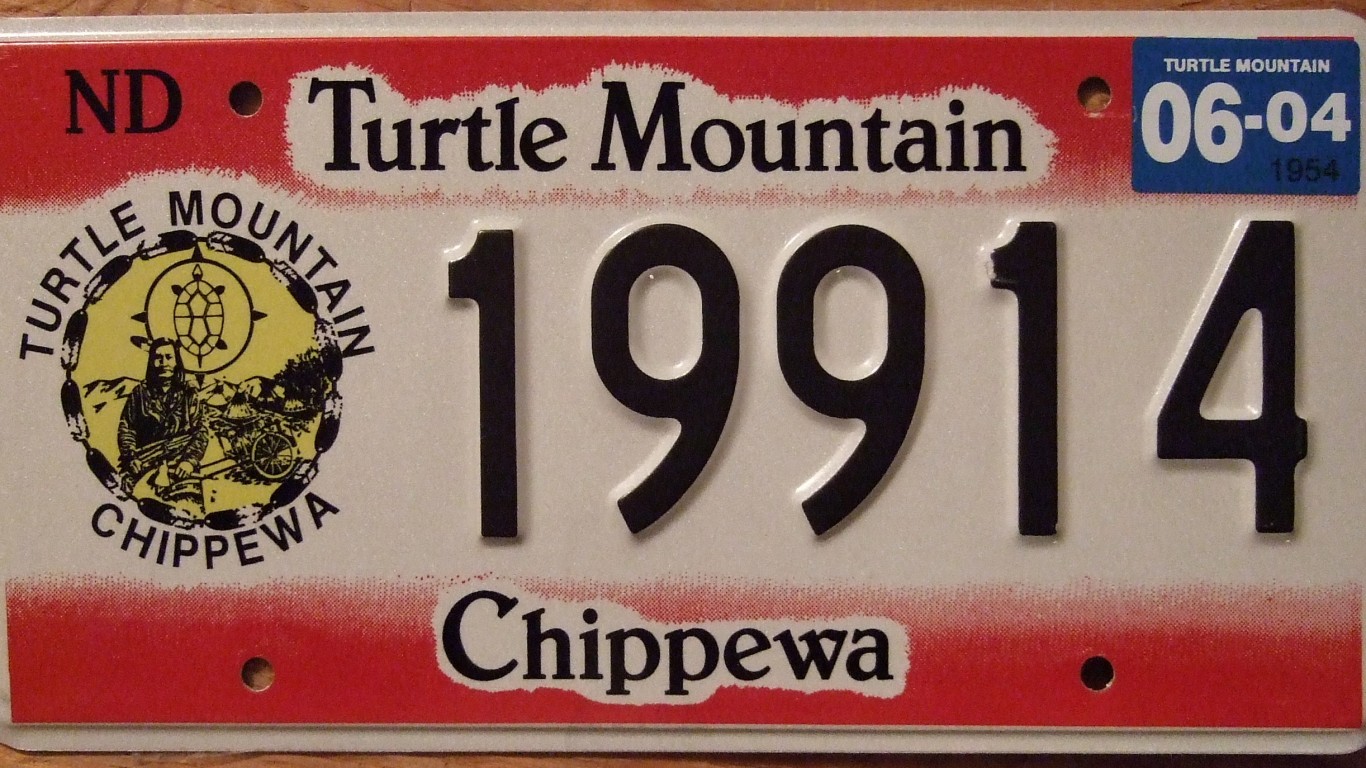
North Dakota
> Largest native population: Chippewa (pop: 19,641)
> Second largest native population: Sioux (pop: 13,113)
> State residents who self-identify as American Indian: 5.6% — 5th highest (total: 42,113)
> Median household income: Native pop: $36,710; State: $63,473
> Poverty rate: Native pop: 35.1%; State: 10.9%
> State population: 752,201 — 4th smallest
[in-text-ad-2]

Ohio
> Largest native population: Cherokee (pop: 39,199)
> Second largest native population: Blackfeet (pop: 7,411)
> State residents who self-identify as American Indian: 0.7% — 11th lowest (total: 76,498)
> Median household income: Native pop: $33,682; State: $54,533
> Poverty rate: Native pop: 26.3%; State: 14.5%
> State population: 11,641,879 — 7th largest
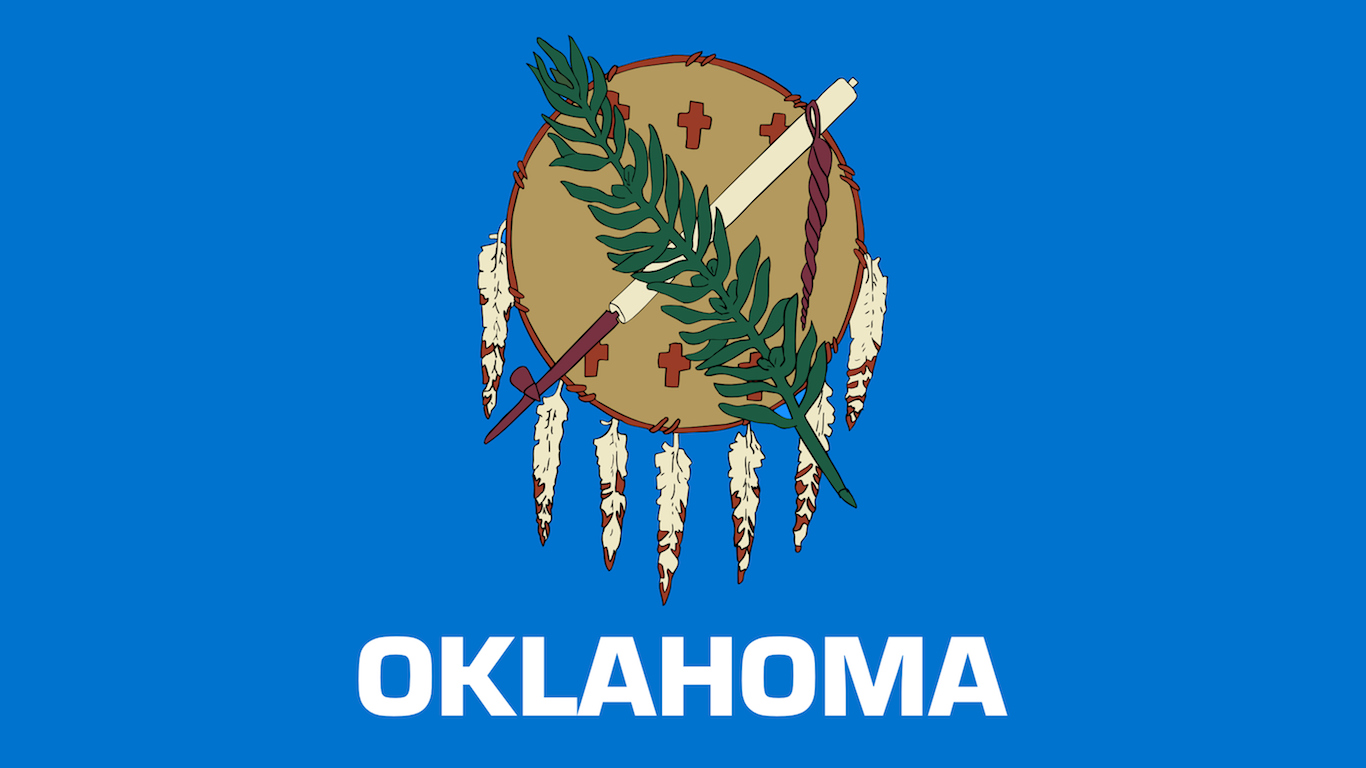
Oklahoma
> Largest native population: Cherokee (pop: 224,881)
> Second largest native population: Choctaw (pop: 90,973)
> State residents who self-identify as American Indian: 13.2% — the highest (total: 515,459)
> Median household income: Native pop: $42,820; State: $51,424
> Poverty rate: Native pop: 21.1%; State: 16.0%
> State population: 3,918,137 — 23rd smallest
[in-text-ad]
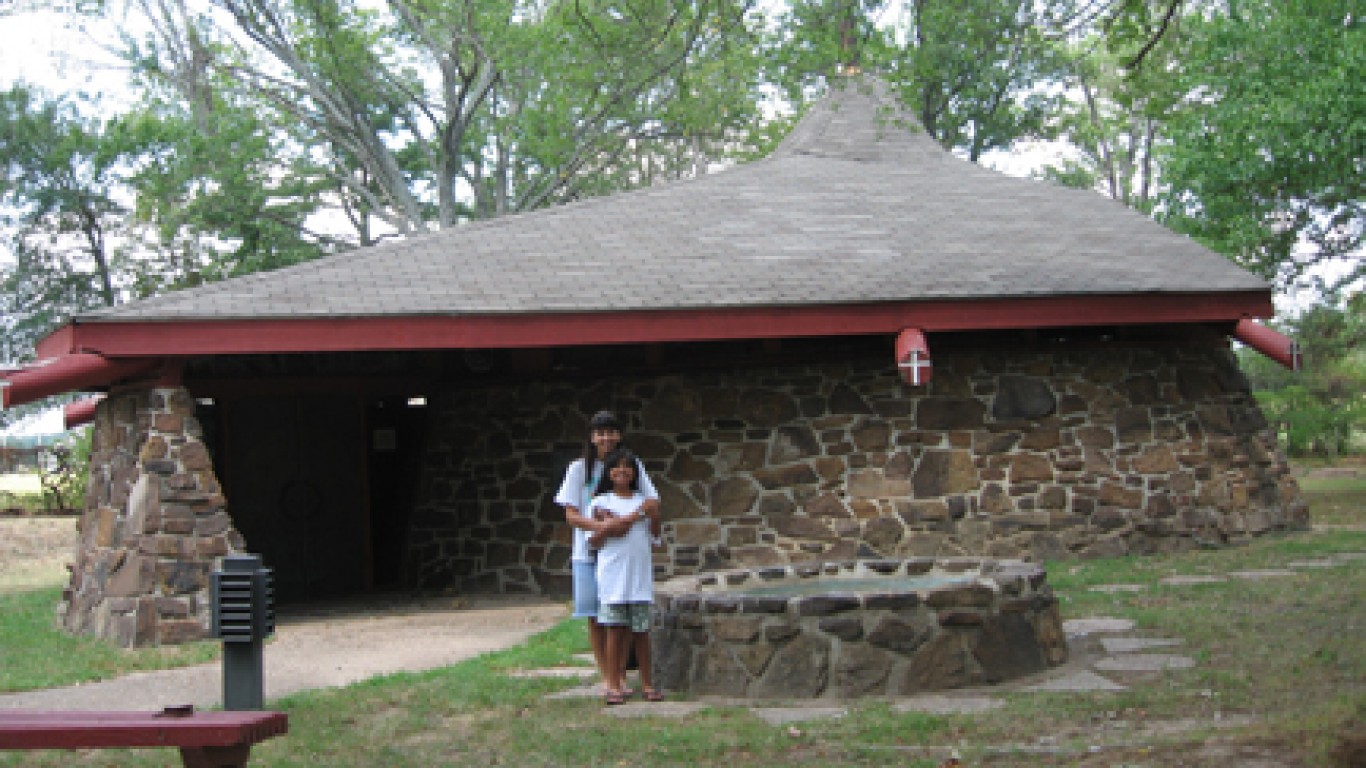
Oregon
> Largest native population: Cherokee (pop: 21,312)
> Second largest native population: Mexican American Indian (pop: 10,326)
> State residents who self-identify as American Indian: 2.5% — 8th highest (total: 100,200)
> Median household income: Native pop: $42,047; State: $59,393
> Poverty rate: Native pop: 24.4%; State: 14.1%
> State population: 4,081,943 — 24th smallest
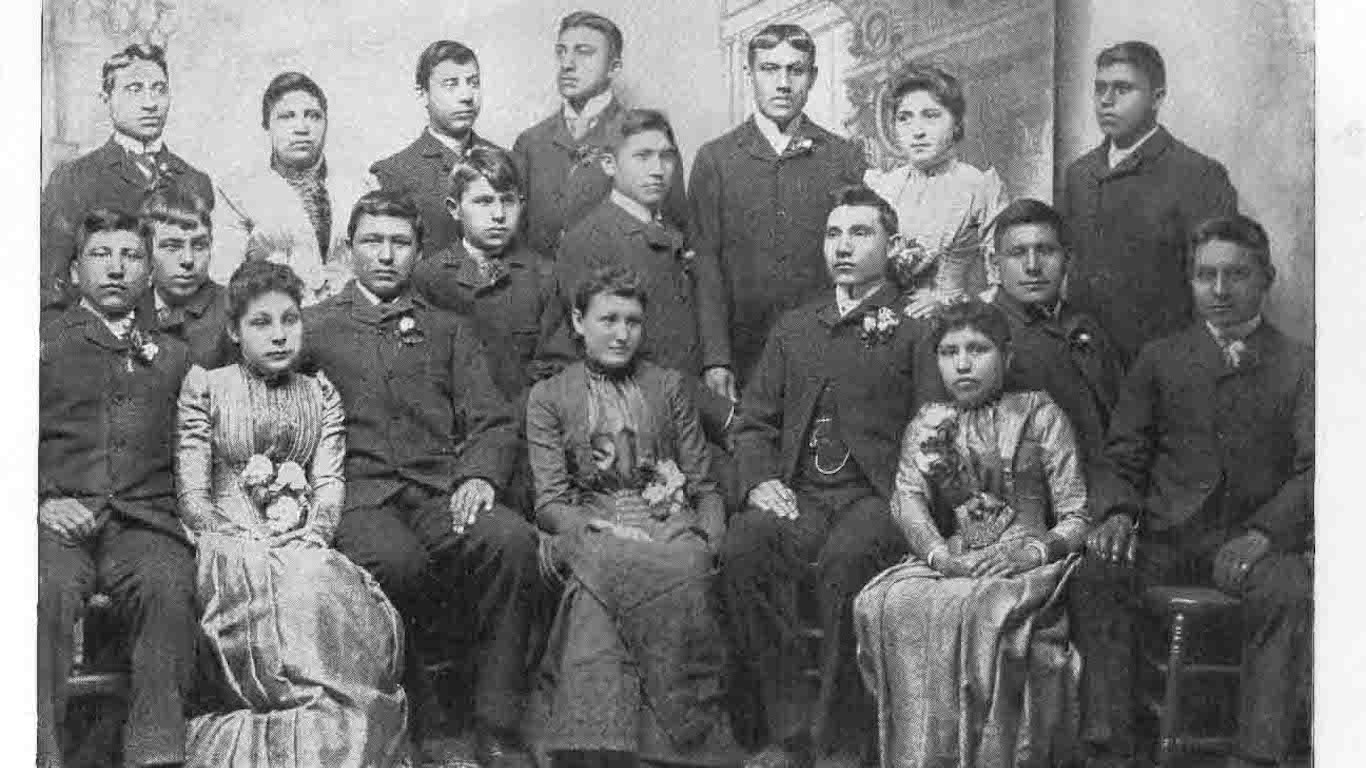
Pennsylvania
> Largest native population: Cherokee (pop: 22,347)
> Second largest native population: South American Indian (pop: 11,161)
> State residents who self-identify as American Indian: 0.5% — 5th lowest (total: 69,511)
> Median household income: Native pop: $37,702; State: $59,445
> Poverty rate: Native pop: 26.6%; State: 12.8%
> State population: 12,791,181 — 6th largest
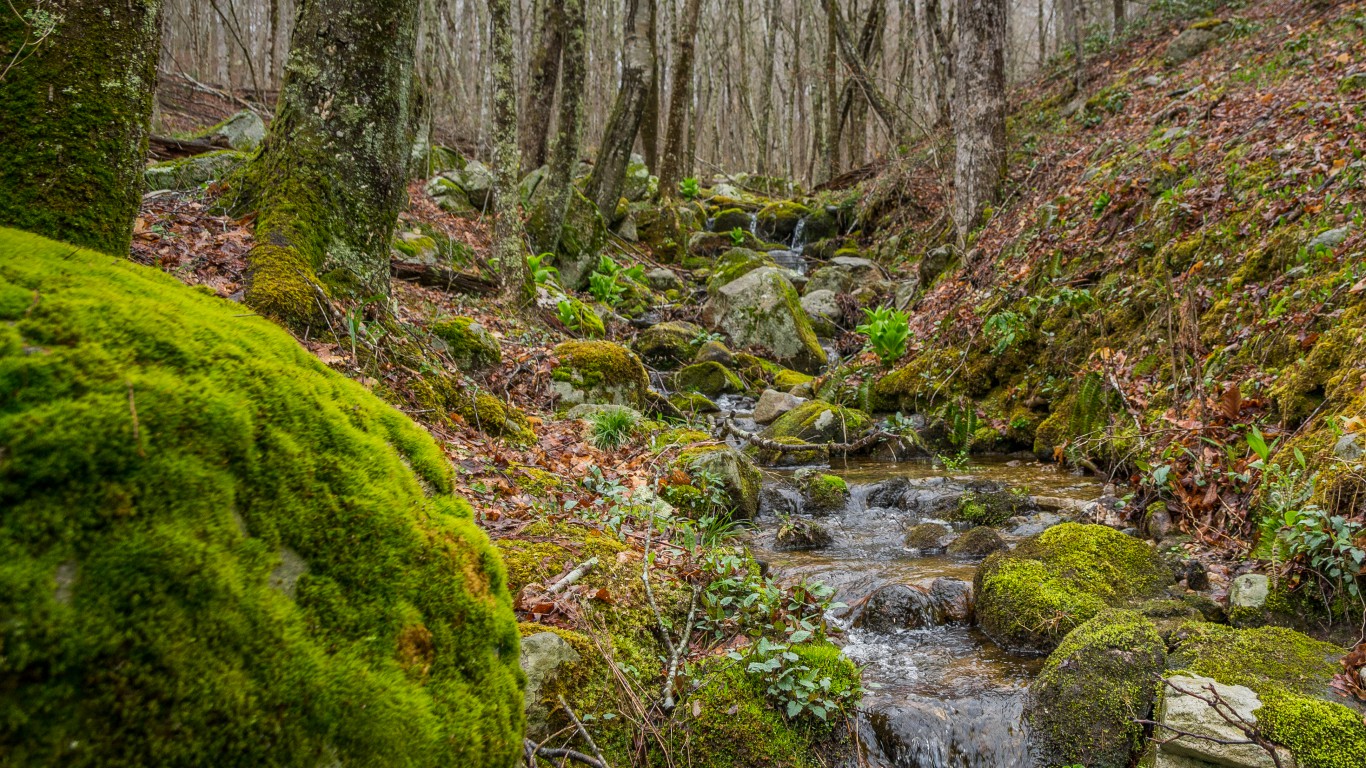
Rhode Island
> Largest native population: Cherokee (pop: 1,340)
> Second largest native population: South American Indian (pop: 1,219)
> State residents who self-identify as American Indian: 1.0% — 23rd lowest (total: 10,367)
> Median household income: Native pop: $34,414; State: $63,296
> Poverty rate: Native pop: 35.2%; State: 13.1%
> State population: 1,056,611 — 8th smallest
[in-text-ad-2]
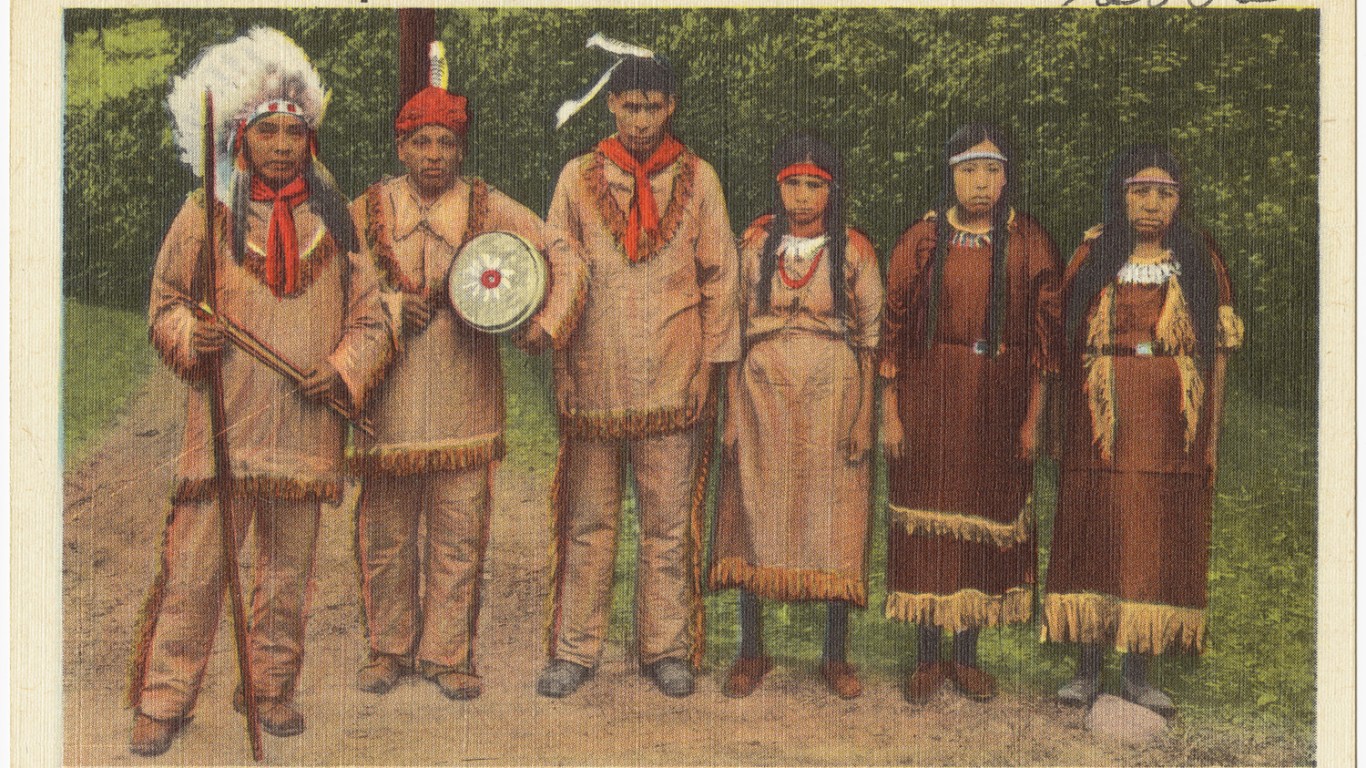
South Carolina
> Largest native population: Cherokee (pop: 18,666)
> Second largest native population: Lumbee (pop: 3,313)
> State residents who self-identify as American Indian: 0.8% — 20th lowest (total: 38,865)
> Median household income: Native pop: $39,484; State: $51,015
> Poverty rate: Native pop: 25.3%; State: 16.0%
> State population: 4,955,925 — 23rd largest
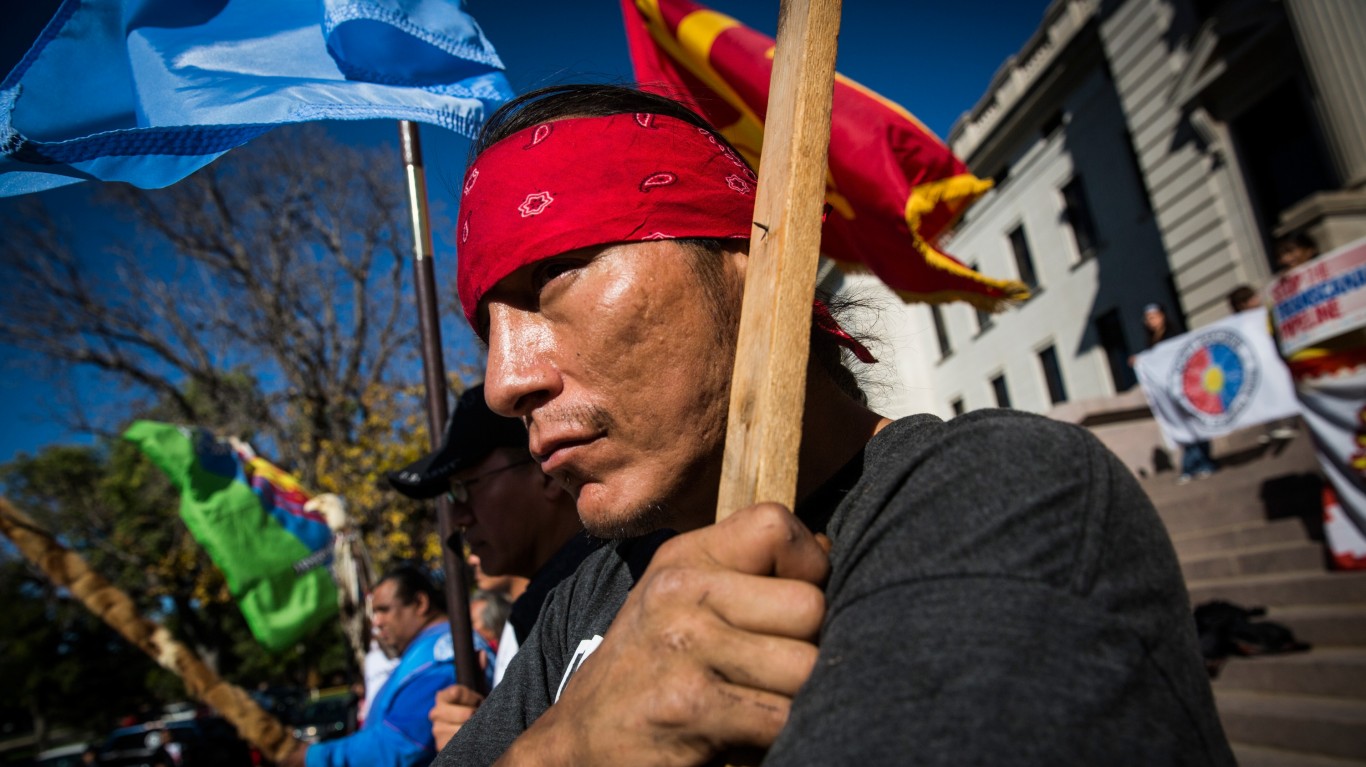
South Dakota
> Largest native population: Sioux (pop: 69,465)
> Second largest native population: Chippewa (pop: 932)
> State residents who self-identify as American Indian: 8.8% — 3rd highest (total: 76,291)
> Median household income: Native pop: $27,045; State: $56,499
> Poverty rate: Native pop: 49.9%; State: 13.6%
> State population: 864,289 — 5th smallest
[in-text-ad]
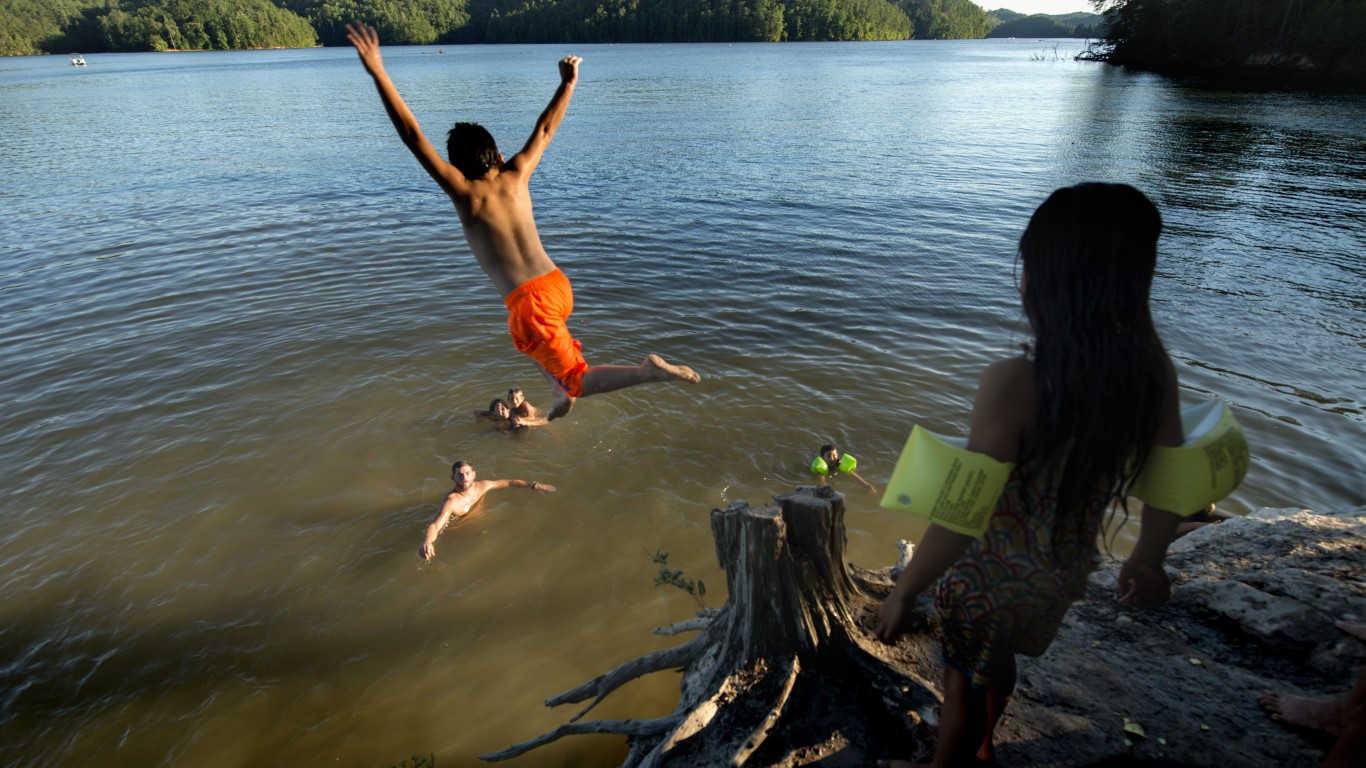
Tennessee
> Largest native population: Cherokee (pop: 30,574)
> Second largest native population: Blackfeet (pop: 2,105)
> State residents who self-identify as American Indian: 0.7% — 18th lowest (total: 49,864)
> Median household income: Native pop: $43,212; State: $50,972
> Poverty rate: Native pop: 20.7%; State: 16.1%
> State population: 6,651,089 — 16th largest
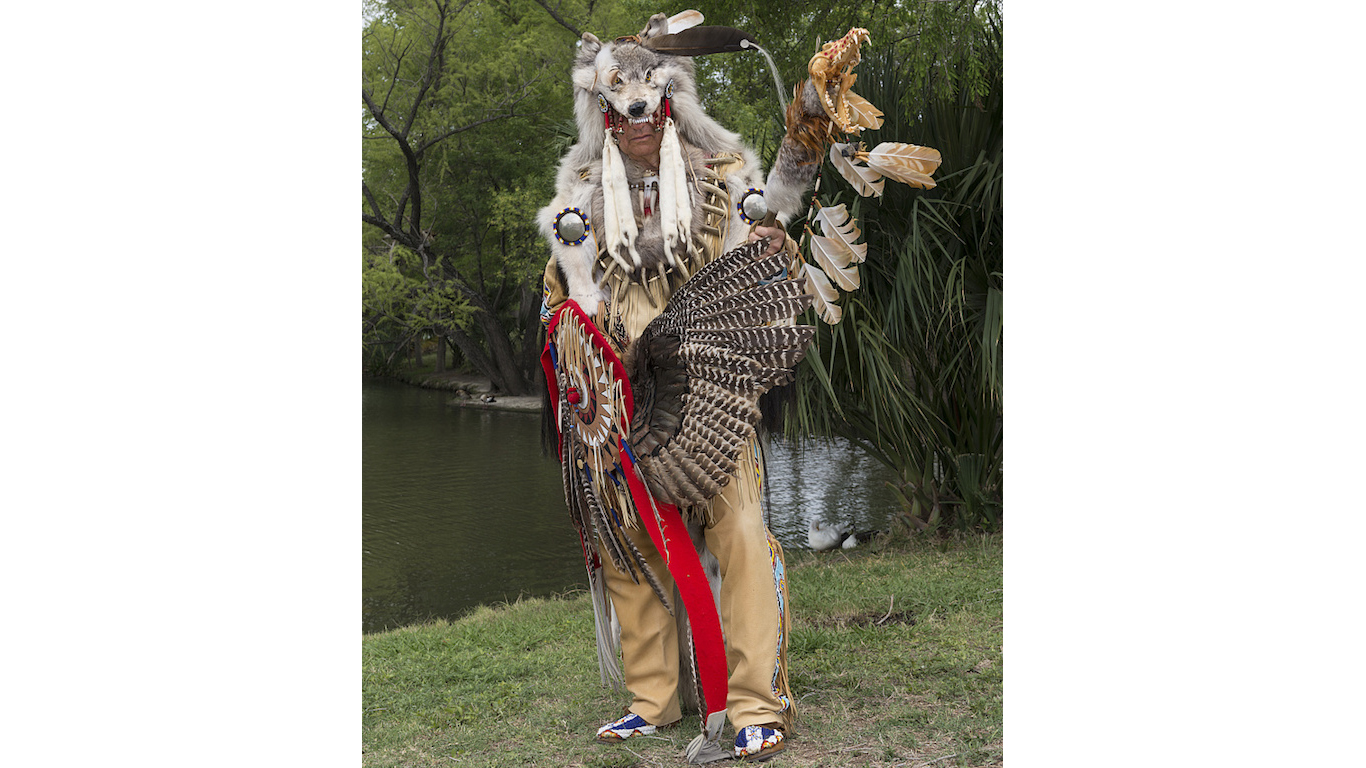
Texas
> Largest native population: Cherokee (pop: 79,858)
> Second largest native population: Choctaw (pop: 32,037)
> State residents who self-identify as American Indian: 0.9% — 21st lowest (total: 239,592)
> Median household income: Native pop: $52,094; State: $59,570
> Poverty rate: Native pop: 17.9%; State: 15.5%
> State population: 27,885,195 — 2nd largest
Utah
> Largest native population: Navajo (pop: 21,162)
> Second largest native population: Ute (pop: 4,727)
> State residents who self-identify as American Indian: 1.6% — 17th highest (total: 48,225)
> Median household income: Native pop: $41,942; State: $68,374
> Poverty rate: Native pop: 29.4%; State: 10.3%
> State population: 3,045,350 — 20th smallest
[in-text-ad-2]
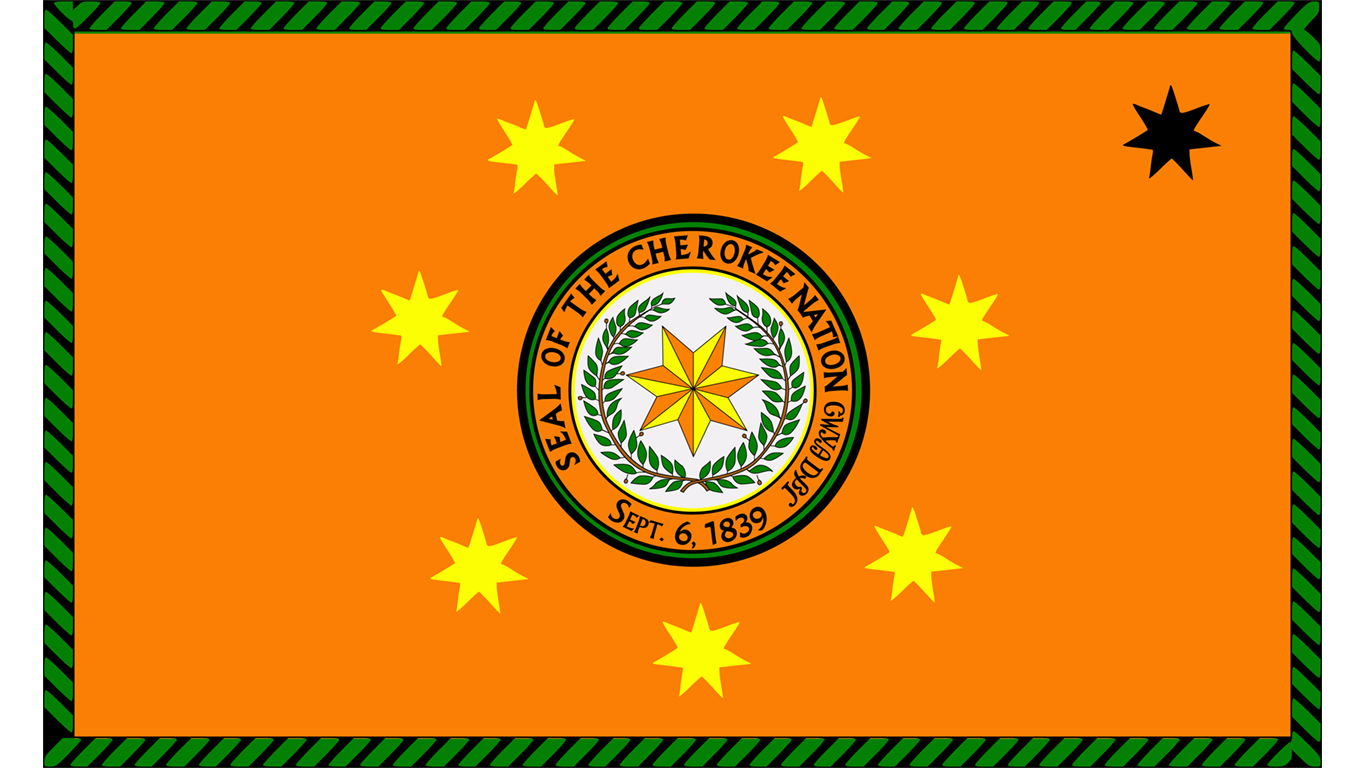
Vermont
> Largest native population: Cherokee (pop: 1,222)
> Second largest native population: Blackfeet (pop: 665)
> State residents who self-identify as American Indian: 1.0% — 24th lowest (total: 6,338)
> Median household income: Native pop: $41,793; State: $60,076
> Poverty rate: Native pop: 17.6%; State: 11.2%
> State population: 624,977 — 2nd smallest
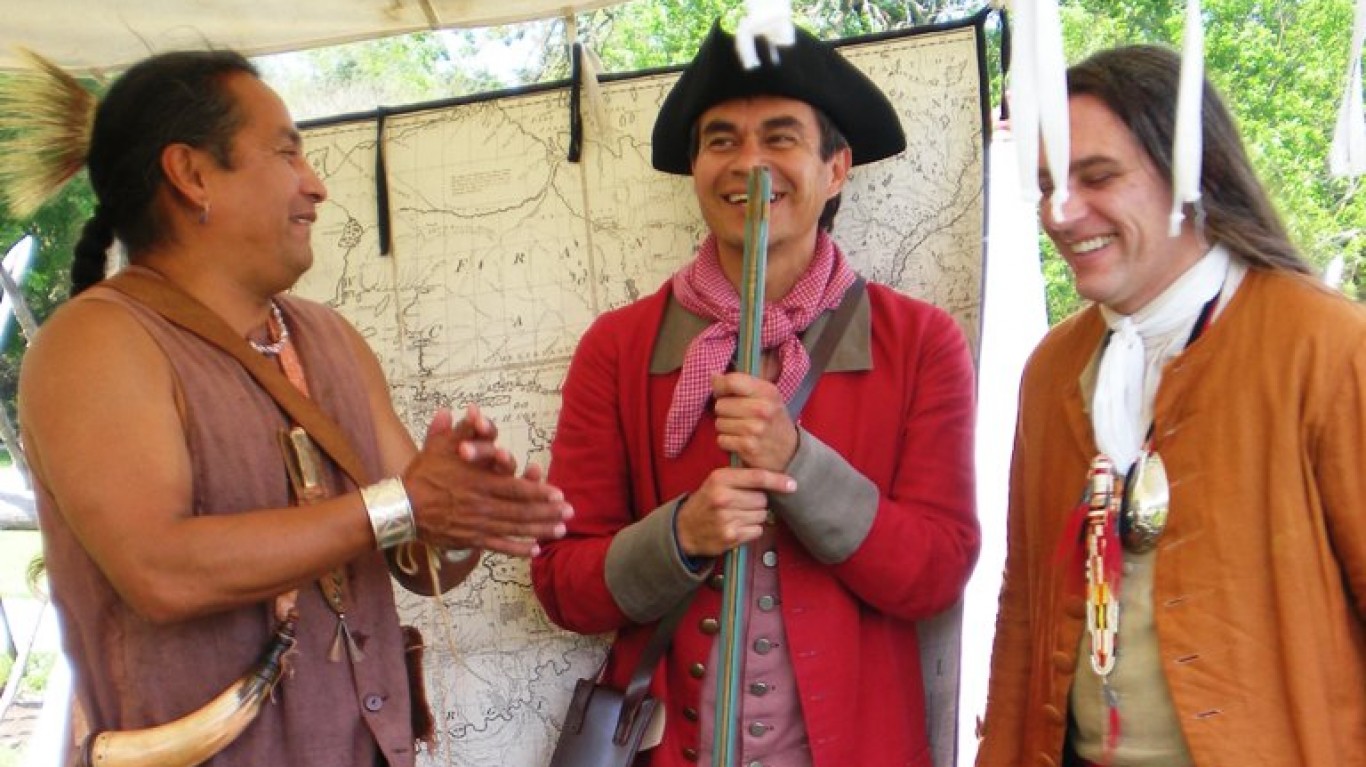
Virginia
> Largest native population: Cherokee (pop: 26,364)
> Second largest native population: Blackfeet (pop: 3,738)
> State residents who self-identify as American Indian: 0.8% — 19th lowest (total: 63,296)
> Median household income: Native pop: $61,850; State: $71,564
> Poverty rate: Native pop: 13.7%; State: 10.9%
> State population: 8,413,774 — 12th largest
[in-text-ad]
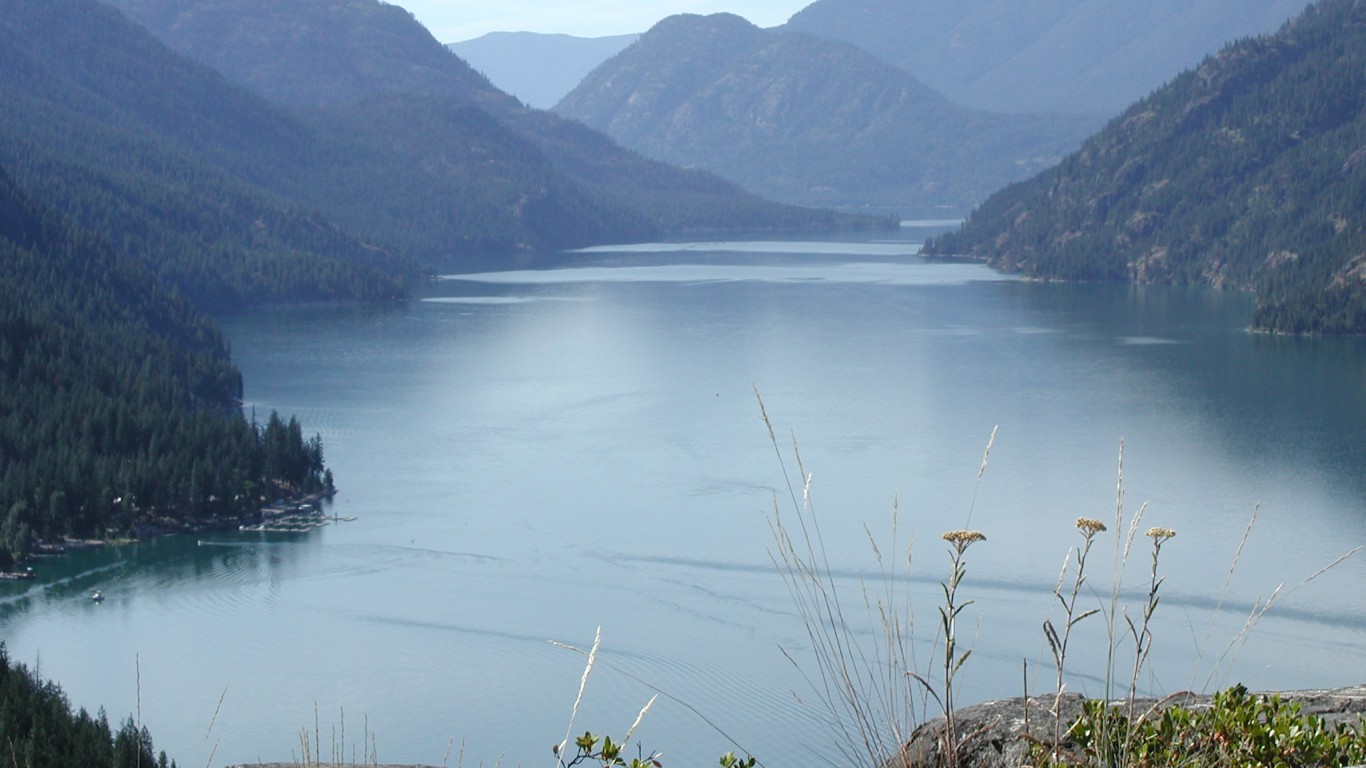
Washington
> Largest native population: Cherokee (pop: 29,437)
> Second largest native population: Puget Sound Salish (pop: 19,291)
> State residents who self-identify as American Indian: 2.4% — 9th highest (total: 172,002)
> Median household income: Native pop: $45,558; State: $70,116
> Poverty rate: Native pop: 24.4%; State: 11.5%
> State population: 7,294,336 — 13th largest
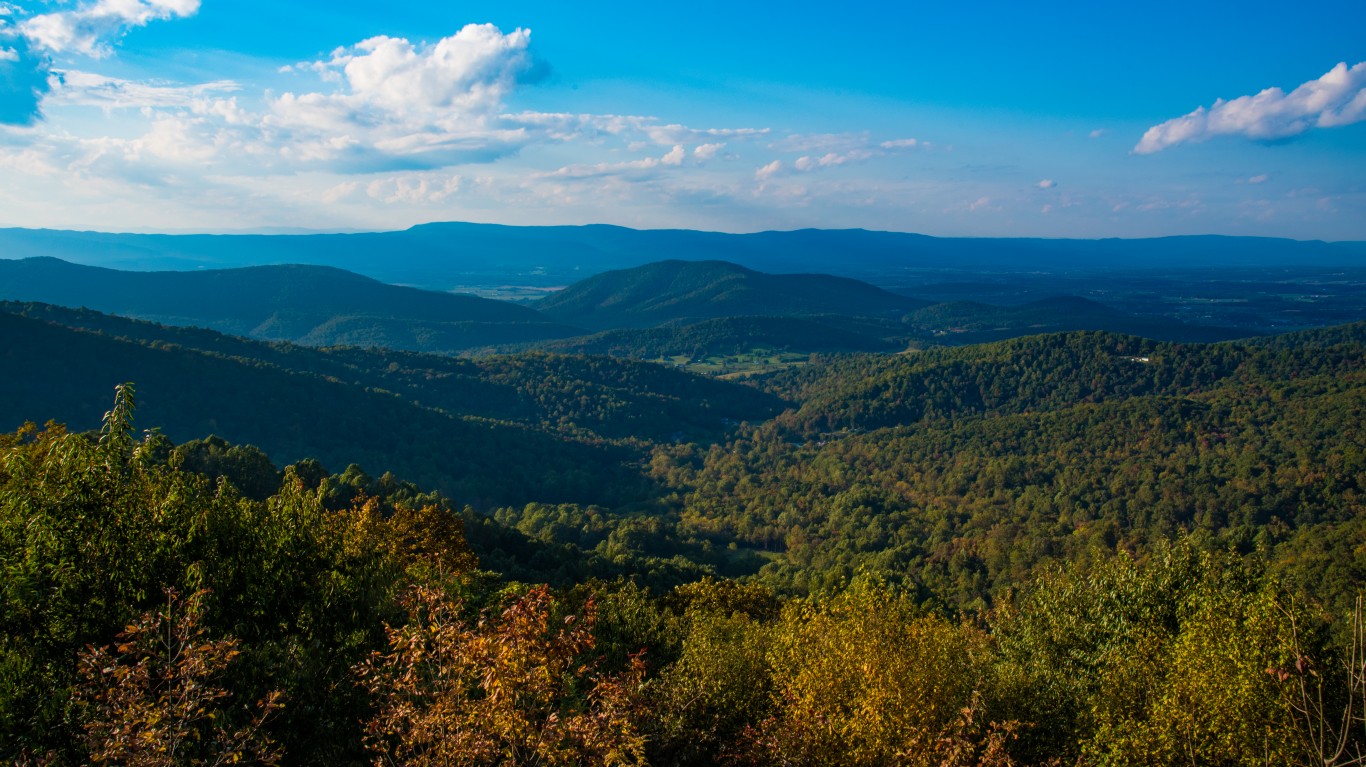
West Virginia
> Largest native population: Cherokee (pop: 5,821)
> Second largest native population: Blackfeet (pop: 1,019)
> State residents who self-identify as American Indian: 0.5% — 4th lowest (total: 9,635)
> Median household income: Native pop: $29,927; State: $44,921
> Poverty rate: Native pop: 19.3%; State: 17.8%
> State population: 1,829,054 — 13th smallest
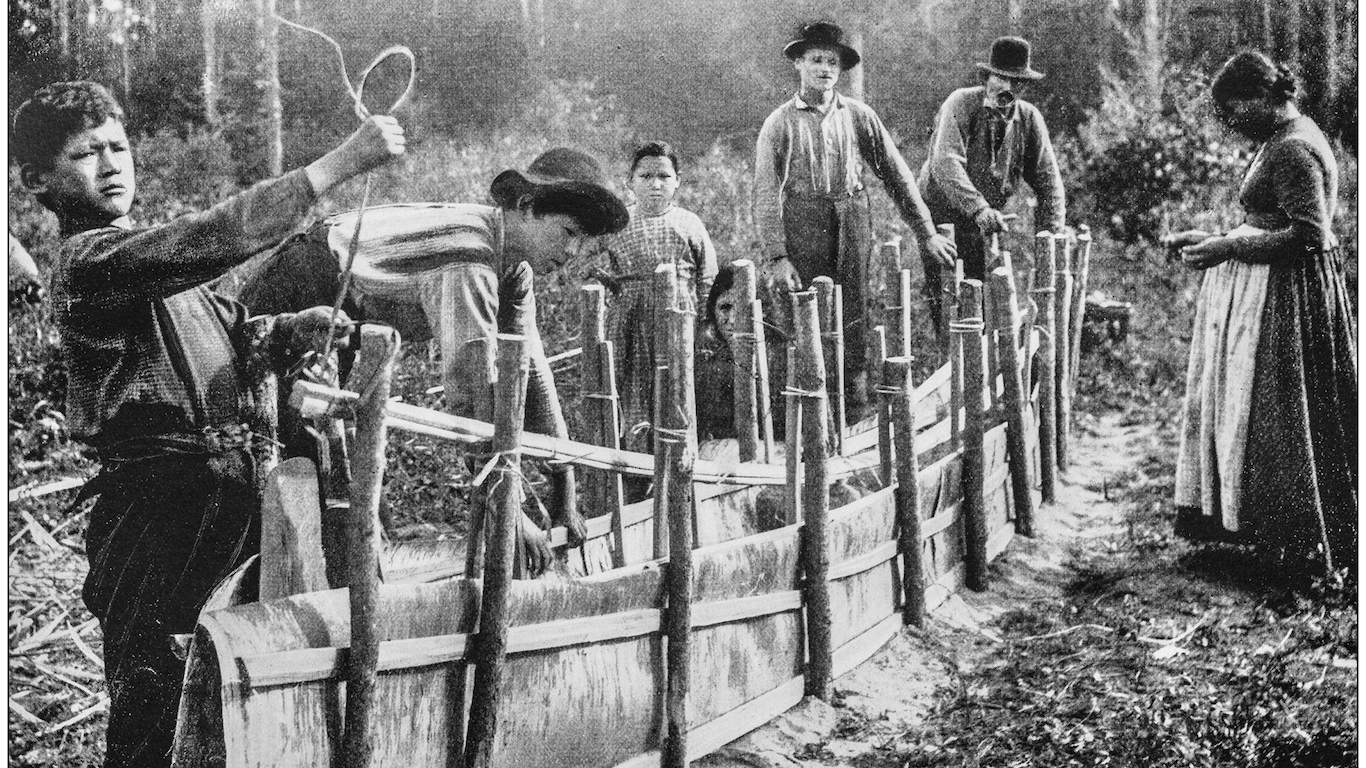
Wisconsin
> Largest native population: Chippewa (pop: 24,286)
> Second largest native population: Iroquois (pop: 11,052)
> State residents who self-identify as American Indian: 1.4% — 21st highest (total: 79,692)
> Median household income: Native pop: $41,594; State: $59,209
> Poverty rate: Native pop: 25.9%; State: 11.9%
> State population: 5,778,394 — 20th largest
[in-text-ad-2]
Wyoming
> Largest native population: Arapaho (pop: 5,760)
> Second largest native population: Shoshone (pop: 3,491)
> State residents who self-identify as American Indian: 3.4% — 7th highest (total: 19,523)
> Median household income: Native pop: $49,352; State: $62,268
> Poverty rate: Native pop: 24.3%; State: 11.1%
> State population: 581,836 — the smallest
Methodology
To identify the largest Native American population in every state, 24/7 Tempo reviewed the number of residents in each state who self-identify as American Indian and Alaskan Native from the U.S. Census Bureau’s 2018 5-year American Community Survey (ACS). We were not able to consider tribes not tabulated by the Census such as Abenaki, Catawba, Eastern Tribes, Kickapoo, Mattaponi, Quapaw, Shawnee, and Yuchi.
The category of American Indian and Alaskan Native includes people who indicate their race as “American Indian or Alaska Native” or report entries such as Navajo, Blackfeet, Inupiat, Yup’ik, or Central American Indian groups, or South American Indian groups. Generally, such individuals have origins in any of the original peoples of North and South America (including Central America) and who maintain tribal affiliation or community attachment.
State-level data for population also came from the ACS for 2018. The figure for state residents who self-identify as American Indian takes into account only state residents who self-identify as American Indian from a specific tribe, not the number of state residents who identify American Indian as part of their heritage.
It’s Your Money, Your Future—Own It (sponsor)
Are you ahead, or behind on retirement? For families with more than $500,000 saved for retirement, finding a financial advisor who puts your interest first can be the difference, and today it’s easier than ever. SmartAsset’s free tool matches you with up to three fiduciary financial advisors who serve your area in minutes. Each advisor has been carefully vetted and must act in your best interests. Start your search now.
If you’ve saved and built a substantial nest egg for you and your family, don’t delay; get started right here and help your retirement dreams become a retirement reality.
Thank you for reading! Have some feedback for us?
Contact the 24/7 Wall St. editorial team.
 24/7 Wall St.
 24/7 Wall St.
 24/7 Wall St.