Special Report
7 Cities Where Incomes Have Gone Down the Most

Published:

Median household income climbed for the ninth consecutive year in the United States in 2019, hitting an all time high of $65,712. Rising incomes were the story in much of the country, as 40 states reported a statistically significant increase in median income between 2018 and 2019, and none reported a decline.
Still, some parts of the country did not benefit from rising incomes. Though few in number, there are a handful of cities where the income that the typical household earned in 2019 was thousands of dollars lower than the previous year.
Using data from the U.S. Census Bureau’s 2019 American Community Survey, 24/7 Wall St. identified the cities where incomes have declined the most. We included all 121 cities, villages, and unincorporated places that reported a statistically significant change in median household income in our analysis. The places on this list are the only ones to report a decline in income. Supplemental data on unemployment and poverty also came from the ACS.
Median incomes declined in the cities on this list likely due in part to rising unemployment. In each of the seven cities where incomes fell in 2019, the annual unemployment rate climbed over the same period. Of course, the 2019 unemployment rate does not account for the current labor crisis driven by the COVID-19 recession. As a result, many residents of these cities are likely struggling financially even more in 2020. Here is a look at the cities with the worst COVID-19 unemployment crisis right now.
Despite breaking from the national trend and reporting lower incomes in 2019, the cities on this list are not necessarily poor areas. In fact, the typical household in five of these seven cities still has a higher income than the typical U.S. household.
Click here to see the cities where incomes have gone down the most.

7. Joliet, Illinois
> 1 yr. change in median household income: -7.4% (-$5,711)
> Median household income: $71,284 (2019); $76,995 (2018)
> Poverty rate: 9.7% (2019); 10.9% (2018)
> Unemployment: 5.1% (2019); 4.7% (2018)
> Population: 148,806
The typical household in Joliet, Illinois. earned about $5,711 less in 2019 than it did the previous year. As is the case across much of Illinois, employment opportunities are also becoming increasingly scarce in Joliet. The city’s average unemployment rate climbed from 4.7% in 2018 to 5.1% in 2019. Falling incomes and rising unemployment are two factors that are likely driving people out of Joliet. The city’s population fell by 0.4% from 2018 to 2019.
Though the city’s median household income fell by 7.4% in 2019, the typical household still earned about $6,000 more than the typical American household.
[in-text-ad]

6. Vallejo, California
> 1 yr. change in median household income: -9.5% (-$7,506)
> Median household income: $71,265 (2019); $78,771 (2018)
> Poverty rate: 11.3% (2019); 9.5% (2018)
> Unemployment: 5.9% (2019); 4.9% (2018)
> Population: 121,692
Vallejo is the only city in California where incomes fell in 2019. The typical area household earned $71,265 in 2019, 9.5% less than the year before. Meanwhile, the typical California household earned $80,440 in 2019, 5.3% more than in 2018.
As is the case in other cities on this list, a flagging job market may partially explain the decline in median household income in Vallejo. The local unemployment rate increased from 4.9% in 2018 to 5.9% in 2019.

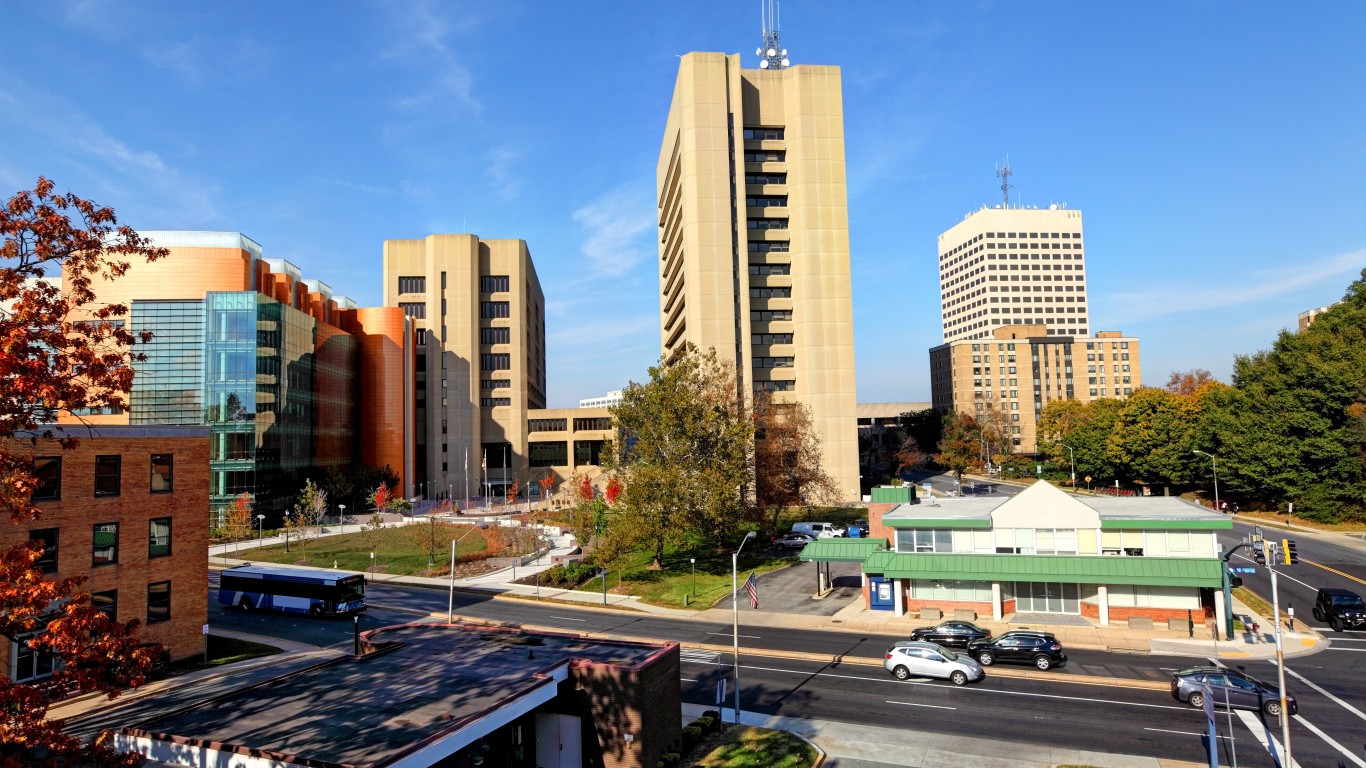
5. Rockville, Maryland
> 1 yr. change in median household income: -12.9% (-$14,931)
> Median household income: $100,677 (2019); $115,608 (2018)
> Poverty rate: 7.6% (2019); 6.7% (2018)
> Unemployment: 5.4% (2019); 2.0% (2018)
> Population: 68,085
Though its median household income declined by nearly $15,000 from 2018, Rockville, Maryland, still ranks as one of the wealthier cities in America, with the typical household earning over $100,000 in 2019. The city’s median household income declined sharply, as its unemployment rate more than doubled, from just 2.0% in 2018 to 5.4% in 2019.
The city, just north of Washington, D.C., is home to a number of federal contractors. Some of these contractors may have had to lay off or furlough employees amid the 2019 government shutdown, likely contributing to the rising unemployment and declining incomes.

4. Frisco, Texas
> 1 yr. change in median household income: -13.1% (-$17,605)
> Median household income: $116,884 (2019); $134,489 (2018)
> Poverty rate: 3.5% (2019); 2.2% (2018)
> Unemployment: 3.6% (2019); 2.2% (2018)
> Population: 200,513
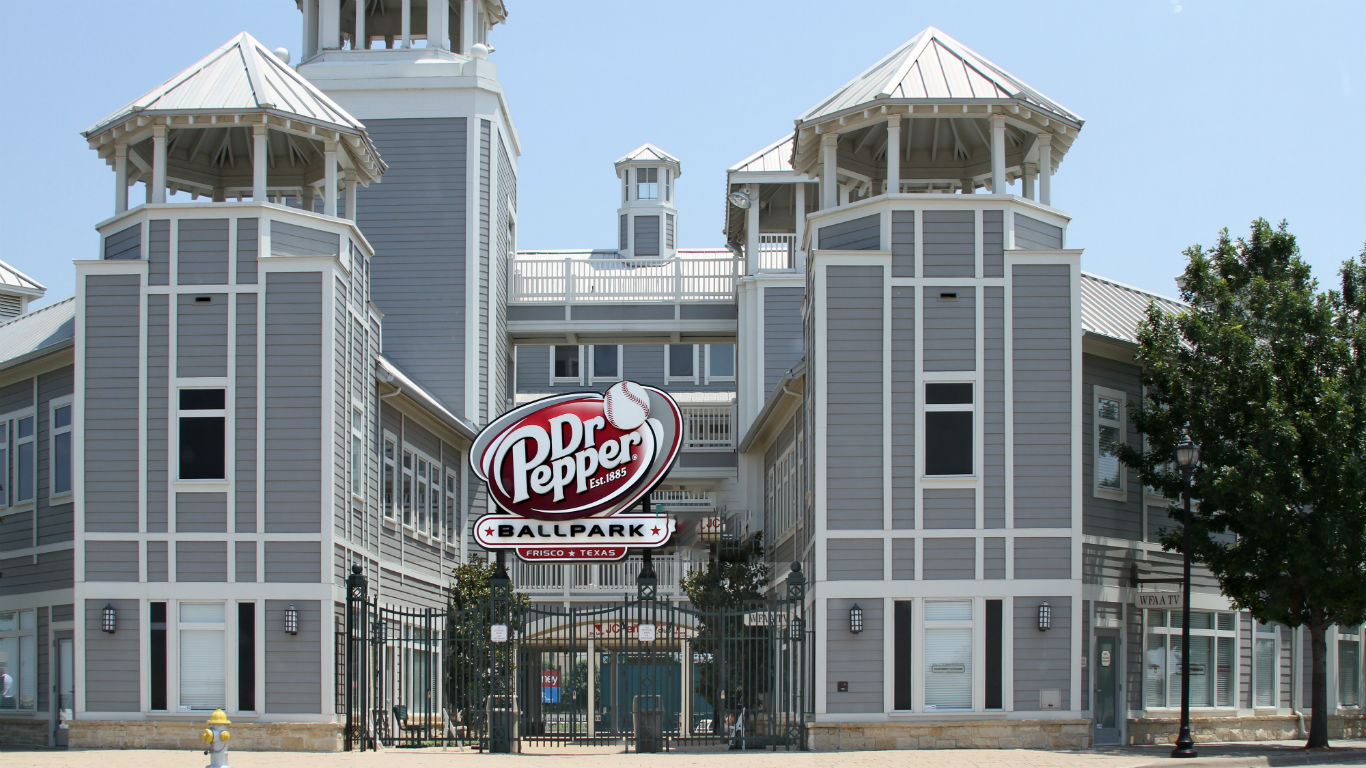
Only three U.S. cities and towns reported a steeper decline in median household income than the Dallas suburb of Frisco. The income the typical area household earned in 2019 was 13.1% lower than in the previous year. Despite the decline, the area remains among the wealthiest in the country. Most households in Frisco earn more than $116,000 a year, over $50,000 more than the typical American household.
Frisco touts itself as a business friendly city that champions job creation. However, the area’s annual unemployment rate climbed substantially from 2.2% in 2018 to 3.6% in 2019. The higher unemployment may be attributable in part to the city’s rapid population growth and the likely influx of residents seeking work. One of the fastest growing cities in the country, Frisco reported population growth of 6.6% between 2018 and 2019.
[in-text-ad-2]

3. Tamarac, Florida
> 1 yr. change in median household income: -13.4% (-$6,867)
> Median household income: $44,400 (2019); $51,267 (2018)
> Poverty rate: 13.9% (2019); 11.2% (2018)
> Unemployment: 3.7% (2019); 2.7% (2018)
> Population: 66,712
Tamarac, Florida, a suburb of Fort Lauderdale, is one of only four places in the United States where the median household income fell by over 13% in 2019. Before the decline, the typical household in the city earned $51,267 a year, about $11,600 less than the typical American household. After the decline, the typical Tamarac household earned just $44,400, about $21,300 less than the typical American household.
Many households in Tamarac were further affected this year by the COVID-19 recession. City officials set aside a quarter of a million dollars in funding to aid those struggling to afford housing during the pandemic. Eligible residents received up to $5,000 to assist with rent, mortgage, or utility payments for a three month period.

2. Wellington, Florida
> 1 yr. change in median household income: -14.4% (-$14,503)
> Median household income: $85,886 (2019); $100,389 (2018)
> Poverty rate: 4.7% (2019); 6.7% (2018)
> Unemployment: 4.2% (2019); 2.9% (2018)
> Population: 65,389
In 2018, most households in the Eastern Florida village of Wellington earned over $100,000. As of 2019, most area households earned less than $86,000 a year. The decline in median income occurred as jobs in the area disappeared. Over the same period, the annual unemployment rate in Wellington climbed from 2.9% to 4.2%.
Wellington is home to a massive equestrian center that serves as a local economic engine. The village hosts the annual Winter Equestrian Festival which was cut short by two-weeks due to COVID-19 in 2020, but still brought in an estimated $286 million and over 3,000 jobs.
[in-text-ad]

1. St. Joseph, Missouri
> 1 yr. change in median household income: -16.9% (-$8,860)
> Median household income: $43,614 (2019); $52,474 (2018)
> Poverty rate: 18.3% (2019); 16.7% (2018)
> Unemployment: 3.9% (2019); 3.4% (2018)
> Population: 75,053
Incomes in St. Joseph, Missouri, declined from 2018 to 2019 more than in any other major American city. The median household income in St. Joseph, which is roughly 50 miles north of Kansas City, dropped by nearly $9,000, or nearly 17%, to $43,614. Though other cities had larger declines in terms of dollars, the typical income in St. Joseph is relatively low — about $22,000 less than the national median income.
Though the unemployment rate in St. Joseph increased to 3.9% in 2019, it is still below the 4.5% U.S. unemployment rate.
The thought of burdening your family with a financial disaster is most Americans’ nightmare. However, recent studies show that over 100 million Americans still don’t have proper life insurance in the event they pass away.
Life insurance can bring peace of mind – ensuring your loved ones are safeguarded against unforeseen expenses and debts. With premiums often lower than expected and a variety of plans tailored to different life stages and health conditions, securing a policy is more accessible than ever.
A quick, no-obligation quote can provide valuable insight into what’s available and what might best suit your family’s needs. Life insurance is a simple step you can take today to help secure peace of mind for your loved ones tomorrow.
Click here to learn how to get a quote in just a few minutes.
Thank you for reading! Have some feedback for us?
Contact the 24/7 Wall St. editorial team.