Special Report
How Much You Need to Make to Be in the 1% in Every State

Published:

While income inequality is a fundamental component of the U.S. capitalist economy, a recent poll conducted by the Pew Research Center found that 61% of Americans think that it has gone too far. Today, the top 1% of earners in the United States account for about 20% of the country’s total income annually. Meanwhile, the lowest-earning quarter of Americans account for just 3.7% of income every year.
Nationwide, it takes an annual income of $538,926 to be among the top 1%. Among the approximately 1.4 million taxpayers who meet this threshold, the average annual income is about $1.7 million — about 20 times the average income of $82,535 among all taxpayers. Wealth, however, is far more concentrated in certain parts of the country than in others, and as a result, the amount it takes to be among the top 1% in each state varies considerably.
Using adjusted gross income percentile data for the 2017 tax year from the IRS, 24/7 Wall St. determined how much you need to make to be in the 1% in every state. All data is derived from federal 1040 individual tax returns and is inflation adjusted for 2019. The annual income floor needed to be in the 1% ranges from less than $350,000 in some states to well more than double that in others.
Across populations, incomes tend to rise with educational attainment. As a result, incomes tend to be higher in states that are home to a large share of college educated adults. Indeed, many of the best-educated states are also those with the highest income threshold to be among the top 1% of earners. Here is a complete list of America’s most and least educated states.
Of course, just as incomes vary nationwide, incomes also vary within states. The income necessary to be among the top 1% in each state is often driven up by a handful of wealthy towns or neighborhoods. Concentrated pockets of wealth drive up average overall incomes in every state. Here is a look at the richest town in every state.
Click here to see how much you need to make to be in the 1% in every state.
Click here to see our methodology.

1. Alabama
> Top 1% earn at least: $390,066 (7th lowest)
> Avg. income of the top 1%: $1,011,643 (9th lowest)
> Share of all income earned by the 1%: 15.5% (19th lowest)
> Avg. income among all tax filers: $65,249 (5th lowest)
In Alabama, tax filers earning $390,066 rank in the top 1% of all earners, the seventh lowest threshold of any state. Filers in the 1% in Alabama earn an average of $1.0 million and pay $265,363 in federal income taxes, the ninth and 10th smallest such figures of any state’s top 1% of earners.
[in-text-ad]

2. Alaska
> Top 1% earn at least: $433,070 (21st lowest)
> Avg. income of the top 1%: $934,419 (6th lowest)
> Share of all income earned by the 1%: 11.9% (2nd lowest)
> Avg. income among all tax filers: $78,641 (18th highest)
In Alaska, residents need to earn at least $433,070 to rank among the top 1% of earners. Among the wealthiest 1% of taxpayers in the state, the average income is $934,419 — or about $855,000 more than the average income among all taxpayers.

3. Arizona
> Top 1% earn at least: $448,795 (25th lowest)
> Avg. income of the top 1%: $1,235,517 (22nd highest)
> Share of all income earned by the 1%: 17.0% (17th highest)
> Avg. income among all tax filers: $72,696 (20th lowest)
The average income across all taxpayers in Arizona is $72,696. Among the top 1% of earners in the state — those earning at least $448,795 — the average income is $1.2 million. The roughly 28,000 taxpayers who comprise the state’s 1% earned about 17% of all money made in the state annually.

4. Arkansas
> Top 1% earn at least: $377,895 (5th lowest)
> Avg. income of the top 1%: $1,483,488 (13th highest)
> Share of all income earned by the 1%: 21.9% (9th highest)
> Avg. income among all tax filers: $67,841 (10th lowest)
In Arkansas, the income threshold for the top 1% is just $377,895, about $161,000 less than the national 1% threshold and the fifth lowest of any state. While the threshold for the top 1% is lower in Arkansas than in the majority of states, the average filer in the 1% earns $1.5 million — the 13th highest average income of the 1% of any state.
[in-text-ad-2]

5. California
> Top 1% earn at least: $659,503 (5th highest)
> Avg. income of the top 1%: $2,195,775 (6th highest)
> Share of all income earned by the 1%: 23.0% (7th highest)
> Avg. income among all tax filers: $95,494 (5th highest)
With an average statewide income of about $95,500, California is one of the wealthiest states in the country. The high average income in the state is due in part to a high concentration of high-wealth individuals. The threshold for being among California’s 1% is $659,503, higher than in all but four other states. Among the top 1% of earners in the state, the average annual income is $2.2 million.
6. Colorado
> Top 1% earn at least: $563,672 (8th highest)
> Avg. income of the top 1%: $1,554,182 (12th highest)
> Share of all income earned by the 1%: 17.6% (15th highest)
> Avg. income among all tax filers: $88,153 (11th highest)
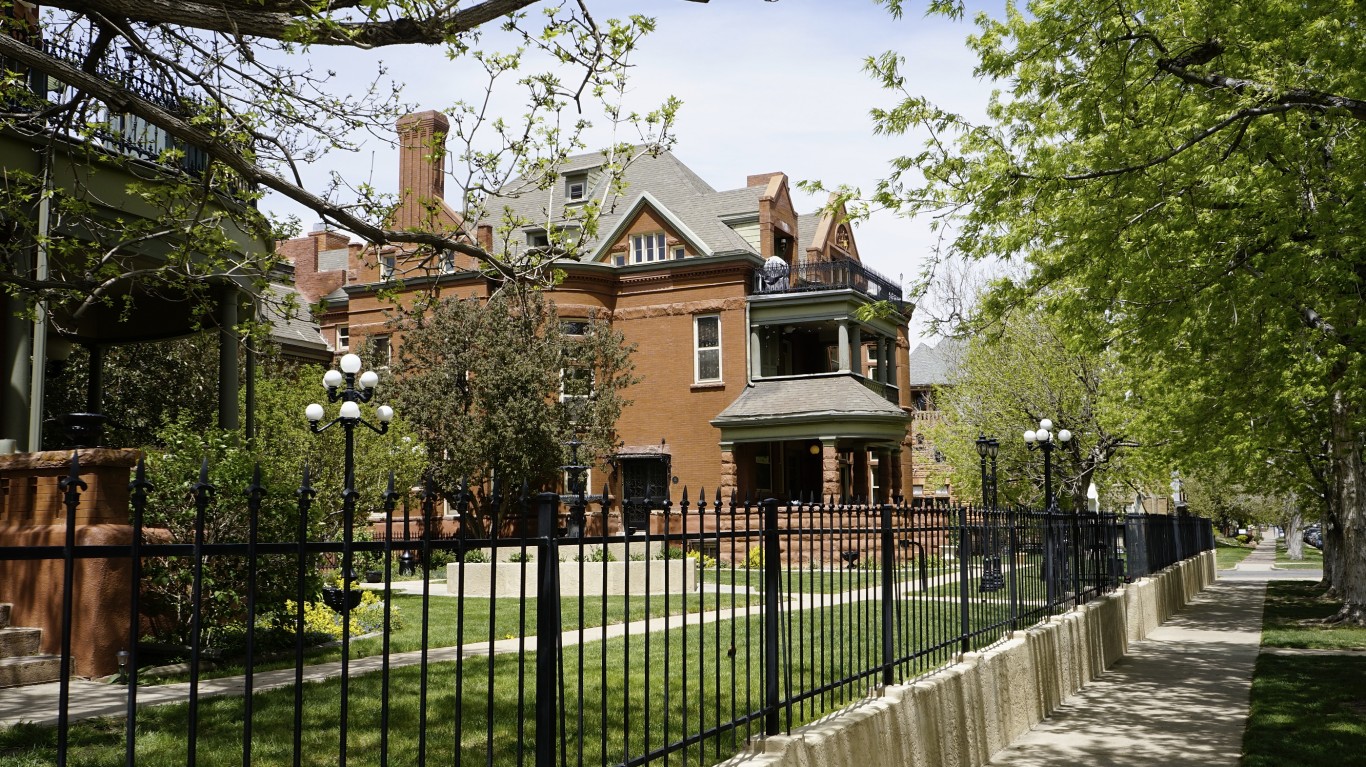
In Colorado, residents need to earn at least $563,672 a year to rank in the top 1% of earners. The state 1% income threshold is nearly $25,000 more than the national threshold and the eighth highest of any state. One factor pushing incomes higher in Colorado is likely high educational attainment. Among adults in the state, 41.7% have at least a bachelor’s degree, the second largest share of any state.
[in-text-ad]

7. Connecticut
> Top 1% earn at least: $827,194 (the highest)
> Avg. income of the top 1%: $3,060,989 (the highest)
> Share of all income earned by the 1%: 27.0% (4th highest)
> Avg. income among all tax filers: $113,570 (the highest)
Connecticut residents must earn at least $827,194 a year to rank in the top 1% of earners, the highest threshold of any state. Connecticut’s wealthiest earners also have the largest tax burden in the country. The average filer in the top 1% earns $3.1 million and pays $825,611 in federal income taxes, each the largest such figure of any state.

8. Delaware
> Top 1% earn at least: $440,228 (23rd lowest)
> Avg. income of the top 1%: $1,069,994 (17th lowest)
> Share of all income earned by the 1%: 14.1% (7th lowest)
> Avg. income among all tax filers: $76,151 (23rd highest)
Delaware residents who earn at least $440,228 a year are among the top 1% of earners in the state. Among the state’s wealthiest 1%, the average annual income is $1.1 million. Among the state’s wealthiest 1%, the average annual income is $1.1 million, 14 times the average annual income across all taxpayers in Delaware of just $76,151.

9. Florida
> Top 1% earn at least: $581,682 (7th highest)
> Avg. income of the top 1%: $2,347,180 (5th highest)
> Share of all income earned by the 1%: 28.4% (2nd highest)
> Avg. income among all tax filers: $82,535 (14th highest)
Individuals in Florida must earn at least $581,682 a year to rank in the top 1%, the seventh highest threshold of any state. The top 1% of earners in Florida account for 28.4% of all income in the state — the second largest such share — and pay 50.3% of all federal income taxes, the largest share in the country.
[in-text-ad-2]

10. Georgia
> Top 1% earn at least: $501,914 (15th highest)
> Avg. income of the top 1%: $1,420,732 (15th highest)
> Share of all income earned by the 1%: 19.0% (12th highest)
> Avg. income among all tax filers: $74,744 (24th highest)
The threshold to be in the top 1% of earners in Georgia is an annual income of $501,914, the 15th highest of any state. The top 1% of earners in Georgia account for 19.0% of all income and 36.3% of all federal income taxes, each the 12th largest such share of any state.

11. Hawaii
> Top 1% earn at least: $414,599 (13th lowest)
> Avg. income of the top 1%: $1,044,728 (14th lowest)
> Share of all income earned by the 1%: 14.1% (9th lowest)
> Avg. income among all tax filers: $74,204 (23rd lowest)
The top one percent in Hawaii earn a cumulative total of about $6.8 billion annually, or 14.1% of all income earned in the state. As is the case across the U.S. as a whole, the top 1% of earners in Hawaii the top 1% of earners in Hawaii pay a disproportionate share in taxes. The top 1% pay about $1.7 billion in federal income taxed annually, or 28.3% of the total amount collected in the state.
[in-text-ad]

12. Idaho
> Top 1% earn at least: $407,393 (10th lowest)
> Avg. income of the top 1%: $1,043,184 (13th lowest)
> Share of all income earned by the 1%: 15.2% (16th lowest)
> Avg. income among all tax filers: $68,702 (13th lowest)
Idaho is one of the lower-income states, with an average annual income among taxpayers of $68,702. It does not take as much money to rank among the wealthiest 1% in the state compared to much of the rest of the country. One-percenters in Idaho earn at least $407,393. In half of all states, the threshold is at least $450,000.

13. Illinois
> Top 1% earn at least: $558,831 (9th highest)
> Avg. income of the top 1%: $1,639,367 (11th highest)
> Share of all income earned by the 1%: 19.2% (11th highest)
> Avg. income among all tax filers: $85,544 (13th highest)
It takes more to rank among the top 1% of earners in Illinois than in most other states. The 56,000 taxpayers in the state who comprise the 1% earn about $91.8 billion cumulatively per year, or 19.2% of all money made in the state. Illinois’s wealthiest residents also pay a disproportionately high share of taxes, accounting for 36.2% of federal income taxes collected in the state.

14. Indiana
> Top 1% earn at least: $394,398 (8th lowest)
> Avg. income of the top 1%: $1,000,641 (8th lowest)
> Share of all income earned by the 1%: 14.8% (12th lowest)
> Avg. income among all tax filers: $67,732 (9th lowest)
Indiana residents must earn $394,398 annually to rank in the top 1% — the eighth lowest threshold of any state. The average member of the 1% in Indiana earns $1.0 million a year and pays $269,436 in federal income taxes, approximately $694,000 less in income and $186,000 less in federal income taxes than the national average for the 1%.
[in-text-ad-2]

15. Iowa
> Top 1% earn at least: $402,246 (9th lowest)
> Avg. income of the top 1%: $978,158 (7th lowest)
> Share of all income earned by the 1%: 13.4% (4th lowest)
> Avg. income among all tax filers: $73,171 (21st lowest)
The minimum income required to rank among the top 1% of earners in Iowa is $402,246, one of the lowest thresholds among states. Across populations, incomes tend to rise with educational attainment, and in Iowa, just 29.0% of adults have a bachelor’s degree, below the 32.6% share of adults nationwide. States with higher income thresholds for the wealthiest 1% also tend to have higher educational attainment.

16. Kansas
> Top 1% earn at least: $450,606 (25th highest)
> Avg. income of the top 1%: $1,173,583 (24th lowest)
> Share of all income earned by the 1%: 15.8% (23rd lowest)
> Avg. income among all tax filers: $74,382 (24th lowest)
The threshold for the top 1% of earners in Kansas is $450,606, approximately $88,000 below the national average. The top 1% of earners account for 15.8% of all income in Kansas and 33.1% of all federal income taxes. By comparison, the top 1% of earners nationwide account for 20.5% of all income and 38.3% of all federal income taxes.
[in-text-ad]

17. Kentucky
> Top 1% earn at least: $377,532 (4th lowest)
> Avg. income of the top 1%: $900,198 (5th lowest)
> Share of all income earned by the 1%: 14.1% (8th lowest)
> Avg. income among all tax filers: $64,051 (4th lowest)
Kentucky is one of the poorest states in the country, and partially as a result, it does not take as much money to rank among the state’s 1% than it does in much of the United States. Kentucky is one of only eight states where an income of less than $400,000 is enough to be in the top 1%. It is also one of only seven states where the average annual income among the 1% is less than $1 million.

18. Louisiana
> Top 1% earn at least: $423,138 (17th lowest)
> Avg. income of the top 1%: $1,066,004 (15th lowest)
> Share of all income earned by the 1%: 16.1% (25th highest)
> Avg. income among all tax filers: $66,342 (6th lowest)
Tax filers in Louisiana need to make at least $423,138 a year to be in the top 1% of earners, about $116,000 below the national threshold. The average tax filer in the top 1% in Louisiana earns $1.1 million a year and pays $293,992 in federal income taxes. By comparison, the average tax filer in the top 1% nationwide earns $1.7 million a year and pays $454,943 in federal income taxes.

19. Maine
> Top 1% earn at least: $389,504 (6th lowest)
> Avg. income of the top 1%: $871,388 (4th lowest)
> Share of all income earned by the 1%: 13.0% (3rd lowest)
> Avg. income among all tax filers: $66,809 (7th lowest)
Maine is one of only eight states where it takes less than $400,000 to be in the top 1% of earners. Cumulatively, the state’s one-percenters earn $5.3 billion a year, or 13.0% of all income, more than double the amount the bottom 25% in the state earn.
[in-text-ad-2]

20. Maryland
> Top 1% earn at least: $532,093 (11th highest)
> Avg. income of the top 1%: $1,355,956 (19th highest)
> Share of all income earned by the 1%: 15.3% (17th lowest)
> Avg. income among all tax filers: $88,763 (9th highest)
Every taxpayer in Maryland who ranks among the top 1% of earners makes over half a million dollars a year. On average, one-percenters in the state earn nearly $1.4 million annually.
Cumulatively, one-percenters in Maryland earn 15.3% of all income, and they shoulder a disproportionate share of the state’s tax burden, accounting for 29.3% of all federal income taxes paid in the state.

21. Massachusetts
> Top 1% earn at least: $728,272 (2nd highest)
> Avg. income of the top 1%: $2,582,633 (3rd highest)
> Share of all income earned by the 1%: 23.7% (6th highest)
> Avg. income among all tax filers: $109,082 (2nd highest)
Massachusetts is one of the most affluent states in the country, with an average income among all taxpayers of $109,082, the third highest of any state. To be in the top 1% of earners, a tax filer in 2018 needed to have an income of at least $728,272, a higher threshold than all states but one. Adults with a higher educational attainment are much more likely to earn higher incomes, and the state has among the highest shares of adults with a bachelor’s degree, at 44.5% of adults, compared to a national share of 32.6%.
[in-text-ad]

22. Michigan
> Top 1% earn at least: $435,271 (22nd lowest)
> Avg. income of the top 1%: $1,203,724 (25th lowest)
> Share of all income earned by the 1%: 16.7% (20th highest)
> Avg. income among all tax filers: $72,227 (19th lowest)
In Michigan, the top 1% of earners account for 16.7% of all income in the state. Meanwhile, the bottom quarter of all earners account for just 3.7% of all earnings. The average income among the wealthiest 1% Michigan residents is $1.2 million — nearly 17 times the average income among all taxpayers in the state of $72,227.

23. Minnesota
> Top 1% earn at least: $522,444 (13th highest)
> Avg. income of the top 1%: $1,399,463 (16th highest)
> Share of all income earned by the 1%: 16.3% (23rd highest)
> Avg. income among all tax filers: $85,628 (12th highest)
The income floor for the top 1% of earners in Minnesota is $522,444, nearly in line with the national 1% threshold of $538,926. The top 1% of earners in Minnesota account for 16.3% of all income in the state and 31.5% of all federal income taxes — lower than the corresponding national shares of 20.5% and 38.3%, respectively.

24. Mississippi
> Top 1% earn at least: $326,182 (2nd lowest)
> Avg. income of the top 1%: $751,141 (2nd lowest)
> Share of all income earned by the 1%: 13.4% (5th lowest)
> Avg. income among all tax filers: $55,999 (the lowest)
In Mississippi, the average annual income among tax filers is just $55,999, the lowest of any state and approximately $27,000 lower than the national average. Individuals with an annual income of $326,182 in the state rank in the top 1%, a threshold about $213,000 less than the national threshold and the second lowest income floor for the 1% of any state.
[in-text-ad-2]
25. Missouri
> Top 1% earn at least: $419,752 (16th lowest)
> Avg. income of the top 1%: $1,136,765 (23rd lowest)
> Share of all income earned by the 1%: 16.3% (24th highest)
> Avg. income among all tax filers: $69,882 (16th lowest)
It takes about $420,000 in annual income to be among the highest 1% of earners in Missouri, a lower threshold than in most states. The average income among one-percenters in the state is $1.1 million, about 16 times the average income of $69,882 among all earners.

26. Montana
> Top 1% earn at least: $416,874 (15th lowest)
> Avg. income of the top 1%: $1,066,180 (16th lowest)
> Share of all income earned by the 1%: 15.6% (20th lowest)
> Avg. income among all tax filers: $68,554 (12th lowest)
The threshold for the top 1% of income in Montana is $416,874, about $122,000 less than the national figure. Tax filers in the top 1% earn an average of $1.1 million a year and pay $270,672 in income taxes. By comparison, the top 1% of earners nationwide report $1.7 million in income and $454,942 in federal income taxes.
[in-text-ad]
27. Nebraska
> Top 1% earn at least: $431,616 (20th lowest)
> Avg. income of the top 1%: $1,123,566 (19th lowest)
> Share of all income earned by the 1%: 15.1% (14th lowest)
> Avg. income among all tax filers: $74,393 (25th lowest)
The top 1% of earners in Nebraska make $9.2 billion cumulatively per year, or about 15.1% of all income in the state. Meanwhile, the bottom 25% of earners account for just 4.7% of all money earned.
As is the case nationwide, Nebraska’s 1% shoulder a disproportionate share of the tax burden, paying about 32.2% of all income federal taxes collected a year.

28. Nevada
> Top 1% earn at least: $469,328 (18th highest)
> Avg. income of the top 1%: $1,864,084 (8th highest)
> Share of all income earned by the 1%: 24.3% (5th highest)
> Avg. income among all tax filers: $76,757 (21st highest)
While in Nevada the income threshold for the top 1% is $469,326, below the national threshold of $538,926, the average income among the top 1% of earners is $1.9 million — above the $1.7 million national average. The top 1% of earners in Nevada account for 24.3% of all income in the state and 45.6% of all federal income taxes paid, the fifth and fourth largest such shares of any state.

29. New Hampshire
> Top 1% earn at least: $510,178 (14th highest)
> Avg. income of the top 1%: $1,453,974 (14th highest)
> Share of all income earned by the 1%: 16.4% (21st highest)
> Avg. income among all tax filers: $88,867 (8th highest)
The income threshold to be among the top 1% of earners in New Hampshire is $510,178, higher than in the majority of states. The average annual income among one-percenters in the state of $1.5 million is also higher than in most states. Across populations, incomes tend to rise with educational attainment, and in New Hampshire, 36.8% of adults have a bachelor’s degree, compared to the 32.6% share of adults nationwide.
[in-text-ad-2]

30. New Jersey
> Top 1% earn at least: $701,005 (4th highest)
> Avg. income of the top 1%: $2,002,544 (7th highest)
> Share of all income earned by the 1%: 19.6% (10th highest)
> Avg. income among all tax filers: $102,186 (3rd highest)
New Jersey is one of only three states where the average annual income among taxpayers is over $100,000. It takes an annual income of over $700,000 to rank among the state’s top 1% of earners. Additionally, the top 1% cumulatively account for nearly 20% of all income in the state.
The state’s wealthiest residents also pay more in income taxes, accounting for nearly 35% of all federal income tax payments.

31. New Mexico
> Top 1% earn at least: $341,111 (3rd lowest)
> Avg. income of the top 1%: $840,305 (3rd lowest)
> Share of all income earned by the 1%: 14.0% (6th lowest)
> Avg. income among all tax filers: $60,109 (3rd lowest)
New Mexico is one of the lowest-income states in the country, with the average taxpayer earning $60,109 a year. It also has one of the lowest thresholds to be among the top 1% of earners among states at $341,111. In the vast majority of states, an annual income of at least $400,000 is needed to be among the top 1%.
[in-text-ad]

32. New York
> Top 1% earn at least: $702,559 (3rd highest)
> Avg. income of the top 1%: $2,894,085 (2nd highest)
> Share of all income earned by the 1%: 29.3% (the highest)
> Avg. income among all tax filers: $98,941 (4th highest)
New York is one of only four states where it takes over $700,000 in annual income to be among the top 1% of earners. The state’s high threshold is driven up by New York City, where many of the world’s wealthiest have homes and there is a concentration of high paying jobs. One-percenters in New York earn $2.9 million on average, and their combined earnings account for 29.3% of all income in the state. Meanwhile, the bottom quarter of earners in the state account for just 2.9% of all income.

33. North Carolina
> Top 1% earn at least: $453,976 (24th highest)
> Avg. income of the top 1%: $1,131,863 (22nd lowest)
> Share of all income earned by the 1%: 16.0% (25th lowest)
> Avg. income among all tax filers: $70,705 (17th lowest)
The top 1% of earners in North Carolina earn at least $453,976, which is near the middle of the 50 states. Collectively, the state’s top 1% of earners account for about one-third of the state’s total income, which is also in the middle of all states. Nationwide, the top 1% of earners account for 38.3% of the national’s total income.

34. North Dakota
> Top 1% earn at least: $462,352 (21st highest)
> Avg. income of the top 1%: $1,131,705 (21st lowest)
> Share of all income earned by the 1%: 14.3% (10th lowest)
> Avg. income among all tax filers: $79,305 (16th highest)
North Dakota has a more even distribution of income compared to other states. The top 25% of earners in North Dakota state account for 78.5% of the state’s total Federal income taxes paid, the lowest share of any state. The state has a lower share of households with incomes of less than $10,000 per year and a lower share of households earning more than $200,000 compared to the comparable national shares of households.
[in-text-ad-2]

35. Ohio
> Top 1% earn at least: $412,919 (12th lowest)
> Avg. income of the top 1%: $1,020,320 (10th lowest)
> Share of all income earned by the 1%: 14.8% (13th lowest)
> Avg. income among all tax filers: $68,950 (15th lowest)
It takes an annual income of at least $412,919 to be among the top 1% of earners in Ohio, a lower threshold than in most states. Across populations, incomes tend to rise with educational attainment, and in Ohio, just 29.0% of adults have a bachelor’s degree, below the 32.6% share of adults nationwide. States with a higher top 1% income threshold also tend to have higher educational attainment.

36. Oklahoma
> Top 1% earn at least: $424,529 (18th lowest)
> Avg. income of the top 1%: $1,117,765 (18th lowest)
> Share of all income earned by the 1%: 16.4% (22nd highest)
> Avg. income among all tax filers: $68,348 (11th lowest)
Among the top 1% of earners in Oklahoma — those earning at least $424,529 per year — the average annual income is $1.1 million, about 16 times the average income across all taxpayers in the state. Cumulatively, one-percenters in Oklahoma account for 16.4% of all income in the state, while the bottom 25% account for just just 4.2% of income.
[in-text-ad]

37. Oregon
> Top 1% earn at least: $465,936 (20th highest)
> Avg. income of the top 1%: $1,207,272 (25th highest)
> Share of all income earned by the 1%: 15.7% (21st lowest)
> Avg. income among all tax filers: $76,998 (20th highest)
Oregon residents must earn at least $465,936 to rank in the top 1% of earners, approximately $73,000 less than the national threshold for the 1%. The average earner in the 1% in Oregon has a reported income of $1.2 million, compared to the $1.7 million nationwide average.

38. Pennsylvania
> Top 1% earn at least: $491,997 (16th highest)
> Avg. income of the top 1%: $1,329,913 (20th highest)
> Share of all income earned by the 1%: 17.0% (19th highest)
> Avg. income among all tax filers: $78,385 (19th highest)
The average annual income among the top 1% of earners in Pennsylvania — those earning at least $465,936 per year — is $1.3 million. Meanwhile, the average annual income among all taxpayers in the state is $78,385.
Though one-percenters earn 17.0% all income in Pennsylvania, they pay over one-third of all federal income taxes in the state.

39. Rhode Island
> Top 1% earn at least: $457,372 (22nd highest)
> Avg. income of the top 1%: $1,214,783 (24th highest)
> Share of all income earned by the 1%: 15.9% (24th lowest)
> Avg. income among all tax filers: $76,632 (22nd highest)
In Rhode Island, the income floor for the top 1% of earners is $457,372, nearly $82,000 less than the national income threshold of $538,926. Rhode Island one-percenters account for 15.9% of all income in the state and 31.2% of all federal income taxes paid. By comparison, the top 1% of earners nationwide account for 20.5% of all income and 38.3% of all federal income tax.
[in-text-ad-2]

40. South Carolina
> Top 1% earn at least: $415,810 (14th lowest)
> Avg. income of the top 1%: $1,034,585 (12th lowest)
> Share of all income earned by the 1%: 15.4% (18th lowest)
> Avg. income among all tax filers: $67,102 (8th lowest)
To be one of the top 1% earners, a South Carolina resident would need to have an annual income of $415,810, the 14th lowest threshold among states. There is a steep dropoff in income between the state’s hyper-wealthy and those who are “just” very wealthy. To be in the top 5% of earners, one needs to have an income of at least $183,102.
41. South Dakota
> Top 1% earn at least: $455,582 (23rd highest)
> Avg. income of the top 1%: $1,263,238 (21st highest)
> Share of all income earned by the 1%: 17.0% (18th highest)
> Avg. income among all tax filers: $74,418 (25th highest)
South Dakota residents earning $455,582 per year or more are among the highest earning 1% in the state. The one-percenters in the state cumulatively account for 17% of all income. Meanwhile, the bottom 25% of earners account for just 0.6% of all income.
[in-text-ad]

42. Tennessee
> Top 1% earn at least: $441,531 (24th lowest)
> Avg. income of the top 1%: $1,227,645 (23rd highest)
> Share of all income earned by the 1%: 17.8% (14th highest)
> Avg. income among all tax filers: $68,944 (14th lowest)
Tennessee residents who earn at least $441,531 are among the top 1% of earners in the state. The average income among the state’s one-percenters is $1.2 million, a higher average than in most states. Cumulatively, the state’s one-percenters earn 17.8% of all income. Meanwhile, the bottom 25% earn just 0.3% of all income.

43. Texas
> Top 1% earn at least: $550,748 (10th highest)
> Avg. income of the top 1%: $1,806,554 (9th highest)
> Share of all income earned by the 1%: 22.1% (8th highest)
> Avg. income among all tax filers: $81,734 (15th highest)
While the average annual income among all tax filers in Texas is about the same as the average nationwide — at $81,734 compared to $82,535, respectively — the top 1% of earners are among the wealthiest of any state. The income threshold for the top 1% in Texas is $550,748, the 10th highest of any state. The average income of those in the top 1% is $1.8 million, higher than the $1.7 million national average and the ninth highest of any state.

44. Utah
> Top 1% earn at least: $469,198 (19th highest)
> Avg. income of the top 1%: $1,380,676 (18th highest)
> Share of all income earned by the 1%: 17.5% (16th highest)
> Avg. income among all tax filers: $78,979 (17th highest)
The income threshold to rank in the top 1% of earners in Utah is $469,198, about $70,000 less than the national threshold. The average one-percenter in Utah earns $1.4 million a year, less than the $1.7 million national average.
[in-text-ad-2]

45. Vermont
> Top 1% earn at least: $407,661 (11th lowest)
> Avg. income of the top 1%: $1,024,754 (11th lowest)
> Share of all income earned by the 1%: 14.4% (11th lowest)
> Avg. income among all tax filers: $71,068 (18th lowest)
While Vermont is one of the most educated states — 38.7% of adults have a bachelor’s degree, the seventh largest share — incomes in the state are relatively low. The average tax filer earns $71,068 a year, approximately $11,000 less than the national average. To qualify for the top 1%, an individual would need to make at least $407,661 a year, about $131,000 less than the national cutoff for the 1%.

46. Virginia
> Top 1% earn at least: $529,094 (12th highest)
> Avg. income of the top 1%: $1,390,139 (17th highest)
> Share of all income earned by the 1%: 15.7% (22nd lowest)
> Avg. income among all tax filers: $88,486 (10th highest)
While Virginia is one of the wealthiest states — the average income among tax filers is $88,486 compared to a national average of $82,535 — the threshold for the 1% is lower than it is for the United States as a whole. The income floor for the 1% in Virginia is $529,094, approximately $10,000 less than the national figure of $538,926.
[in-text-ad]

47. Washington
> Top 1% earn at least: $585,748 (6th highest)
> Avg. income of the top 1%: $1,756,011 (10th highest)
> Share of all income earned by the 1%: 18.7% (13th highest)
> Avg. income among all tax filers: $94,129 (6th highest)
Washington is one of the wealthiest states in the country. The average annual income among tax filers is $94,129, about $12,000 more than the national average income and sixth highest of any state. To be considered in the top 1% of earners, individuals must have a reported income of at least $585,748 — more than the national average of $538,926 and the sixth highest threshold of any state.

48. West Virginia
> Top 1% earn at least: $318,831 (the lowest)
> Avg. income of the top 1%: $651,628 (the lowest)
> Share of all income earned by the 1%: 11.1% (the lowest)
> Avg. income among all tax filers: $58,481 (2nd lowest)
West Virginia is one of the poorest states in the country. Some 17.8% of residents live in poverty, the fourth highest poverty rate nationwide, and the average tax filer has a reported income of $58,481, the second lowest of any state. To be considered among the top 1% of earners in West Virginia, individuals need an income of $318,831 — approximately $220,000 less than the national figure and the lowest threshold of any state.

49. Wisconsin
> Top 1% earn at least: $428,490 (19th lowest)
> Avg. income of the top 1%: $1,125,867 (20th lowest)
> Share of all income earned by the 1%: 15.2% (15th lowest)
> Avg. income among all tax filers: $74,199 (22nd lowest)
In Wisconsin, individuals need to earn at $428,490 to rank in the top 1% of earners, about $110,000 less than the national threshold of $538,926. The average annual income among tax filers in the top 1% is $1.1 million, far less than the $1.7 million national figure.
[in-text-ad-2]

50. Wyoming
> Top 1% earn at least: $478,292 (17th highest)
> Avg. income of the top 1%: $2,501,169 (4th highest)
> Share of all income earned by the 1%: 27.6% (3rd highest)
> Avg. income among all tax filers: $90,663 (7th highest)
To rank in the top 1% of earners in Wisconsin, individuals need to make $478,292 a year — approximately $60,000 less than the national threshold of $538,926. While the threshold is lower, the state’s one-percenters are wealthier than the top 1% of earners in most states. The average one-percenter in Wyoming earns $2.5 million a year, far more than the $1.7 million national average and the fourth most of any state.
Methodology
To determine how much you need to make to be in the 1% in every state, 24/7 Wall St. reviewed adjusted gross income percentile data for the 2017 tax year from the IRS. We also calculated the average incomes and average income taxes for earners in the top 1% using total adjusted gross income, total federal income taxes, and number of returns data from the IRS.
All income data was adjusted for inflation using consumer price index data for 2017 and 2019 from the U.S. Bureau of Labor Statistics.
Supplemental data on median income for all earners 16 and over, the percentage of adults with at least a bachelor’s degree, and the poverty rate came from the U.S. Census Bureau’s 2018 American Community Survey.
Retirement can be daunting, but it doesn’t need to be.
Imagine having an expert in your corner to help you with your financial goals. Someone to help you determine if you’re ahead, behind, or right on track. With SmartAsset, that’s not just a dream—it’s reality. This free tool connects you with pre-screened financial advisors who work in your best interests. It’s quick, it’s easy, so take the leap today and start planning smarter!
Don’t waste another minute; get started right here and help your retirement dreams become a retirement reality.
Thank you for reading! Have some feedback for us?
Contact the 24/7 Wall St. editorial team.