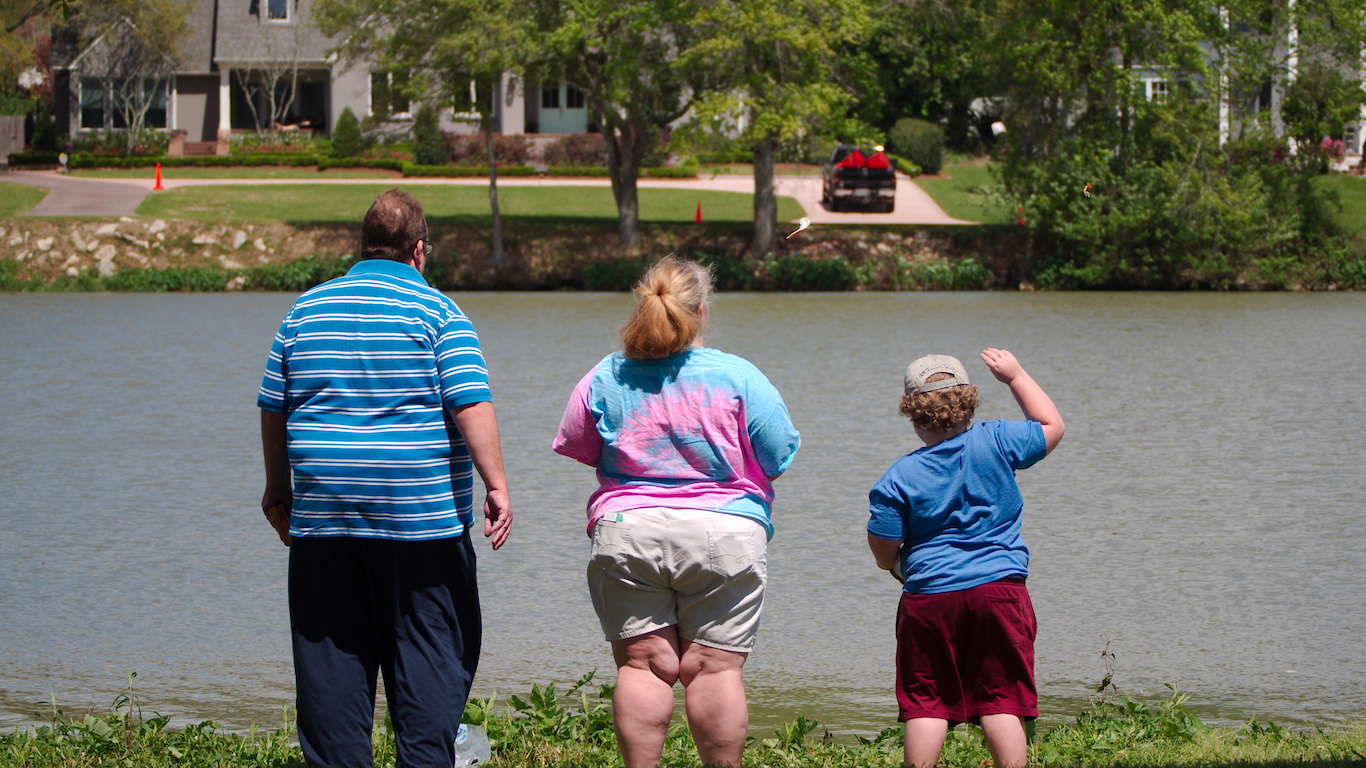
Obesity has been a major health problem in the United States for decades, and it’s only getting worse. The prevalence of obesity in 2018 was 42.4%, up from 30.5% in 2000, according to the Centers for Disease Control and Prevention (CDC).
Almost half of adults in the U.S. are projected to be obese by 2030, according to estimates published in December 2019 in the New England Journal of Medicine. Nearly one in four people will be morbidly obese, meaning carrying about 100 pounds over one’s normal body weight.
Health experts have pointed out several lifestyle factors contributing to the excess weight problem, among them a sedentary lifestyle and the consumption of high-calorie diets, including large sugary beverages — here are 45 popular fast-food single items with more than 1,000 calories.
24/7 Tempo analyzed county-level data from the 2020 County Health Rankings & Roadmaps report (CHR) to determine the most obese city in every state. We aggregated county-level statistics to metropolitan statistical areas.
Low income may be one factor that accounts for the high obesity rate in some metro areas. People with lower incomes are less able to afford a healthy lifestyle and have less access to healthy foods or gyms. Only 11 of the cities with the highest obesity rates on this list have a poverty rate lower than that of their respective state.
Though the underlying causes of obesity are many, some within one’s control and others, like genetics, not, the health outcomes of being obese are clearer. One of them is diabetes. All but five of the most obese cities on our list have an adult diabetes rate lower than the statewide rate. Click here for 10 warning signs you may have diabetes.
Even in the states where cities have the lowest obesity rates in the country — such as Colorado and New Mexico — a quarter of the state population is obese.
Click here for the city with the highest obesity rate in every state
Click here to see our detailed methodology
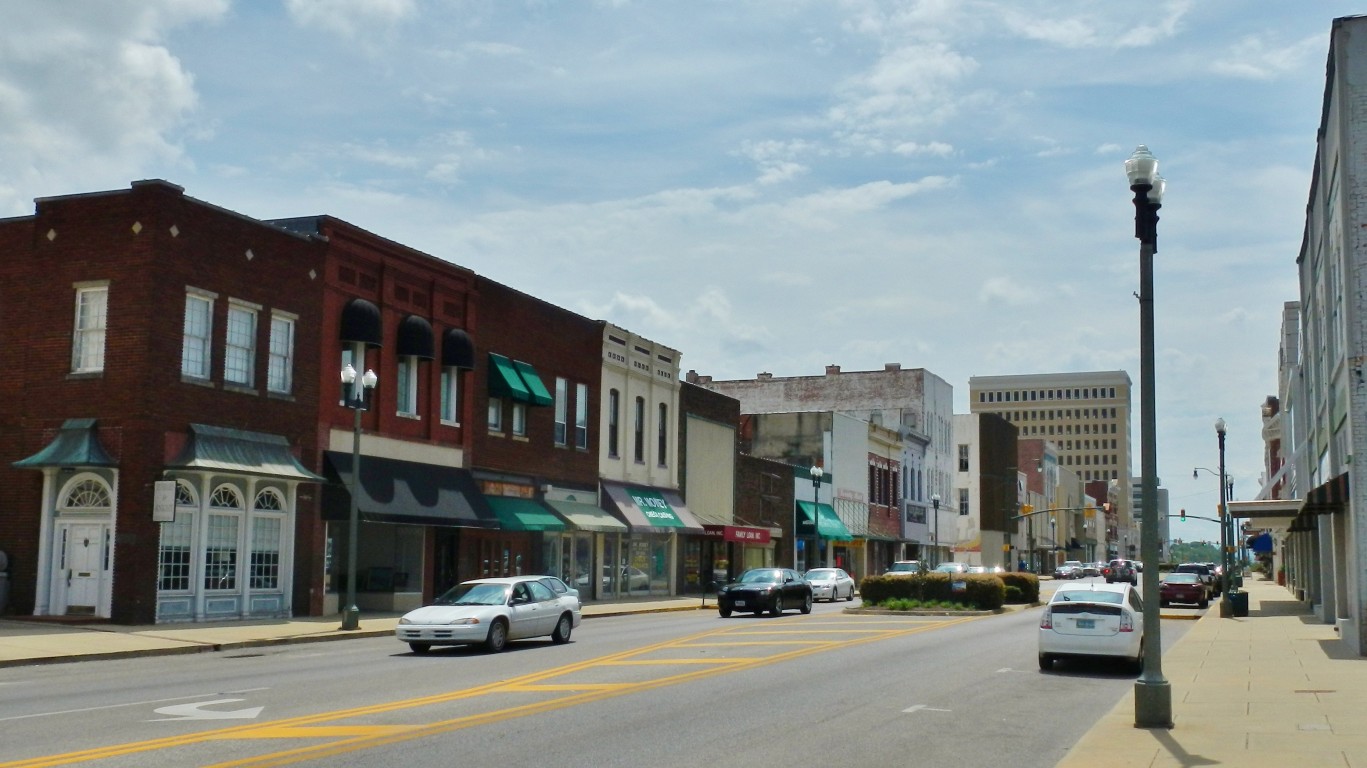
Alabama: Anniston-Oxford-Jacksonville
> Adults who are obese: 38.5% (state: 35.5%)
> Adults with diabetes: 17.5% (state: 14.2%)
> Adults who don’t exercise: 31.7% (state: 29.8%)
> Adults who report fair or poor health: 23.1% (state: 22.0%)
> Median household income: $48,156 (state: $51,734)
[in-text-ad]

Alaska: Anchorage
> Adults who are obese: 32.5% (state: 32.5%)
> Adults with diabetes: 8.0% (state: 7.9%)
> Adults who don’t exercise: 18.7% (state: 20.0%)
> Adults who report fair or poor health: 14.5% (state: 18.1%)
> Median household income: $80,676 (state: $75,463)
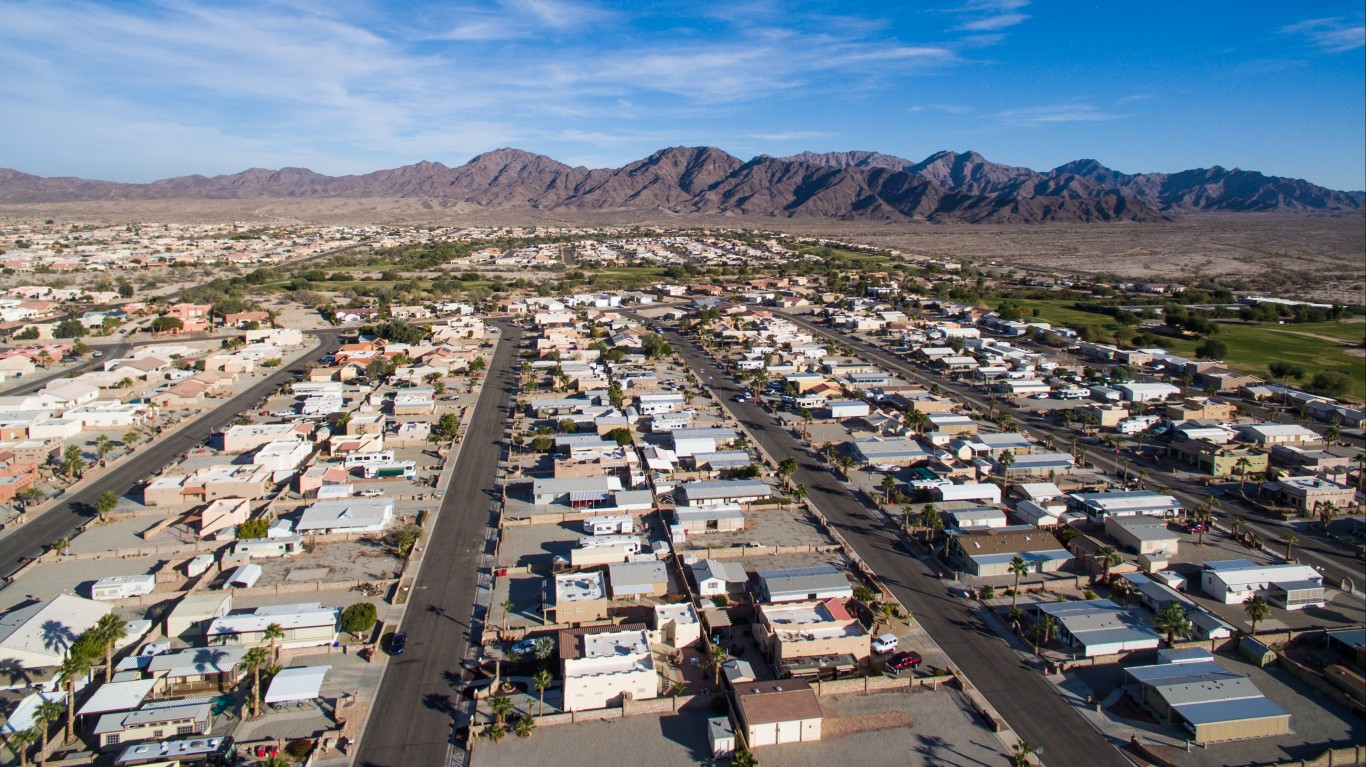
Arizona: Yuma
> Adults who are obese: 36.9% (state: 27.5%)
> Adults with diabetes: 14.1% (state: 9.7%)
> Adults who don’t exercise: 26.3% (state: 21.8%)
> Adults who report fair or poor health: 22.7% (state: 18.6%)
> Median household income: $46,419 (state: $62,055)
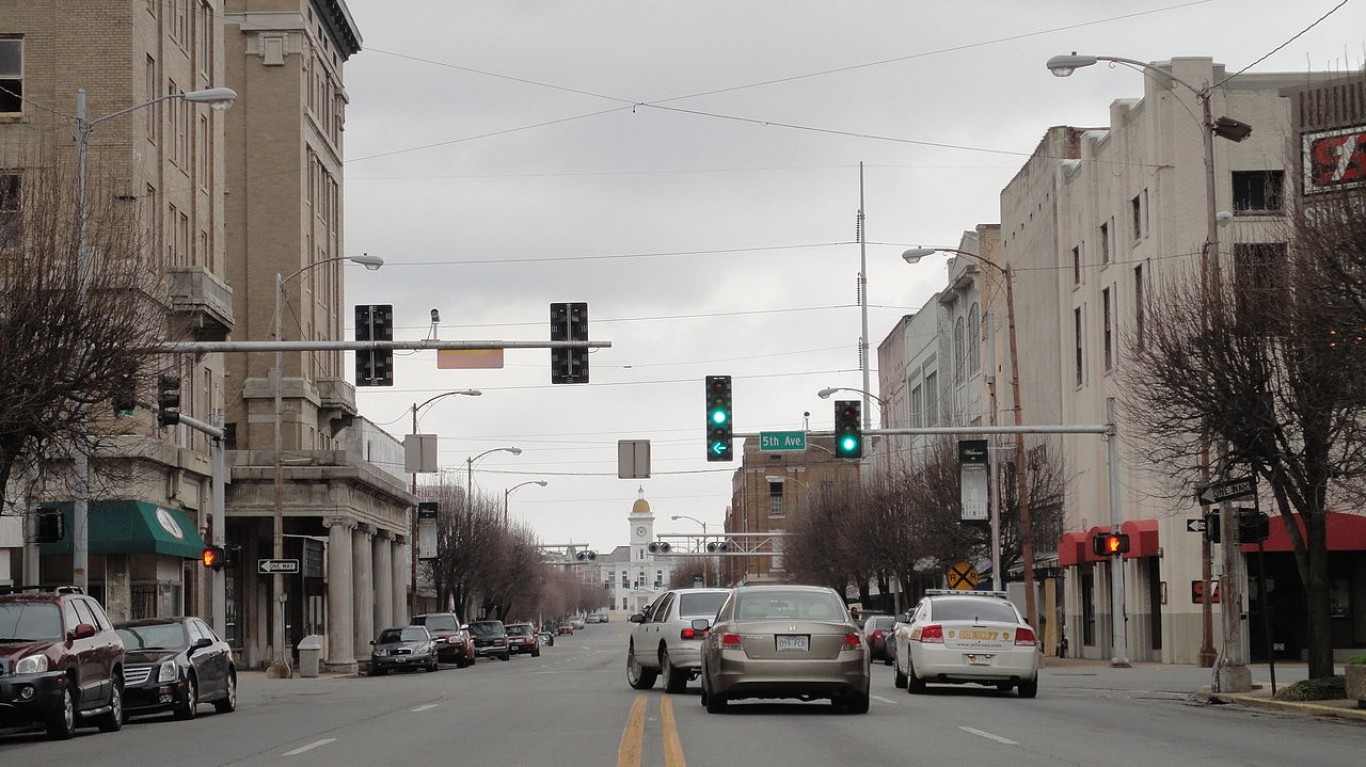
Arkansas: Pine Bluff
> Adults who are obese: 39.3% (state: 34.2%)
> Adults with diabetes: 15.9% (state: 13.4%)
> Adults who don’t exercise: 34.9% (state: 31.6%)
> Adults who report fair or poor health: 25.3% (state: 23.2%)
> Median household income: $41,541 (state: $48,952)
[in-text-ad-2]
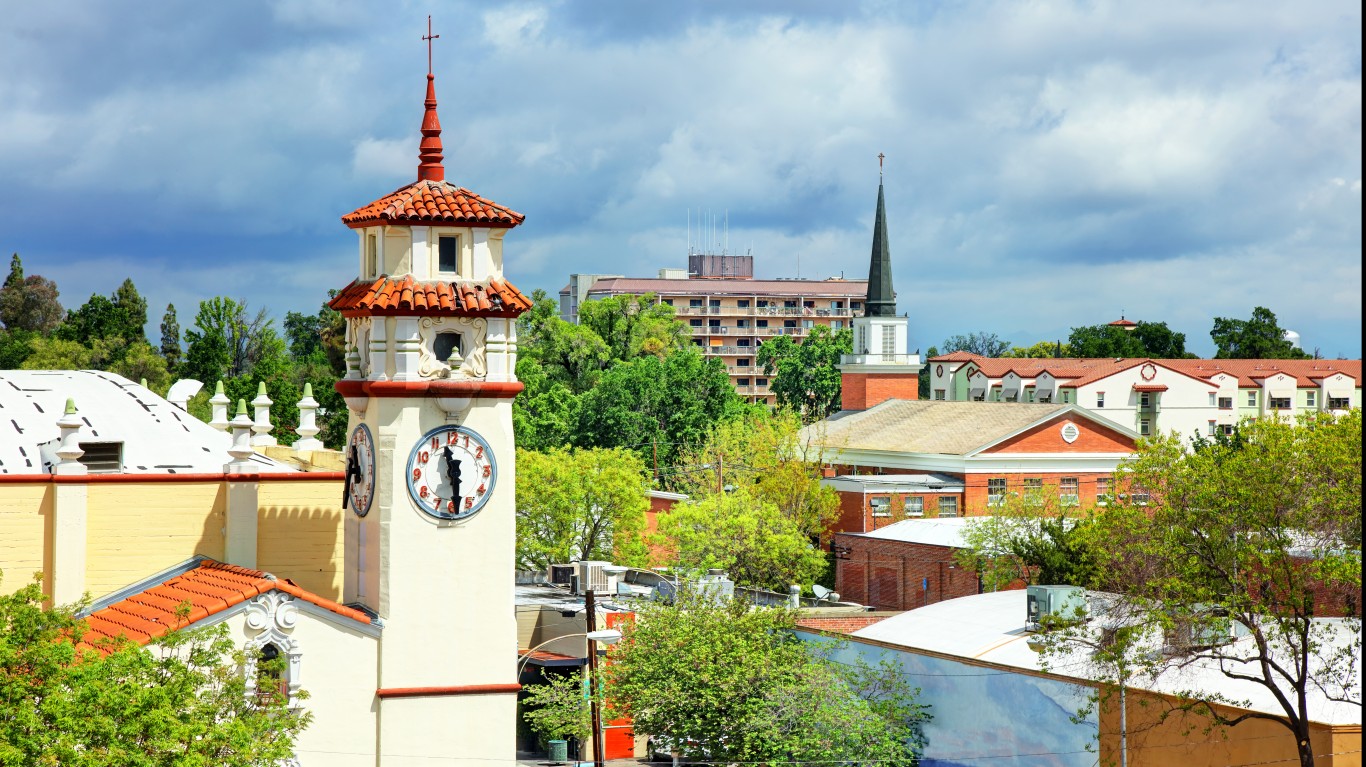
California: Visalia-Porterville
> Adults who are obese: 37.1% (state: 23.6%)
> Adults with diabetes: 9.3% (state: 8.6%)
> Adults who don’t exercise: 26.9% (state: 17.6%)
> Adults who report fair or poor health: 25.7% (state: 17.2%)
> Median household income: $57,692 (state: $80,440)

Colorado: Pueblo
> Adults who are obese: 29.4% (state: 21.8%)
> Adults with diabetes: 9.5% (state: 6.3%)
> Adults who don’t exercise: 22.1% (state: 15.5%)
> Adults who report fair or poor health: 22.5% (state: 14.5%)
> Median household income: $51,276 (state: $77,127)
[in-text-ad]

Connecticut: Norwich-New London
> Adults who are obese: 29.6% (state: 25.8%)
> Adults with diabetes: 8.8% (state: 8.9%)
> Adults who don’t exercise: 20.9% (state: 20.4%)
> Adults who report fair or poor health: 11.5% (state: 13.8%)
> Median household income: $75,633 (state: $78,833)
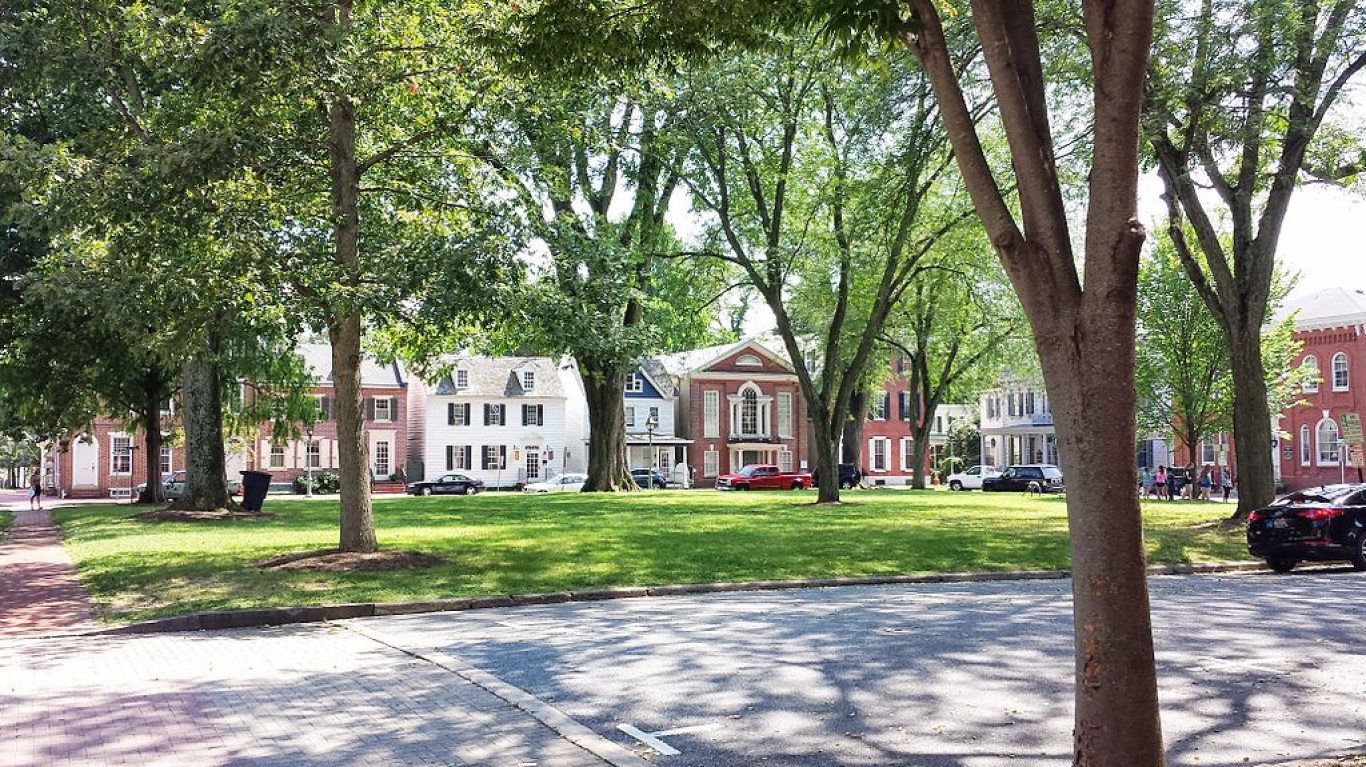
Delaware: Dover
> Adults who are obese: 35.4% (state: 30.9%)
> Adults with diabetes: 13.1% (state: 11.5%)
> Adults who don’t exercise: 31.2% (state: 27.7%)
> Adults who report fair or poor health: 19.0% (state: 18.0%)
> Median household income: $58,001 (state: $70,176)

Florida: Lakeland-Winter Haven
> Adults who are obese: 37.1% (state: 26.6%)
> Adults with diabetes: 14.9% (state: 10.6%)
> Adults who don’t exercise: 28.8% (state: 25.9%)
> Adults who report fair or poor health: 20.7% (state: 17.5%)
> Median household income: $51,833 (state: $59,227)
[in-text-ad-2]

Georgia: Albany
> Adults who are obese: 40.9% (state: 32.0%)
> Adults with diabetes: 19.2% (state: 11.8%)
> Adults who don’t exercise: 29.9% (state: 27.5%)
> Adults who report fair or poor health: 22.6% (state: 18.0%)
> Median household income: $40,625 (state: $61,980)

Hawaii: Kahului-Wailuku-Lahaina
> Adults who are obese: 24.0% (state: 23.7%)
> Adults with diabetes: 9.9% (state: 10.3%)
> Adults who don’t exercise: 20.0% (state: 20.5%)
> Adults who report fair or poor health: 12.9% (state: 14.2%)
> Median household income: $80,754 (state: $83,102)
[in-text-ad]
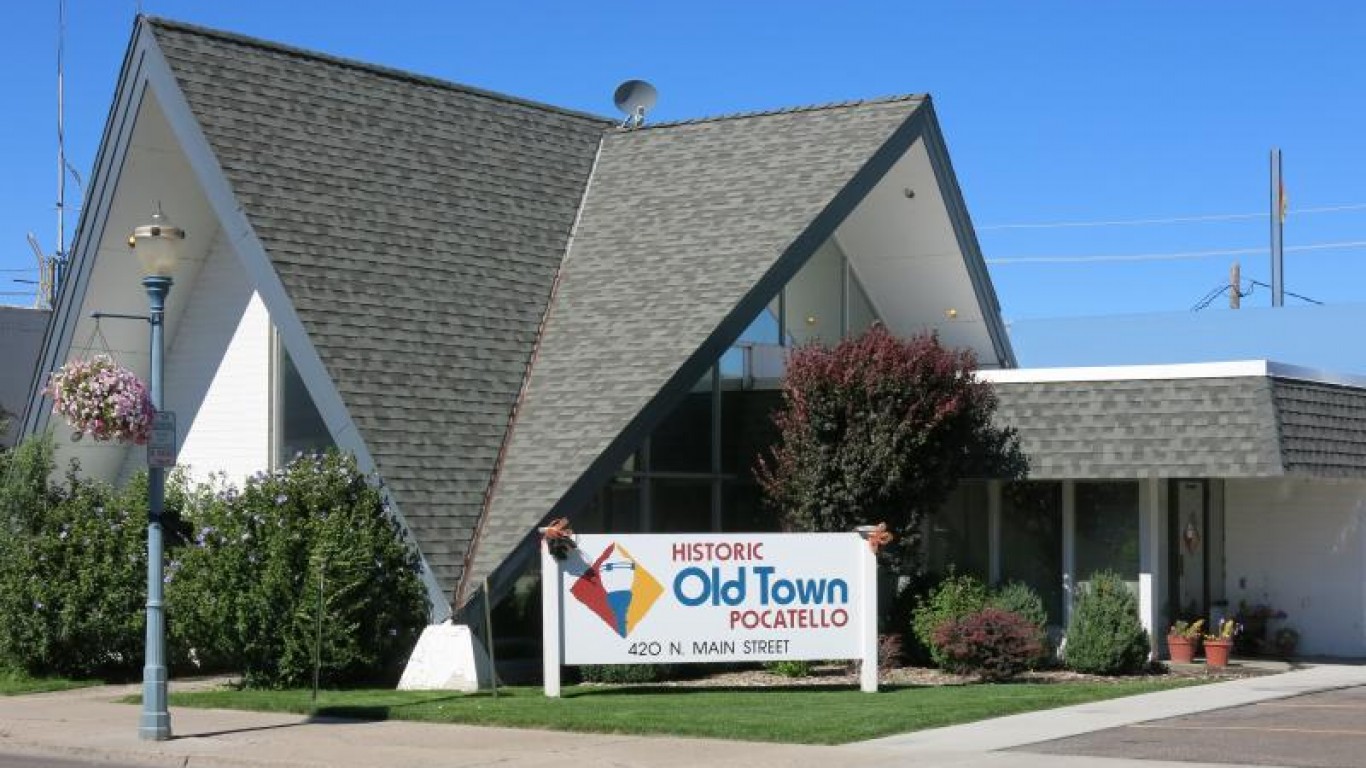
Idaho: Pocatello
> Adults who are obese: 32.0% (state: 29.3%)
> Adults with diabetes: 9.4% (state: 8.9%)
> Adults who don’t exercise: 20.8% (state: 20.8%)
> Adults who report fair or poor health: 14.9% (state: 14.6%)
> Median household income: $51,612 (state: $60,999)

Illinois: Kankakee
> Adults who are obese: 41.2% (state: 29.7%)
> Adults with diabetes: 10.8% (state: 9.9%)
> Adults who don’t exercise: 36.5% (state: 22.3%)
> Adults who report fair or poor health: 16.4% (state: 17.2%)
> Median household income: $60,923 (state: $69,187)

Indiana: Michigan City-La Porte
> Adults who are obese: 36.9% (state: 33.4%)
> Adults with diabetes: 12.9% (state: 11.9%)
> Adults who don’t exercise: 30.1% (state: 26.7%)
> Adults who report fair or poor health: 18.3% (state: 19.8%)
> Median household income: $56,019 (state: $57,603)
[in-text-ad-2]

Iowa: Sioux City
> Adults who are obese: 35.8% (state: 33.2%)
> Adults with diabetes: 10.3% (state: 9.7%)
> Adults who don’t exercise: 27.6% (state: 23.7%)
> Adults who report fair or poor health: 17.8% (state: 14.5%)
> Median household income: $60,132 (state: $61,691)
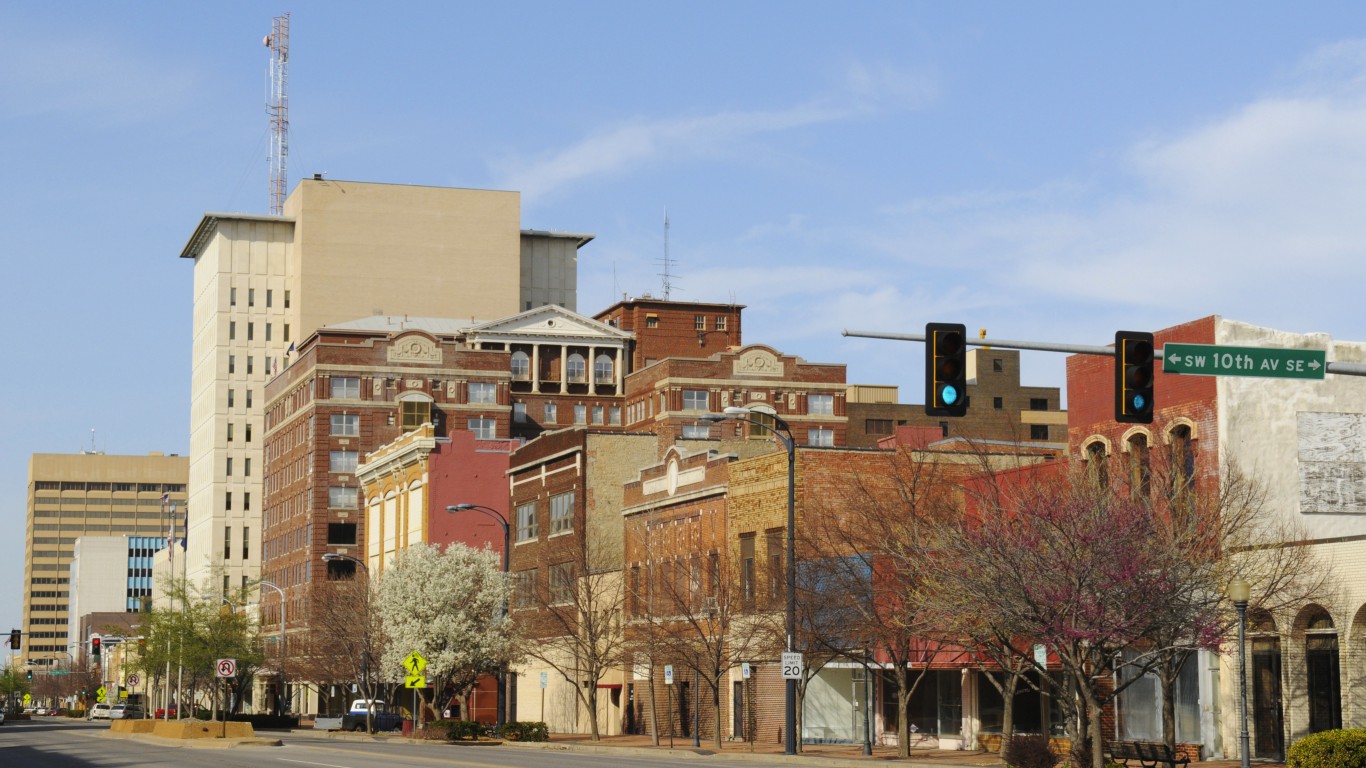
Kansas: Topeka
> Adults who are obese: 36.7% (state: 33.2%)
> Adults with diabetes: 11.3% (state: 10.1%)
> Adults who don’t exercise: 25.2% (state: 24.8%)
> Adults who report fair or poor health: 16.2% (state: 16.1%)
> Median household income: $59,567 (state: $62,087)
[in-text-ad]

Kentucky: Elizabethtown-Fort Knox
> Adults who are obese: 37.4% (state: 33.8%)
> Adults with diabetes: 13.0% (state: 12.6%)
> Adults who don’t exercise: 31.4% (state: 28.6%)
> Adults who report fair or poor health: 20.5% (state: 23.9%)
> Median household income: $55,246 (state: $52,295)
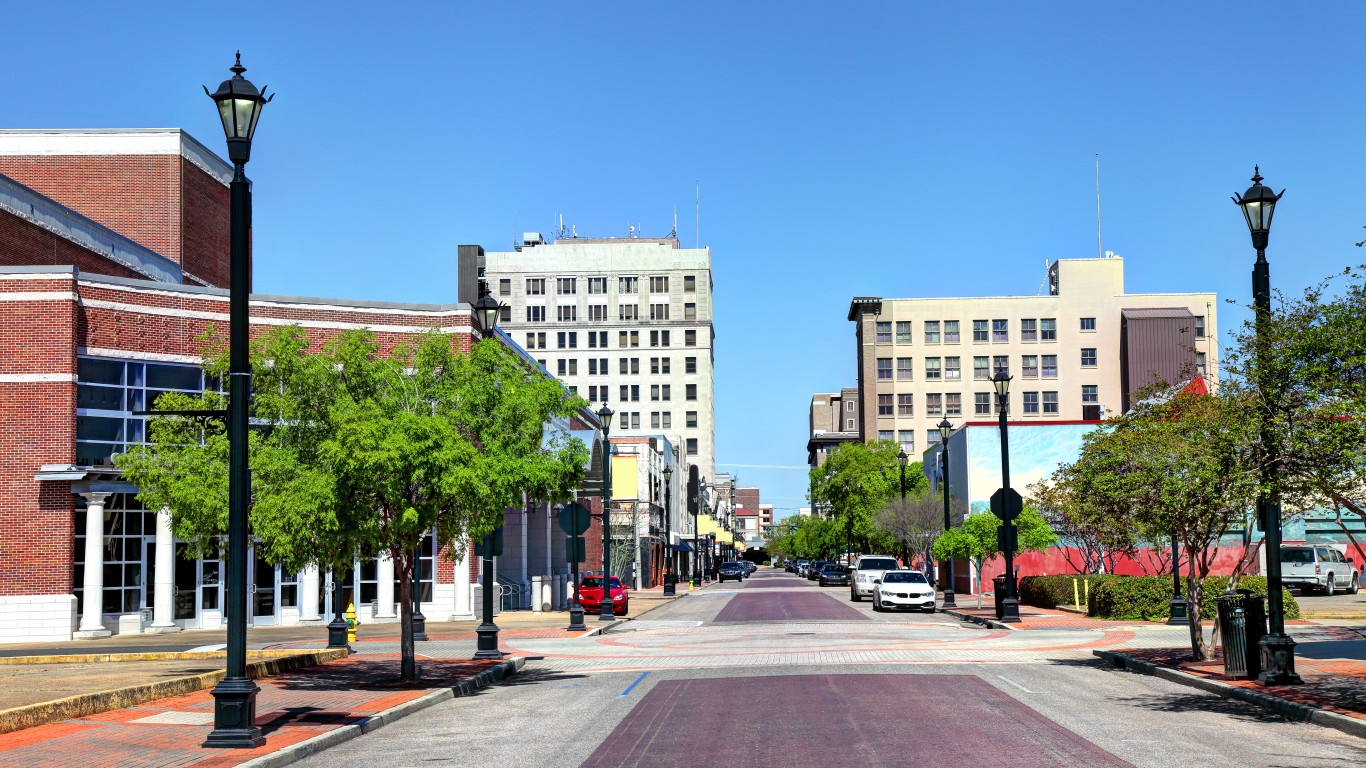
Louisiana: Alexandria
> Adults who are obese: 41.1% (state: 35.4%)
> Adults with diabetes: 15.4% (state: 12.8%)
> Adults who don’t exercise: 32.2% (state: 29.2%)
> Adults who report fair or poor health: 21.7% (state: 22.0%)
> Median household income: $50,553 (state: $51,073)

Maine: Lewiston-Auburn
> Adults who are obese: 33.9% (state: 29.9%)
> Adults with diabetes: 12.2% (state: 10.2%)
> Adults who don’t exercise: 24.7% (state: 21.6%)
> Adults who report fair or poor health: 13.4% (state: 15.0%)
> Median household income: $63,813 (state: $58,924)
[in-text-ad-2]

Maryland: Hagerstown-Martinsburg
> Adults who are obese: 36.5% (state: 31.0%)
> Adults with diabetes: 13.3% (state: 10.7%)
> Adults who don’t exercise: 28.2% (state: 22.4%)
> Adults who report fair or poor health: 17.7% (state: 14.9%)
> Median household income: $60,095 (state: $86,738)

Massachusetts: Springfield
> Adults who are obese: 29.2% (state: 24.7%)
> Adults with diabetes: 9.7% (state: 8.9%)
> Adults who don’t exercise: 23.4% (state: 21.3%)
> Adults who report fair or poor health: 16.8% (state: 14.4%)
> Median household income: $62,346 (state: $85,843)
[in-text-ad]

Michigan: Midland
> Adults who are obese: 38.0% (state: 32.0%)
> Adults with diabetes: 12.3% (state: 10.8%)
> Adults who don’t exercise: 21.0% (state: 23.4%)
> Adults who report fair or poor health: 13.2% (state: 17.4%)
> Median household income: $69,872 (state: $59,584)

Minnesota: Mankato-North Mankato
> Adults who are obese: 31.8% (state: 27.9%)
> Adults with diabetes: 7.9% (state: 8.3%)
> Adults who don’t exercise: 19.4% (state: 20.1%)
> Adults who report fair or poor health: 12.8% (state: 12.1%)
> Median household income: $63,126 (state: $74,593)

Mississippi: Jackson
> Adults who are obese: 37.3% (state: 36.8%)
> Adults with diabetes: 13.3% (state: 14.6%)
> Adults who don’t exercise: 30.2% (state: 31.9%)
> Adults who report fair or poor health: 20.2% (state: 24.1%)
> Median household income: $52,426 (state: $45,792)
[in-text-ad-2]

Missouri: St. Joseph
> Adults who are obese: 37.4% (state: 32.2%)
> Adults with diabetes: 12.1% (state: 11.6%)
> Adults who don’t exercise: 30.9% (state: 25.8%)
> Adults who report fair or poor health: 19.7% (state: 18.0%)
> Median household income: $50,425 (state: $57,409)

Montana: Great Falls
> Adults who are obese: 27.3% (state: 25.8%)
> Adults with diabetes: 8.9% (state: 8.1%)
> Adults who don’t exercise: 24.5% (state: 21.6%)
> Adults who report fair or poor health: 16.1% (state: 14.7%)
> Median household income: $51,227 (state: $57,153)
[in-text-ad]
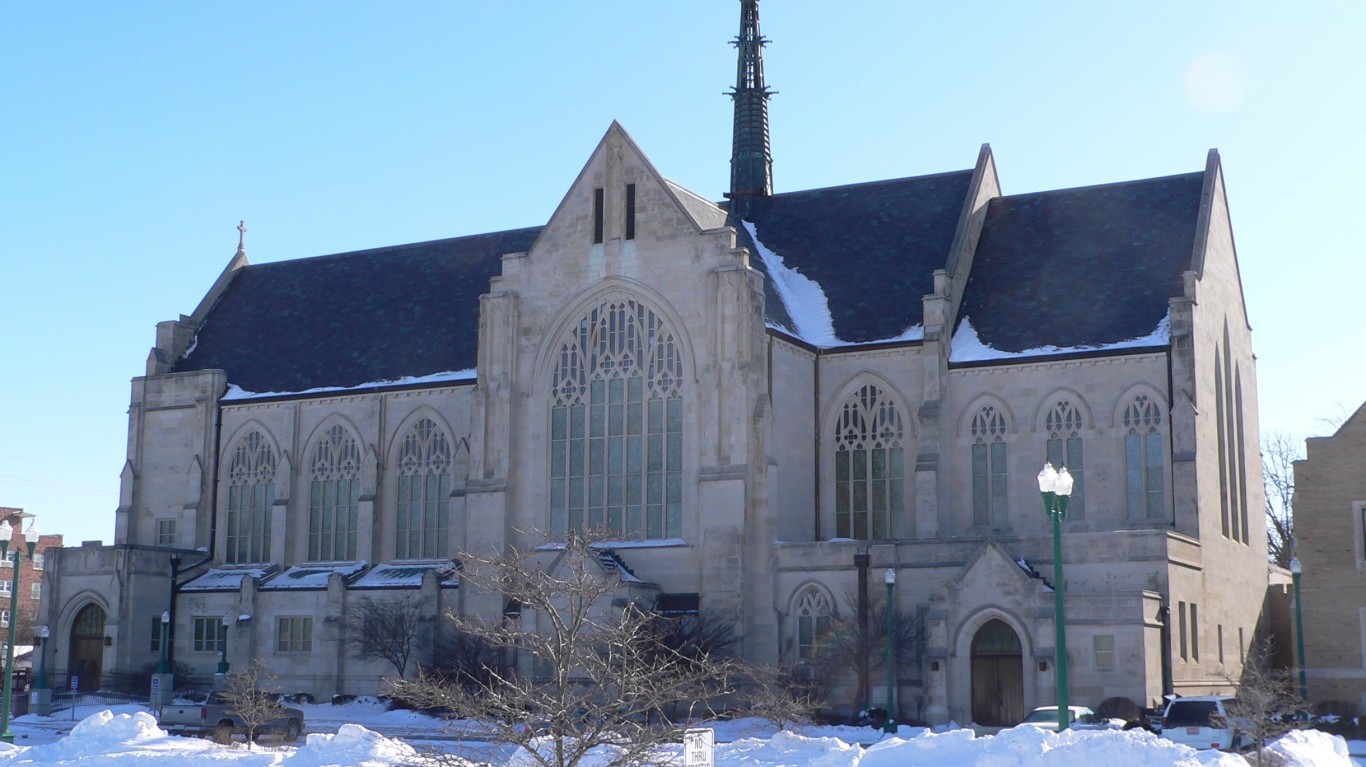
Nebraska: Grand Island
> Adults who are obese: 35.0% (state: 32.2%)
> Adults with diabetes: 10.8% (state: 9.4%)
> Adults who don’t exercise: 27.9% (state: 23.3%)
> Adults who report fair or poor health: 16.3% (state: 14.4%)
> Median household income: $55,907 (state: $63,229)
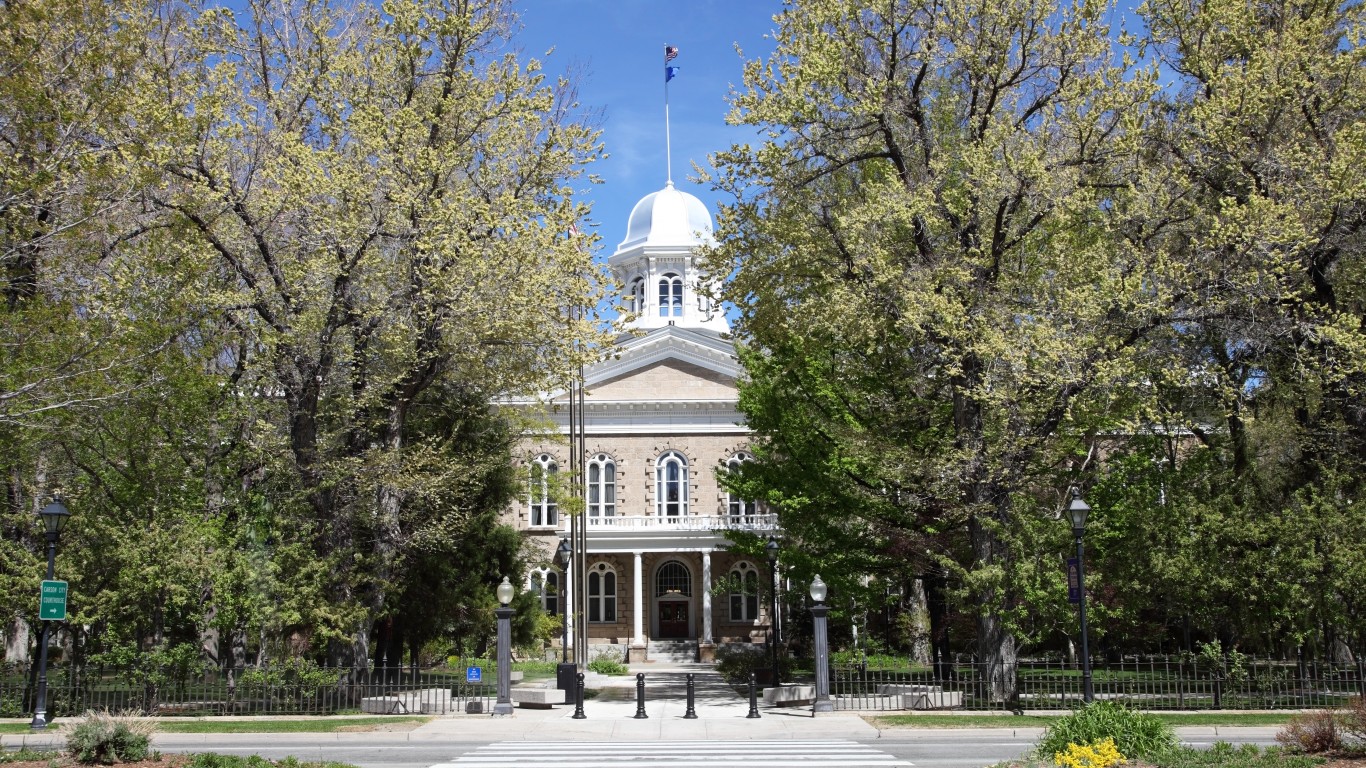
Nevada: Carson City
> Adults who are obese: 28.3% (state: 25.7%)
> Adults with diabetes: 11.1% (state: 10.2%)
> Adults who don’t exercise: 22.3% (state: 23.1%)
> Adults who report fair or poor health: 19.8% (state: 19.9%)
> Median household income: $57,270 (state: $63,276)

New Hampshire: Manchester-Nashua
> Adults who are obese: 28.0% (state: 27.9%)
> Adults with diabetes: 9.5% (state: 9.3%)
> Adults who don’t exercise: 22.5% (state: 21.3%)
> Adults who report fair or poor health: 12.1% (state: 13.1%)
> Median household income: $83,626 (state: $77,933)
[in-text-ad-2]

New Jersey: Vineland-Bridgeton
> Adults who are obese: 35.9% (state: 26.4%)
> Adults with diabetes: 12.4% (state: 9.5%)
> Adults who don’t exercise: 31.2% (state: 26.0%)
> Adults who report fair or poor health: 22.6% (state: 17.7%)
> Median household income: $54,587 (state: $85,751)
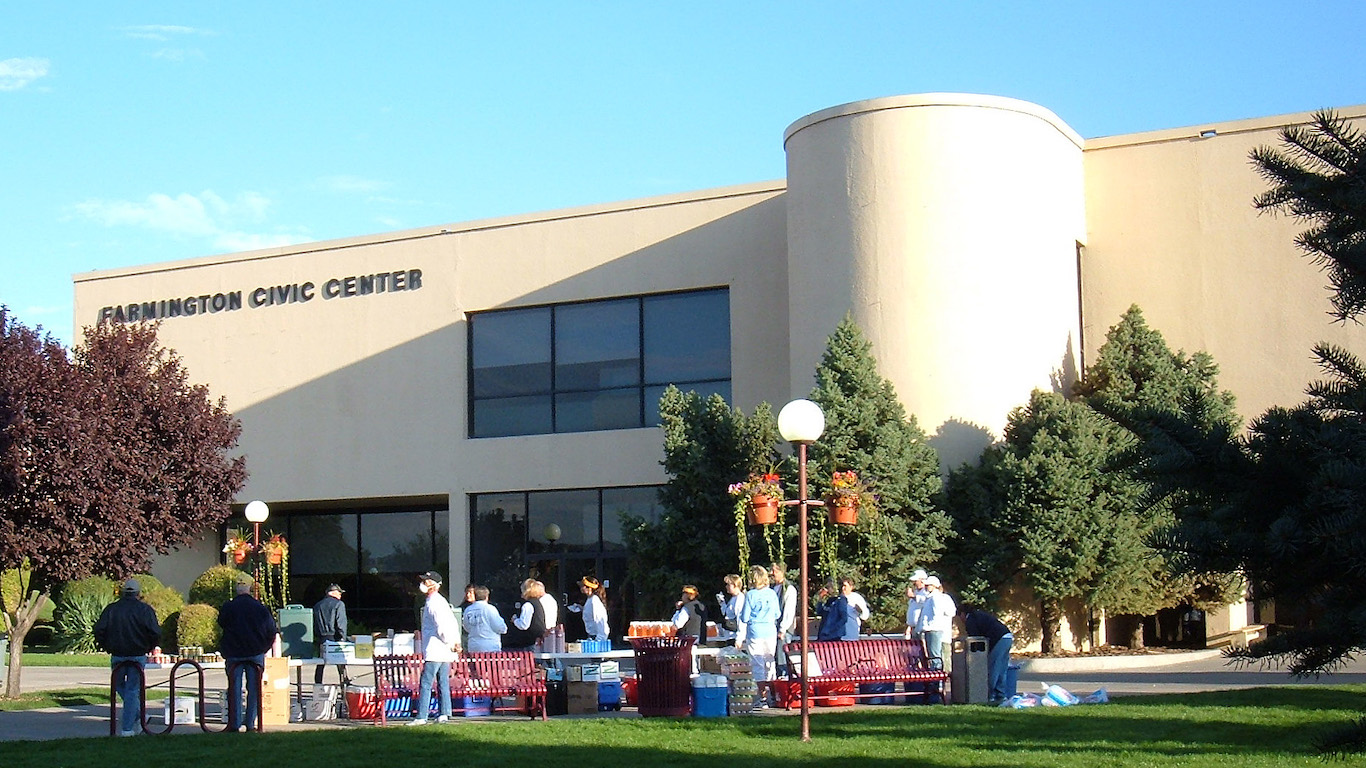
New Mexico: Farmington
> Adults who are obese: 33.2% (state: 26.6%)
> Adults with diabetes: 12.6% (state: 8.9%)
> Adults who don’t exercise: 23.9% (state: 19.7%)
> Adults who report fair or poor health: 22.0% (state: 20.6%)
> Median household income: $44,321 (state: $51,945)
[in-text-ad]

New York: Elmira
> Adults who are obese: 36.0% (state: 25.5%)
> Adults with diabetes: 11.9% (state: 9.8%)
> Adults who don’t exercise: 28.2% (state: 24.7%)
> Adults who report fair or poor health: 14.7% (state: 16.6%)
> Median household income: $60,782 (state: $72,108)

North Carolina: Rocky Mount
> Adults who are obese: 40.6% (state: 31.4%)
> Adults with diabetes: 15.4% (state: 11.2%)
> Adults who don’t exercise: 29.8% (state: 24.3%)
> Adults who report fair or poor health: 21.5% (state: 18.5%)
> Median household income: $46,466 (state: $57,341)

North Dakota: Grand Forks
> Adults who are obese: 34.0% (state: 32.7%)
> Adults with diabetes: 9.1% (state: 9.0%)
> Adults who don’t exercise: 24.2% (state: 23.9%)
> Adults who report fair or poor health: 14.5% (state: 15.1%)
> Median household income: $57,301 (state: $64,577)
[in-text-ad-2]

Ohio: Canton-Massillon
> Adults who are obese: 35.1% (state: 32.3%)
> Adults with diabetes: 12.6% (state: 11.8%)
> Adults who don’t exercise: 27.6% (state: 26.4%)
> Adults who report fair or poor health: 16.6% (state: 18.0%)
> Median household income: $55,706 (state: $58,642)

Oklahoma: Enid
> Adults who are obese: 36.2% (state: 33.7%)
> Adults with diabetes: 9.7% (state: 12.2%)
> Adults who don’t exercise: 28.6% (state: 29.3%)
> Adults who report fair or poor health: 18.5% (state: 20.8%)
> Median household income: $64,929 (state: $54,449)
[in-text-ad]
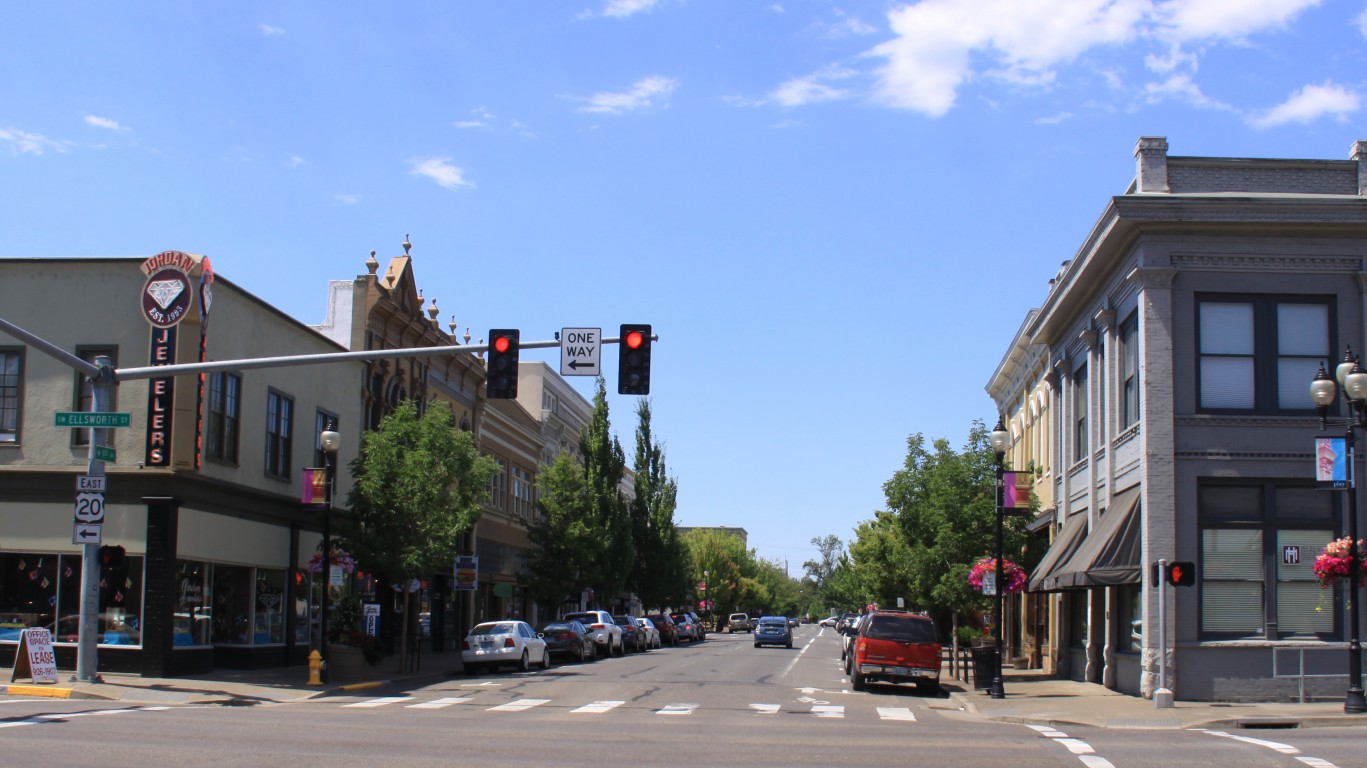
Oregon: Albany
> Adults who are obese: 36.2% (state: 28.8%)
> Adults with diabetes: 10.6% (state: 9.3%)
> Adults who don’t exercise: 21.0% (state: 17.2%)
> Adults who report fair or poor health: 14.2% (state: 16.7%)
> Median household income: $61,488 (state: $67,058)

Pennsylvania: Williamsport
> Adults who are obese: 38.1% (state: 30.3%)
> Adults with diabetes: 11.6% (state: 10.6%)
> Adults who don’t exercise: 25.8% (state: 23.1%)
> Adults who report fair or poor health: 16.2% (state: 17.5%)
> Median household income: $53,881 (state: $63,463)

Rhode Island: Providence-Warwick
> Adults who are obese: 28.5% (state: 28.1%)
> Adults with diabetes: 9.9% (state: 9.5%)
> Adults who don’t exercise: 25.2% (state: 24.4%)
> Adults who report fair or poor health: 15.1% (state: 16.4%)
> Median household income: $70,967 (state: $71,169)
[in-text-ad-2]

South Carolina: Sumter
> Adults who are obese: 38.2% (state: 32.9%)
> Adults with diabetes: 13.9% (state: 12.8%)
> Adults who don’t exercise: 28.0% (state: 25.9%)
> Adults who report fair or poor health: 22.3% (state: 18.2%)
> Median household income: $49,263 (state: $56,227)

South Dakota: Sioux Falls
> Adults who are obese: 32.2% (state: 31.8%)
> Adults with diabetes: 8.7% (state: 9.9%)
> Adults who don’t exercise: 19.8% (state: 21.3%)
> Adults who report fair or poor health: 11.1% (state: 13.4%)
> Median household income: $65,566 (state: $59,533)
[in-text-ad]

Tennessee: Jackson
> Adults who are obese: 38.0% (state: 33.2%)
> Adults with diabetes: 14.1% (state: 12.8%)
> Adults who don’t exercise: 31.6% (state: 27.2%)
> Adults who report fair or poor health: 23.1% (state: 19.7%)
> Median household income: $48,700 (state: $56,071)

Texas: Texarkana
> Adults who are obese: 43.6% (state: 30.1%)
> Adults with diabetes: 14.6% (state: 10.0%)
> Adults who don’t exercise: 39.2% (state: 24.4%)
> Adults who report fair or poor health: 20.5% (state: 20.8%)
> Median household income: $51,544 (state: $64,034)

Utah: Ogden-Clearfield
> Adults who are obese: 28.8% (state: 25.9%)
> Adults with diabetes: 7.7% (state: 7.1%)
> Adults who don’t exercise: 19.1% (state: 18.1%)
> Adults who report fair or poor health: 13.0% (state: 13.9%)
> Median household income: $79,251 (state: $75,780)
[in-text-ad-2]

Vermont: Burlington-South Burlington
> Adults who are obese: 25.6% (state: 26.3%)
> Adults with diabetes: 7.1% (state: 8.4%)
> Adults who don’t exercise: 17.2% (state: 19.1%)
> Adults who report fair or poor health: 10.7% (state: 13.1%)
> Median household income: $74,909 (state: $63,001)

Virginia: Lynchburg
> Adults who are obese: 36.0% (state: 29.8%)
> Adults with diabetes: 13.0% (state: 10.5%)
> Adults who don’t exercise: 28.9% (state: 22.9%)
> Adults who report fair or poor health: 16.6% (state: 15.8%)
> Median household income: $57,736 (state: $76,456)
[in-text-ad]
Washington: Yakima
> Adults who are obese: 34.9% (state: 27.8%)
> Adults with diabetes: 11.3% (state: 8.8%)
> Adults who don’t exercise: 22.7% (state: 17.0%)
> Adults who report fair or poor health: 23.5% (state: 15.6%)
> Median household income: $56,233 (state: $78,687)
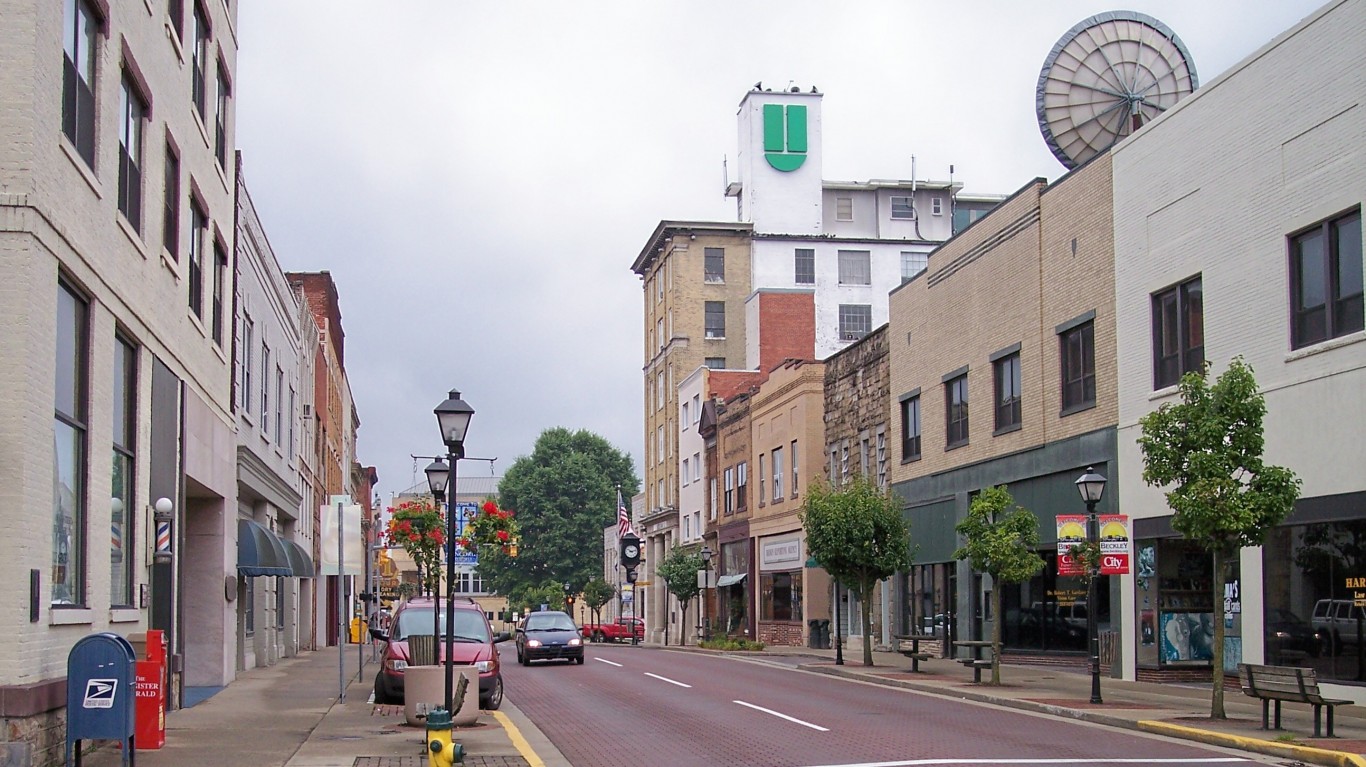
West Virginia: Beckley
> Adults who are obese: 39.4% (state: 36.7%)
> Adults with diabetes: 16.3% (state: 14.9%)
> Adults who don’t exercise: 31.2% (state: 28.9%)
> Adults who report fair or poor health: 24.6% (state: 23.9%)
> Median household income: $44,785 (state: $48,850)

Wisconsin: Oshkosh-Neenah
> Adults who are obese: 36.7% (state: 31.3%)
> Adults with diabetes: 9.0% (state: 9.3%)
> Adults who don’t exercise: 21.8% (state: 20.8%)
> Adults who report fair or poor health: 12.7% (state: 16.7%)
> Median household income: $58,347 (state: $64,168)
[in-text-ad-2]
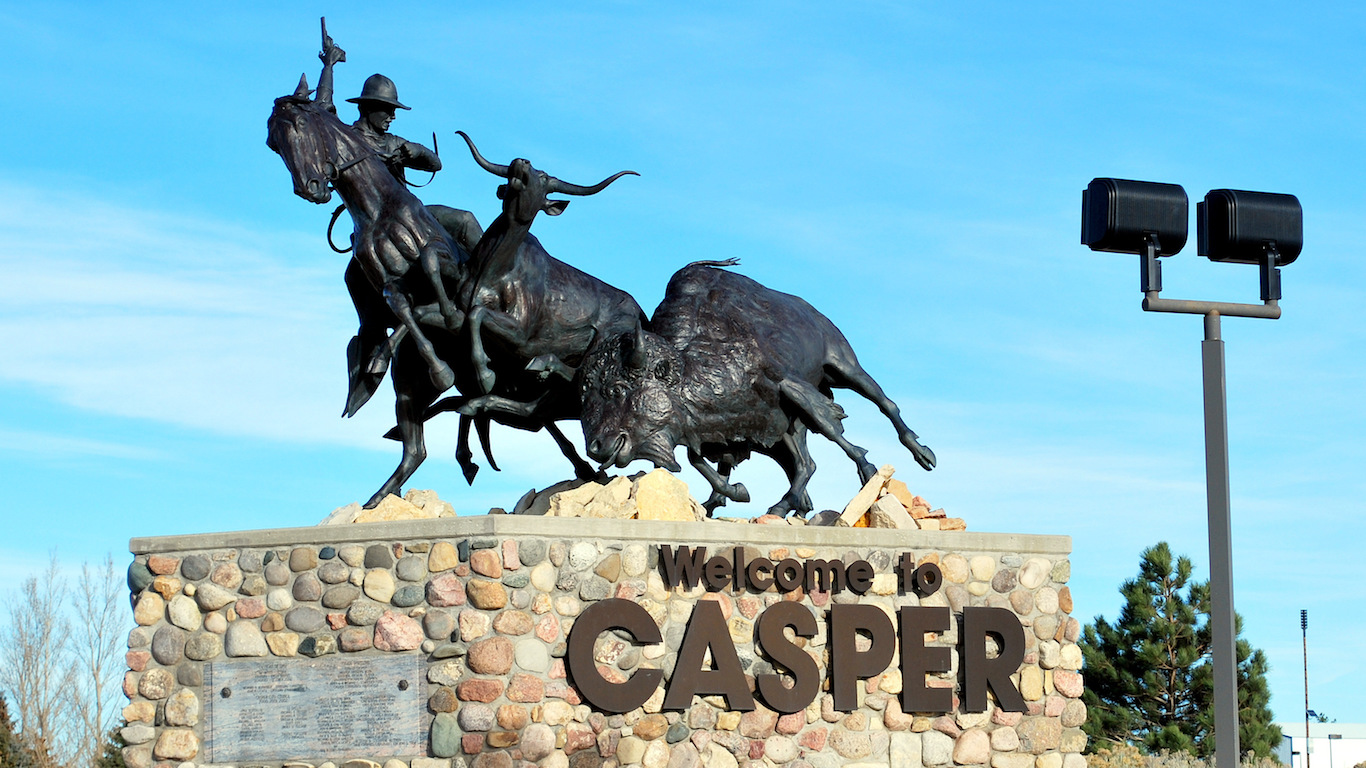
Wyoming: Casper
> Adults who are obese: 31.8% (state: 28.9%)
> Adults with diabetes: 8.5% (state: 8.7%)
> Adults who don’t exercise: 25.0% (state: 24.1%)
> Adults who report fair or poor health: 14.5% (state: 15.0%)
> Median household income: $65,034 (state: $65,003)
Methodology
To determine the most obese city in every state, 24/7 Tempo analyzed county-level data from the Robert Wood Johnson Foundation and the University of Wisconsin Population Health Institute joint program’s 2020 County Health Rankings & Roadmaps report (CHR). We aggregated county-level statistics to metropolitan statistical areas. Adult obesity is defined in the Centers for Disease Control and Prevention’s Behavioral Risk Factor Surveillance System (BRFSS) as having a body mass index (BMI) of 30kg/m2 or greater for adults 20 years and over.
The percentage of adults who have high blood pressure and who have been diagnosed with diabetes came from the BFRSS.
The share of adults who report fair or poor health, who report no physical activity on a regular basis, and who have access to places for physical activity came from the CHR aggregation. Access to exercise venues is defined as having access to local, state, and national parks, as well as public or private facilities equipped to meet demands for a wide variety of physical exercise, such as pools, gyms, and rehearsal space. All CHR data is for the most recent year available.
The poverty rate and median household income listed for metro areas and states came from the U.S. Census Bureau’s 2019 American Community Survey and are 1-year estimates.
Get Ready To Retire (Sponsored)
Start by taking a quick retirement quiz from SmartAsset that will match you with up to 3 financial advisors that serve your area and beyond in 5 minutes, or less.
Each advisor has been vetted by SmartAsset and is held to a fiduciary standard to act in your best interests.
Here’s how it works:
1. Answer SmartAsset advisor match quiz
2. Review your pre-screened matches at your leisure. Check out the advisors’ profiles.
3. Speak with advisors at no cost to you. Have an introductory call on the phone or introduction in person and choose whom to work with in the future
Thank you for reading! Have some feedback for us?
Contact the 24/7 Wall St. editorial team.
 24/7 Wall St.
 24/7 Wall St.
 24/7 Wall St.
 24/7 Wall St.

