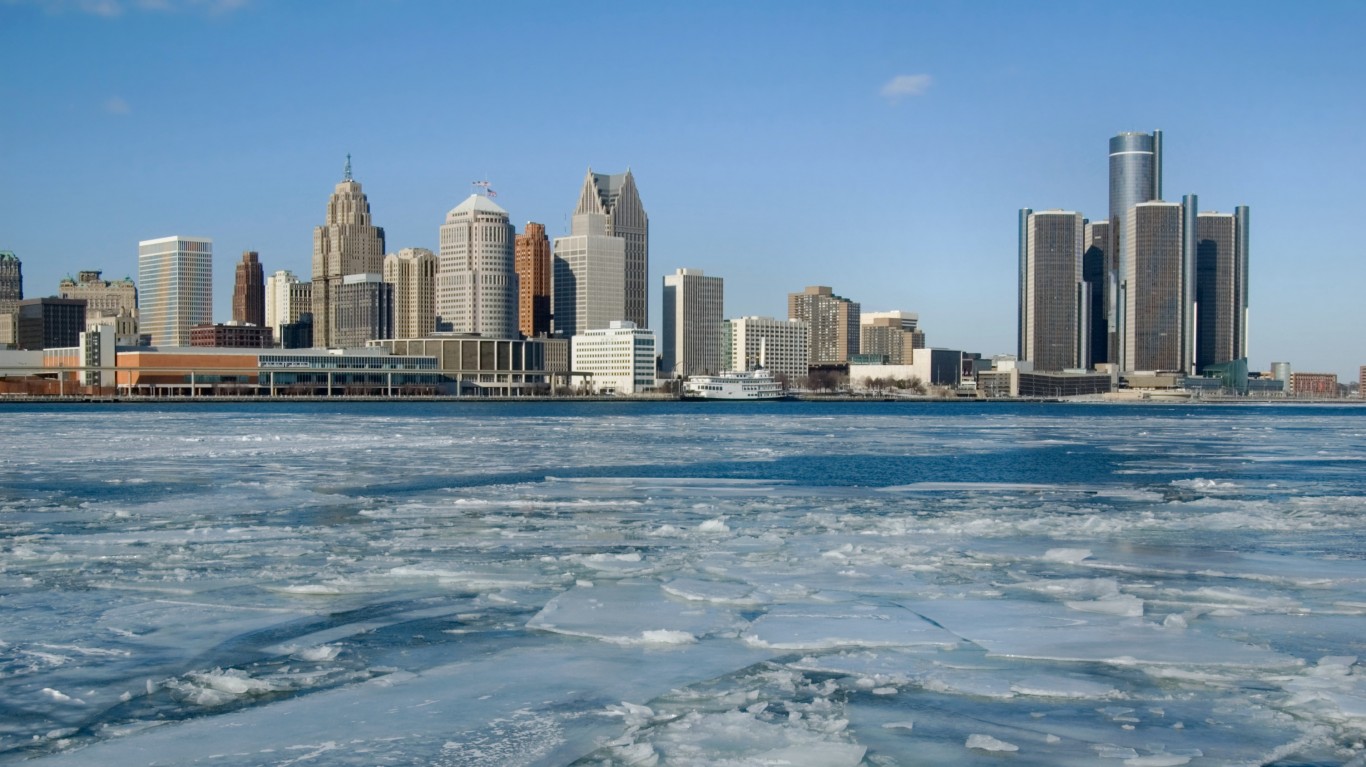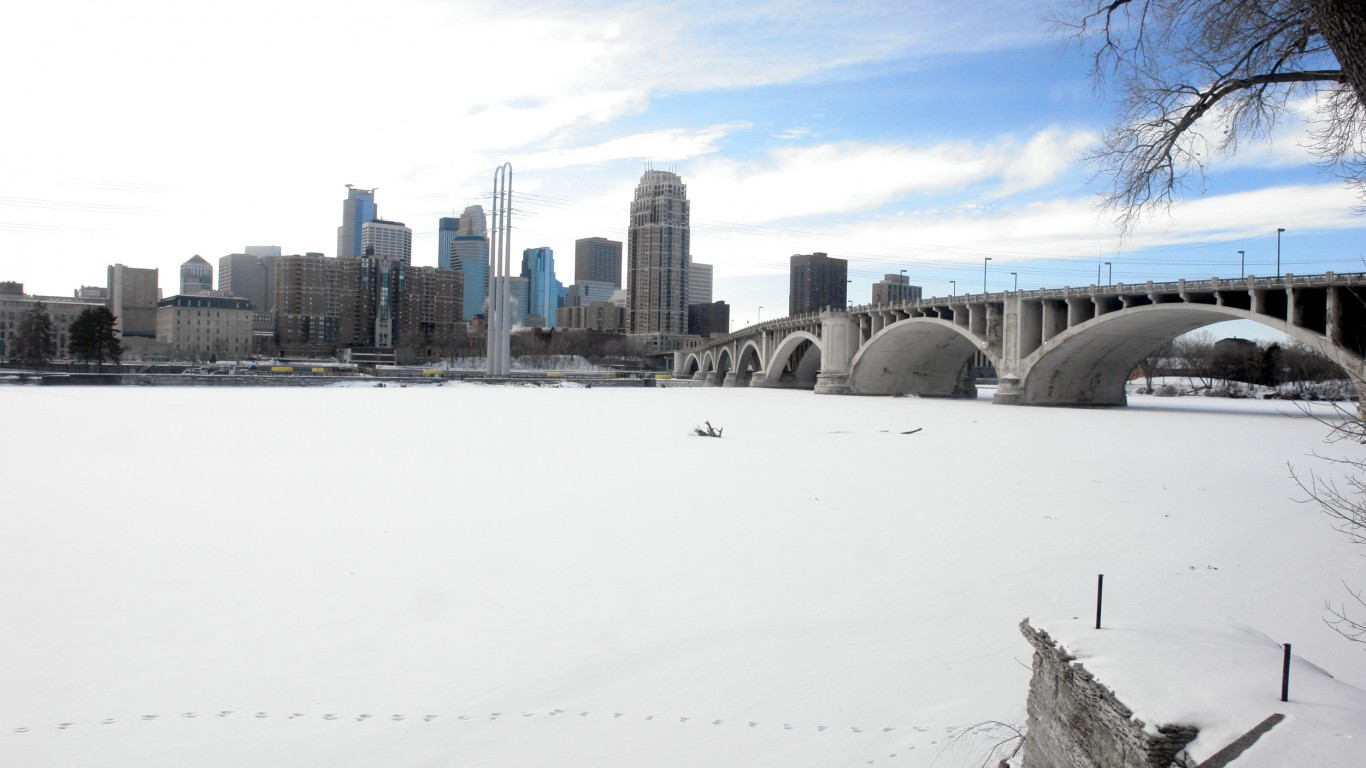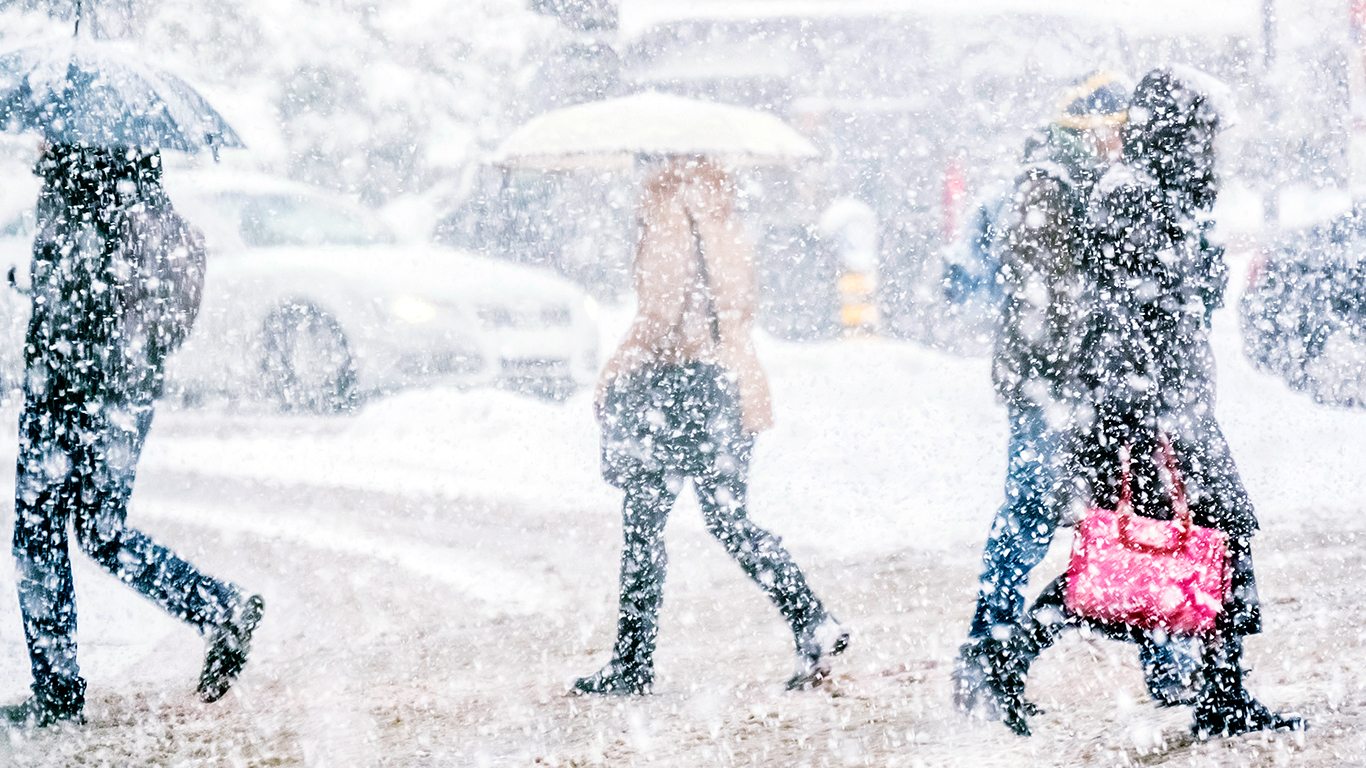
Blizzards across the eastern two-thirds of the United States have steadily increased in frequency over the last century. Due to accelerating changes to the climate, including rising ocean surface temperatures (which leads to more moisture in the air), reduction in Arctic sea ice (which can affect the jet stream), as well as natural variability, the increase in severe winter storms in the eastern U.S. is expected to continue.
Unlike hurricanes and earthquakes, there is no widely used scale or index for assessing the impact of snowstorms. In recent years, however, the meteorological community has made several successful attempts to establish a standard for measuring the impact of extreme snow events that can be used to compare snowstorms over time.
The Regional Snowfall Index, introduced in 2014, ranks a snowstorm impact on a scale of 1 to 5 using data on a storm’s area of snowfall, the amount of snowfall, and the population affected. The RSI has since been used to retroactively classify nearly 600 snowstorms that occurred between 1900 and 2013.
To determine the worst blizzards of all time, 24/7 Wall St. ranked snowstorms based on their Regional Snowfall Index values, published by the National Oceanic and Atmospheric Administration’s National Centers for Environmental Information. We included the 25 snowstorms designated as Category 5 since 1900. Data on duration, region, affected area, and affected population also came from the NOAA. 24/7 Wall St. combined data on affected area and population for Category 5 storms that spanned multiple regions, considering it one event. Storm names, as well as measures of snowfall in the affected areas, came from various news and media sources.
Click here to see the worst blizzards of all time.
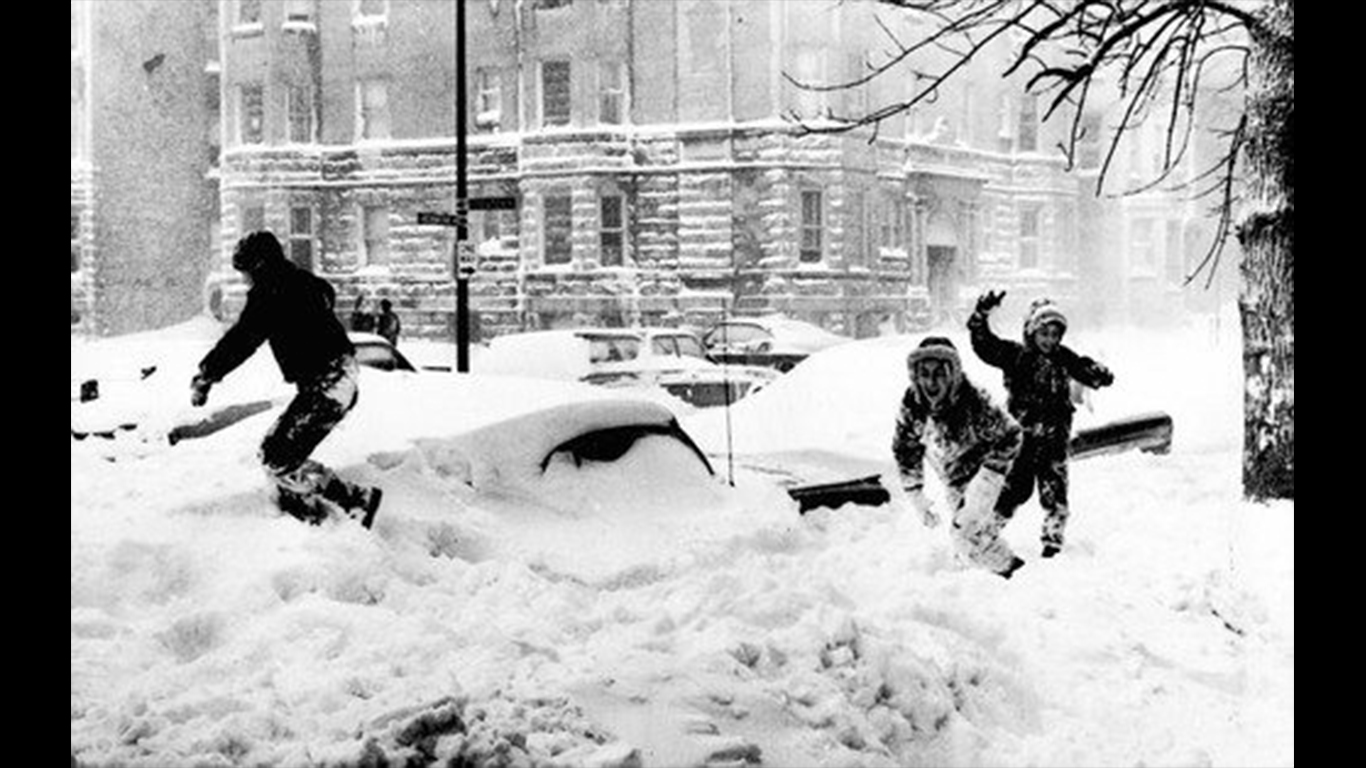
25. The Chicago Blizzard of 1967
> Duration: Jan. 25, 1967 – Jan. 29, 1967
> Region: Ohio Valley
> Affected area: 286,503 square miles
> Population affected: 46.1 million
> Notable snowfall: 23 inches (Chicago, IL)
[in-text-ad]
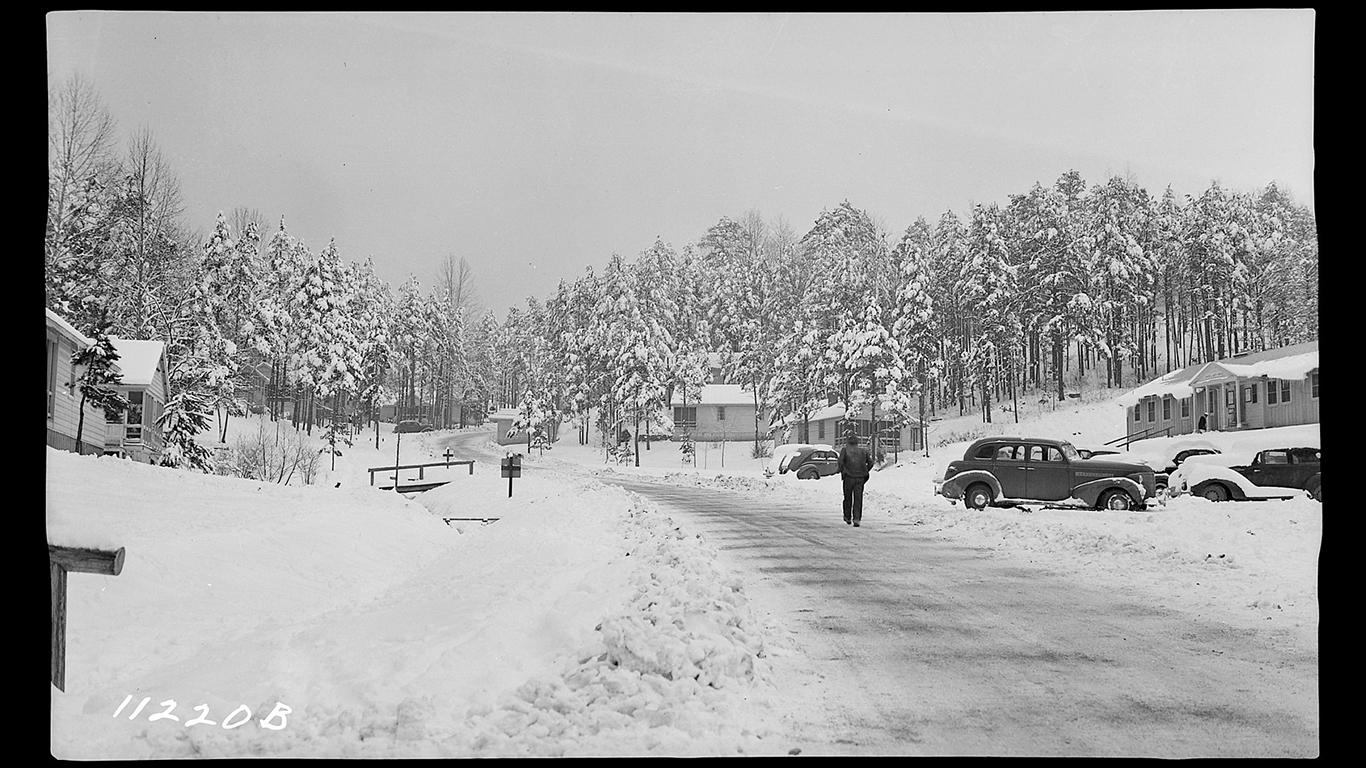
24. The Great Atlanta Blizzard
> Duration: Jan. 21, 1940 – Jan. 24, 1940
> Region: Southeast
> Affected area: 214,946 square miles
> Population affected: 35.6 million
> Notable snowfall: 21.6 inches (Richmond, VA)
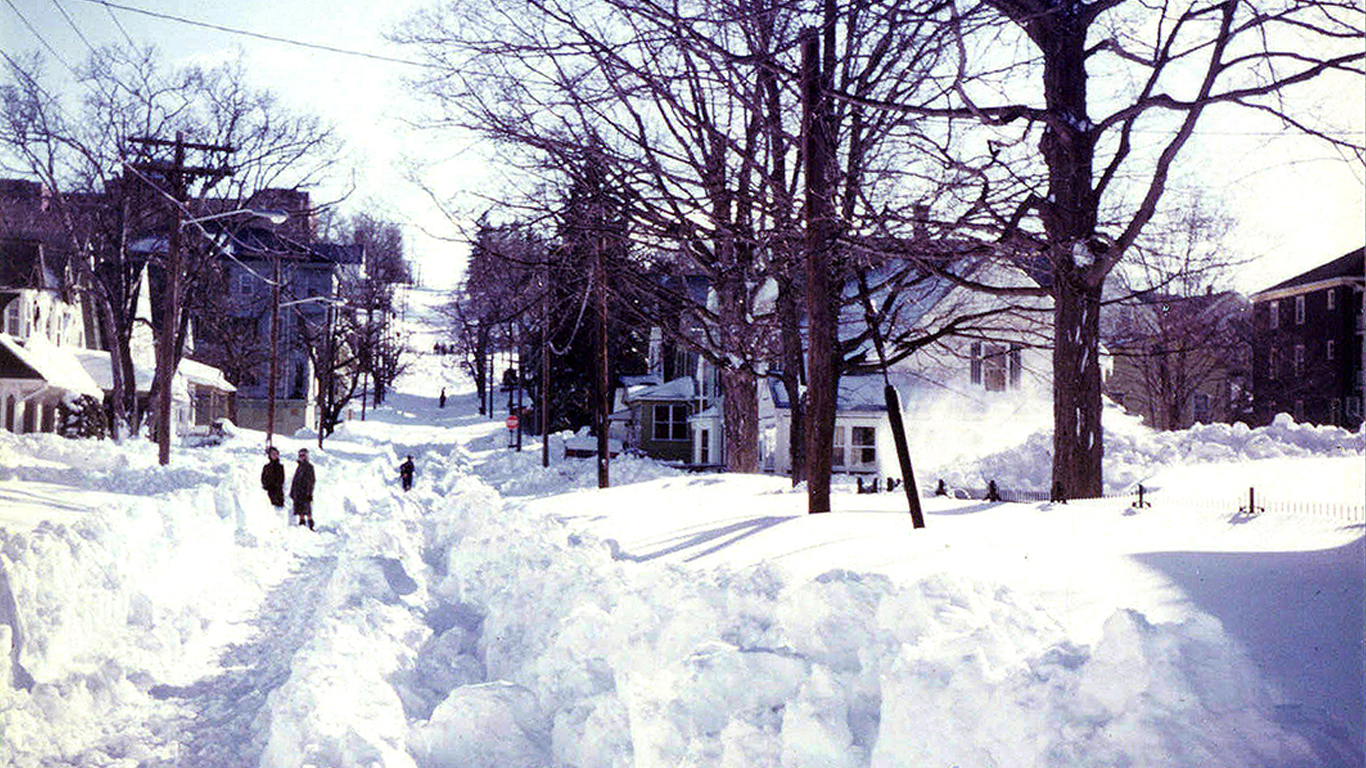
23. The Blizzard of 1978
> Duration: Feb. 4, 1978 – Feb. 8, 1978
> Region: Northeast
> Affected area: 174,950 square miles
> Population affected: 58.9 million
> Notable snowfall: 55 inches (Lincoln, RI)
[in-text-ad-2]
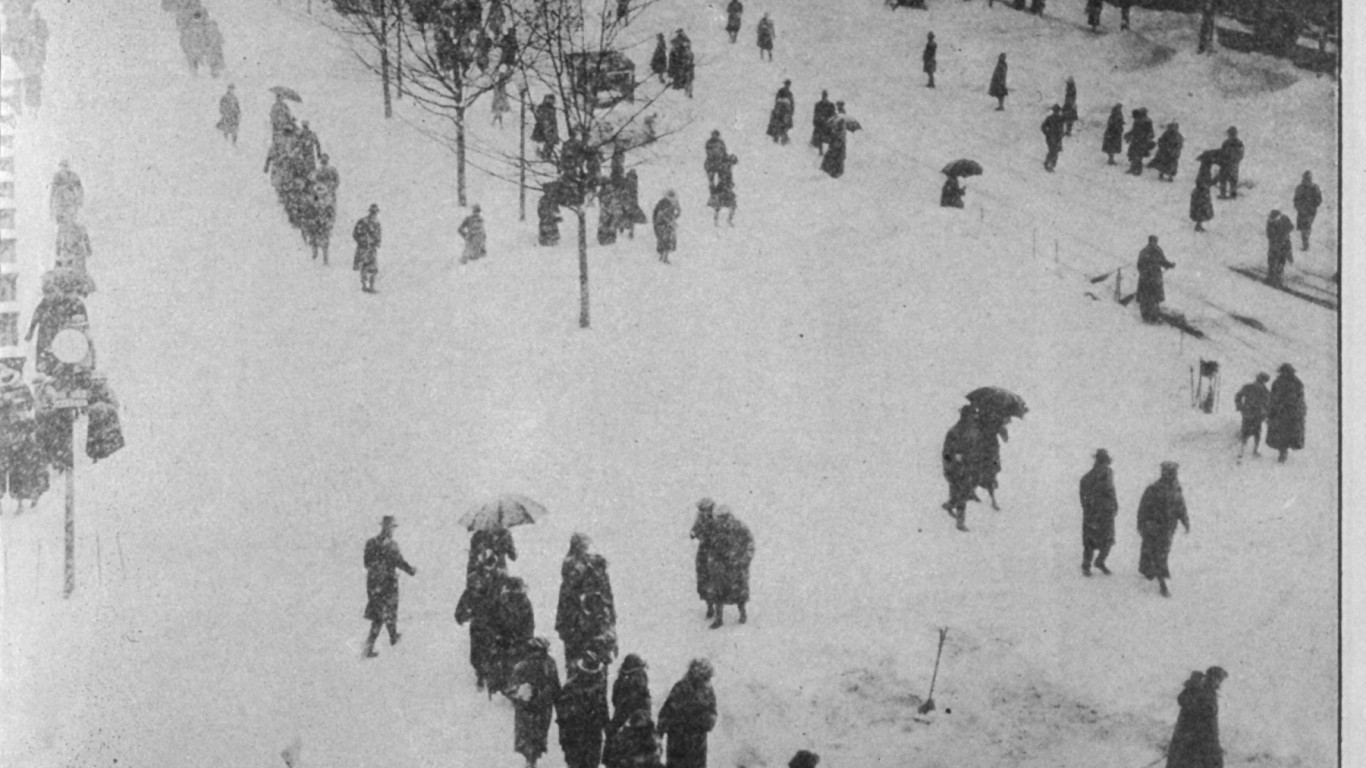
22. The Knickerbocker Storm
> Duration: Jan. 26, 1922 – Jan. 30, 1922
> Region: Southeast
> Affected area: 150,041 square miles
> Population affected: 30.1 million
> Notable snowfall: 28 inches (Washington, D.C.)
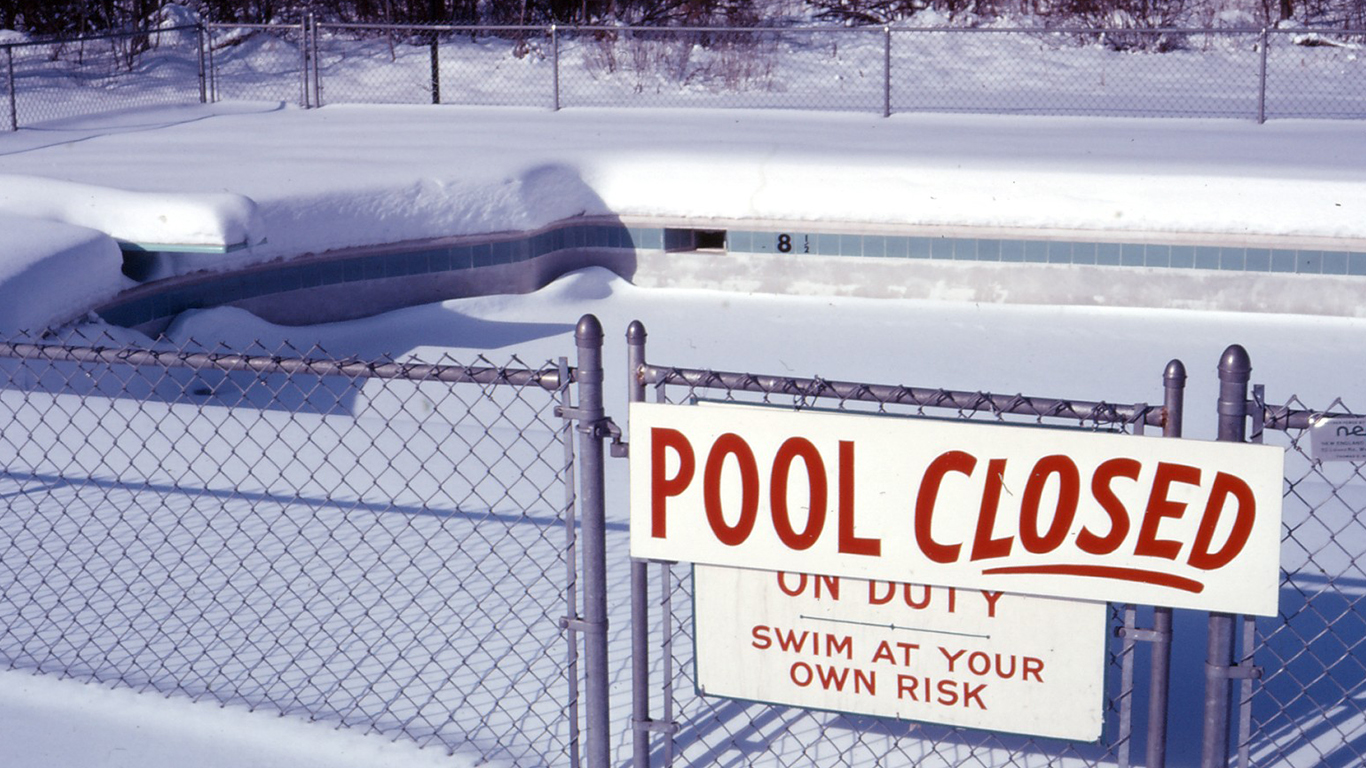
21. The Blizzard of 1971
> Duration: Feb. 19, 1971 – Feb. 24, 1971
> Region: South
> Affected area: 261,324 square miles
> Population affected: 10.5 million
> Notable snowfall: N/A
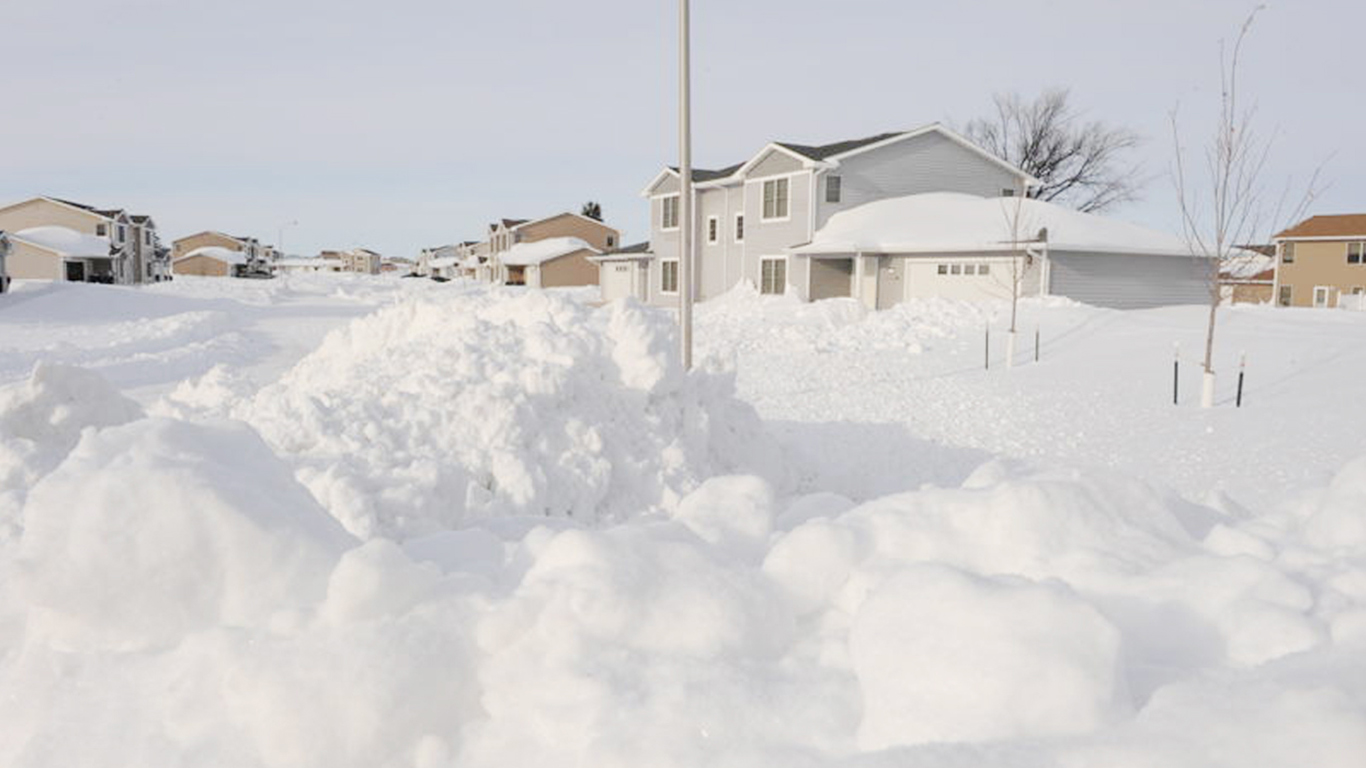
20. The 2009 Christmas Blizzard
> Duration: Dec. 22, 2009 – Dec. 29, 2009
> Region: Northern Rockies and Plains
> Affected area: 466,690 square miles
> Population affected: 4.8 million
> Notable snowfall: 15.7 inches (Osceola, NE)
[in-text-ad]
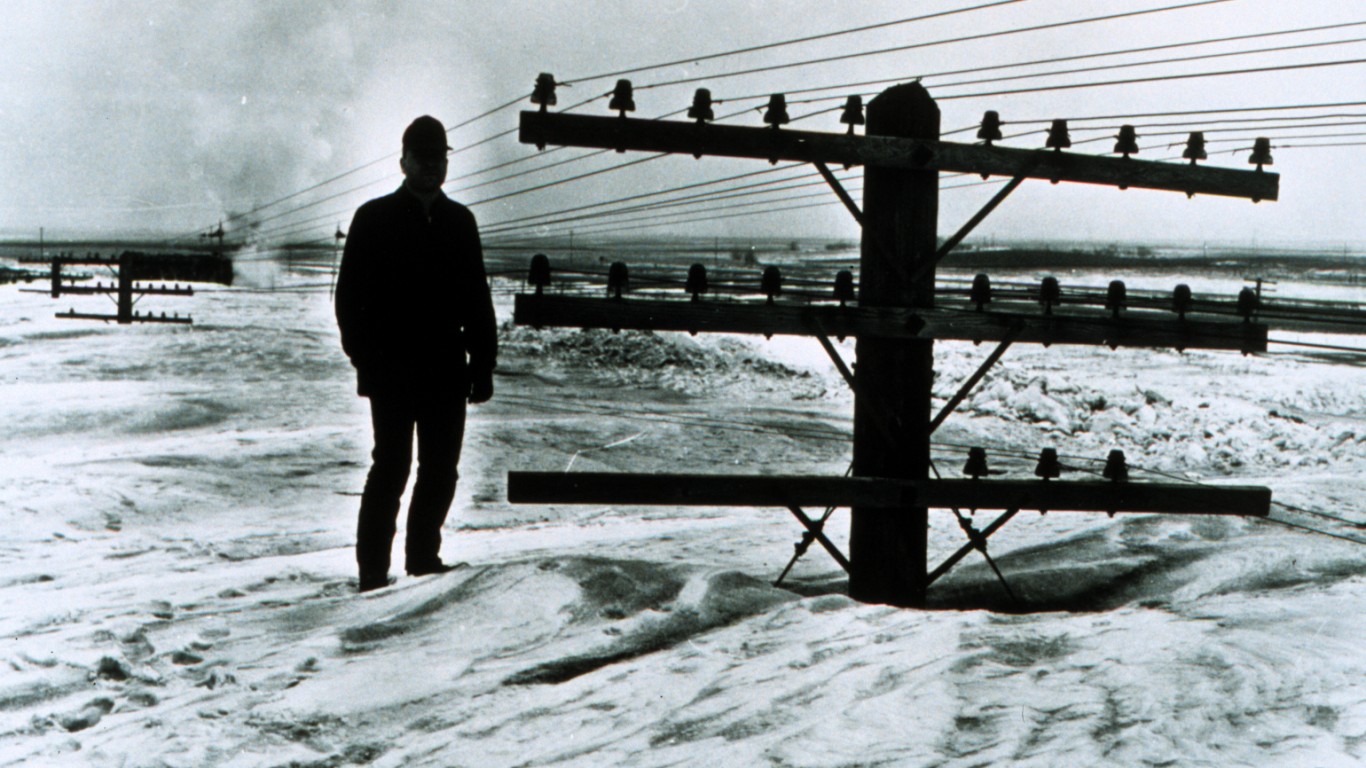
19. The Blizzard of 1966
> Duration: Feb. 28, 1966 – Mar. 6, 1966
> Region: Northern Rockies and Plains
> Affected area: 466,796 square miles
> Population affected: 4.8 million
> Notable snowfall: 30.5 inches (Devils Lake, ND)
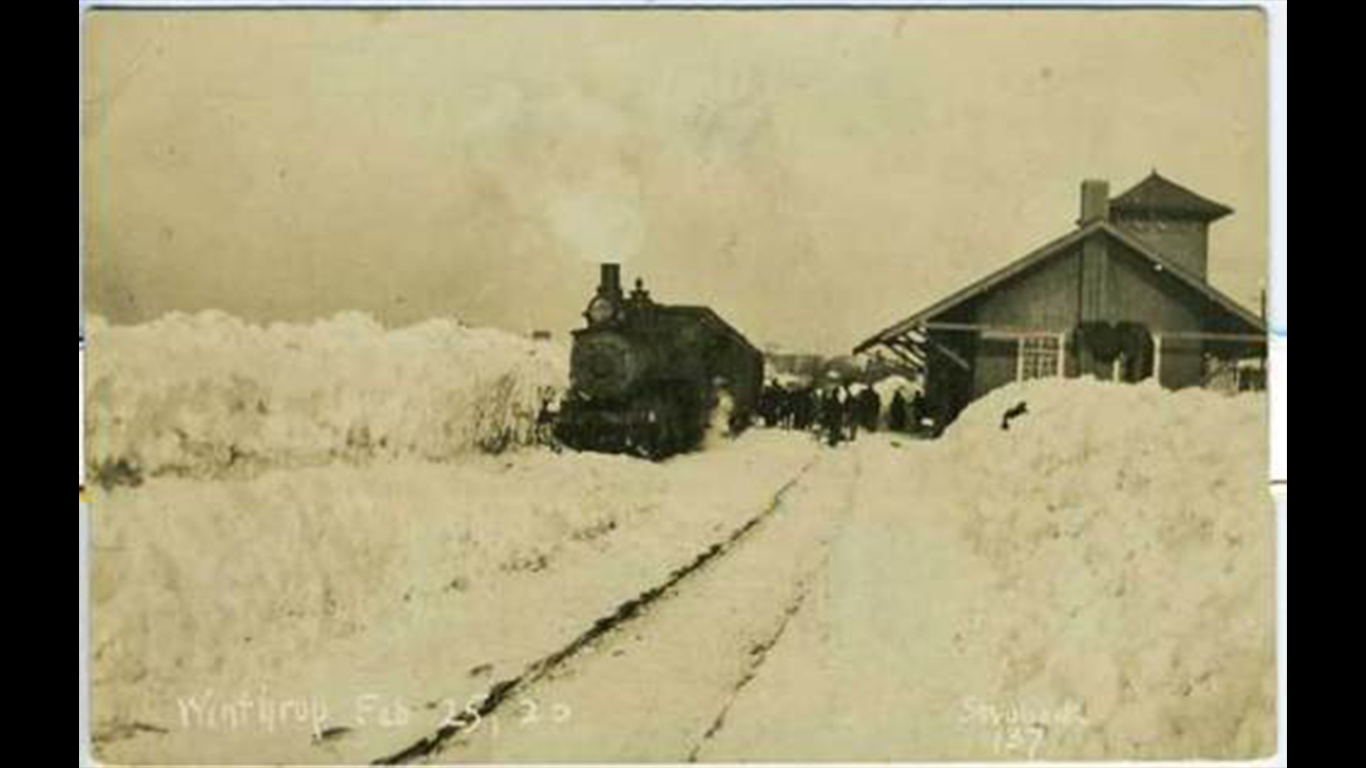
18. The Blizzard of 1920
> Duration: Apr. 15, 1920 – Apr. 19, 1920
> Region: Northern Rockies and Plains
> Affected area: 350,813 square miles
> Population affected: 2.4 million
> Notable snowfall: 28.3 inches (Denver, CO)
[in-text-ad-2]
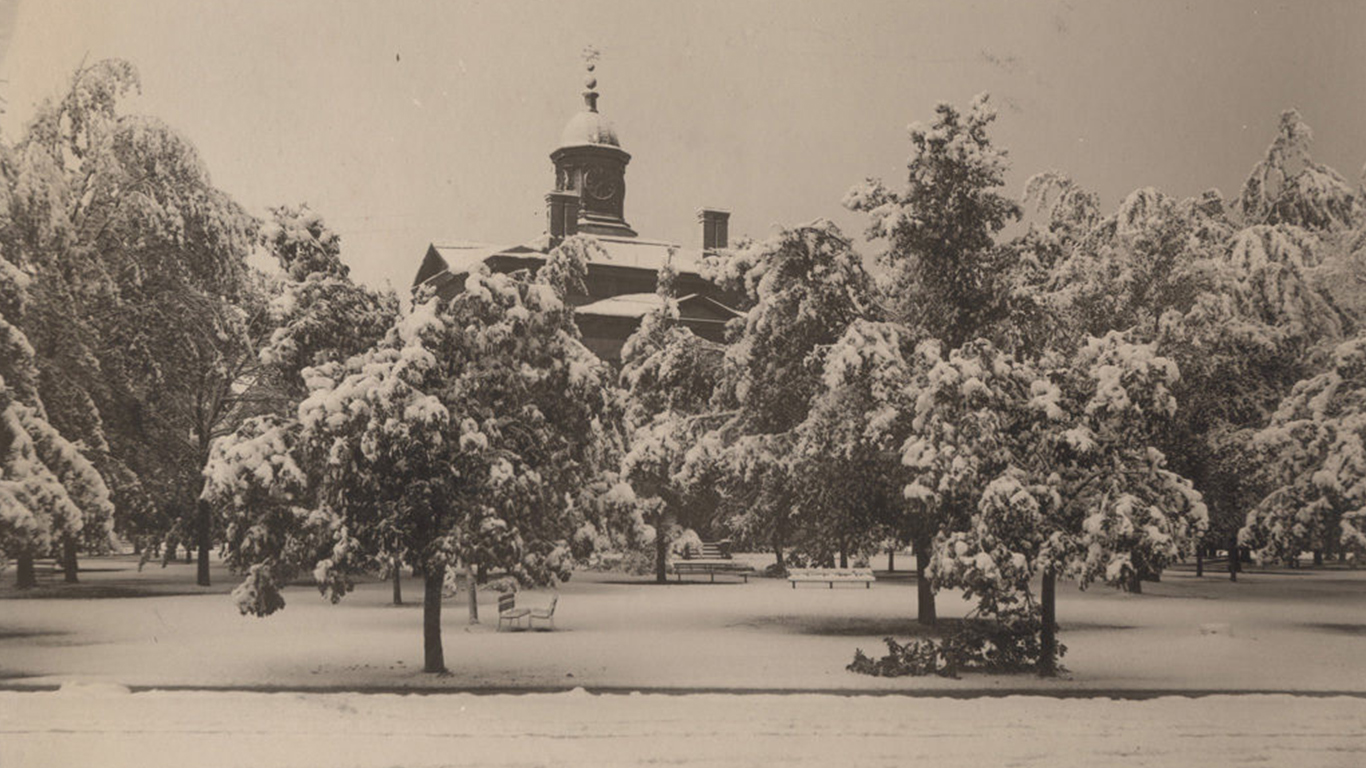
17. The Historic Texas Snowstorm
> Duration: Dec. 19, 1929 – Dec. 24, 1929
> Region: South
> Affected area: 380,488 square miles
> Population affected: 31.2 million
> Notable snowfall: 26 inches (Hillsboro, TX)
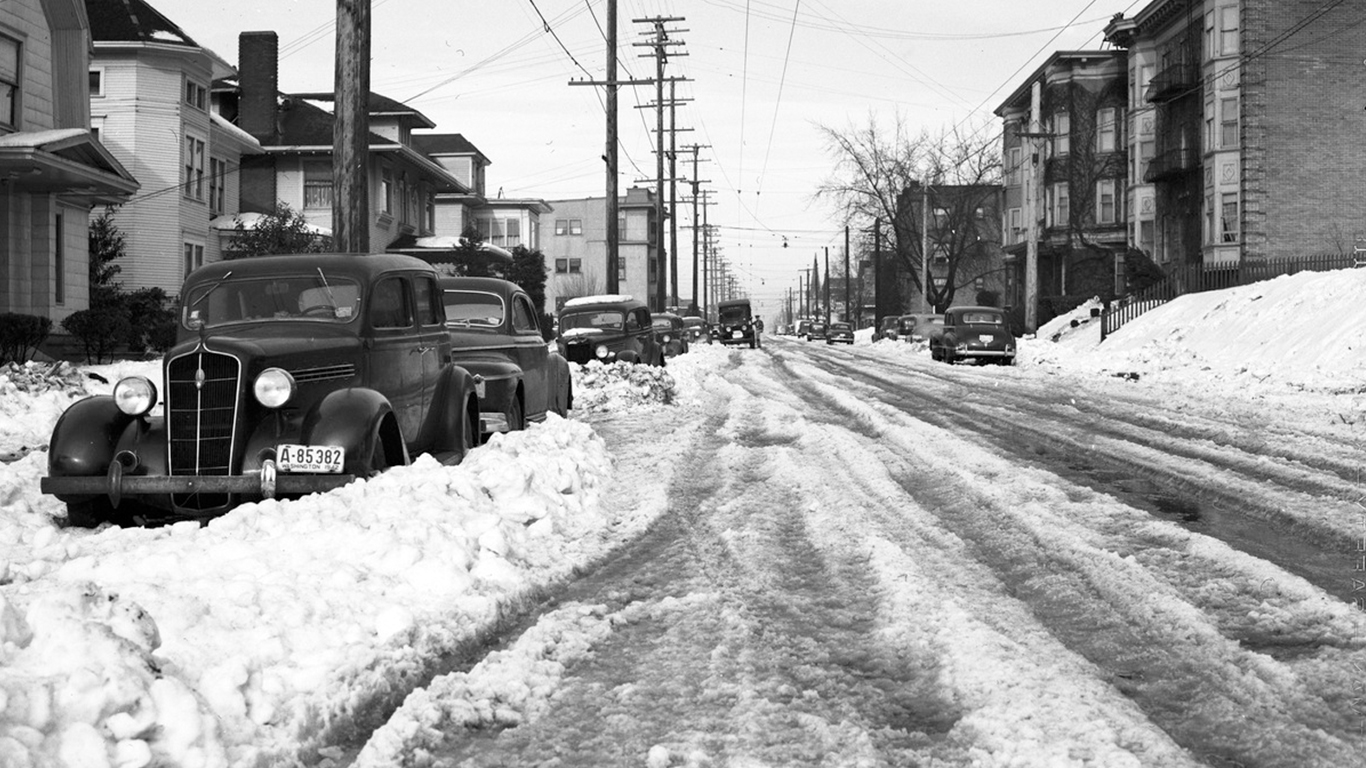
16. The Blizzard of 1943
> Duration: Jan. 19, 1943 – Jan. 26, 1943
> Region: Northern Rockies and Plains
> Affected area: 358,424 square miles
> Population affected: 3.1 million
> Notable snowfall: 14.4 inches (Portland, OR)
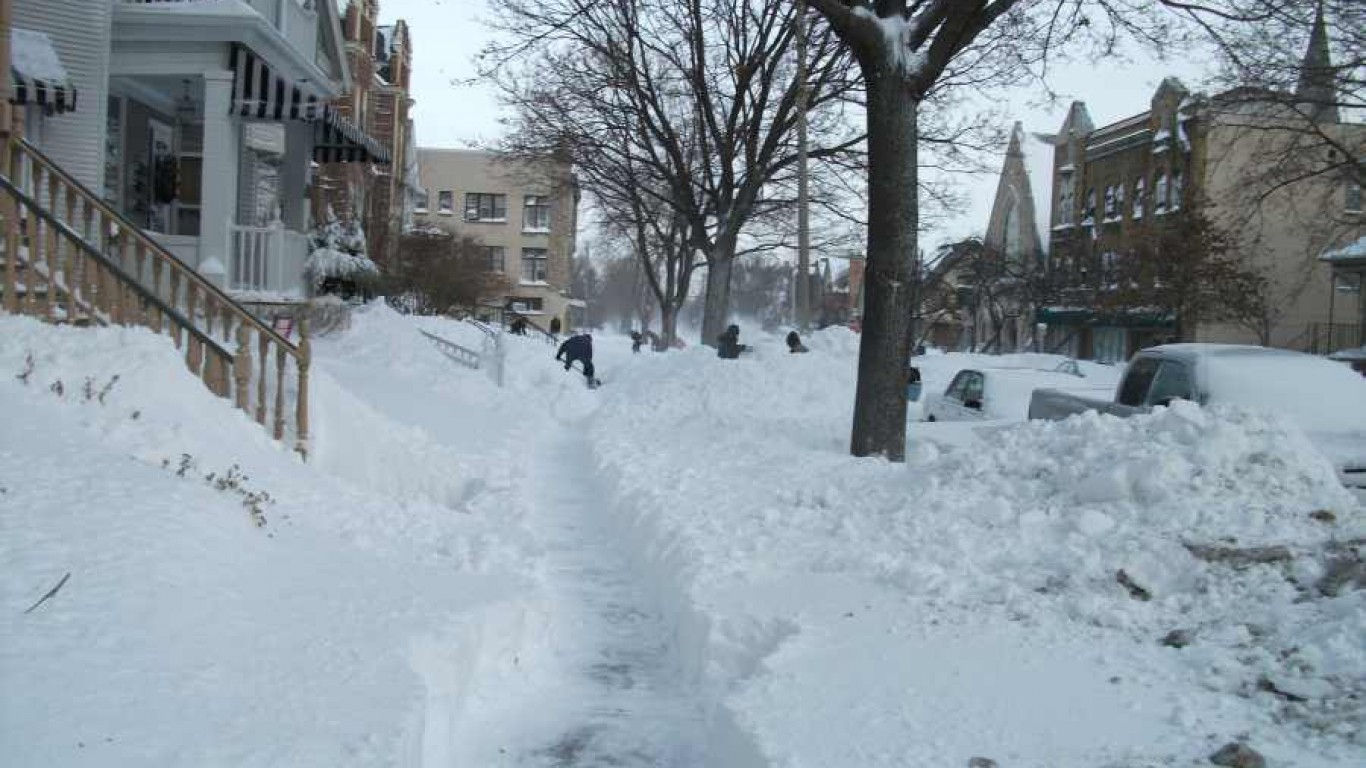
15. The Groundhog Day Blizzard
> Duration: Feb. 1, 2011 – Feb. 4, 2011
> Region: Ohio Valley
> Affected area: 241,595 square miles
> Population affected: 41.3 million
> Notable snowfall: 23.5 inches (Racine, WI)
[in-text-ad]
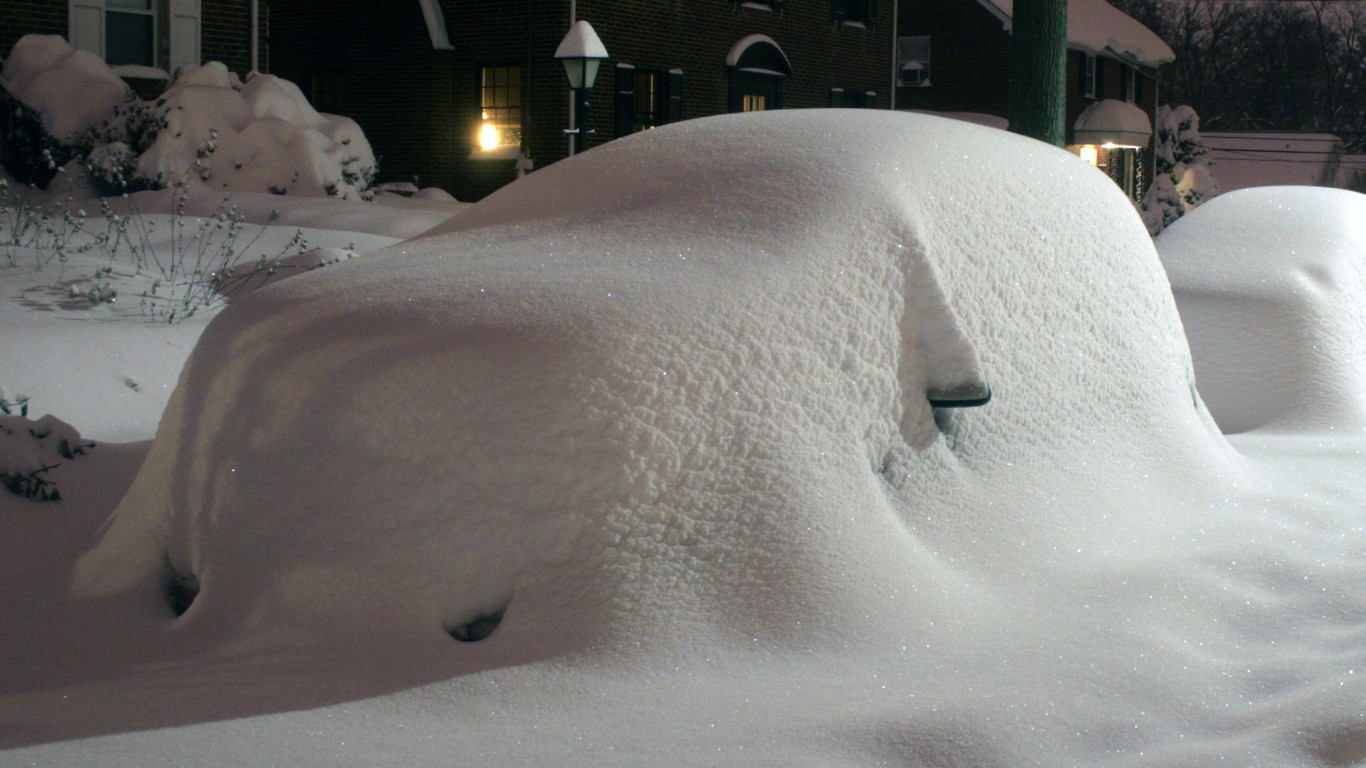
14. The Blizzard of 1993
> Duration: Nov. 21, 1993 – Nov. 29, 1993
> Region: Northern Rockies and Plains
> Affected area: 468,083 square miles
> Population affected: 4.8 million
> Notable snowfall: NA
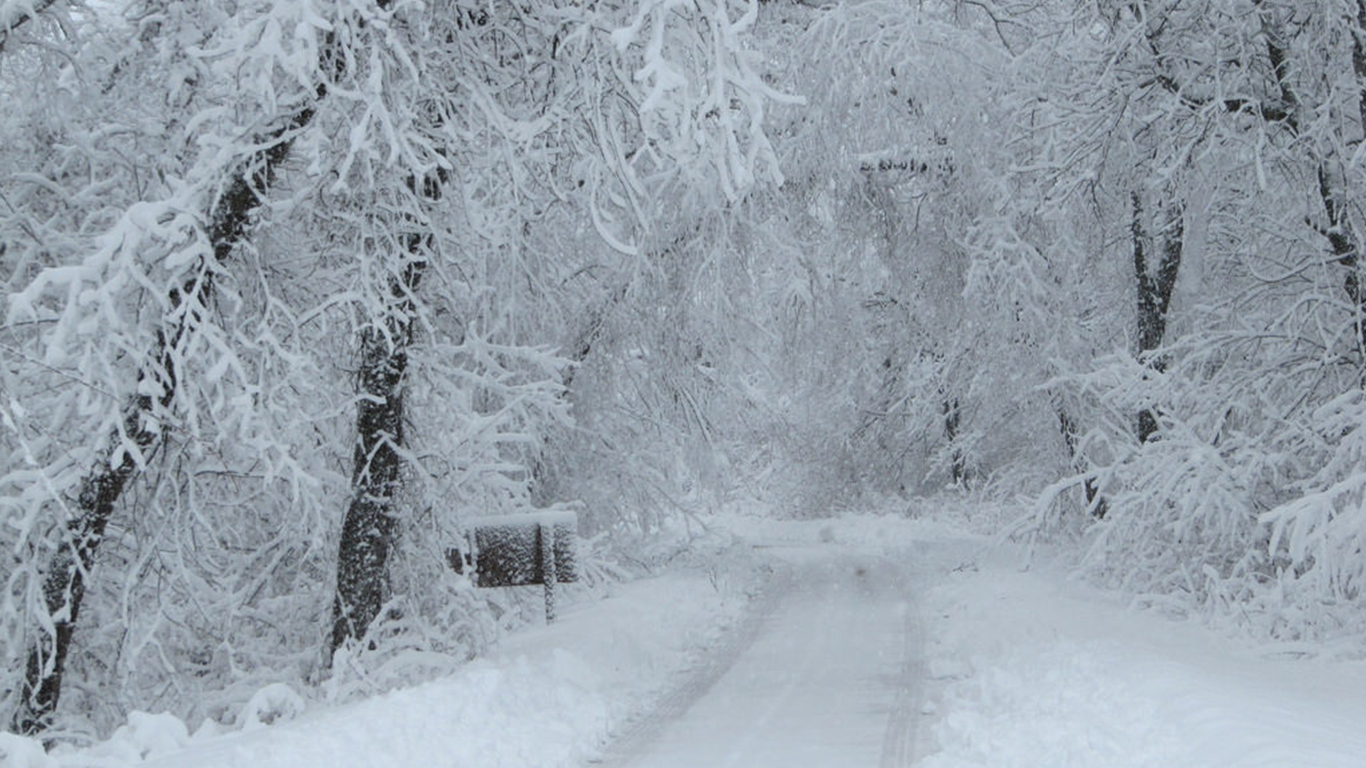
13. The Post-Thanksgiving Day Storm of 1985
> Duration: Nov. 28, 1985 – Dec. 2, 1985
> Region: Upper Midwest
> Affected area: 251,618 square miles
> Population affected: 23.9 million
> Notable snowfall: 30 inches (Marquette, WI)
[in-text-ad-2]
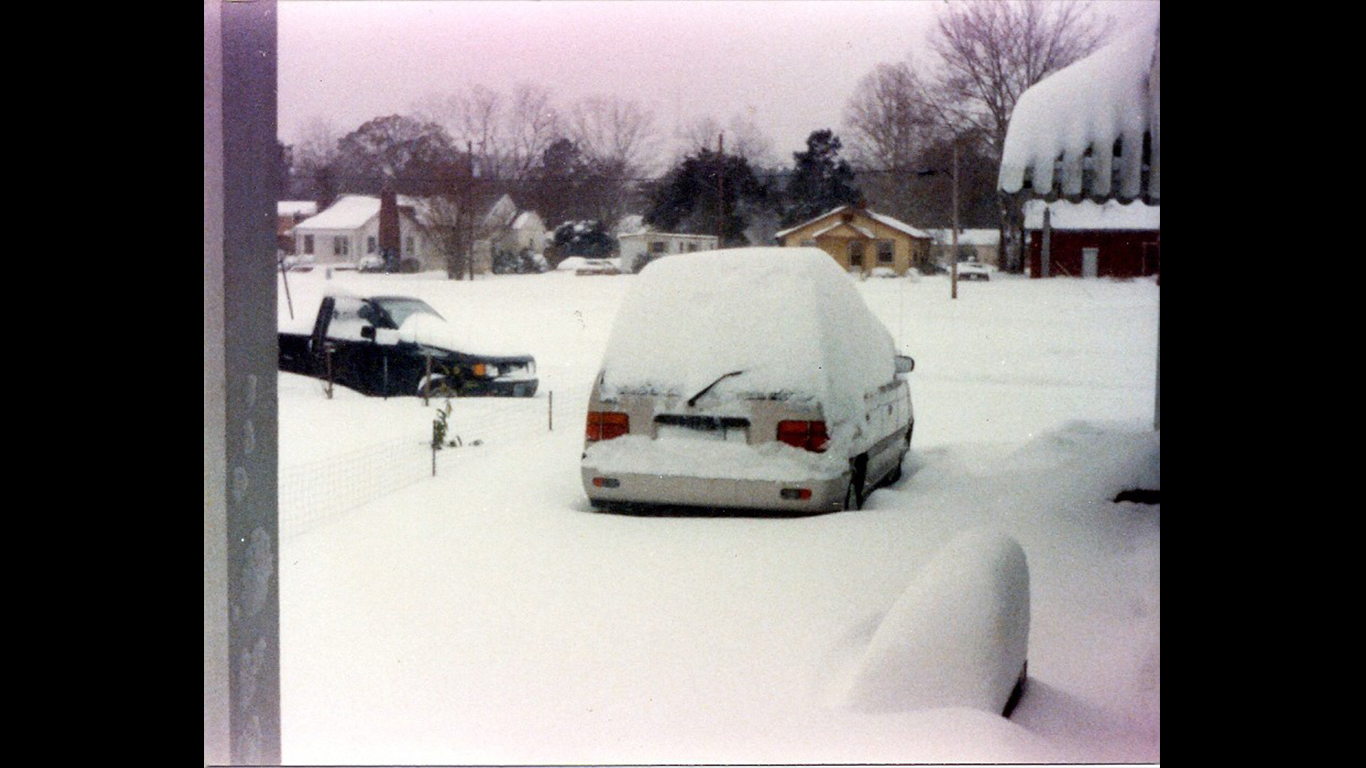
12. The Blizzard of 1988
> Duration: Jan. 5, 1988 – Jan. 9, 1988
> Region: South
> Affected area: 369,821 square miles
> Population affected: 22.3 million
> Notable snowfall: 20 inches (Macon County, NC)
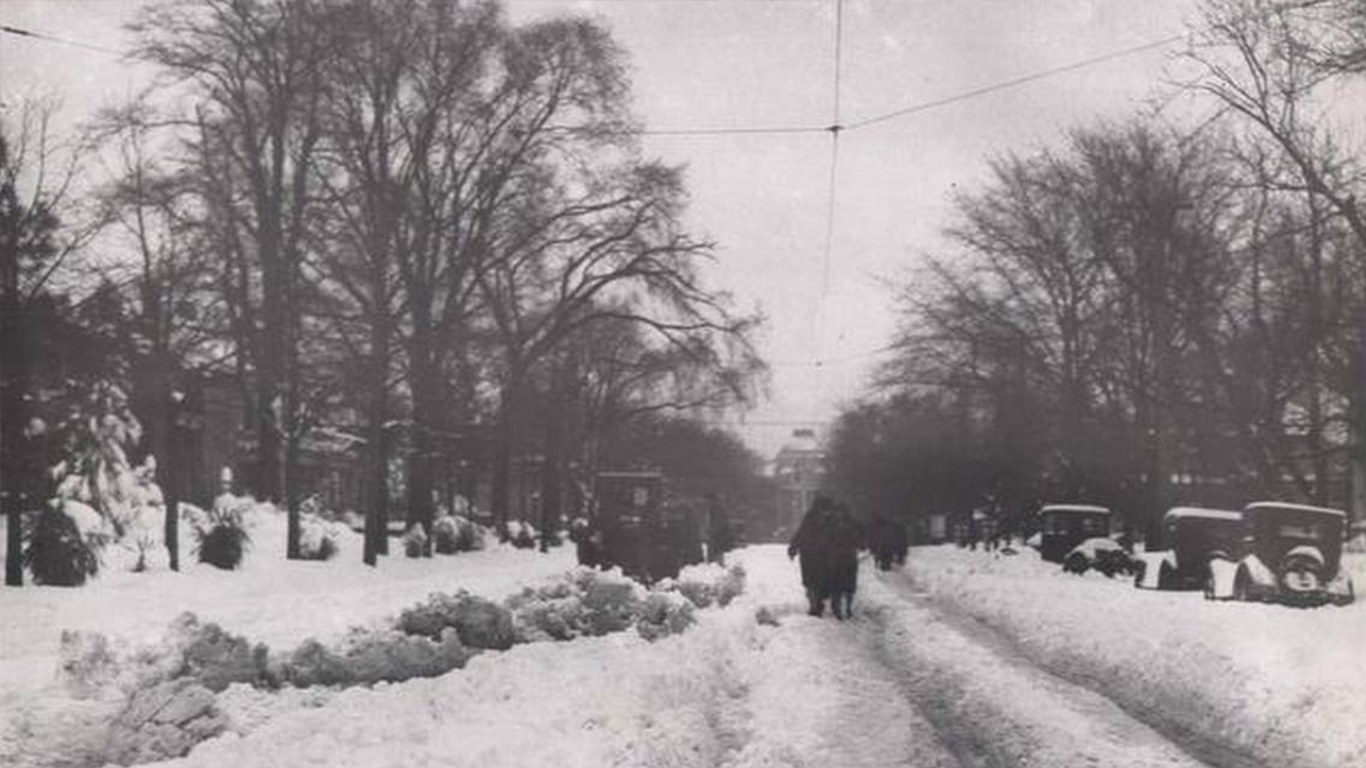
11. The Blizzard of 1927, Southeastern United States
> Duration: Feb. 27, 1927 – Mar. 3, 1927
> Region: Southeast
> Affected area: 142,285 square miles
> Population affected: 26.5 million
> Notable snowfall: 30-40 inches (Wilson, NC)
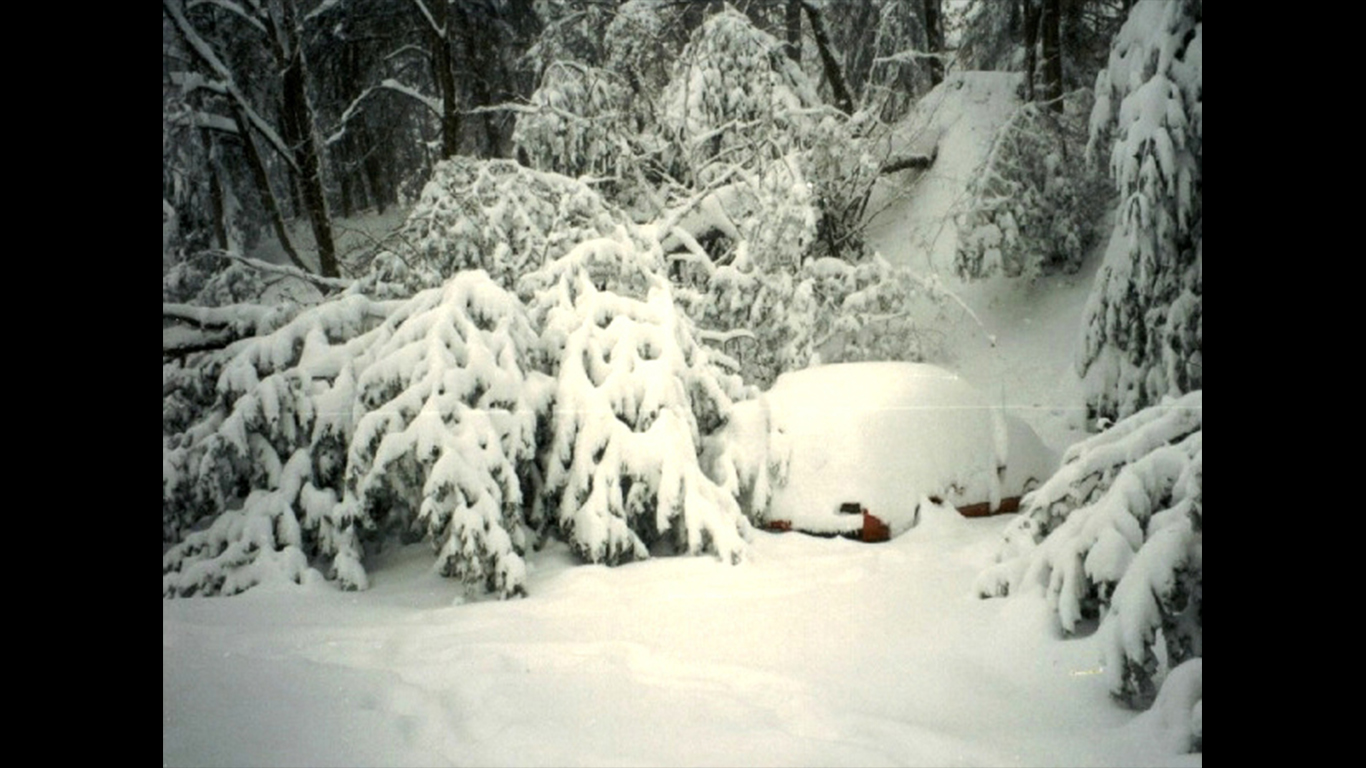
10. The Storm of the Century
> Duration: Mar. 12, 1993 – Mar. 15, 1993
> Region: Ohio Valley, Southeast, Northeast
> Affected area: 551,948 square miles
> Population affected: 120.8 million
> Notable snowfall: 56 inches (Mount LeConte, TN)
[in-text-ad]
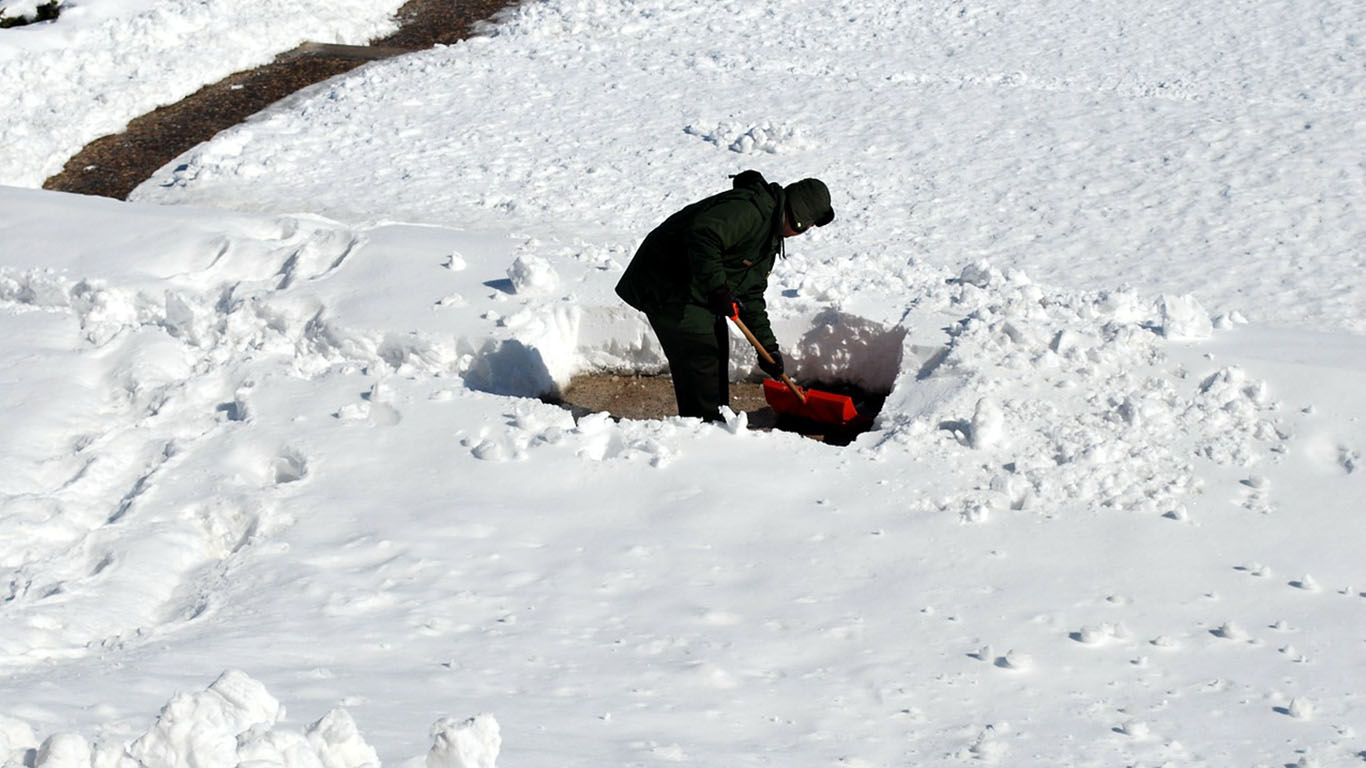
9. The Blizzard of 1984
> Duration: Apr. 25, 1984 – Apr. 28, 1984
> Region: Northern Rockies and Plains
> Affected area: 418,380 square miles
> Population affected: 3.1 million
> Notable snowfall: 24 inches (Campbell County, WY)
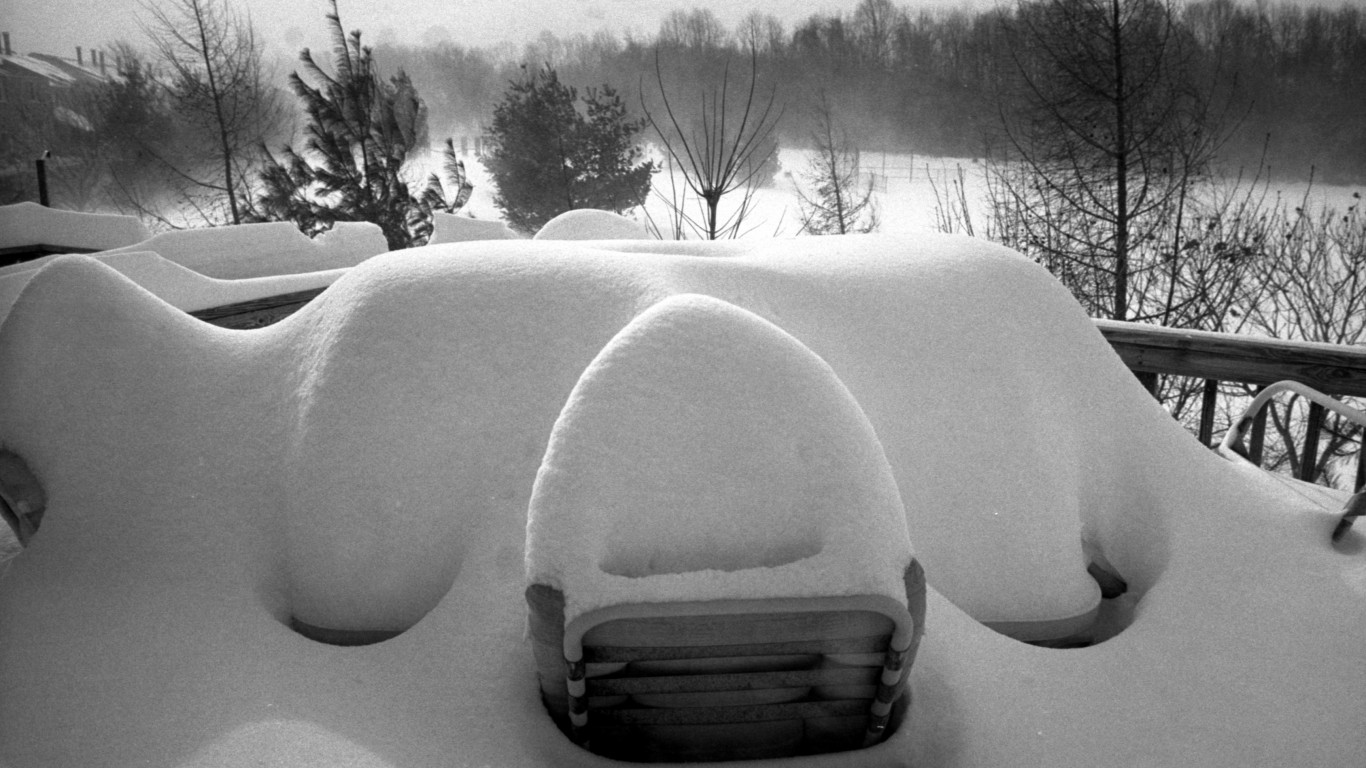
8. The Blizzard of 1996
> Duration: Jan. 6, 1996 – Jan. 9, 1996
> Region: Southeast, Northeast
> Affected area: 331,486 square miles
> Population affected: 89.5 million
> Notable snowfall: 26.6 inches (Baltimore, MD)
[in-text-ad-2]
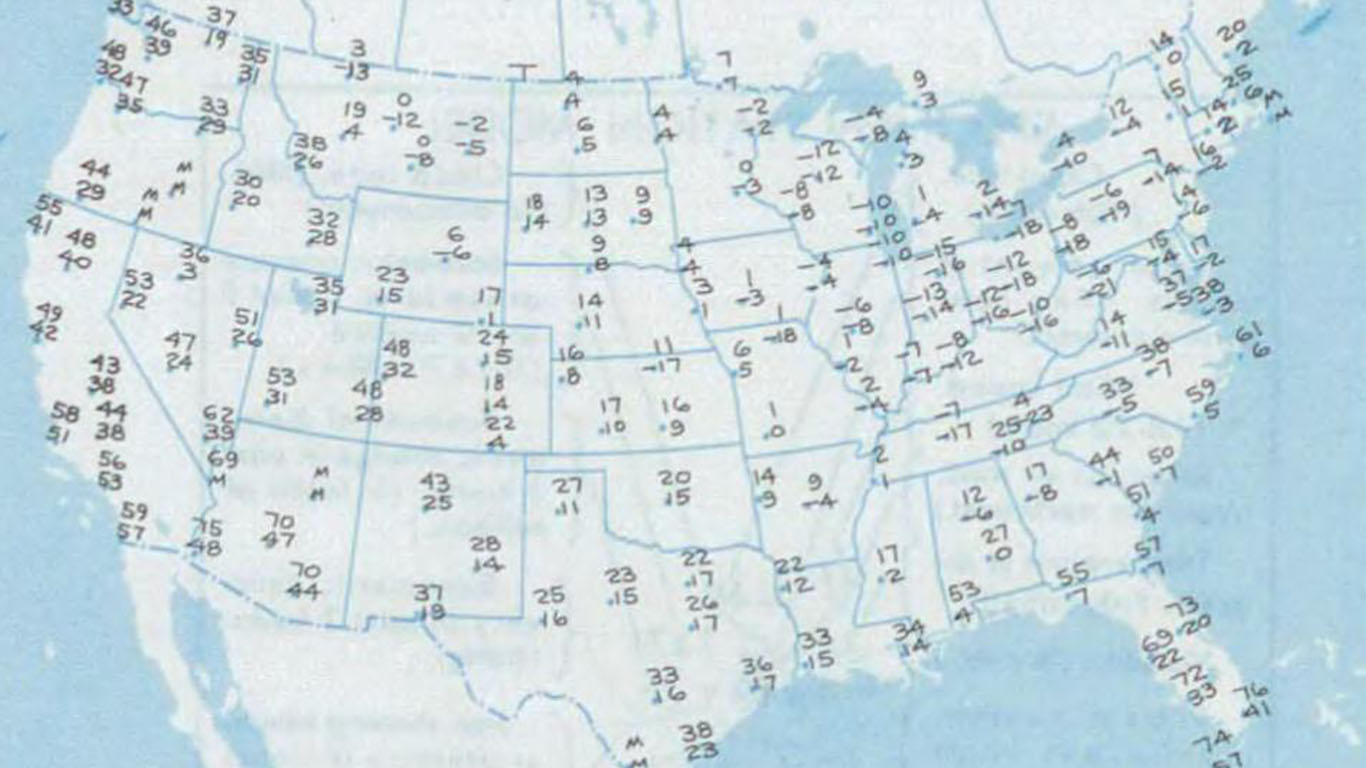
7. The Great Cold Outbreak of 1985
> Duration: Feb. 7, 1985 – Feb. 15, 1985
> Region: Upper Midwest
> Affected area: 252,012 square miles
> Population affected: 23.9 million
> Notable snowfall: N/A

6. The Halloween Blizzard of 1991
> Duration: Oct. 31, 1991 – Nov. 4, 1991
> Region: Upper Midwest
> Affected area: 251,176 square miles
> Population affected: 23.5 million
> Notable snowfall: 28 inches (Twin Cities, MN)
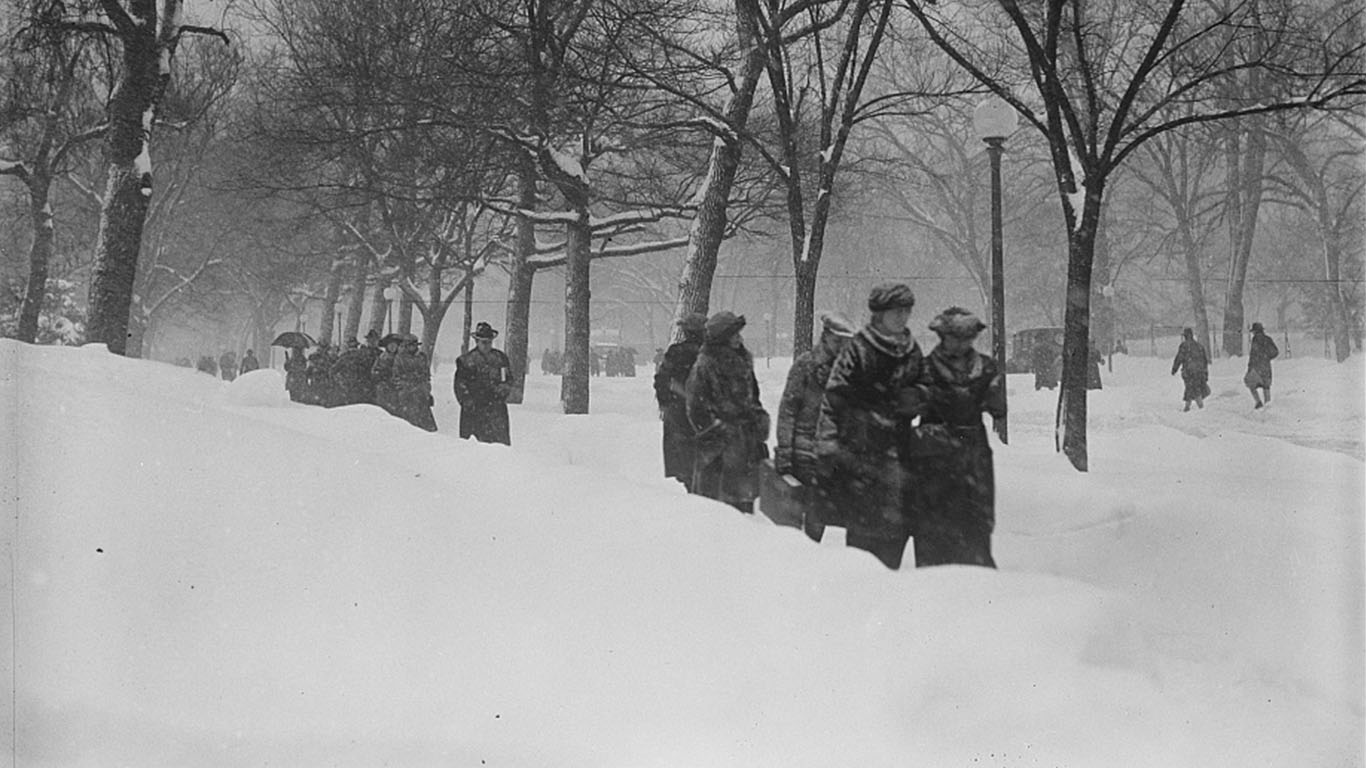
5. The Blizzard of 1921
> Duration: Feb. 18, 1921 – Feb. 22, 1921
> Region: South
> Affected area: 256,548 square miles
> Population affected: 16.7 million
> Notable snowfall: N/A
[in-text-ad]
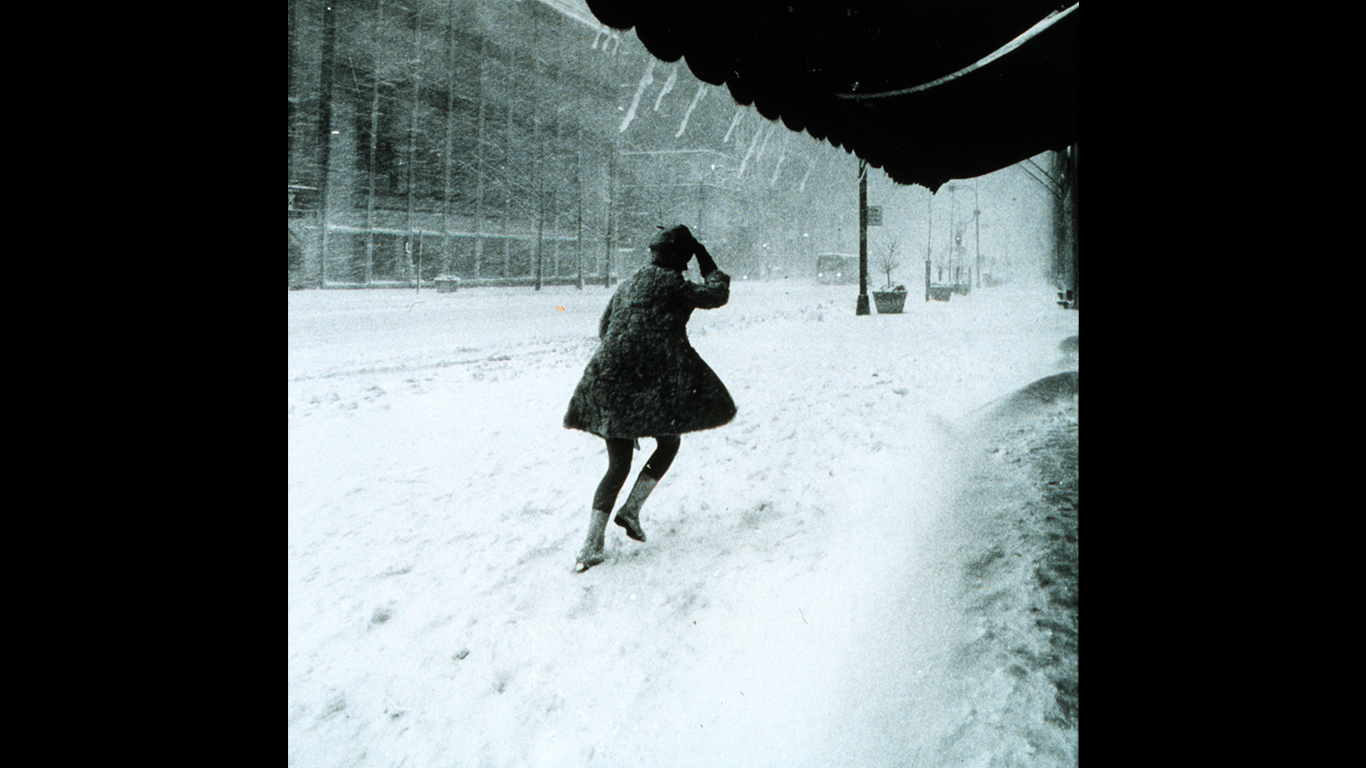
4. The 100-Hour Snowstorm of February 1969
> Duration: Feb. 22, 1969 – Feb. 28, 1969
> Region: Northeast
> Affected area: 174,950 square miles
> Population affected: 58.9 million
> Notable snowfall: 77 inches (Coos County, NH)
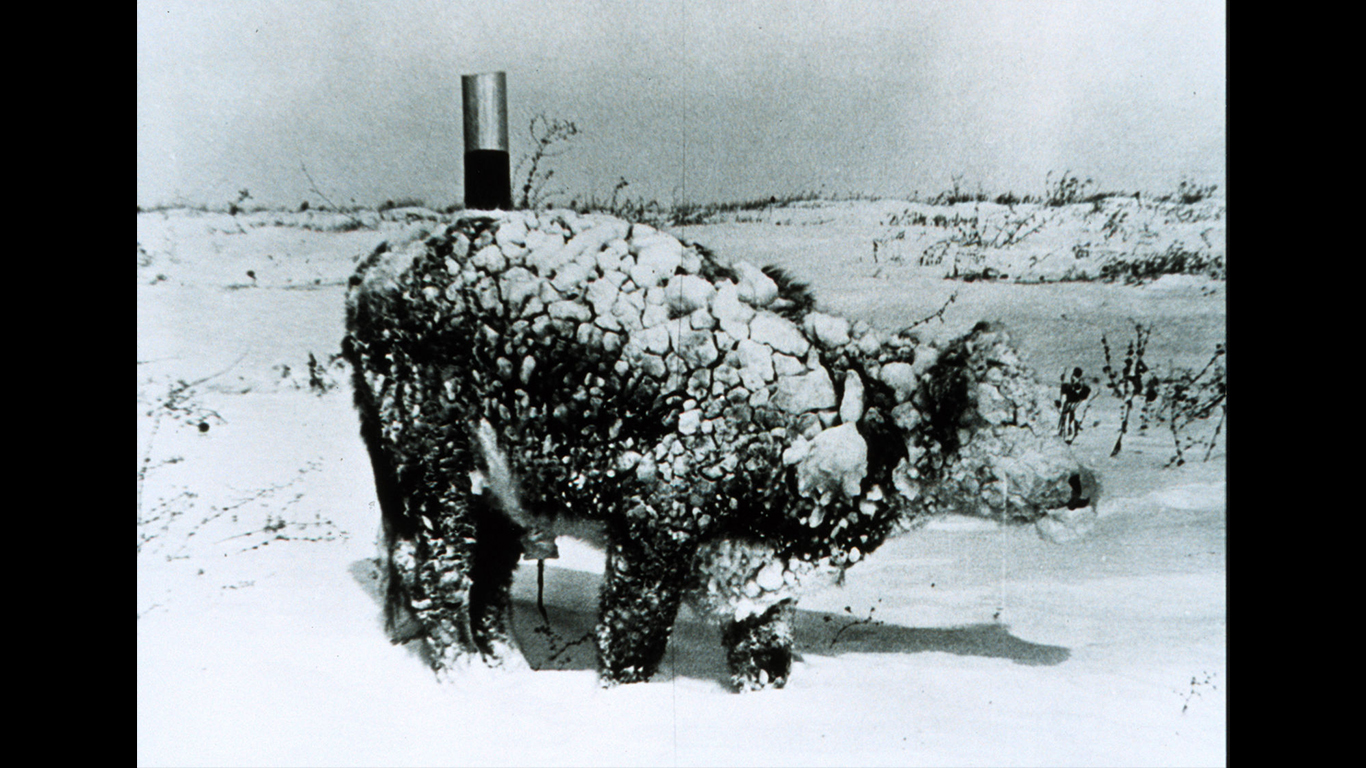
3. The Blizzard of 1927, Northern Rockies
> Duration: Apr. 10, 1927 – Apr. 15, 1927
> Region: Northern Rockies and Plains
> Affected area: 335,119 square miles
> Population affected: 2.1 million
> Notable snowfall: N/A
[in-text-ad-2]
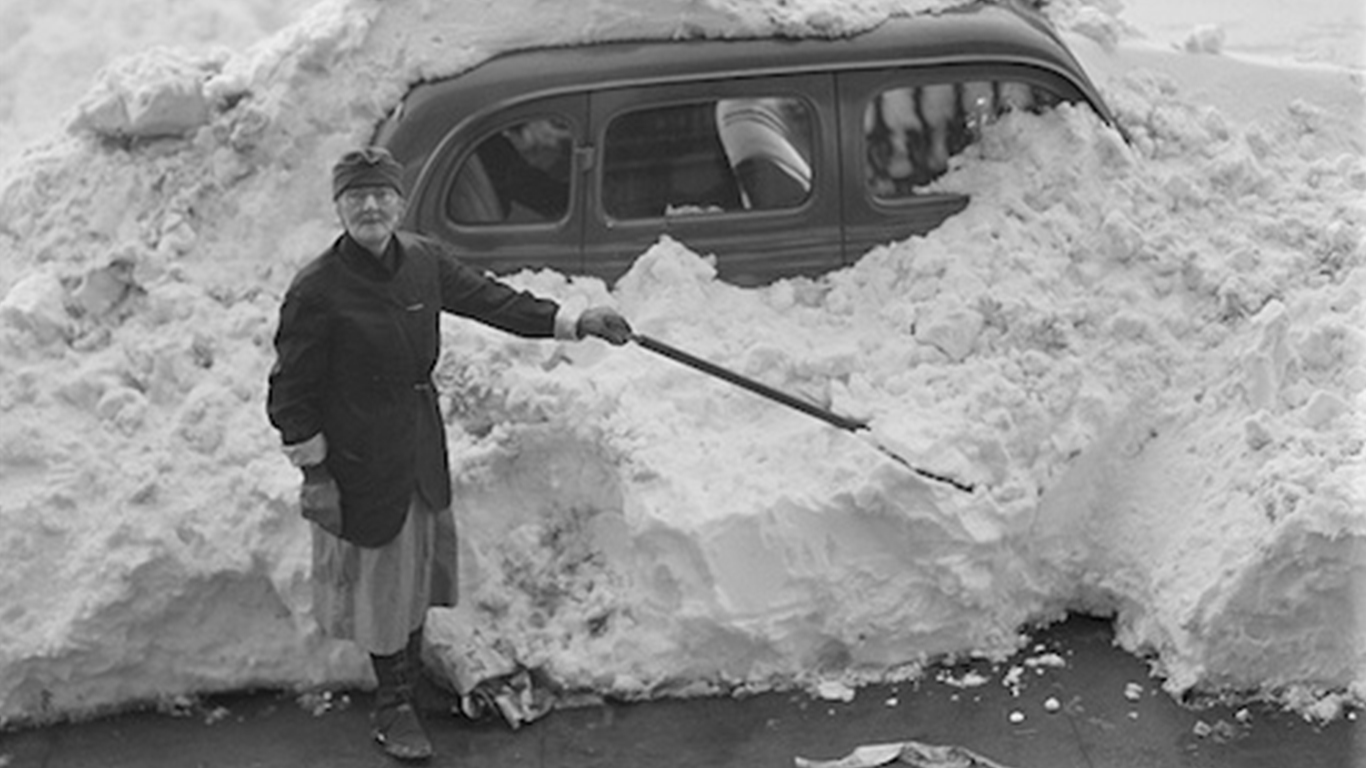
2. The Great Appalachian Storm of 1950
> Duration: Nov. 22, 1950 – Nov. 30, 1950
> Region: Ohio Valley
> Affected area: 308,845 square miles
> Population affected: 49.2 million
> Notable snowfall: 57 inches (Central Appalachia)
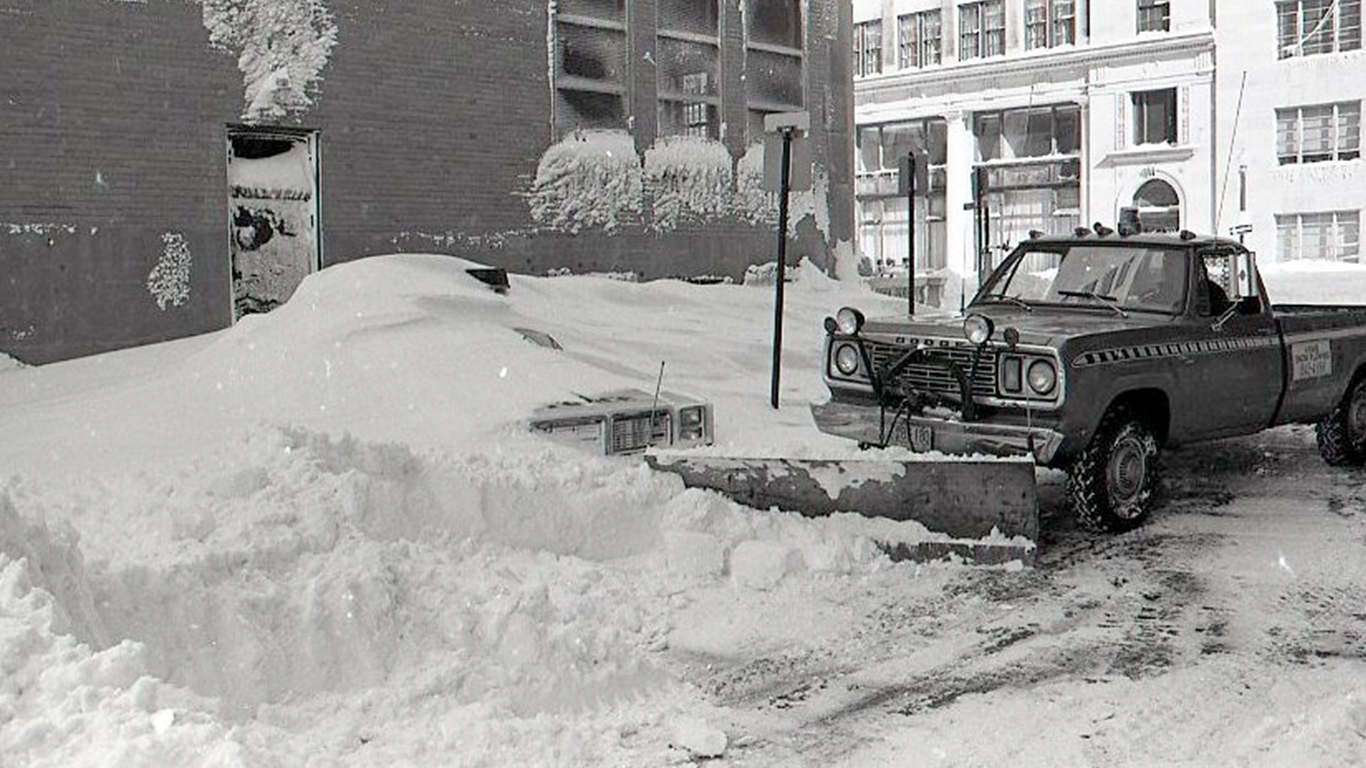
1. The White Hurricane
> Duration: Jan. 23, 1978 – Jan. 28, 1978
> Region: Upper Midwest
> Affected area: 233,580 square miles
> Population affected: 23.6 million
> Notable snowfall: 12.9 inches (Dayton, OH)
“The Next NVIDIA” Could Change Your Life
If you missed out on NVIDIA’s historic run, your chance to see life-changing profits from AI isn’t over.
The 24/7 Wall Street Analyst who first called NVIDIA’s AI-fueled rise in 2009 just published a brand-new research report named “The Next NVIDIA.”
Click here to download your FREE copy.
Thank you for reading! Have some feedback for us?
Contact the 24/7 Wall St. editorial team.
 24/7 Wall St.
 24/7 Wall St.