Special Report
This Is How Many People Have Died of COVID-19 in Every State

Published:
Last Updated:

Since the first death attributable to COVID-19 was reported in the United States on Feb. 29, 2020, an estimated 372,943 Americans have died — and that number continues to grow every day. Over the last seven-day period, an average of 3,362 Americans diagnosed with COVID-19 have died each day.
Adjusting for population, no state has reported more coronavirus deaths than New Jersey. Since the pandemic began, New Jersey has reported a total of 20,161 deaths — or 226 for every 100,000 people. Per capita deaths attributable to the virus are also high in Massachusetts, Rhode Island, Connecticut, and South Dakota. In each of these places, the death rate stands at at least 182 per 100,000 people.
For context, the national COVID-19 death rate stands at 114 deaths for every 100,000 people.
To date, Hawaii has reported the fewest coronavirus deaths on a per capita basis. There have been an estimated 22 COVID-19 deaths across the state for every 100,000 people since the pandemic began.
Though the U.S. has one of the highest per capita COVID-19 death rates in the world, Americans infected with the virus today appear more likely to survive than those who were infected earlier in the pandemic. Medical care providers now have months of experience treating COVID-19, and over that period have established more effective practices in treating the disease. According to one study conducted by researchers at the NYU Grossman School of Medicine released in October, the chances of death among critically ill patients was 18 percentage points lower in August 2020 than it was in March.
And now that inoculations against the coronavirus are underway in the United States, the spread of the disease will eventually slow, which will inevitably contribute to a reduction in deaths per capita.
All COVID-19 data for states used in the story is current as of Jan. 13, 2021. Washington D.C. is current as of Jan. 12, 2021.

1. New Jersey
> Total COVID-19 deaths in New Jersey: 226 per 100,000 people (total: 20,161)
> Total COVID-19 infections in New Jersey: 6,764 per 100,000 people (total: 602,566)
> 65 and older population: 16.6%
> Total population: 8,908,520

2. Massachusetts
> Total COVID-19 deaths in Massachusetts: 194 per 100,000 people (total: 13,359)
> Total COVID-19 infections in Massachusetts: 6,497 per 100,000 people (total: 448,447)
> 65 and older population: 17.0%
> Total population: 6,902,149

3. Rhode Island
> Total COVID-19 deaths in Rhode Island: 188 per 100,000 people (total: 1,987)
> Total COVID-19 infections in Rhode Island: 9,693 per 100,000 people (total: 102,485)
> 65 and older population: 17.7%
> Total population: 1,057,315

4. Connecticut
> Total COVID-19 deaths in Connecticut: 183 per 100,000 people (total: 6,536)
> Total COVID-19 infections in Connecticut: 6,174 per 100,000 people (total: 220,576)
> 65 and older population: 17.6%
> Total population: 3,572,665

5. South Dakota
> Total COVID-19 deaths in South Dakota: 182 per 100,000 people (total: 1,604)
> Total COVID-19 infections in South Dakota: 10,607 per 100,000 people (total: 93,580)
> 65 and older population: 17.4%
> Total population: 882,235

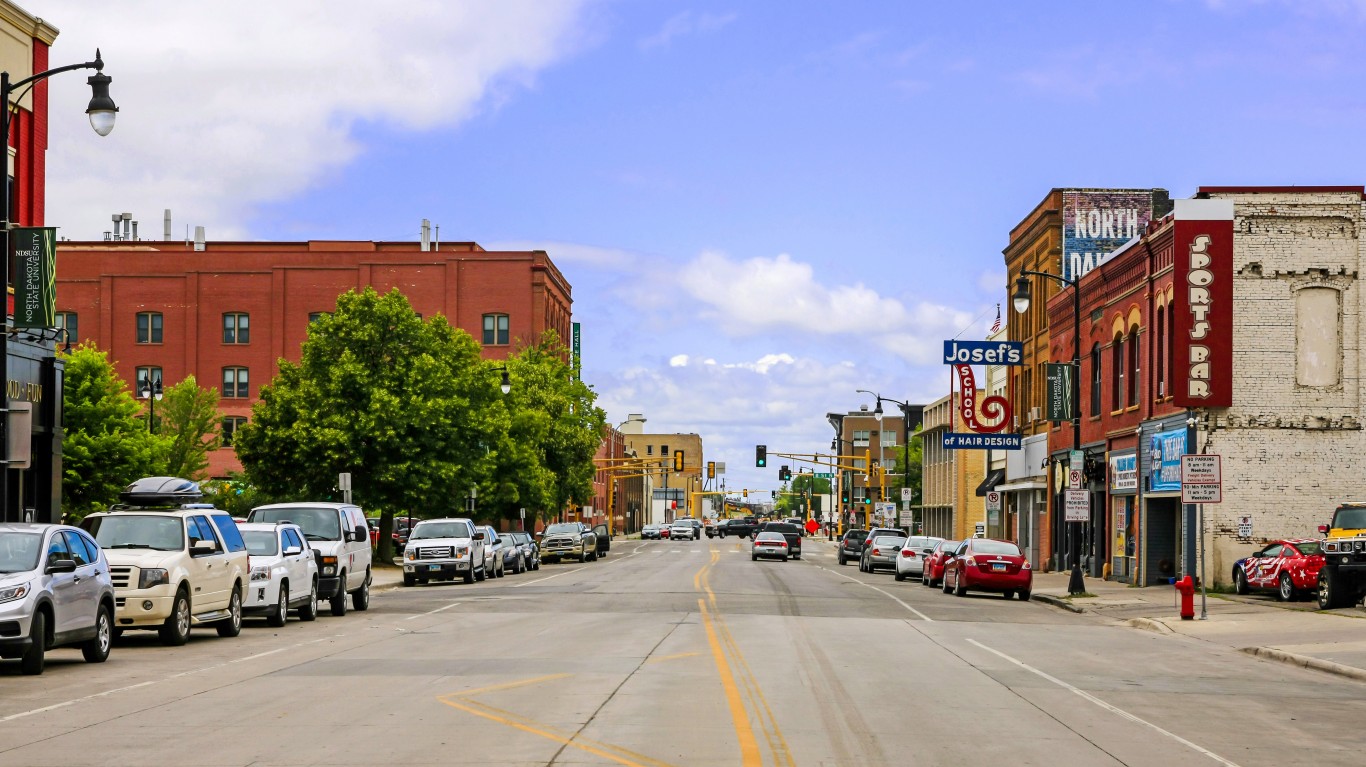
6. North Dakota
> Total COVID-19 deaths in North Dakota: 179 per 100,000 people (total: 1,357)
> Total COVID-19 infections in North Dakota: 12,516 per 100,000 people (total: 95,135)
> 65 and older population: 15.8%
> Total population: 760,077

7. Mississippi
> Total COVID-19 deaths in Mississippi: 178 per 100,000 people (total: 5,315)
> Total COVID-19 infections in Mississippi: 8,167 per 100,000 people (total: 243,899)
> 65 and older population: 16.4%
> Total population: 2,986,530

8. Louisiana
> Total COVID-19 deaths in Louisiana: 172 per 100,000 people (total: 8,022)
> Total COVID-19 infections in Louisiana: 7,636 per 100,000 people (total: 355,835)
> 65 and older population: 16.0%
> Total population: 4,659,978

9. New York
> Total COVID-19 deaths in New York: 165 per 100,000 people (total: 32,175)
> Total COVID-19 infections in New York: 5,987 per 100,000 people (total: 1,169,947)
> 65 and older population: 16.9%
> Total population: 19,542,209

10. Illinois
> Total COVID-19 deaths in Illinois: 154 per 100,000 people (total: 19,617)
> Total COVID-19 infections in Illinois: 8,210 per 100,000 people (total: 1,046,030)
> 65 and older population: 16.1%
> Total population: 12,741,080

11. Arizona
> Total COVID-19 deaths in Arizona: 149 per 100,000 people (total: 10,673)
> Total COVID-19 infections in Arizona: 8,948 per 100,000 people (total: 641,729)
> 65 and older population: 18.0%
> Total population: 7,171,646

12. Pennsylvania
> Total COVID-19 deaths in Pennsylvania: 144 per 100,000 people (total: 18,429)
> Total COVID-19 infections in Pennsylvania: 5,789 per 100,000 people (total: 741,389)
> 65 and older population: 18.7%
> Total population: 12,807,060

13. Michigan
> Total COVID-19 deaths in Michigan: 143 per 100,000 people (total: 14,336)
> Total COVID-19 infections in Michigan: 5,735 per 100,000 people (total: 573,278)
> 65 and older population: 17.7%
> Total population: 9,995,915

14. Arkansas
> Total COVID-19 deaths in Arkansas: 137 per 100,000 people (total: 4,121)
> Total COVID-19 infections in Arkansas: 8,612 per 100,000 people (total: 259,553)
> 65 and older population: 17.4%
> Total population: 3,013,825

15. Iowa
> Total COVID-19 deaths in Iowa: 134 per 100,000 people (total: 4,232)
> Total COVID-19 infections in Iowa: 9,514 per 100,000 people (total: 300,280)
> 65 and older population: 17.5%
> Total population: 3,156,145
These are all the counties in Iowa where COVID-19 is slowing (and where it’s still getting worse).

16. New Mexico
> Total COVID-19 deaths in New Mexico: 134 per 100,000 people (total: 2,807)
> Total COVID-19 infections in New Mexico: 7,594 per 100,000 people (total: 159,119)
> 65 and older population: 18.0%
> Total population: 2,095,428

17. Indiana
> Total COVID-19 deaths in Indiana: 131 per 100,000 people (total: 8,790)
> Total COVID-19 infections in Indiana: 8,579 per 100,000 people (total: 574,119)
> 65 and older population: 16.1%
> Total population: 6,691,878

18. Washington D.C.
> Total COVID-19 deaths in Washington D.C.: 121 per 100,000 people (total: 831)
> Total COVID-19 infections in Washington D.C.: 4,763 per 100,000 people (total: 32,600)
> 65 and older population: 12.4%
> Total population: 702,455
Click here to see all COVID-19 data for Washington D.C.

19. Tennessee
> Total COVID-19 deaths in Tennessee: 120 per 100,000 people (total: 8,148)
> Total COVID-19 infections in Tennessee: 9,830 per 100,000 people (total: 665,499)
> 65 and older population: 16.7%
> Total population: 6,770,010

20. Nevada
> Total COVID-19 deaths in Nevada: 119 per 100,000 people (total: 3,596)
> Total COVID-19 infections in Nevada: 8,370 per 100,000 people (total: 253,985)
> 65 and older population: 16.2%
> Total population: 3,034,392
These are all the counties in Nevada where COVID-19 is slowing (and where it’s still getting worse).

21. Alabama
> Total COVID-19 deaths in Alabama: 118 per 100,000 people (total: 5,760)
> Total COVID-19 infections in Alabama: 8,408 per 100,000 people (total: 410,995)
> 65 and older population: 17.4%
> Total population: 4,887,871

22. South Carolina
> Total COVID-19 deaths in South Carolina: 116 per 100,000 people (total: 5,911)
> Total COVID-19 infections in South Carolina: 7,187 per 100,000 people (total: 365,378)
> 65 and older population: 18.2%
> Total population: 5,084,127

23. Kansas
> Total COVID-19 deaths in Kansas: 115 per 100,000 people (total: 3,355)
> Total COVID-19 infections in Kansas: 8,657 per 100,000 people (total: 252,041)
> 65 and older population: 16.4%
> Total population: 2,911,510
These are all the counties in Kansas where COVID-19 is slowing (and where it’s still getting worse).

24. Georgia
> Total COVID-19 deaths in Georgia: 112 per 100,000 people (total: 11,803)
> Total COVID-19 infections in Georgia: 6,220 per 100,000 people (total: 654,356)
> 65 and older population: 14.3%
> Total population: 10,519,475

25. Florida
> Total COVID-19 deaths in Florida: 112 per 100,000 people (total: 23,754)
> Total COVID-19 infections in Florida: 7,125 per 100,000 people (total: 1,517,472)
> 65 and older population: 20.9%
> Total population: 21,299,325

26. Texas
> Total COVID-19 deaths in Texas: 107 per 100,000 people (total: 30,624)
> Total COVID-19 infections in Texas: 7,047 per 100,000 people (total: 2,022,635)
> 65 and older population: 12.9%
> Total population: 28,701,845
These are all the counties in Texas where COVID-19 is slowing (and where it’s still getting worse).

27. Maryland
> Total COVID-19 deaths in Maryland: 106 per 100,000 people (total: 6,404)
> Total COVID-19 infections in Maryland: 5,211 per 100,000 people (total: 314,867)
> 65 and older population: 15.9%
> Total population: 6,042,718

28. Minnesota
> Total COVID-19 deaths in Minnesota: 103 per 100,000 people (total: 5,774)
> Total COVID-19 infections in Minnesota: 7,848 per 100,000 people (total: 440,354)
> 65 and older population: 16.3%
> Total population: 5,611,179

29. Delaware
> Total COVID-19 deaths in Delaware: 103 per 100,000 people (total: 994)
> Total COVID-19 infections in Delaware: 6,945 per 100,000 people (total: 67,173)
> 65 and older population: 19.5%
> Total population: 967,171

30. Missouri
> Total COVID-19 deaths in Missouri: 101 per 100,000 people (total: 6,171)
> Total COVID-19 infections in Missouri: 7,005 per 100,000 people (total: 429,177)
> 65 and older population: 17.2%
> Total population: 6,126,452

31. Montana
> Total COVID-19 deaths in Montana: 101 per 100,000 people (total: 1,069)
> Total COVID-19 infections in Montana: 8,251 per 100,000 people (total: 87,653)
> 65 and older population: 19.5%
> Total population: 1,062,305

32. Nebraska
> Total COVID-19 deaths in Nebraska: 93 per 100,000 people (total: 1,791)
> Total COVID-19 infections in Nebraska: 9,209 per 100,000 people (total: 177,670)
> 65 and older population: 16.1%
> Total population: 1,929,268

33. Colorado
> Total COVID-19 deaths in Colorado: 93 per 100,000 people (total: 5,285)
> Total COVID-19 infections in Colorado: 6,440 per 100,000 people (total: 366,774)
> 65 and older population: 14.7%
> Total population: 5,695,564

34. West Virginia
> Total COVID-19 deaths in West Virginia: 93 per 100,000 people (total: 1,671)
> Total COVID-19 infections in West Virginia: 5,781 per 100,000 people (total: 104,392)
> 65 and older population: 20.5%
> Total population: 1,805,832

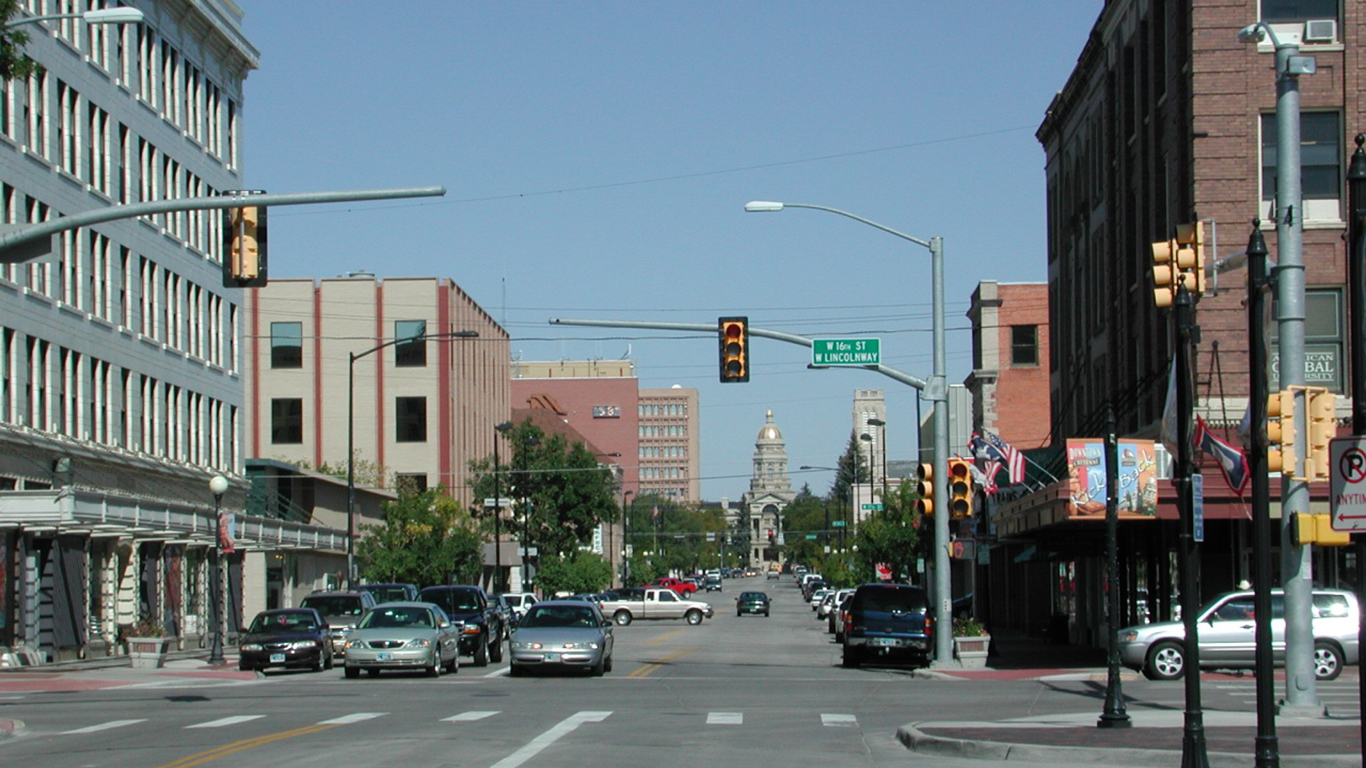
35. Wyoming
> Total COVID-19 deaths in Wyoming: 90 per 100,000 people (total: 522)
> Total COVID-19 infections in Wyoming: 8,358 per 100,000 people (total: 48,289)
> 65 and older population: 17.1%
> Total population: 577,737

36. Wisconsin
> Total COVID-19 deaths in Wisconsin: 90 per 100,000 people (total: 5,248)
> Total COVID-19 infections in Wisconsin: 8,829 per 100,000 people (total: 513,270)
> 65 and older population: 17.5%
> Total population: 5,813,568

37. Idaho
> Total COVID-19 deaths in Idaho: 89 per 100,000 people (total: 1,564)
> Total COVID-19 infections in Idaho: 8,686 per 100,000 people (total: 152,364)
> 65 and older population: 16.2%
> Total population: 1,754,208
These are all the counties in Idaho where COVID-19 is slowing (and where it’s still getting worse).

38. Ohio
> Total COVID-19 deaths in Ohio: 85 per 100,000 people (total: 9,881)
> Total COVID-19 infections in Ohio: 6,841 per 100,000 people (total: 799,639)
> 65 and older population: 17.5%
> Total population: 11,689,442
These are all the counties in Ohio where COVID-19 is slowing (and where it’s still getting worse).

39. California
> Total COVID-19 deaths in California: 79 per 100,000 people (total: 31,102)
> Total COVID-19 infections in California: 7,030 per 100,000 people (total: 2,781,039)
> 65 and older population: 14.8%
> Total population: 39,557,045

40. North Carolina
> Total COVID-19 deaths in North Carolina: 75 per 100,000 people (total: 7,745)
> Total COVID-19 infections in North Carolina: 6,174 per 100,000 people (total: 641,073)
> 65 and older population: 16.7%
> Total population: 10,383,620

41. Oklahoma
> Total COVID-19 deaths in Oklahoma: 72 per 100,000 people (total: 2,848)
> Total COVID-19 infections in Oklahoma: 8,657 per 100,000 people (total: 341,364)
> 65 and older population: 16.1%
> Total population: 3,943,079

42. Kentucky
> Total COVID-19 deaths in Kentucky: 67 per 100,000 people (total: 2,991)
> Total COVID-19 infections in Kentucky: 7,011 per 100,000 people (total: 313,282)
> 65 and older population: 16.9%
> Total population: 4,468,402

43. New Hampshire
> Total COVID-19 deaths in New Hampshire: 65 per 100,000 people (total: 885)
> Total COVID-19 infections in New Hampshire: 3,990 per 100,000 people (total: 54,125)
> 65 and older population: 18.6%
> Total population: 1,356,458

44. Virginia
> Total COVID-19 deaths in Virginia: 65 per 100,000 people (total: 5,552)
> Total COVID-19 infections in Virginia: 4,843 per 100,000 people (total: 412,545)
> 65 and older population: 15.9%
> Total population: 8,517,685

45. Washington
> Total COVID-19 deaths in Washington: 51 per 100,000 people (total: 3,838)
> Total COVID-19 infections in Washington: 3,732 per 100,000 people (total: 281,202)
> 65 and older population: 15.9%
> Total population: 7,535,591

46. Utah
> Total COVID-19 deaths in Utah: 46 per 100,000 people (total: 1,449)
> Total COVID-19 infections in Utah: 9,959 per 100,000 people (total: 314,817)
> 65 and older population: 11.4%
> Total population: 3,161,105
These are all the counties in Utah where COVID-19 is slowing (and where it’s still getting worse).

47. Oregon
> Total COVID-19 deaths in Oregon: 41 per 100,000 people (total: 1,708)
> Total COVID-19 infections in Oregon: 3,081 per 100,000 people (total: 129,109)
> 65 and older population: 18.2%
> Total population: 4,190,713
These are all the counties in Oregon where COVID-19 is slowing (and where it’s still getting worse).

48. Maine
> Total COVID-19 deaths in Maine: 34 per 100,000 people (total: 453)
> Total COVID-19 infections in Maine: 2,327 per 100,000 people (total: 31,150)
> 65 and older population: 21.3%
> Total population: 1,338,404
These are all the counties in Maine where COVID-19 is slowing (and where it’s still getting worse).

49. Alaska
> Total COVID-19 deaths in Alaska: 31 per 100,000 people (total: 225)
> Total COVID-19 infections in Alaska: 6,891 per 100,000 people (total: 50,816)
> 65 and older population: 12.4%
> Total population: 737,438
These are all the counties in Alaska where COVID-19 is slowing (and where it’s still getting worse).

50. Vermont
> Total COVID-19 deaths in Vermont: 25 per 100,000 people (total: 158)
> Total COVID-19 infections in Vermont: 1,496 per 100,000 people (total: 9,368)
> 65 and older population: 20.1%
> Total population: 626,299

51. Hawaii
> Total COVID-19 deaths in Hawaii: 22 per 100,000 people (total: 312)
> Total COVID-19 infections in Hawaii: 1,671 per 100,000 people (total: 23,733)
> 65 and older population: 19.0%
> Total population: 1,420,491
These are all the counties in Hawaii where COVID-19 is slowing (and where it’s still getting worse).
Click here to see all coronavirus data for every state.
The thought of burdening your family with a financial disaster is most Americans’ nightmare. However, recent studies show that over 100 million Americans still don’t have proper life insurance in the event they pass away.
Life insurance can bring peace of mind – ensuring your loved ones are safeguarded against unforeseen expenses and debts. With premiums often lower than expected and a variety of plans tailored to different life stages and health conditions, securing a policy is more accessible than ever.
A quick, no-obligation quote can provide valuable insight into what’s available and what might best suit your family’s needs. Life insurance is a simple step you can take today to help secure peace of mind for your loved ones tomorrow.
Click here to learn how to get a quote in just a few minutes.
Thank you for reading! Have some feedback for us?
Contact the 24/7 Wall St. editorial team.