
Life expectancy in the U.S. was beginning to stabilize after declining for several years. An American born in 2020 had an average life expectancy of 78.6 years, slightly lower than in 2018 but an improvement compared to the annual declines in 2017, 2016, and 2015. But the coronavirus pandemic appears to have shortened the average life expectancy by 1.13 years, according to research by the University of Southern California and Princeton University.
That is the largest single-year decline in life expectancy in the past 40 years, dropping the U.S. life expectancy to 77.48 years — the lowest since 2003.
To highlight how life expectancy trends vary across the United States, 24/7 Tempo listed the city in every state with the longest average life expectancy at birth in 2018, using data on life expectancy in U.S. metropolitan areas from County Health Rankings & Roadmaps, a collaboration between the Robert Wood Johnson Foundation and the University Of Wisconsin Population Health Institute.
The association between wealth and longevity is well established. Wealthier people have access to higher quality medical care, experience less financial-related stress, and tend to be healthier. The cities on this list tend to have higher household incomes than the statewide average.
Another common trend among the cities with the longest life expectancy in their state is the tendency to report healthier outcomes than the state average. For example, obesity is associated with higher risk of cancer and other life-threatening diseases. And adult obesity rates in the majority of cities with the longest life expectancy in their state are lower than the state and national adult obesity rates. Click here for the most obese city in every state.
Similarly, smoking rates in the metro areas on this list are almost always lower than the state and national adult smoking rates.
While every city on this list has the longest life expectancy in its state, the city’s life expectancy is not necessarily longer than the national life expectancy. For example, because life expectancy is the lowest in West Virginia, even in Morgantown — the metro area with the longest life expectancy in the state — residents are expected to live shorter lives than the typical American. Click here for the 40 American cities where people live the longest.
Click here for the city where people live the longest in every state
Click here to see our detailed methodology.

Alabama: Daphne-Fairhope-Foley
> Life expectancy in 2018: 78.45 years — 0.64 years less than US average
> Statewide life expectancy: 75.42 years — 3rd lowest
> Obesity rate: 31.0% (35.5% in Alabama)
> Smoking rate: 17.5% (20.9% in Alabama)
> Adults who don’t exercise regularly: 26.5% (29.8% in Alabama)
> Adults without health insurance: 8.1% (9.7% in Alabama)
> Median household income: $56,439 (Alabama average: $51,734)
> Population: 223,234
[in-text-ad]

Alaska: Fairbanks
> Life expectancy in 2018: 79.66 years — 0.57 years more than US average
> Statewide life expectancy: 78.77 years — 22nd lowest
> Obesity rate: 30.0% (32.5% in Alaska)
> Smoking rate: 15.9% (21.0% in Alaska)
> Adults who don’t exercise regularly: 18.2% (20.0% in Alaska)
> Adults without health insurance: 8.2% (12.2% in Alaska)
> Median household income: $72,065 (Alaska average: $75,463)
> Population: 96,849

Arizona: Yuma
> Life expectancy in 2018: 82.93 years — 3.84 years more than US average
> Statewide life expectancy: 79.90 years — 12th highest
> Obesity rate: 36.9% (27.5% in Arizona)
> Smoking rate: 13.3% (15.6% in Arizona)
> Adults who don’t exercise regularly: 26.3% (21.8% in Arizona)
> Adults without health insurance: 14.0% (11.3% in Arizona)
> Median household income: $46,419 (Arizona average: $62,055)
> Population: 213,787

Arkansas: Fayetteville-Springdale-Rogers
> Life expectancy in 2018: 78.76 years — 0.33 years less than US average
> Statewide life expectancy: 75.93 years — 5th lowest
> Obesity rate: 29.7% (34.2% in Arkansas)
> Smoking rate: 18.0% (22.3% in Arkansas)
> Adults who don’t exercise regularly: 24.6% (31.6% in Arkansas)
> Adults without health insurance: 11.2% (9.1% in Arkansas)
> Median household income: $61,674 (Arkansas average: $48,952)
> Population: 536,120
[in-text-ad-2]

California: San Jose-Sunnyvale-Santa Clara
> Life expectancy in 2018: 84.55 years — 5.46 years more than US average
> Statewide life expectancy: 81.58 years — 2nd highest
> Obesity rate: 19.8% (23.6% in California)
> Smoking rate: 8.3% (11.3% in California)
> Adults who don’t exercise regularly: 16.2% (17.6% in California)
> Adults without health insurance: 4.8% (7.7% in California)
> Median household income: $130,865 (California average: $80,440)
> Population: 1,990,660
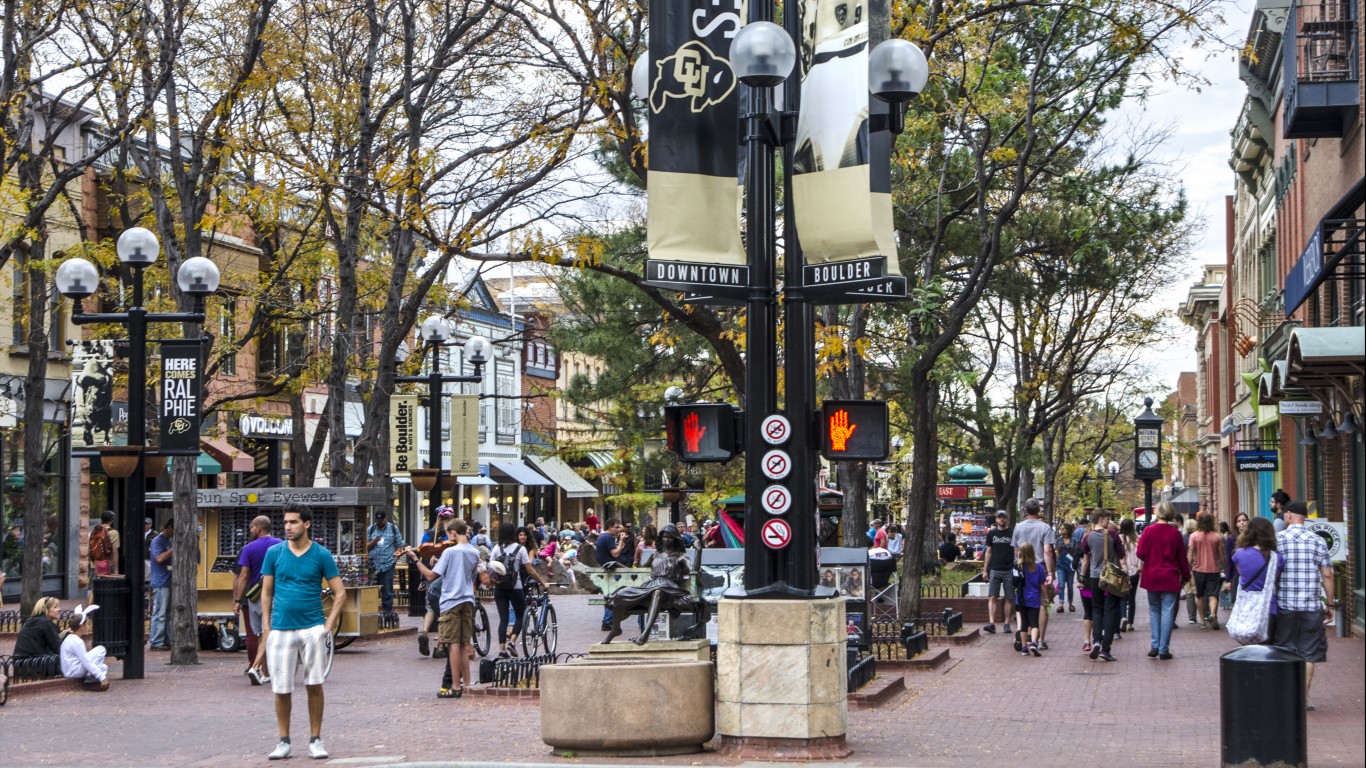
Colorado: Boulder
> Life expectancy in 2018: 82.97 years — 3.88 years more than US average
> Statewide life expectancy: 80.50 years — 7th highest
> Obesity rate: 15.2% (21.8% in Colorado)
> Smoking rate: 11.3% (14.6% in Colorado)
> Adults who don’t exercise regularly: 9.5% (15.5% in Colorado)
> Adults without health insurance: 5.4% (8.0% in Colorado)
> Median household income: $88,535 (Colorado average: $77,127)
> Population: 326,196
[in-text-ad]

Connecticut: Bridgeport-Stamford-Norwalk
> Life expectancy in 2018: 82.71 years — 3.62 years more than US average
> Statewide life expectancy: 80.87 years — 5th highest
> Obesity rate: 21.3% (25.8% in Connecticut)
> Smoking rate: 10.2% (12.7% in Connecticut)
> Adults who don’t exercise regularly: 17.7% (20.4% in Connecticut)
> Adults without health insurance: 9.1% (5.9% in Connecticut)
> Median household income: $97,053 (Connecticut average: $78,833)
> Population: 943,332

Delaware: Philadelphia-Camden-Wilmington
> Life expectancy in 2018: 78.43 years — 0.66 years less than US average
> Statewide life expectancy: 78.43 years — 18th lowest
> Obesity rate: 27.6% (30.9% in Delaware)
> Smoking rate: 16.1% (17.0% in Delaware)
> Adults who don’t exercise regularly: 22.5% (27.7% in Delaware)
> Adults without health insurance: 5.6% (6.6% in Delaware)
> Median household income: $74,533 (Delaware average: $70,176)
> Population: 6,102,434

Florida: Naples-Immokalee-Marco Island
> Life expectancy in 2018: 86.06 years — 6.97 years more than US average
> Statewide life expectancy: 80.04 years — 10th highest
> Obesity rate: 21.3% (26.6% in Florida)
> Smoking rate: 14.4% (16.1% in Florida)
> Adults who don’t exercise regularly: 23.2% (25.9% in Florida)
> Adults without health insurance: 13.1% (13.2% in Florida)
> Median household income: $76,025 (Florida average: $59,227)
> Population: 384,902
[in-text-ad-2]

Georgia: Gainesville
> Life expectancy in 2018: 79.36 years — 0.27 years more than US average
> Statewide life expectancy: 77.77 years — 13th lowest
> Obesity rate: 32.6% (32.0% in Georgia)
> Smoking rate: 15.6% (17.5% in Georgia)
> Adults who don’t exercise regularly: 26.0% (27.5% in Georgia)
> Adults without health insurance: 18.4% (13.4% in Georgia)
> Median household income: $67,467 (Georgia average: $61,980)
> Population: 204,441

Hawaii: Kahului-Wailuku-Lahaina
> Life expectancy in 2018: 83.29 years — 4.20 years more than US average
> Statewide life expectancy: 82.29 years — the highest
> Obesity rate: 24.0% (23.7% in Hawaii)
> Smoking rate: 12.3% (12.8% in Hawaii)
> Adults who don’t exercise regularly: 20.0% (20.5% in Hawaii)
> Adults without health insurance: 6.3% (4.2% in Hawaii)
> Median household income: $80,754 (Hawaii average: $83,102)
> Population: 167,488
[in-text-ad]
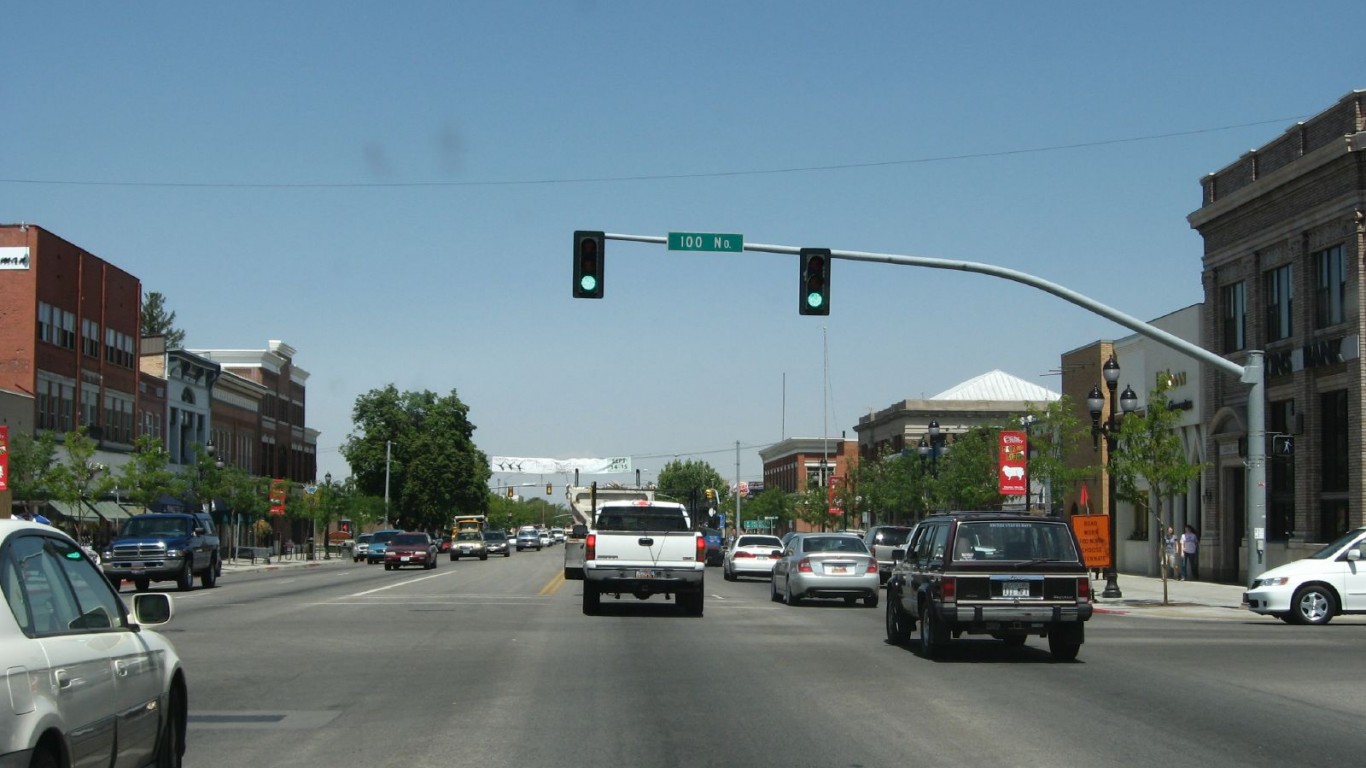
Idaho: Logan
> Life expectancy in 2018: 81.00 years — 1.91 years more than US average
> Statewide life expectancy: 79.32 years — 22nd highest
> Obesity rate: 26.4% (25.9% in Idaho)
> Smoking rate: 9.1% (8.9% in Idaho)
> Adults who don’t exercise regularly: 15.9% (20.8% in Idaho)
> Adults without health insurance: 6.3% (9.7% in Idaho)
> Median household income: $61,467 (Idaho average: $75,780)
> Population: 141,760
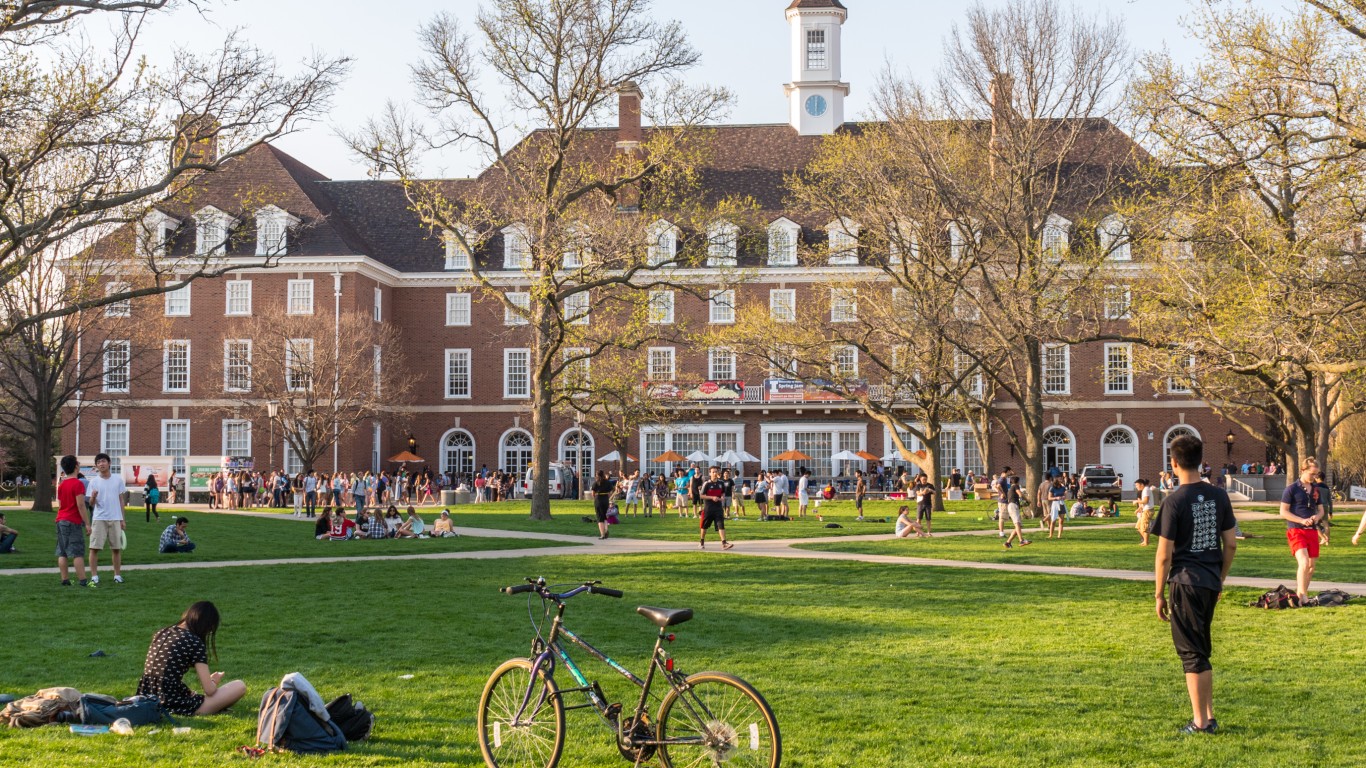
Illinois: Champaign-Urbana
> Life expectancy in 2018: 80.20 years — 1.11 years more than US average
> Statewide life expectancy: 79.25 years — 23rd highest
> Obesity rate: 30.1% (29.7% in Illinois)
> Smoking rate: 15.6% (15.5% in Illinois)
> Adults who don’t exercise regularly: 22.4% (22.3% in Illinois)
> Adults without health insurance: 4.2% (7.4% in Illinois)
> Median household income: $53,081 (Illinois average: $69,187)
> Population: 226,033

Indiana: Bloomington
> Life expectancy in 2018: 79.48 years — 0.39 years more than US average
> Statewide life expectancy: 77.04 years — 11th lowest
> Obesity rate: 26.1% (33.4% in Indiana)
> Smoking rate: 20.0% (21.8% in Indiana)
> Adults who don’t exercise regularly: 23.1% (26.7% in Indiana)
> Adults without health insurance: 6.4% (8.7% in Indiana)
> Median household income: $52,526 (Indiana average: $57,603)
> Population: 169,230
[in-text-ad-2]

Iowa: Iowa City
> Life expectancy in 2018: 82.19 years — 3.10 years more than US average
> Statewide life expectancy: 79.41 years — 21st highest
> Obesity rate: 27.4% (33.2% in Iowa)
> Smoking rate: 14.6% (17.1% in Iowa)
> Adults who don’t exercise regularly: 17.4% (23.7% in Iowa)
> Adults without health insurance: 7.7% (5.0% in Iowa)
> Median household income: $63,761 (Iowa average: $61,691)
> Population: 173,105
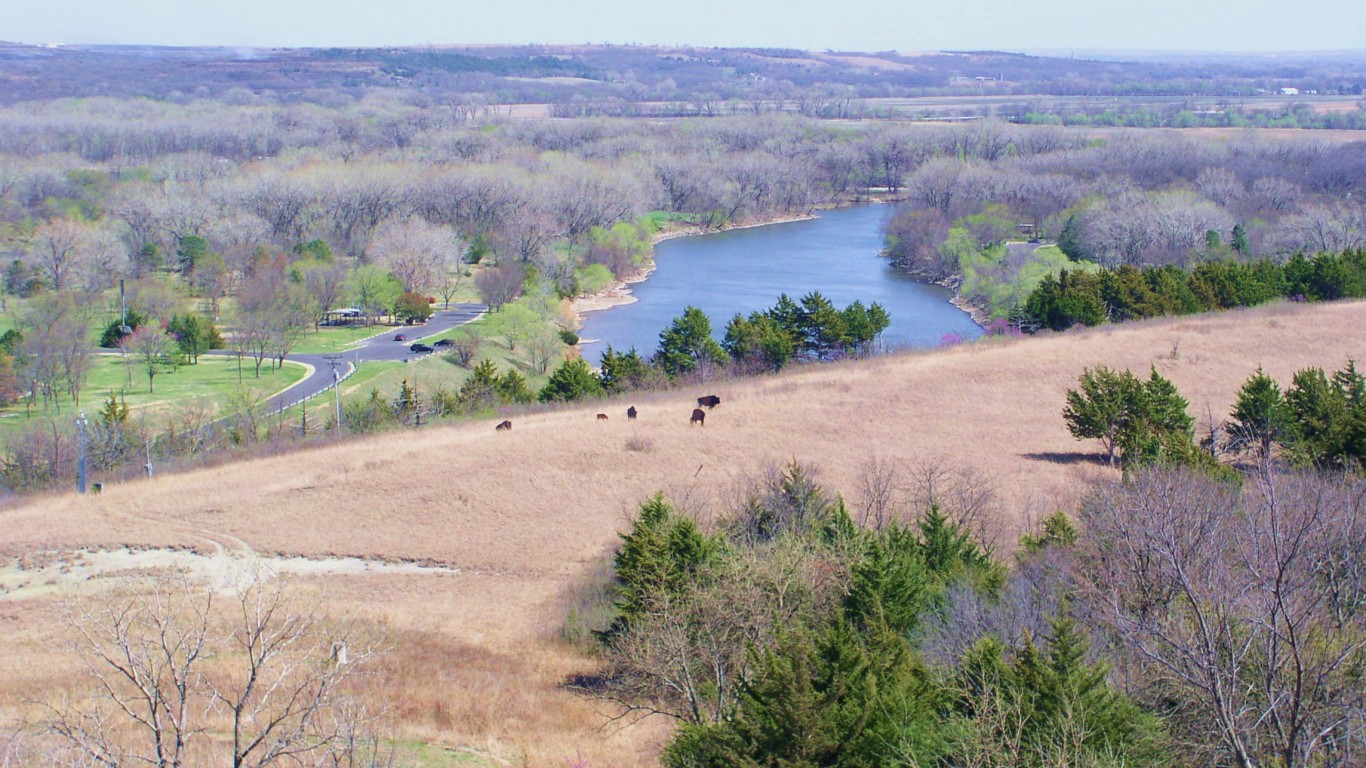
Kansas: Manhattan
> Life expectancy in 2018: 80.76 years — 1.67 years more than US average
> Statewide life expectancy: 78.52 years — 20th lowest
> Obesity rate: 26.7% (33.2% in Kansas)
> Smoking rate: 14.6% (17.4% in Kansas)
> Adults who don’t exercise regularly: 18.8% (24.8% in Kansas)
> Adults without health insurance: 8.4% (9.2% in Kansas)
> Median household income: $59,010 (Kansas average: $62,087)
> Population: 130,285
[in-text-ad]
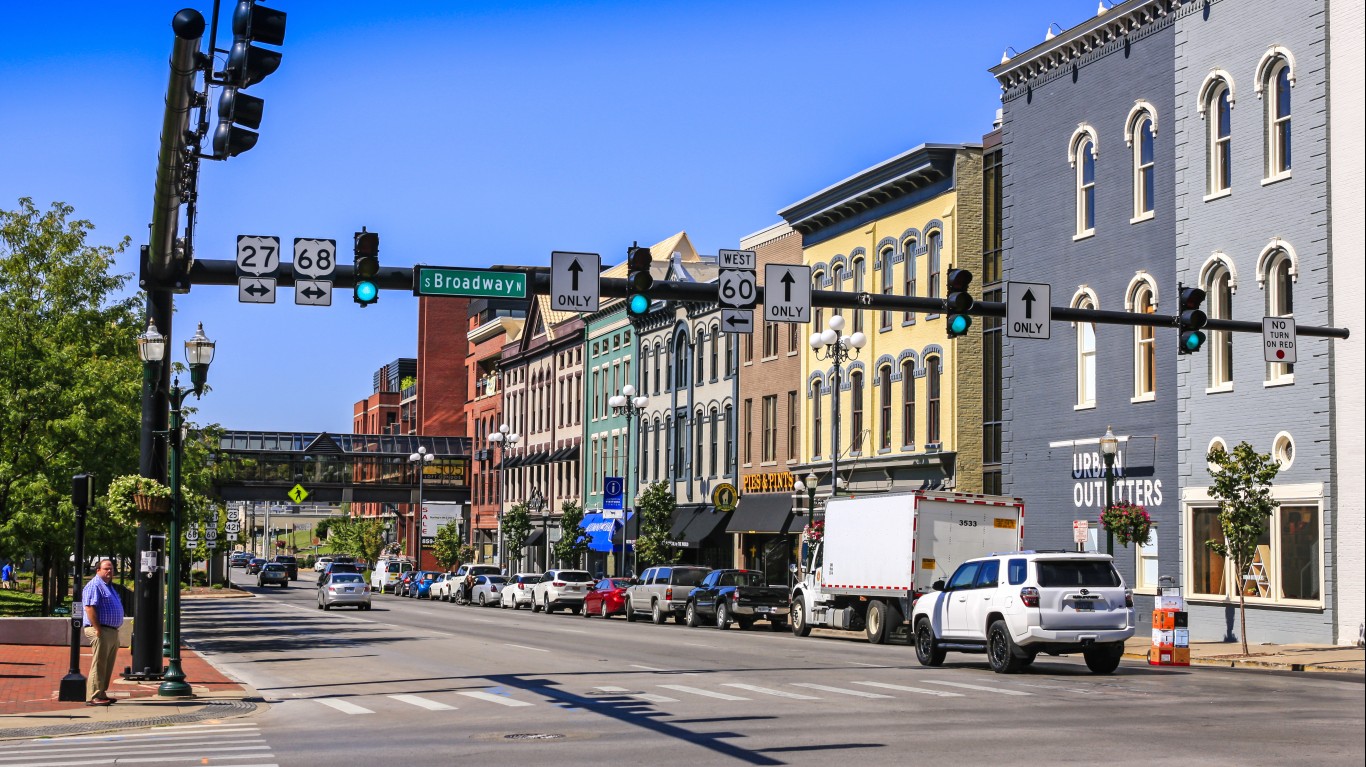
Kentucky: Lexington-Fayette
> Life expectancy in 2018: 77.63 years — 1.46 years less than US average
> Statewide life expectancy: 75.43 years — 4th lowest
> Obesity rate: 29.2% (33.8% in Kentucky)
> Smoking rate: 19.4% (24.6% in Kentucky)
> Adults who don’t exercise regularly: 22.9% (28.6% in Kentucky)
> Adults without health insurance: 6.4% (6.4% in Kentucky)
> Median household income: $60,492 (Kentucky average: $52,295)
> Population: 517,056
Louisiana: New Orleans-Metairie
> Life expectancy in 2018: 77.27 years — 1.82 years less than US average
> Statewide life expectancy: 76.07 years — 8th lowest
> Obesity rate: 32.5% (35.4% in Louisiana)
> Smoking rate: 20.0% (23.1% in Louisiana)
> Adults who don’t exercise regularly: 25.4% (29.2% in Louisiana)
> Adults without health insurance: 9.2% (8.9% in Louisiana)
> Median household income: $55,710 (Louisiana average: $51,073)
> Population: 1,270,530

Maine: Portland-South Portland
> Life expectancy in 2018: 79.79 years — 0.70 years more than US average
> Statewide life expectancy: 78.68 years — 21st lowest
> Obesity rate: 26.1% (29.9% in Maine)
> Smoking rate: 12.6% (17.3% in Maine)
> Adults who don’t exercise regularly: 18.3% (21.6% in Maine)
> Adults without health insurance: 5.6% (8.0% in Maine)
> Median household income: $71,913 (Maine average: $58,924)
> Population: 538,500
[in-text-ad-2]

Maryland: California-Lexington Park
> Life expectancy in 2018: 78.97 years — 0.12 years less than US average
> Statewide life expectancy: 79.14 years — 24th highest
> Obesity rate: 36.4% (31.0% in Maryland)
> Smoking rate: 15.0% (13.8% in Maryland)
> Adults who don’t exercise regularly: 23.9% (22.4% in Maryland)
> Adults without health insurance: 3.2% (6.0% in Maryland)
> Median household income: $87,947 (Maryland average: $86,738)
> Population: 113,510

Massachusetts: Boston-Cambridge-Newton
> Life expectancy in 2018: 81.16 years — 2.08 years more than US average
> Statewide life expectancy: 80.51 years — 6th highest
> Obesity rate: 23.7% (24.7% in Massachusetts)
> Smoking rate: 12.2% (13.7% in Massachusetts)
> Adults who don’t exercise regularly: 20.2% (21.3% in Massachusetts)
> Adults without health insurance: 3.2% (3.0% in Massachusetts)
> Median household income: $94,430 (Massachusetts average: $85,843)
> Population: 4,873,019
[in-text-ad]
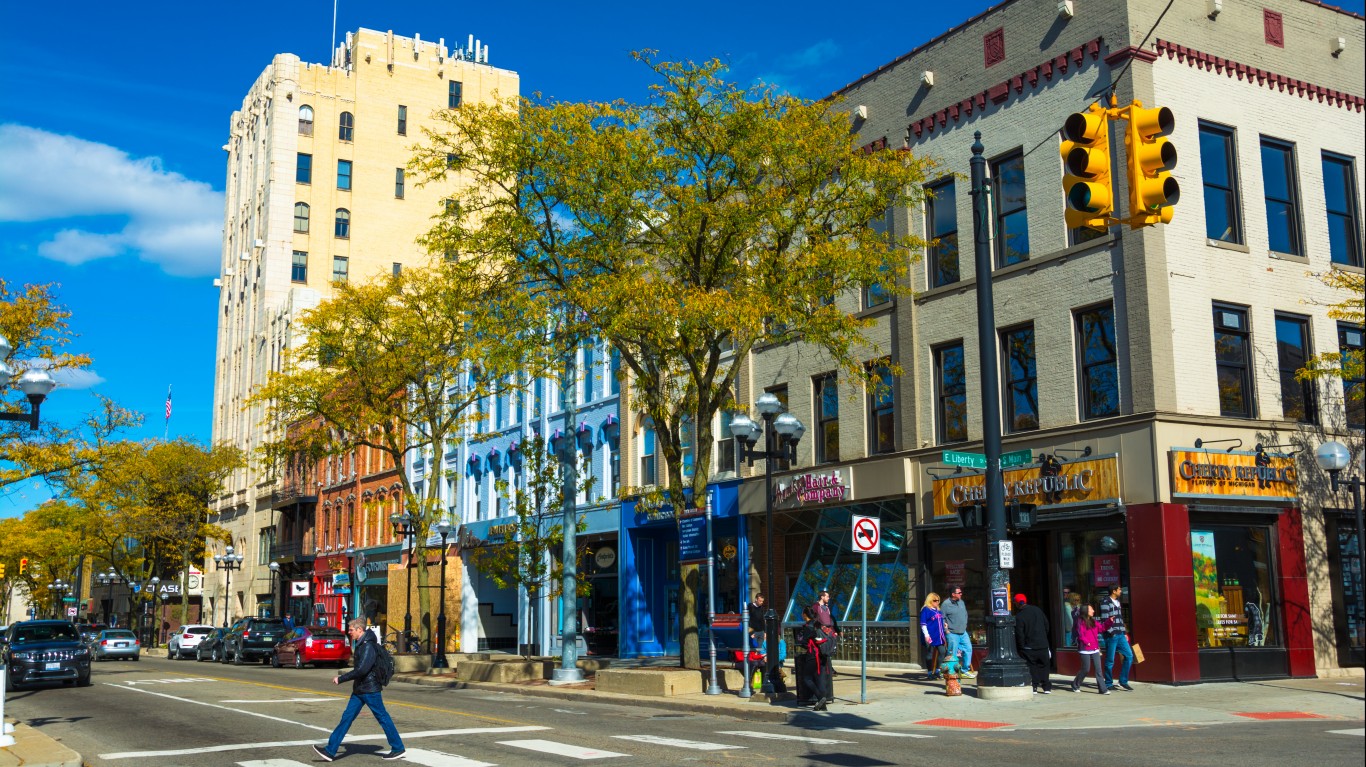
Michigan: Ann Arbor
> Life expectancy in 2018: 81.41 years — 2.32 years more than US average
> Statewide life expectancy: 78.04 years — 14th lowest
> Obesity rate: 24.5% (32.0% in Michigan)
> Smoking rate: 12.1% (19.3% in Michigan)
> Adults who don’t exercise regularly: 15.3% (23.4% in Michigan)
> Adults without health insurance: 3.7% (5.8% in Michigan)
> Median household income: $76,576 (Michigan average: $59,584)
> Population: 367,601

Minnesota: Rochester
> Life expectancy in 2018: 82.22 years — 3.13 years more than US average
> Statewide life expectancy: 80.94 years — 4th highest
> Obesity rate: 29.1% (27.9% in Minnesota)
> Smoking rate: 12.8% (14.5% in Minnesota)
> Adults who don’t exercise regularly: 21.5% (20.1% in Minnesota)
> Adults without health insurance: 5.5% (4.9% in Minnesota)
> Median household income: $75,926 (Minnesota average: $74,593)
> Population: 221,921

Mississippi: Jackson
> Life expectancy in 2018: 76.33 years — 2.76 years less than US average
> Statewide life expectancy: 74.89 years — 2nd lowest
> Obesity rate: 37.2% (36.8% in Mississippi)
> Smoking rate: 17.6% (22.2% in Mississippi)
> Adults who don’t exercise regularly: 30.2% (31.9% in Mississippi)
> Adults without health insurance: 12.5% (13.0% in Mississippi)
> Median household income: $52,426 (Mississippi average: $45,792)
> Population: 594,800
[in-text-ad-2]

Missouri: Columbia
> Life expectancy in 2018: 80.18 years — 1.09 years more than US average
> Statewide life expectancy: 77.29 years — 12th lowest
> Obesity rate: 26.0% (32.2% in Missouri)
> Smoking rate: 18.5% (20.8% in Missouri)
> Adults who don’t exercise regularly: 22.8% (25.8% in Missouri)
> Adults without health insurance: 7.7% (10.0% in Missouri)
> Median household income: $57,359 (Missouri average: $57,409)
> Population: 208,548

Montana: Missoula
> Life expectancy in 2018: 79.46 years — 0.37 years more than US average
> Statewide life expectancy: 78.83 years — 23rd lowest
> Obesity rate: 22.2% (25.8% in Montana)
> Smoking rate: 17.0% (17.2% in Montana)
> Adults who don’t exercise regularly: 16.7% (21.6% in Montana)
> Adults without health insurance: 6.1% (8.3% in Montana)
> Median household income: $57,347 (Montana average: $57,153)
> Population: 119,600
[in-text-ad]

Nebraska: Lincoln
> Life expectancy in 2018: 80.17 years — 1.08 years more than US average
> Statewide life expectancy: 79.61 years — 17th highest
> Obesity rate: 28.8% (32.2% in Nebraska)
> Smoking rate: 12.9% (15.4% in Nebraska)
> Adults who don’t exercise regularly: 17.8% (23.3% in Nebraska)
> Adults without health insurance: 7.2% (8.3% in Nebraska)
> Median household income: $61,539 (Nebraska average: $63,229)
> Population: 336,541

Nevada: Las Vegas-Henderson-Paradise
> Life expectancy in 2018: 78.84 years — 0.25 years less than US average
> Statewide life expectancy: 78.51 years — 19th lowest
> Obesity rate: 25.5% (25.7% in Nevada)
> Smoking rate: 17.0% (17.6% in Nevada)
> Adults who don’t exercise regularly: 23.9% (23.1% in Nevada)
> Adults without health insurance: 12.2% (11.4% in Nevada)
> Median household income: $62,107 (Nevada average: $63,276)
> Population: 2,266,715
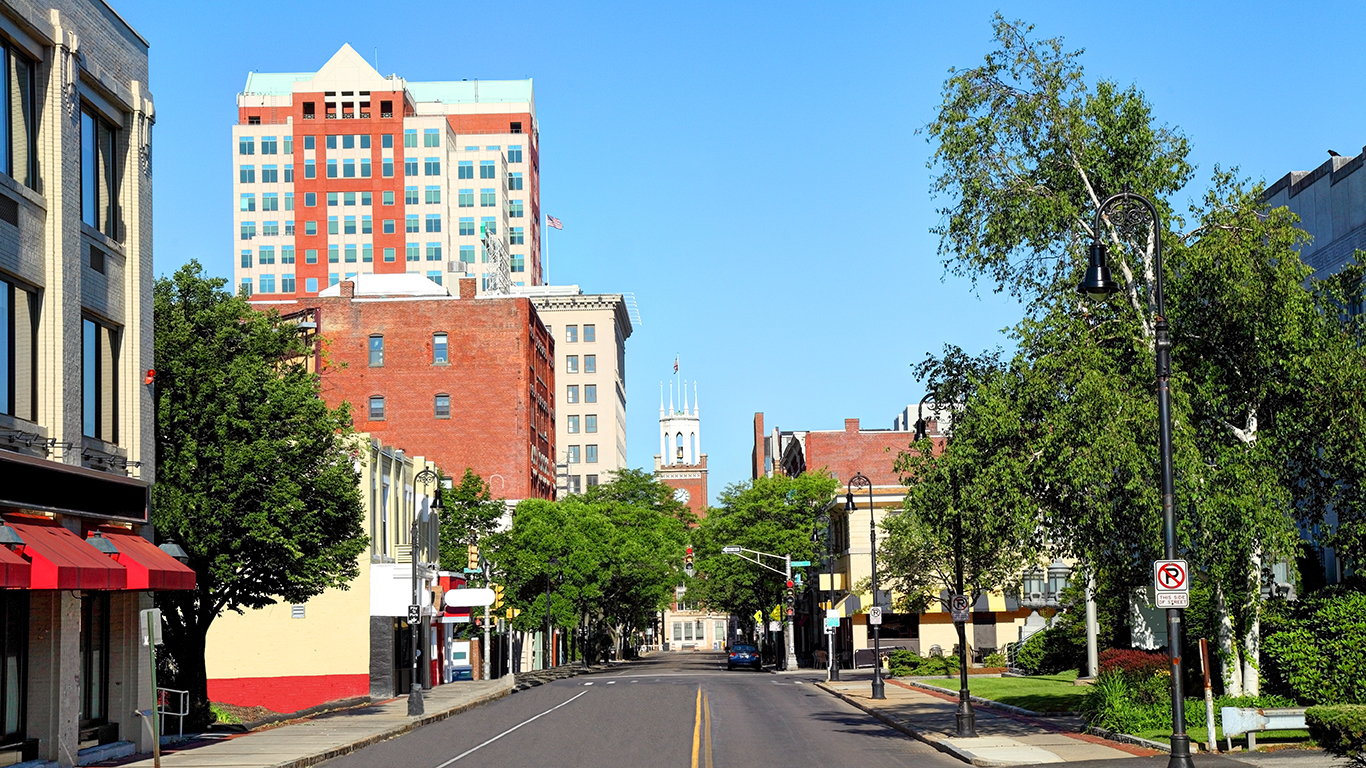
New Hampshire: Manchester-Nashua
> Life expectancy in 2018: 79.43 years — 0.34 years more than US average
> Statewide life expectancy: 79.52 years — 18th highest
> Obesity rate: 28.0% (27.9% in New Hampshire)
> Smoking rate: 13.5% (15.7% in New Hampshire)
> Adults who don’t exercise regularly: 22.5% (21.3% in New Hampshire)
> Adults without health insurance: 6.8% (6.3% in New Hampshire)
> Median household income: $83,626 (New Hampshire average: $77,933)
> Population: 417,025
[in-text-ad-2]

New Jersey: New York-Newark-Jersey City
> Life expectancy in 2018: 82.17 years — 3.08 years more than US average
> Statewide life expectancy: 80.43 years — 8th highest
> Obesity rate: 23.7% (26.4% in New Jersey)
> Smoking rate: 13.1% (13.7% in New Jersey)
> Adults who don’t exercise regularly: 25.1% (26.0% in New Jersey)
> Adults without health insurance: 6.9% (7.9% in New Jersey)
> Median household income: $83,160 (New Jersey average: $85,751)
> Population: 19,216,182
New Mexico: Santa Fe
> Life expectancy in 2018: 81.62 years — 2.53 years more than US average
> Statewide life expectancy: 78.07 years — 16th lowest
> Obesity rate: 14.4% (26.6% in New Mexico)
> Smoking rate: 13.7% (17.5% in New Mexico)
> Adults who don’t exercise regularly: 12.1% (19.7% in New Mexico)
> Adults without health insurance: 12.0% (10.0% in New Mexico)
> Median household income: $61,298 (New Mexico average: $51,945)
> Population: 150,358
[in-text-ad]
New York: Ithaca
> Life expectancy in 2018: 80.70 years — 1.61 years more than US average
> Statewide life expectancy: 81.27 years — 3rd highest
> Obesity rate: 22.7% (25.5% in New York)
> Smoking rate: 14.1% (14.1% in New York)
> Adults who don’t exercise regularly: 15.7% (24.7% in New York)
> Adults without health insurance: 3.7% (5.2% in New York)
> Median household income: $58,626 (New York average: $72,108)
> Population: 102,180

North Carolina: Raleigh
> Life expectancy in 2018: 80.90 years — 1.81 years more than US average
> Statewide life expectancy: 78.05 years — 15th lowest
> Obesity rate: 27.4% (31.4% in North Carolina)
> Smoking rate: 13.3% (17.2% in North Carolina)
> Adults who don’t exercise regularly: 18.9% (24.3% in North Carolina)
> Adults without health insurance: 9.3% (11.3% in North Carolina)
> Median household income: $80,096 (North Carolina average: $57,341)
> Population: 1,390,785

North Dakota: Bismarck
> Life expectancy in 2018: 80.45 years — 1.36 years more than US average
> Statewide life expectancy: 79.88 years — 13th highest
> Obesity rate: 31.6% (32.7% in North Dakota)
> Smoking rate: 16.8% (18.3% in North Dakota)
> Adults who don’t exercise regularly: 21.7% (23.9% in North Dakota)
> Adults without health insurance: 4.4% (6.9% in North Dakota)
> Median household income: $70,979 (North Dakota average: $64,577)
> Population: 129,115
[in-text-ad-2]

Ohio: Columbus
> Life expectancy in 2018: 77.81 years — 1.27 years less than US average
> Statewide life expectancy: 76.93 years — 9th lowest
> Obesity rate: 30.8% (32.3% in Ohio)
> Smoking rate: 19.1% (21.1% in Ohio)
> Adults who don’t exercise regularly: 23.8% (26.4% in Ohio)
> Adults without health insurance: 7.1% (6.6% in Ohio)
> Median household income: $67,207 (Ohio average: $58,642)
> Population: 2,122,271

Oklahoma: Oklahoma City
> Life expectancy in 2018: 77.06 years — 2.03 years less than US average
> Statewide life expectancy: 75.97 years — 6th lowest
> Obesity rate: 32.6% (33.7% in Oklahoma)
> Smoking rate: 16.7% (20.1% in Oklahoma)
> Adults who don’t exercise regularly: 26.8% (29.3% in Oklahoma)
> Adults without health insurance: 12.2% (14.3% in Oklahoma)
> Median household income: $60,605 (Oklahoma average: $54,449)
> Population: 1,408,950
[in-text-ad]

Oregon: Corvallis
> Life expectancy in 2018: 82.80 years — 3.71 years more than US average
> Statewide life expectancy: 79.83 years — 15th highest
> Obesity rate: 24.9% (28.8% in Oregon)
> Smoking rate: 13.3% (16.1% in Oregon)
> Adults who don’t exercise regularly: 13.2% (17.2% in Oregon)
> Adults without health insurance: 4.7% (7.2% in Oregon)
> Median household income: $70,835 (Oregon average: $67,058)
> Population: 93,053

Pennsylvania: State College
> Life expectancy in 2018: 82.92 years — 3.83 years more than US average
> Statewide life expectancy: 78.30 years — 17th lowest
> Obesity rate: 25.2% (30.3% in Pennsylvania)
> Smoking rate: 17.0% (18.7% in Pennsylvania)
> Adults who don’t exercise regularly: 18.1% (23.1% in Pennsylvania)
> Adults without health insurance: 8.2% (5.8% in Pennsylvania)
> Median household income: $60,706 (Pennsylvania average: $63,463)
> Population: 162,385

Rhode Island: Providence-Warwick
> Life expectancy in 2018: 79.46 years — 0.38 years more than US average
> Statewide life expectancy: 79.92 years — 11th highest
> Obesity rate: 28.4% (28.1% in Rhode Island)
> Smoking rate: 14.3% (14.9% in Rhode Island)
> Adults who don’t exercise regularly: 25.2% (24.4% in Rhode Island)
> Adults without health insurance: 3.7% (4.1% in Rhode Island)
> Median household income: $70,967 (Rhode Island average: $71,169)
> Population: 1,624,578
[in-text-ad-2]

South Carolina: Hilton Head Island-Bluffton-Beaufort
> Life expectancy in 2018: 82.04 years — 2.95 years more than US average
> Statewide life expectancy: 77.01 years — 10th lowest
> Obesity rate: 25.3% (32.9% in South Carolina)
> Smoking rate: 13.8% (18.8% in South Carolina)
> Adults who don’t exercise regularly: 18.6% (25.9% in South Carolina)
> Adults without health insurance: 10.2% (10.8% in South Carolina)
> Median household income: $71,252 (South Carolina average: $56,227)
> Population: 222,195

South Dakota: Sioux Falls
> Life expectancy in 2018: 80.22 years — 1.13 years more than US average
> Statewide life expectancy: 79.05 years — 25th lowest
> Obesity rate: 32.2% (31.8% in South Dakota)
> Smoking rate: 14.9% (19.3% in South Dakota)
> Adults who don’t exercise regularly: 19.8% (21.3% in South Dakota)
> Adults without health insurance: 7.5% (10.2% in South Dakota)
> Median household income: $65,566 (South Dakota average: $59,533)
> Population: 268,833
[in-text-ad]

Tennessee: Nashville-Davidson–Murfreesboro–Franklin
> Life expectancy in 2018: 77.56 years — 1.53 years less than US average
> Statewide life expectancy: 75.99 years — 7th lowest
> Obesity rate: 30.8% (33.2% in Tennessee)
> Smoking rate: 18.5% (22.6% in Tennessee)
> Adults who don’t exercise regularly: 24.5% (27.2% in Tennessee)
> Adults without health insurance: 9.3% (10.1% in Tennessee)
> Median household income: $70,262 (Tennessee average: $56,071)
> Population: 1,933,860

Texas: McAllen-Edinburg-Mission
> Life expectancy in 2018: 82.10 years — 3.01 years more than US average
> Statewide life expectancy: 79.09 years — 25th highest
> Obesity rate: 34.4% (30.1% in Texas)
> Smoking rate: 14.6% (15.7% in Texas)
> Adults who don’t exercise regularly: 21.6% (24.4% in Texas)
> Adults without health insurance: 32.2% (18.4% in Texas)
> Median household income: $41,800 (Texas average: $64,034)
> Population: 868,707

Utah: St. George
> Life expectancy in 2018: 81.77 years — 2.68 years more than US average
> Statewide life expectancy: 79.88 years — 14th highest
> Obesity rate: 23.6% (25.9% in Utah)
> Smoking rate: 8.9% (8.9% in Utah)
> Adults who don’t exercise regularly: 19.0% (18.1% in Utah)
> Adults without health insurance: 14.4% (9.7% in Utah)
> Median household income: $63,595 (Utah average: $75,780)
> Population: 177,556
[in-text-ad-2]

Vermont: Burlington-South Burlington
> Life expectancy in 2018: 80.90 years — 1.81 years more than US average
> Statewide life expectancy: 79.68 years — 16th highest
> Obesity rate: 24.3% (26.3% in Vermont)
> Smoking rate: 12.8% (15.8% in Vermont)
> Adults who don’t exercise regularly: 17.2% (19.1% in Vermont)
> Adults without health insurance: 3.7% (4.5% in Vermont)
> Median household income: $74,909 (Vermont average: $63,001)
> Population: 219,433

Virginia: Charlottesville
> Life expectancy in 2018: 81.20 years — 2.11 years more than US average
> Statewide life expectancy: 79.48 years — 19th highest
> Obesity rate: 26.2% (29.8% in Virginia)
> Smoking rate: 15.8% (16.4% in Virginia)
> Adults who don’t exercise regularly: 21.6% (22.9% in Virginia)
> Adults without health insurance: 6.5% (7.9% in Virginia)
> Median household income: $75,907 (Virginia average: $76,456)
> Population: 218,358
[in-text-ad]

Washington: Wenatchee
> Life expectancy in 2018: 81.72 years — 2.63 years more than US average
> Statewide life expectancy: 80.41 years — 9th highest
> Obesity rate: 28.6% (27.8% in Washington)
> Smoking rate: 13.2% (13.5% in Washington)
> Adults who don’t exercise regularly: 18.3% (17.0% in Washington)
> Adults without health insurance: 11.0% (6.6% in Washington)
> Median household income: $60,532 (Washington average: $78,687)
> Population: 120,629
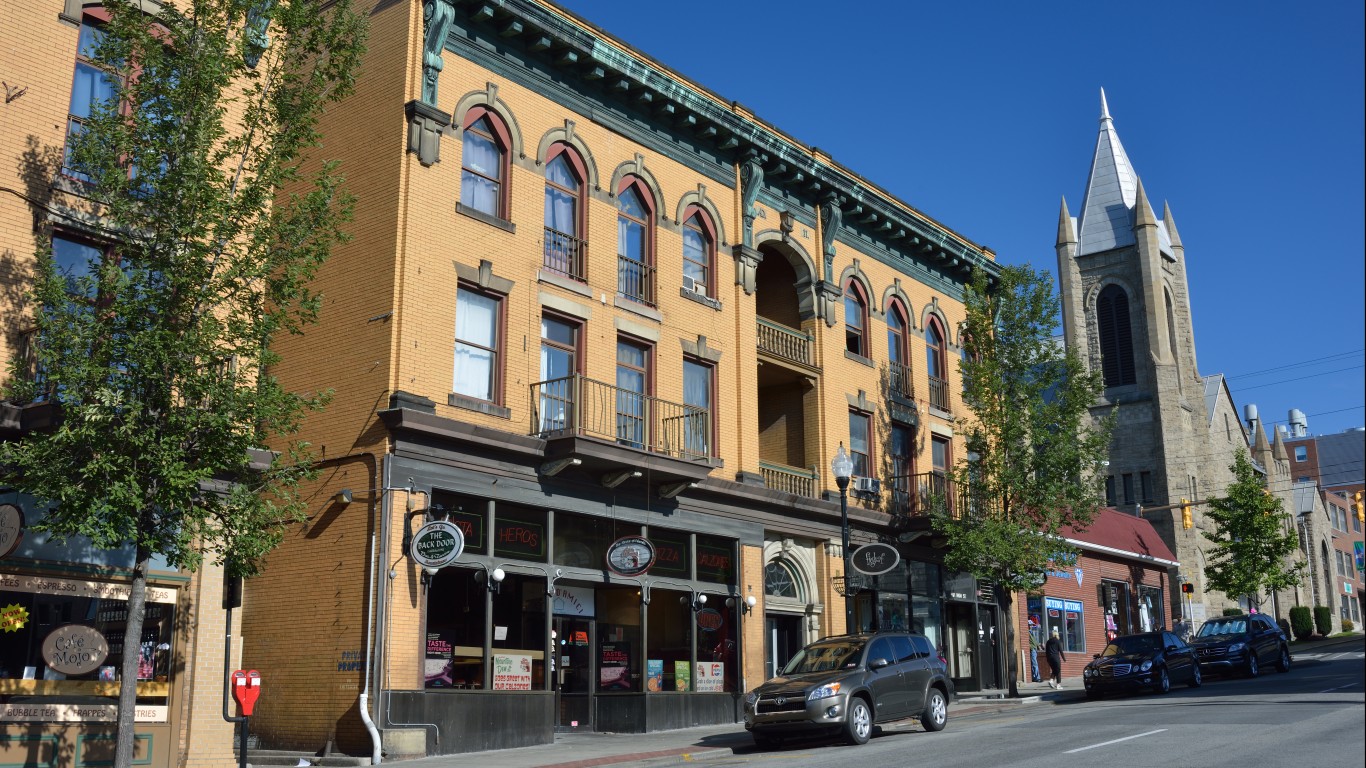
West Virginia: Morgantown
> Life expectancy in 2018: 78.47 years — 0.62 years less than US average
> Statewide life expectancy: 74.80 years — the lowest
> Obesity rate: 31.1% (36.7% in West Virginia)
> Smoking rate: 20.5% (26.0% in West Virginia)
> Adults who don’t exercise regularly: 23.4% (28.9% in West Virginia)
> Adults without health insurance: 4.4% (6.7% in West Virginia)
> Median household income: $56,395 (West Virginia average: $48,850)
> Population: 139,044
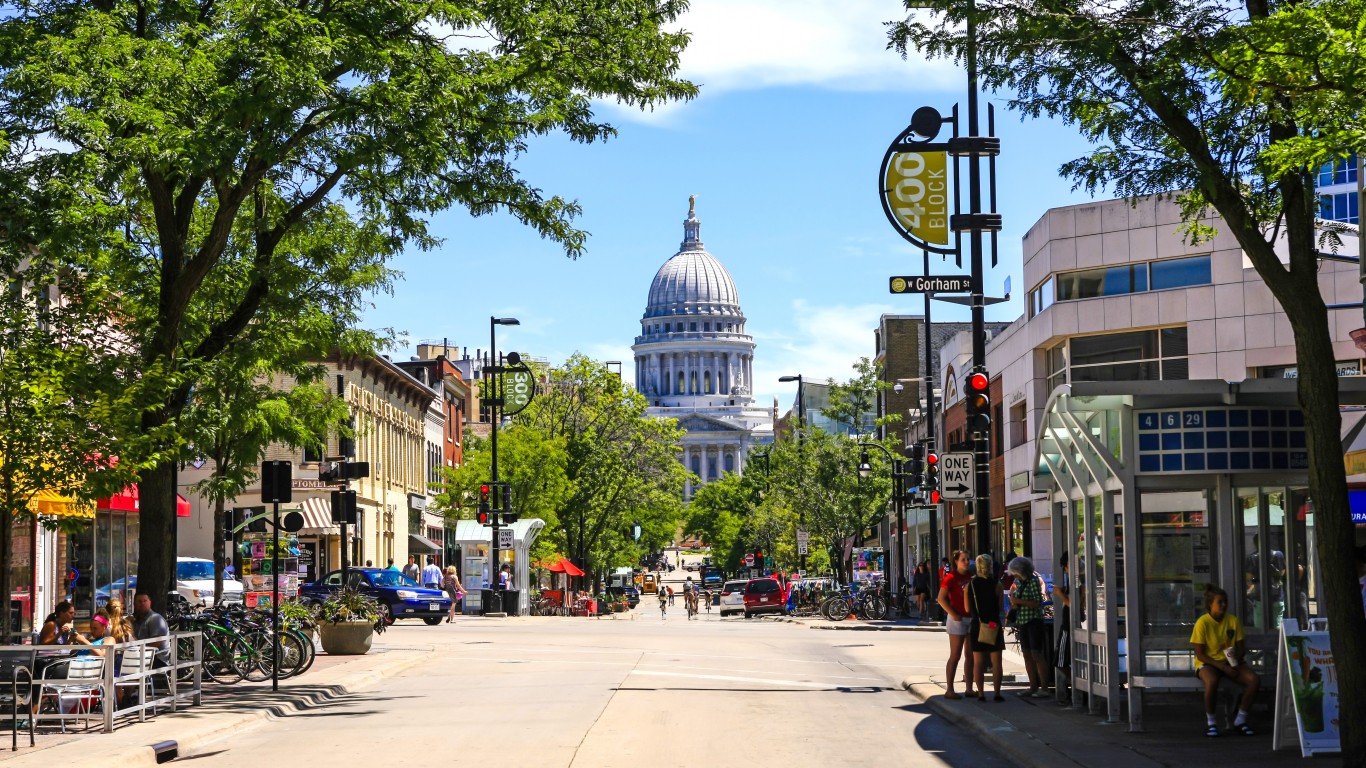
Wisconsin: Madison
> Life expectancy in 2018: 81.41 years — 2.32 years more than US average
> Statewide life expectancy: 79.45 years — 20th highest
> Obesity rate: 25.3% (31.3% in Wisconsin)
> Smoking rate: 12.9% (16.0% in Wisconsin)
> Adults who don’t exercise regularly: 15.3% (20.8% in Wisconsin)
> Adults without health insurance: 3.7% (5.7% in Wisconsin)
> Median household income: $75,545 (Wisconsin average: $64,168)
> Population: 664,865
[in-text-ad-2]

Wyoming: Cheyenne
> Life expectancy in 2018: 78.95 years — 0.13 years less than US average
> Statewide life expectancy: 79.05 years — 24th lowest
> Obesity rate: 30.0% (28.9% in Wyoming)
> Smoking rate: 17.0% (18.7% in Wyoming)
> Adults who don’t exercise regularly: 23.4% (24.1% in Wyoming)
> Adults without health insurance: 7.4% (12.3% in Wyoming)
> Median household income: $70,567 (Wyoming average: $65,003)
> Population: 99,500
Methodology
To determine the cities where people live the longest, 24/7 Tempo reviewed data on life expectancy in U.S. metropolitan areas from County Health Rankings & Roadmaps, a collaboration between the Robert Wood Johnson Foundation and the University of Wisconsin Population Health Institute.
To obtain metro area life expectancy estimates, we mapped the counties to their corresponding metro areas and calculated the average life expectancy across all counties in a given metro area. CHR used National Center for Health Statistics data from 2016-2018 for this measure.
Obesity and smoking rates, as well as the share of people who don’t exercise on a regular basis came from CHR as well.
Metro-level median household income and the percentage of people who don’t have health insurance came from the U.S. Census Bureau’s 2019 American Community Survey.
The states of New York, Rhode Island, New Hampshire, Maryland, and Wyoming each have a longer life expectancy than the MSA with the longest life expectancy within each respective state. This discrepancy (albeit less than a year) is a product of differing population and sample sizes as well as metropolitan statistical areas that encompass multiple states within its boundaries.
It’s Your Money, Your Future—Own It (sponsor)
Retirement can be daunting, but it doesn’t need to be.
Imagine having an expert in your corner to help you with your financial goals. Someone to help you determine if you’re ahead, behind, or right on track. With SmartAsset, that’s not just a dream—it’s reality. This free tool connects you with pre-screened financial advisors who work in your best interests. It’s quick, it’s easy, so take the leap today and start planning smarter!
Don’t waste another minute; get started right here and help your retirement dreams become a retirement reality.
Thank you for reading! Have some feedback for us?
Contact the 24/7 Wall St. editorial team.
 24/7 Wall St.
 24/7 Wall St.
 24/7 Wall St.

 24/7 Wall St.


