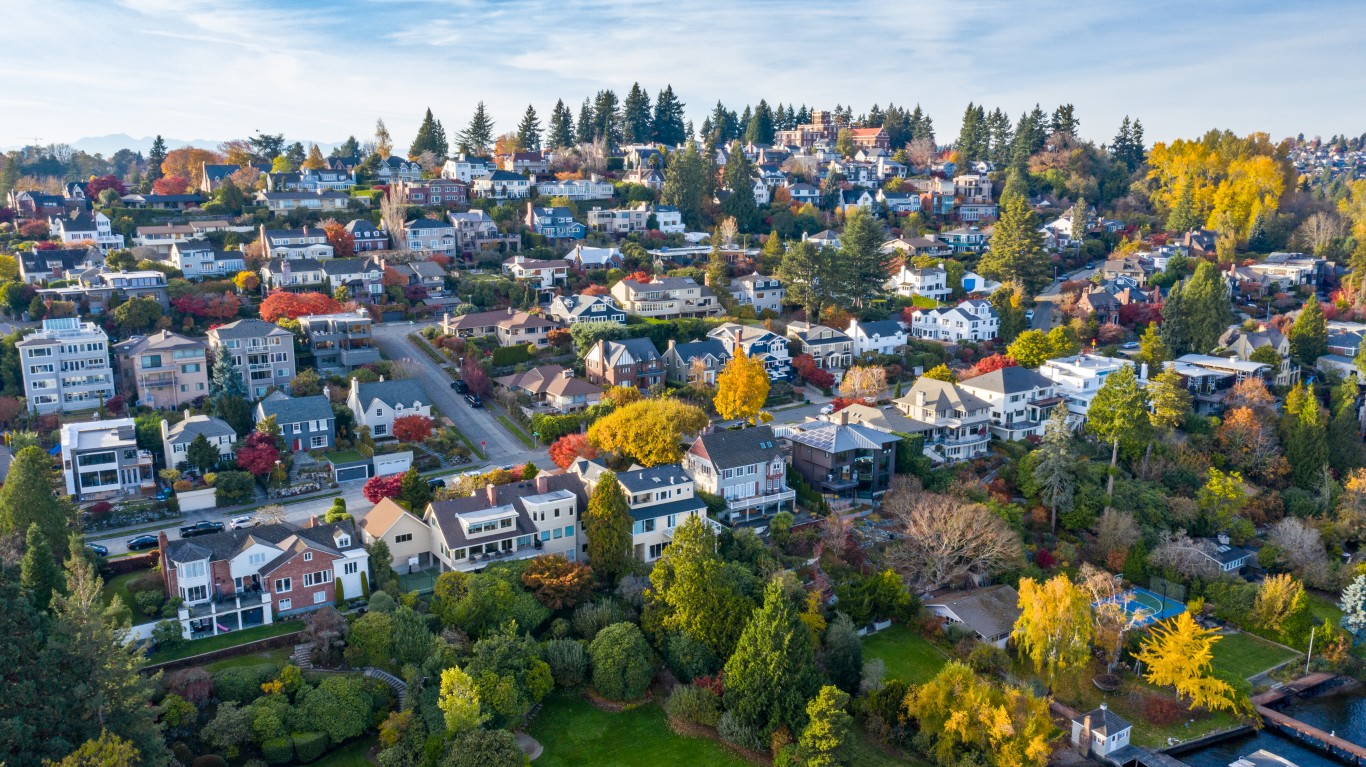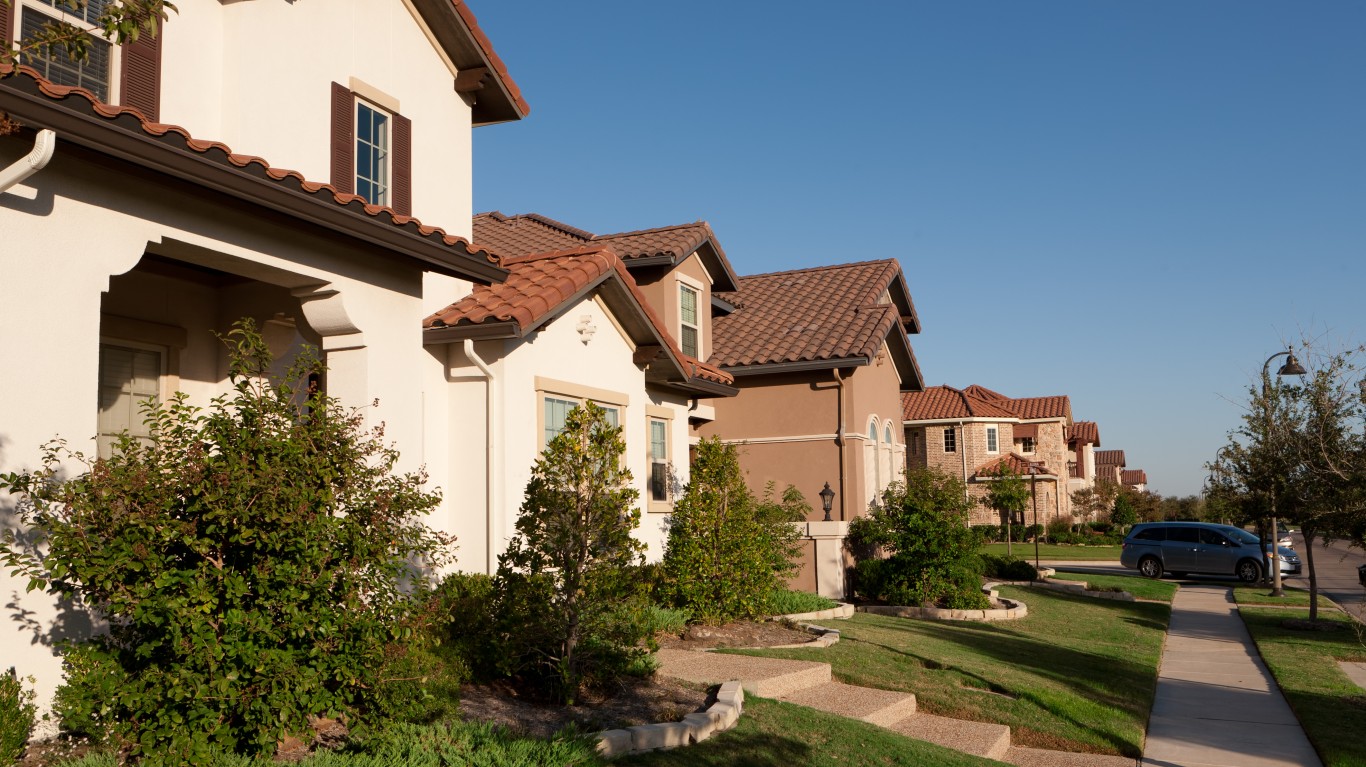
An average of about 34.3 million Americans packed up and moved each year over the last decade. Some did so to be in a better neighborhood, while others moved for job opportunities or another reason. And some U.S. cities have proven to be much better than others at drawing in new residents and appealing to those who are starting families.
Using metropolitan area level data from the U.S. Census Bureau’s American Community survey, 24/7 Wall St. identified America’s fastest growing cities. We ranked metro areas based on population change from July 2010 to July 2019. Each metro area on this list has reported a population growth of at least 19% over that period.
We also considered supplemental data on median household income and median home value from the Census’ ACS. Data on annual unemployment rate and employment changes came from the Bureau of Labor Statistics.
Population change is the product of two factors — net migration and natural growth. Natural growth is the number of births over a given period less the number of deaths. Net migration is the difference between the number of new residents — either from other parts of the country or from abroad — and the number of residents who have left the area. In most of the rapidly growing metro areas, population growth has been largely driven by migration.
The metro areas on this list are located exclusively in the West and in the South. Many include coastal cities with climates that are warmer than in much of the rest of the country. Just over half of the metro areas on this list are located in either Florida or Texas — states that do not levy personal income taxes. This may be a compelling financial incentive for many Americans. Here is a look at the states with the highest and lowest taxes.
New residents may also have been drawn to the cities on this list for their job markets, which in most cases have been relatively strong in the years leading up to the COVID-19 recession.
The influx of new residents in these cities has invariably led to increased demand for housing, and greater demand has likely pushed home prices higher. In nearly every city on this list, the value of a typical home increased faster than the national appreciation of 33.7% between 2010 and 2019. In one metro area, home values more than doubled over that period. Here is a look at the most expensive place to live in every state.
Click here to see America’s fastest growing cities.

25. Dallas-Fort Worth-Arlington, TX
> 2010-2019 pop. change: +19.0% (+1,206,599)
> 2010-2019 median home value increase: 68.8% — 15th highest out of 383 MSAs
> 2010-2019 employment increase: 26.6% — 27th highest out of 383 MSAs
> 2019 unemployment: 3.3% — 149th lowest out of 383 MSAs
The number of people living in the Dallas-Fort Worth metropolitan area climbed by 19% from 2010 to 2019 — a larger increase than in all but 24 other U.S. metro areas. At the same time as the area had an influx of new residents, rapid job growth occurred. Overall employment rose by nearly 27% in the metro area over the decade, while nationwide, employment climbed by a relatively modest 13.3% over the same period.
The addition of 1.2 million people has driven up real estate values in the metro area. The typical home in the Dallas area is worth $253,900, nearly 70% more than in 2010. Meanwhile, the typical American home appreciated by 33.7% since 2010.
[in-text-ad]

24. San Antonio-New Braunfels, TX
> 2010-2019 pop. change: +19.1% (+408,440)
> 2010-2019 median home value increase: 50.0% — 54th highest out of 383 MSAs
> 2010-2019 employment increase: 23.7% — 37th highest out of 383 MSAs
> 2019 unemployment: 3.1% — 115th lowest out of 383 MSAs
San Antonio is one of several Texas metro areas to rank among the fastest growing in the country. Population growth in the metro area, which is now home to over 400,000 more people than in 2010, was driven primarily by new residents moving in.
Job growth more than kept pace with the influx of new residents. There are now nearly 1.2 million people working in the San Antonio metro area, up 23.7% from 2010.
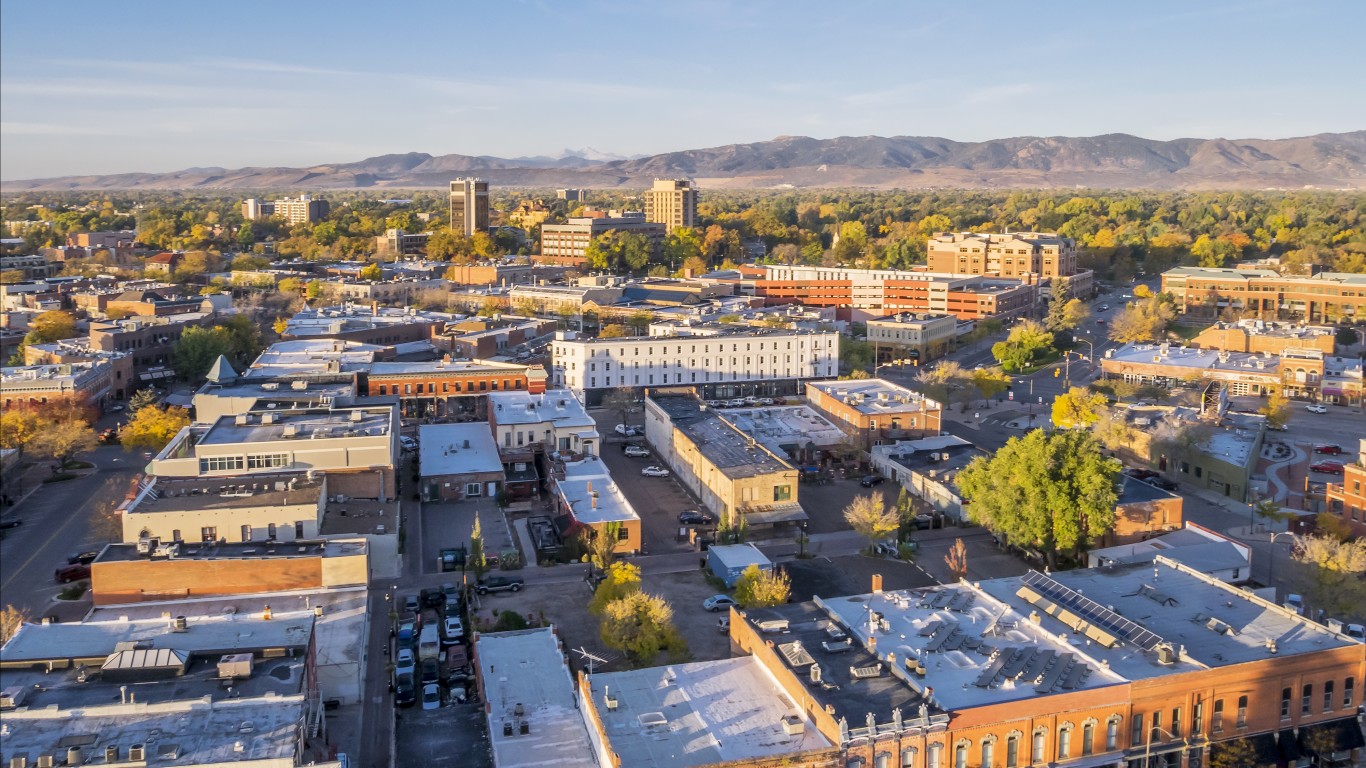
23. Fort Collins, CO
> 2010-2019 pop. change: +19.1% (+57,269)
> 2010-2019 median home value increase: 69.7% — 13th highest out of 383 MSAs
> 2010-2019 employment increase: 28.4% — 20th highest out of 383 MSAs
> 2019 unemployment: 2.4% — 14th lowest out of 383 MSAs
About 11,600 more people were born than died in Fort Collins, Colorado, since 2010, and about 45,100 more people moved to the metro area than moved away over the same period — resulting in a 19.1% population increase, the second largest increase in the state and 23rd largest of any metro area nationwide.
Like many metro areas drawing in new residents, Fort Collins has a relatively strong job market. Just 2.4% of the labor force were out of work in 2019, well below the comparable 3.7% national unemployment rate.
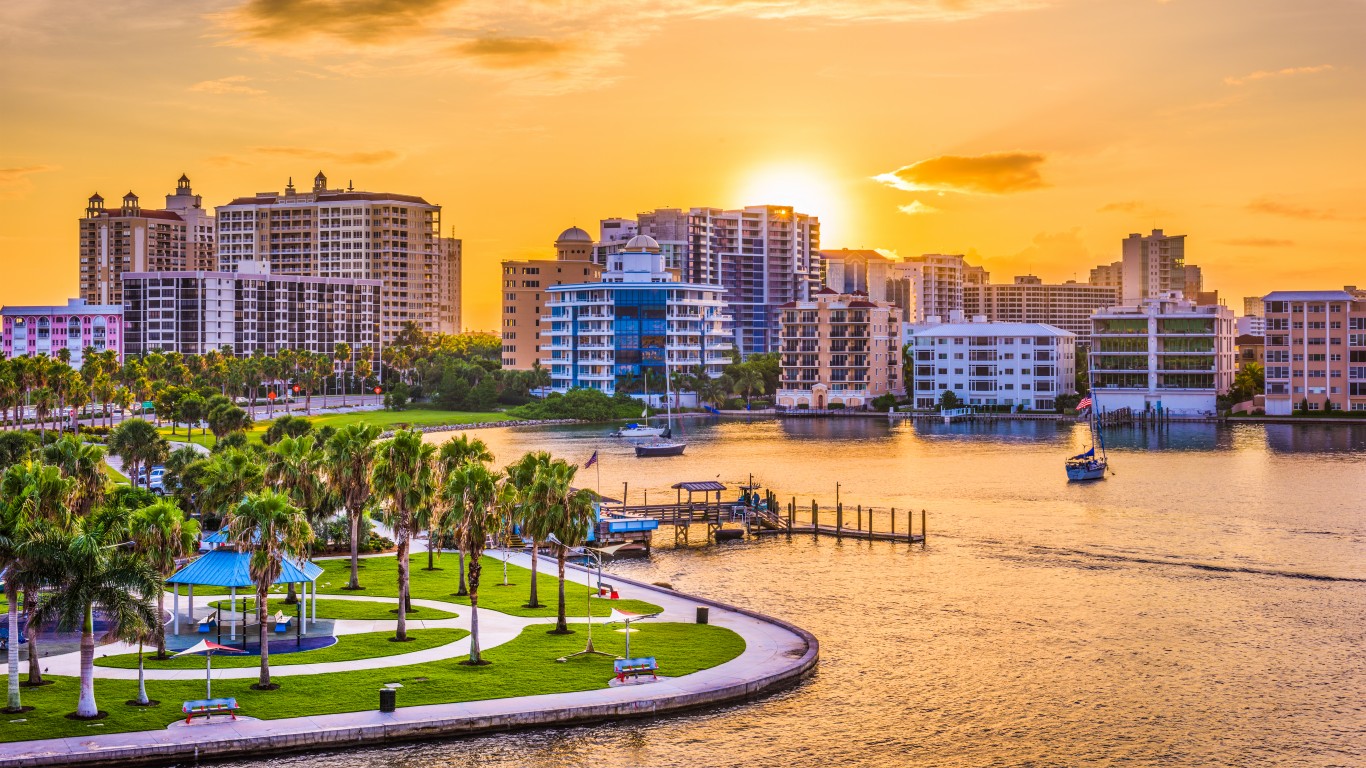
22. North Port-Sarasota-Bradenton, FL
> 2010-2019 pop. change: +19.2% (+134,683)
> 2010-2019 median home value increase: 58.1% — 33rd highest out of 383 MSAs
> 2010-2019 employment increase: 28.4% — 21st highest out of 383 MSAs
> 2019 unemployment: 3.1% — 115th lowest out of 383 MSAs
The North Port-Sarasota-Bradenton, Florida, metro area reported 19.2% population growth between 2010 and 2019. The growth was entirely attributable to net migration, as over 160,000 more people moved to the metro area than left since 2010.
The influx has led to increased demand for housing, and partially as a result, real estate prices have ballooned. The typical area home is worth $273,500, about 58% more than the median worth in the metro area in 2010.
[in-text-ad-2]
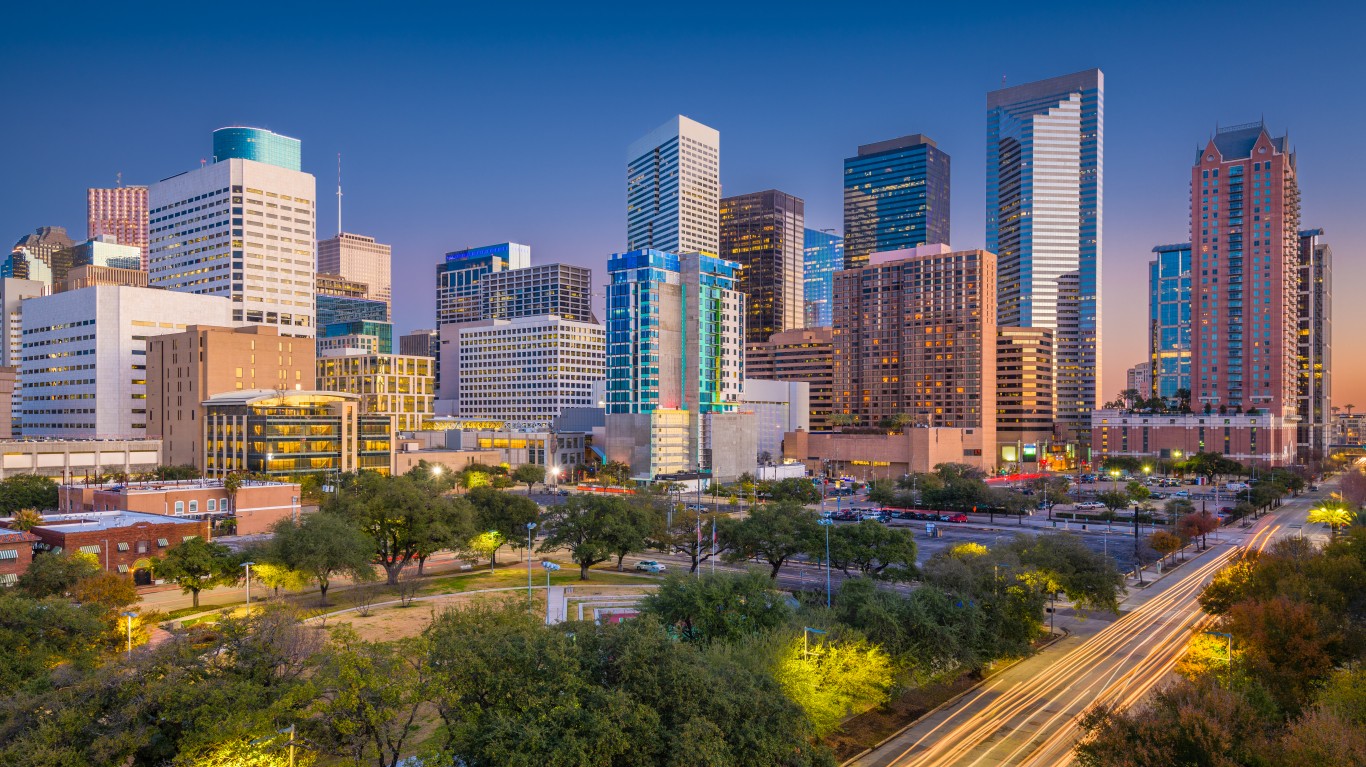
21. Houston-The Woodlands-Sugar Land, TX
> 2010-2019 pop. change: +19.4% (+1,145,654)
> 2010-2019 median home value increase: 55.6% — 38th highest out of 383 MSAs
> 2010-2019 employment increase: 21.1% — 53rd highest out of 383 MSAs
> 2019 unemployment: 3.8% — 232nd lowest out of 383 MSAs
The Houston metro area was the sixth largest in the United States in 2010, with a population of 5.9 million. As of 2019, after reporting 19.4% population growth, it is home to 7.1 million and ranks as the fifth largest. Over that period, about 540,000 more people were born in the metro area than died, and 602,600 more people moved to the area than moved away.
Rapidly growing metro areas typically have strong job markets. In Houston, the annual unemployment rate of 3.8% is closely in line with the comparable national annual figure.
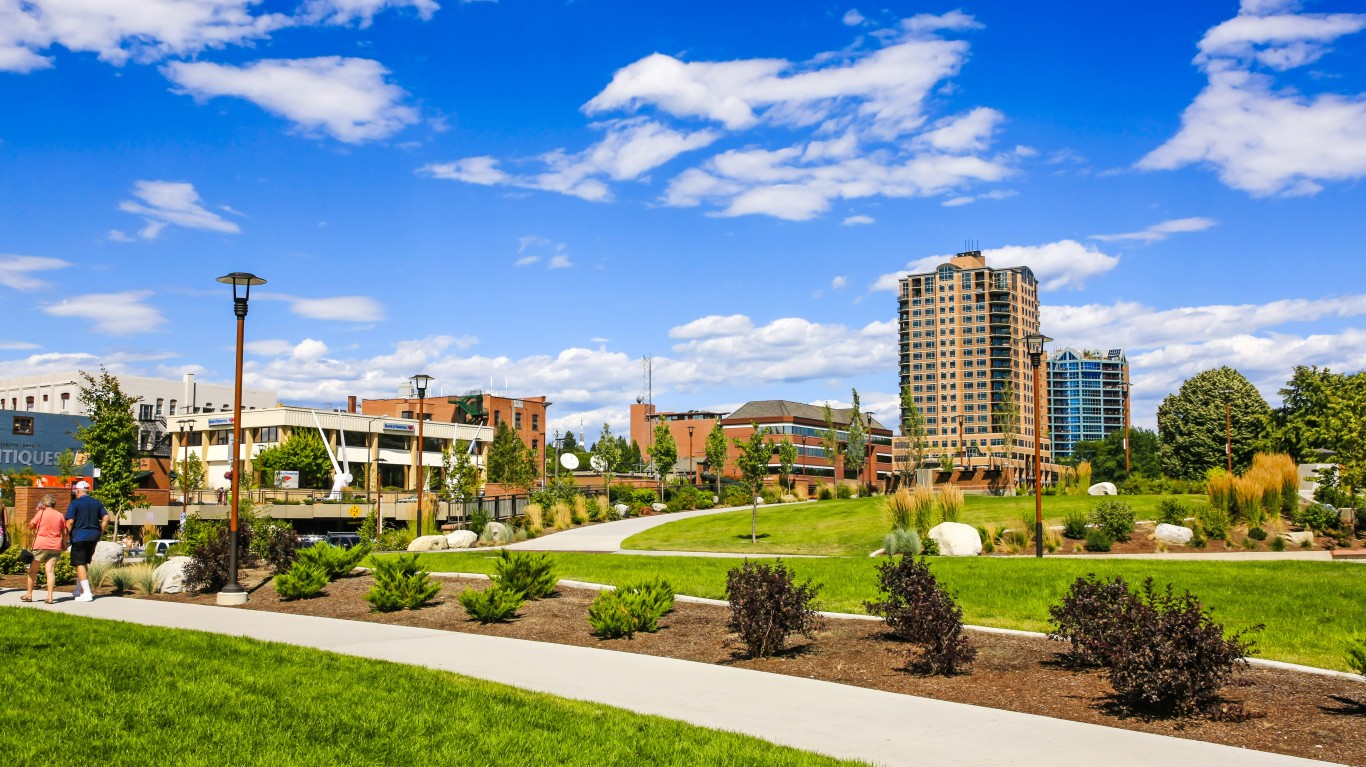
20. Coeur d’Alene, ID
> 2010-2019 pop. change: +19.7% (+27,231)
> 2010-2019 median home value increase: 56.9% — 36th highest out of 383 MSAs
> 2010-2019 employment increase: 25.9% — 30th highest out of 383 MSAs
> 2019 unemployment: 3.6% — 189th lowest out of 383 MSAs
Coeur d’Alene, Idaho, is one of several western metro areas to report a near nation-leading population increase between 2010 and 2019. Due primarily to new residents moving in, the local population climbed by nearly 20% — from 138,500 in 2010 to 165,700 in 2019. The bulk of those new residents moved to the area in the last half decade.
The influx is likely contributing to higher property values. The typical area home is now worth $306,900, 56.9% more than the local median home value in 2010.
[in-text-ad]
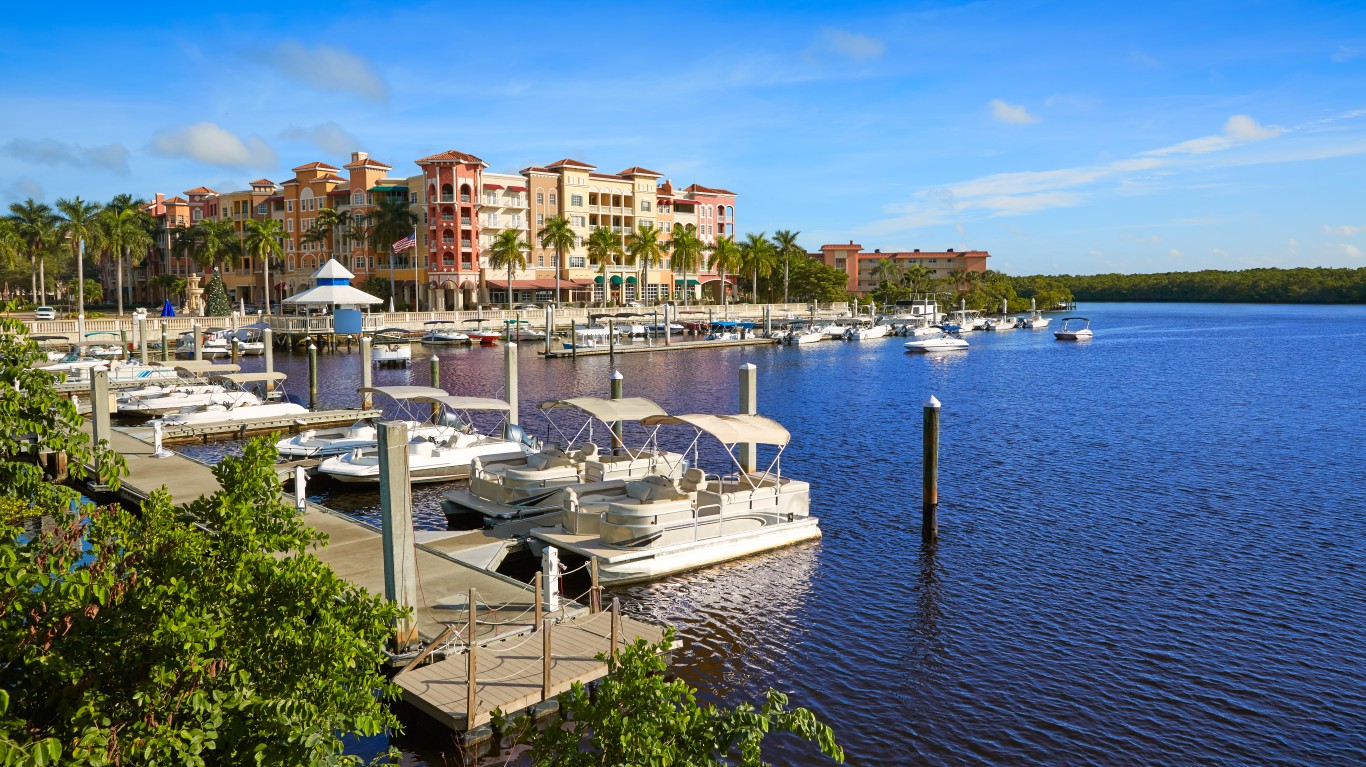
19. Naples-Marco Island, FL
> 2010-2019 pop. change: +19.7% (+63,380)
> 2010-2019 median home value increase: 45.1% — 68th highest out of 383 MSAs
> 2010-2019 employment increase: 36.3% — 8th highest out of 383 MSAs
> 2019 unemployment: 3.1% — 115th lowest out of 383 MSAs
The Naples-Marco Island metro area, located in the southern part of Florida along the Gulf coast, is one of several metro areas in the state to rank among the fastest growing in the country. As of 2019, there were 384,900 people living in the metro area, a 19.7% increase from 2010.
Like many metro areas drawing in new residents, Naples has a relatively strong job market. Just 3.1% of the labor force were out of work in 2019, below the comparable 3.7% national unemployment rate.
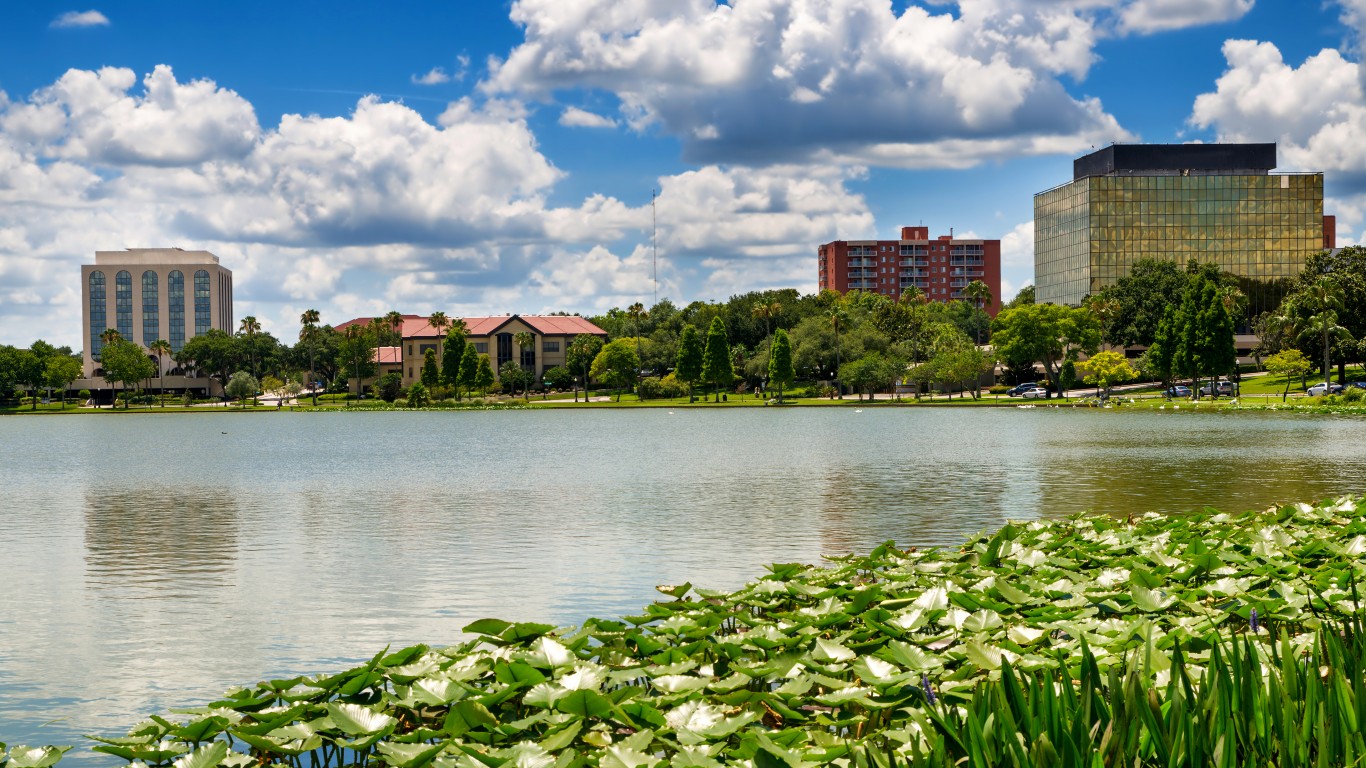
18. Lakeland-Winter Haven, FL
> 2010-2019 pop. change: +20.4% (+122,704)
> 2010-2019 median home value increase: 47.3% — 63rd highest out of 383 MSAs
> 2010-2019 employment increase: 20.4% — 58th highest out of 383 MSAs
> 2019 unemployment: 3.7% — 215th lowest out of 383 MSAs
The Lakeland-Winter Haven metro area is located in central Florida just east of Tampa. Like the nearby Sarasota and Naples metro areas, Lakeland is growing rapidly. Driven almost entirely by migration, the number of people living in the metro area climbed by 122,700, or 20.4%, between 2010 and 2019.
Preliminary reports show that Florida’s popularity as a place to live has only grown since the COVID-19 pandemic. In recent months, Florida has been gaining an average of nearly 1,000 new residents per day. For many who move there, the absence of a state income tax and the climate are major pull factors.
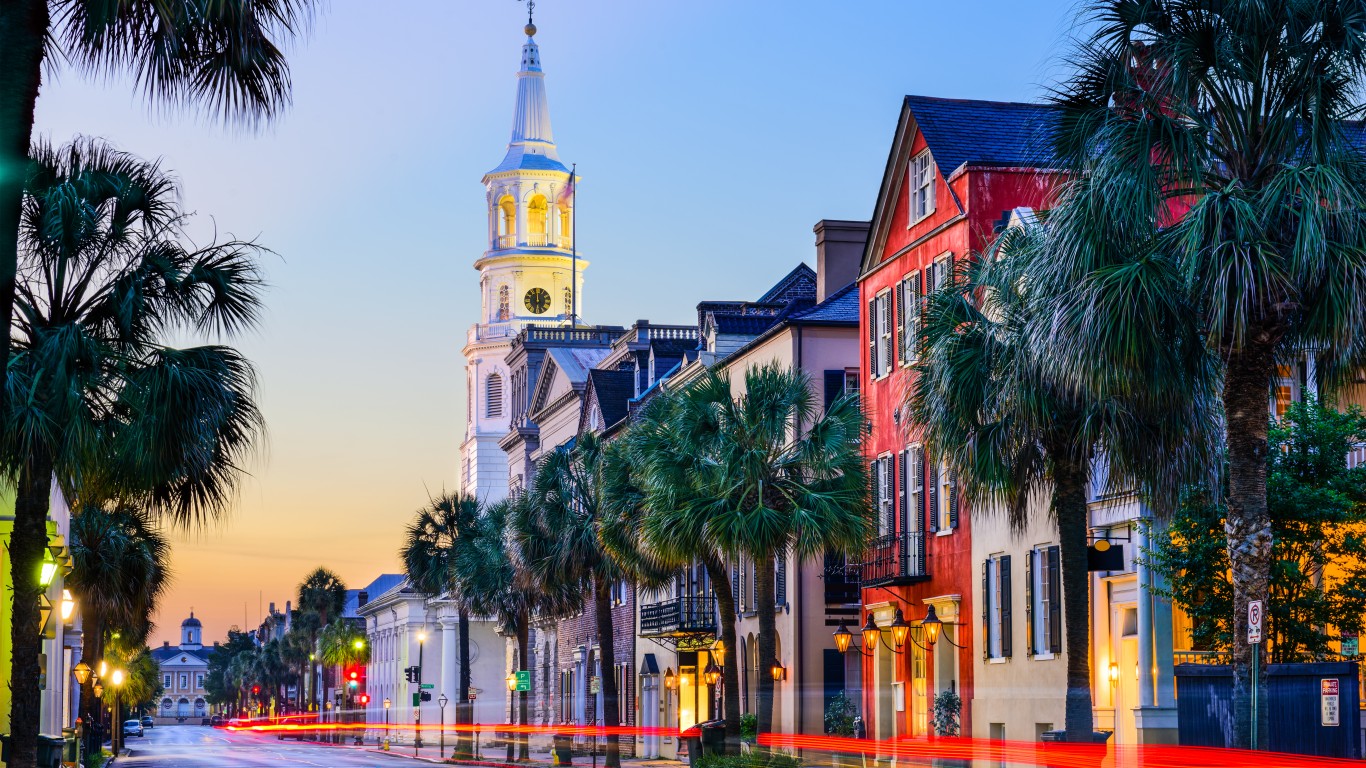
17. Charleston-North Charleston, SC
> 2010-2019 pop. change: +20.7% (+137,477)
> 2010-2019 median home value increase: 38.2% — 93rd highest out of 383 MSAs
> 2010-2019 employment increase: 29.9% — 17th highest out of 383 MSAs
> 2019 unemployment: 2.4% — 14th lowest out of 383 MSAs
Charleston, South Carolina, is one of only 18 U.S. metro areas where population growth between 2010 and 2019 exceeded 20%. Largely due to new residents moving in, population growth has been steady in the coastal metro area.
One of the primary reasons Americans move is for job opportunities, and in Charleston, unemployment is low. Just 2.4% of the labor force were out of work in 2019, well below the 3.7% national jobless rate.
[in-text-ad-2]
16. Crestview-Fort Walton Beach-Destin, FL
> 2010-2019 pop. change: +20.7% (+48,939)
> 2010-2019 median home value increase: 33.6% — 125th highest out of 383 MSAs
> 2010-2019 employment increase: 19.0% — 66th highest out of 383 MSAs
> 2019 unemployment: 2.7% — 53rd lowest out of 383 MSAs
The Crestview-Fort Walton Beach-Destin metro area, located in Florida’s panhandle, is home to about 285,000 people, 20.7% more than in 2010. Of the seven Florida metro areas with population growth of 19% or higher, Crestview is the only one located on the panhandle.
The local job market has remained relatively strong in the area in the last decade. As of 2019, just 2.7% of the local labor force were out of work, well below the comparable 3.7% national unemployment rate. Even in 2010, the local unemployment rate of 8.6% was a full percentage point below the national rate.
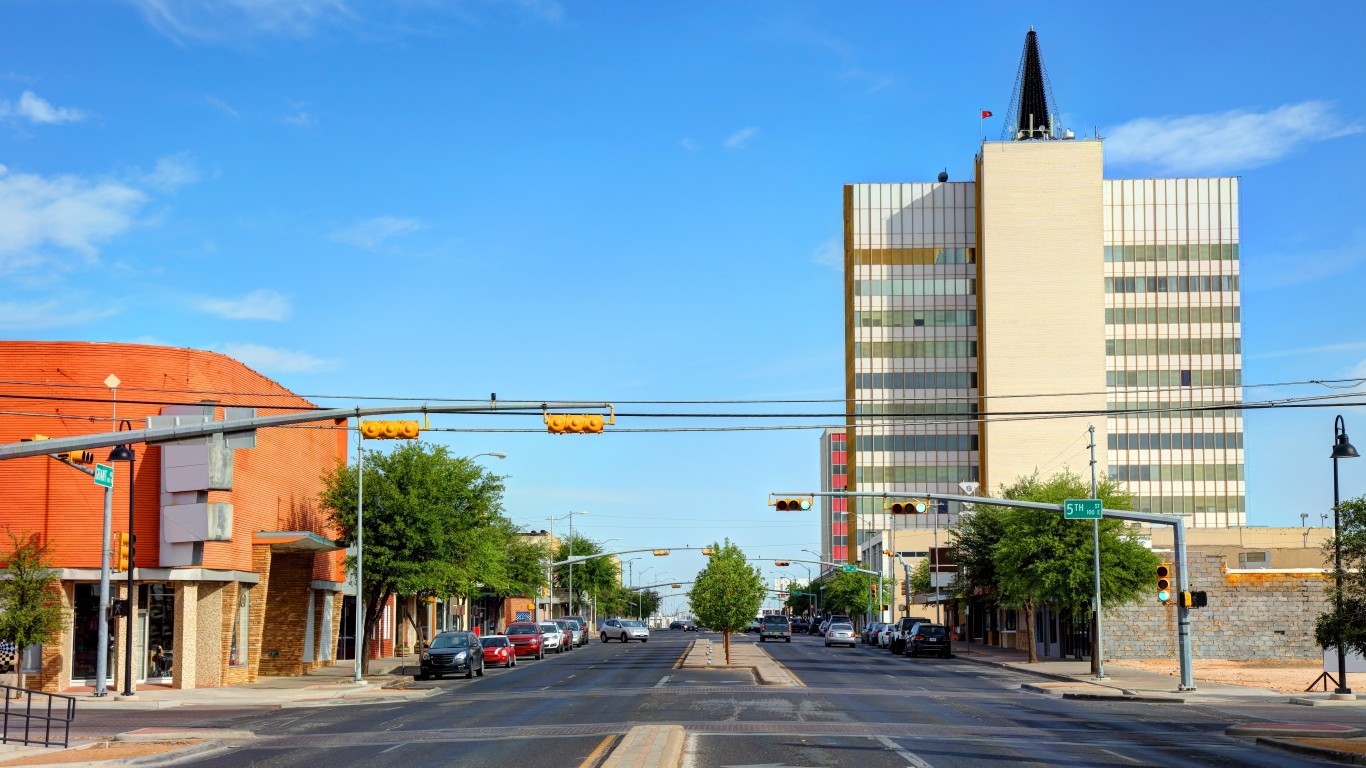
15. Odessa, TX
> 2010-2019 pop. change: +21.2% (+29,087)
> 2010-2019 median home value increase: 86.5% — 4th highest out of 383 MSAs
> 2010-2019 employment increase: 37.3% — 7th highest out of 383 MSAs
> 2019 unemployment: 2.6% — 36th lowest out of 383 MSAs
The west Texas metro area of Odessa grew by nearly 30,000 people, or 21.2%, between 2010 and 2019 — more than all but 14 other U.S. metro areas and the third fastest growth rate of all Texas metropolitan areas. The population influx has contributed to ballooning home values. The typical Odessa home is worth $164,100, nearly 90% more than the local median home value was in 2010.
The growing popularity of Odessa and other Texas metro areas is attributable in part to a favorable tax climate as Texas does not levy a personal income tax. The local job market is also strong, as the annual unemployment rate stands at just 2.6%.
[in-text-ad]

14. Boise City, ID
> 2010-2019 pop. change: +21.5% (+132,636)
> 2010-2019 median home value increase: 69.6% — 14th highest out of 383 MSAs
> 2010-2019 employment increase: 35.3% — 10th highest out of 383 MSAs
> 2019 unemployment: 2.7% — 53rd lowest out of 383 MSAs
The Boise metro area is the fastest growing in Idaho and the 14th fastest growing nationwide. The metro area’s population stood at 749,200 in 2019, 21.5% higher than it was in 2010. As is often the case in rapidly growing cities, population growth in Boise has been driven primarily by migration.
Population growth in Idaho’s capital city will not likely slow any time soon. Preliminary data shows more people moving to Idaho than any other state during the COVID-19 pandemic.
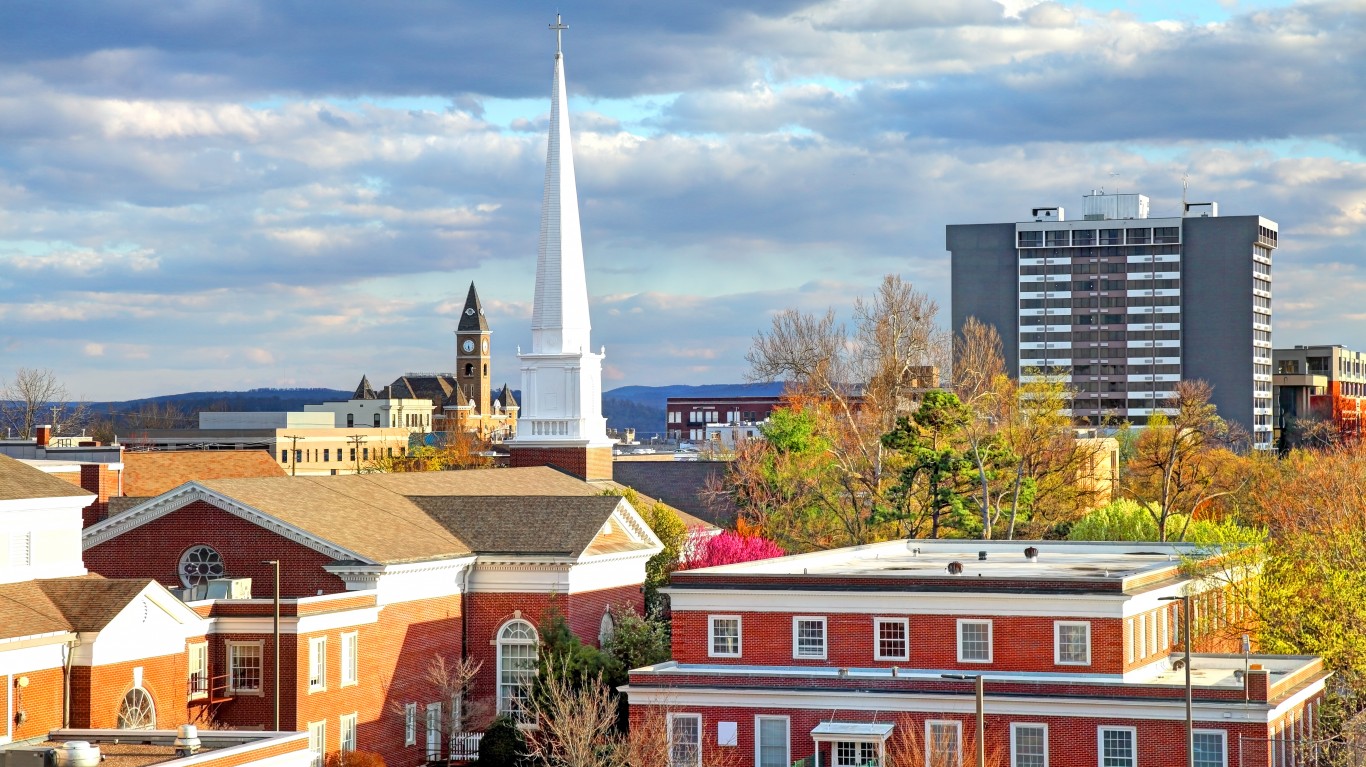
13. Fayetteville-Springdale-Rogers, AR
> 2010-2019 pop. change: +21.5% (+94,783)
> 2010-2019 median home value increase: 34.2% — 119th highest out of 383 MSAs
> 2010-2019 employment increase: 28.8% — 18th highest out of 383 MSAs
> 2019 unemployment: 2.6% — 36th lowest out of 383 MSAs
The Fayetteville-Springdale-Rogers metro area is one of several metro areas in the South — but the only one in Arkansas — to report near nation-leading population growth. Between 2010 and 2019, the number of people living in the metro area increased by 21.5%. Most of the growth was driven by people relocating to the metro area.
One of the primary reasons Americans move is for job opportunities, and in Fayetteville, unemployment is low. Just 2.6% of the labor force were out of work in 2019, well below the 3.7% national jobless rate that year.
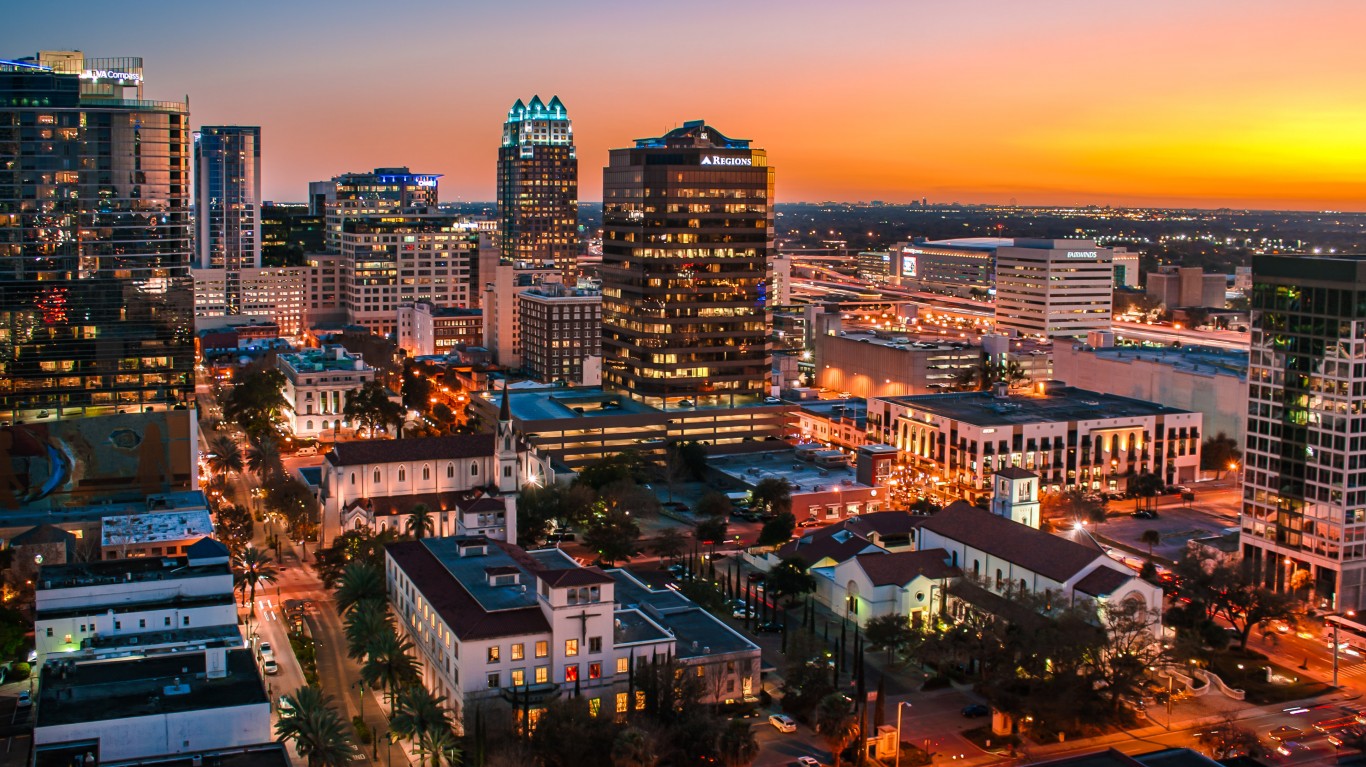
12. Orlando-Kissimmee-Sanford, FL
> 2010-2019 pop. change: +22.2% (+473,748)
> 2010-2019 median home value increase: 51.2% — 47th highest out of 383 MSAs
> 2010-2019 employment increase: 30.6% — 16th highest out of 383 MSAs
> 2019 unemployment: 3.0% — 97th lowest out of 383 MSAs
Orlando is one of the fastest growing metro areas in Florida, which makes it one of the fastest growing in the entire country. Reporting 22.2% population growth, the metro area is home to nearly half a million more people in 2019 than in 2010.
As is the case in many rapidly growing metro areas in the Sunshine State, Orlando is reporting a spike in property values. The typical area home is worth $255,500, over 50% more than the median home value in 2010.
[in-text-ad-2]

11. Daphne-Fairhope-Foley, AL
> 2010-2019 pop. change: +22.5% (+40,969)
> 2010-2019 median home value increase: 26.7% — 175th highest out of 383 MSAs
> 2010-2019 employment increase: 26.0% — 29th highest out of 383 MSAs
> 2019 unemployment: 2.7% — 53rd lowest out of 383 MSAs
Only 10 metro areas nationwide are growing faster than Daphne-Fairhope-Foley, which is the fastest growing metro area in Alabama. The metro area’s 22.5% population growth between 2010 and 2019 was driven primarily by migration.
The metro area, located on Mobile Bay in southern Alabama, is one of several coastal metro areas in the South to report population growth of over 20% in the last decade. The Daphne metro area also has a strong job market, with just 2.7% unemployment, a full percentage point below the national jobless rate.
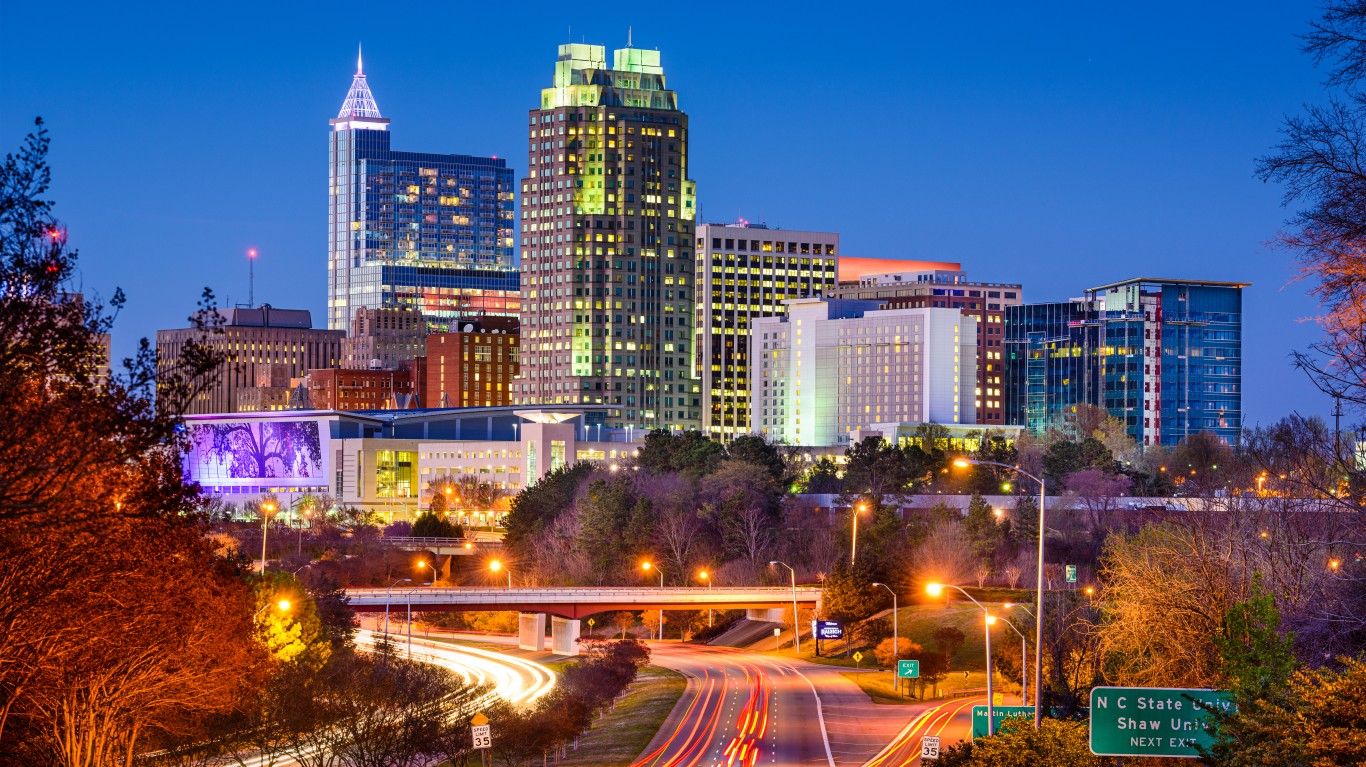
10. Raleigh-Cary, NC
> 2010-2019 pop. change: +23.0% (+260,292)
> 2010-2019 median home value increase: 37.4% — 96th highest out of 383 MSAs
> 2010-2019 employment increase: 31.2% — 14th highest out of 383 MSAs
> 2019 unemployment: 3.4% — 163rd lowest out of 383 MSAs
The Raleigh, North Carolina, metro area is today home to over a quarter of a million more people than it was in 2010. The 23% population growth over that period was driven largely by migration, while natural population change accounted for about one-third of total growth.
As is often the case in rapidly growing cities, North Carolina’s capital city reported robust job growth as its population ballooned. Overall employment climbed by 31.2% between 2010 and 2019 in the metro area compared to the 13.3% job growth nationwide over the same period.
[in-text-ad]
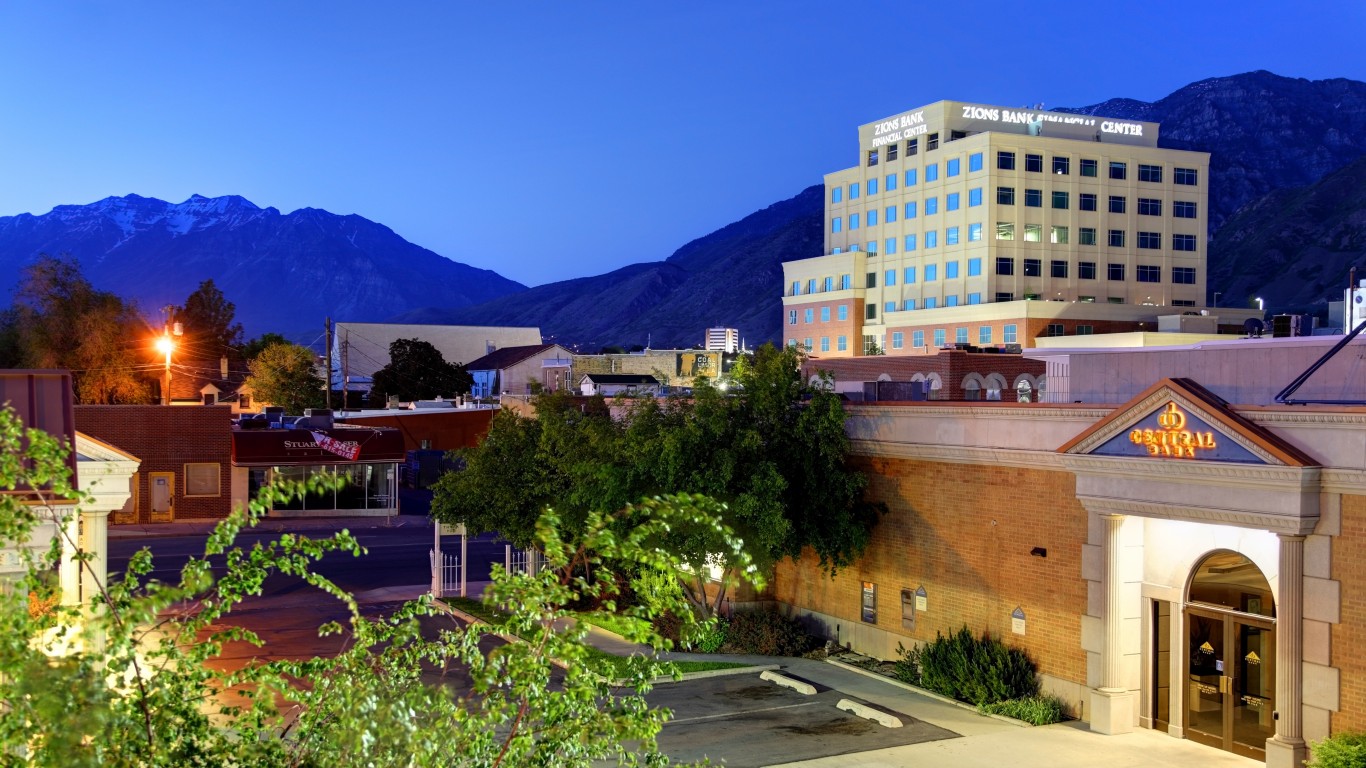
9. Provo-Orem, UT
> 2010-2019 pop. change: +23.0% (+121,367)
> 2010-2019 median home value increase: 61.7% — 24th highest out of 383 MSAs
> 2010-2019 employment increase: 41.0% — 4th highest out of 383 MSAs
> 2019 unemployment: 2.4% — 14th lowest out of 383 MSAs
Provo-Orem is the second fastest growing metro area in Utah and the ninth fastest growing nationwide. The local population grew by 23%, or 121,400 people, between 2010 and 2019. Unlike most rapidly growing U.S. metro areas, population growth in Provo has been driven by natural change rather than net migration. Historically, Utah has had one of the highest fertility rates of any state.
Economic conditions in the Provo metro area make it a relatively financially secure place to start a family. The typical area household earns $79,152 a year, far more than the $65,712 national median household income. Additionally, the unemployment rate in the area of 2.4% is well below the 3.7% national rate.
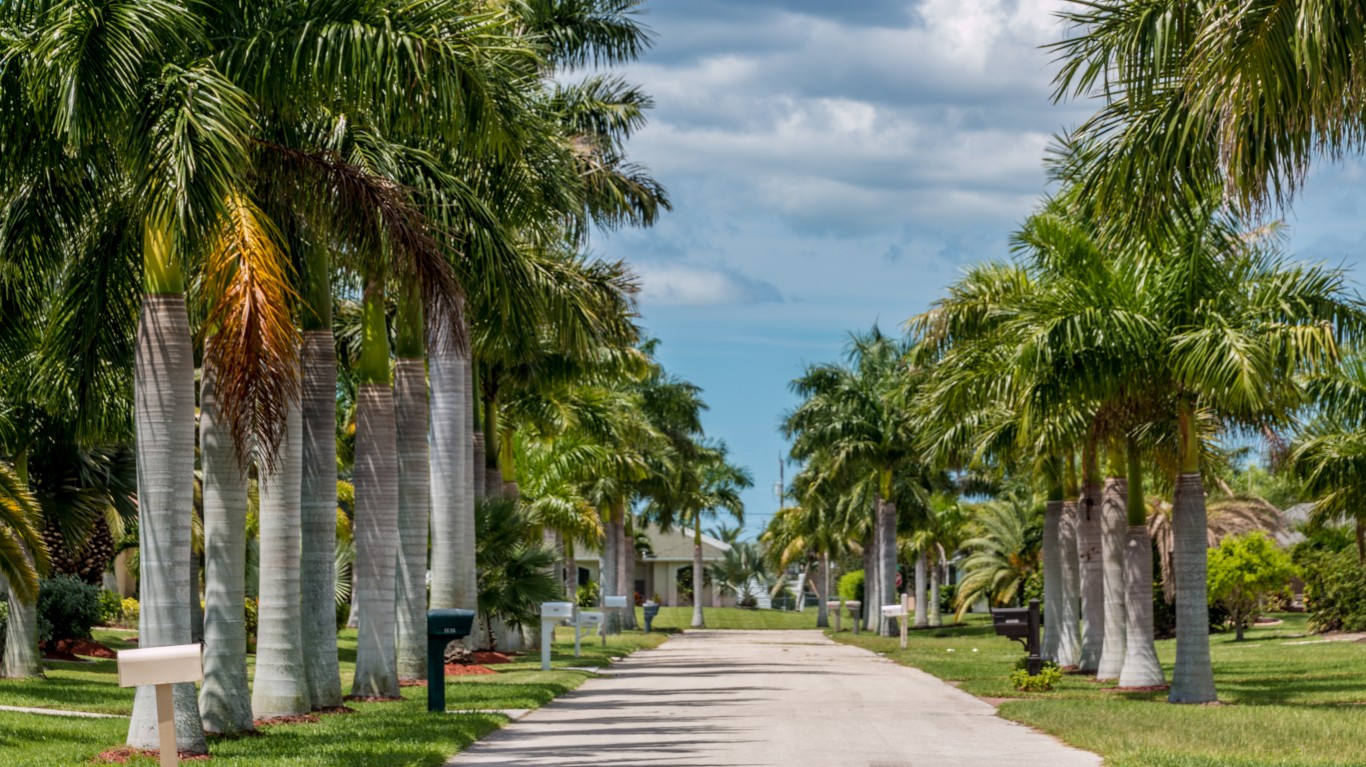
8. Cape Coral-Fort Myers, FL
> 2010-2019 pop. change: +24.5% (+151,822)
> 2010-2019 median home value increase: 63.7% — 23rd highest out of 383 MSAs
> 2010-2019 employment increase: 36.0% — 9th highest out of 383 MSAs
> 2019 unemployment: 3.1% — 115th lowest out of 383 MSAs
The Cape Coral-Fort Myers metro area is one of several along Florida’s Gulf Coast to report near nation-leading population growth between 2010 and 2019. The total population grew by 24.5% over that period.
Like other rapidly growing metro areas in the Sunshine State, the Cape Coral metro area offers an ideal climate for many, and residents are not subject to a state income tax. Between 2010 and 2019, 152,300 more people moved to the metro area than moved out.
7. Bend, OR
> 2010-2019 pop. change: +25.3% (+39,964)
> 2010-2019 median home value increase: 58.6% — 30th highest out of 383 MSAs
> 2010-2019 employment increase: 32.0% — 13th highest out of 383 MSAs
> 2019 unemployment: 3.9% — 242nd lowest out of 383 MSAs
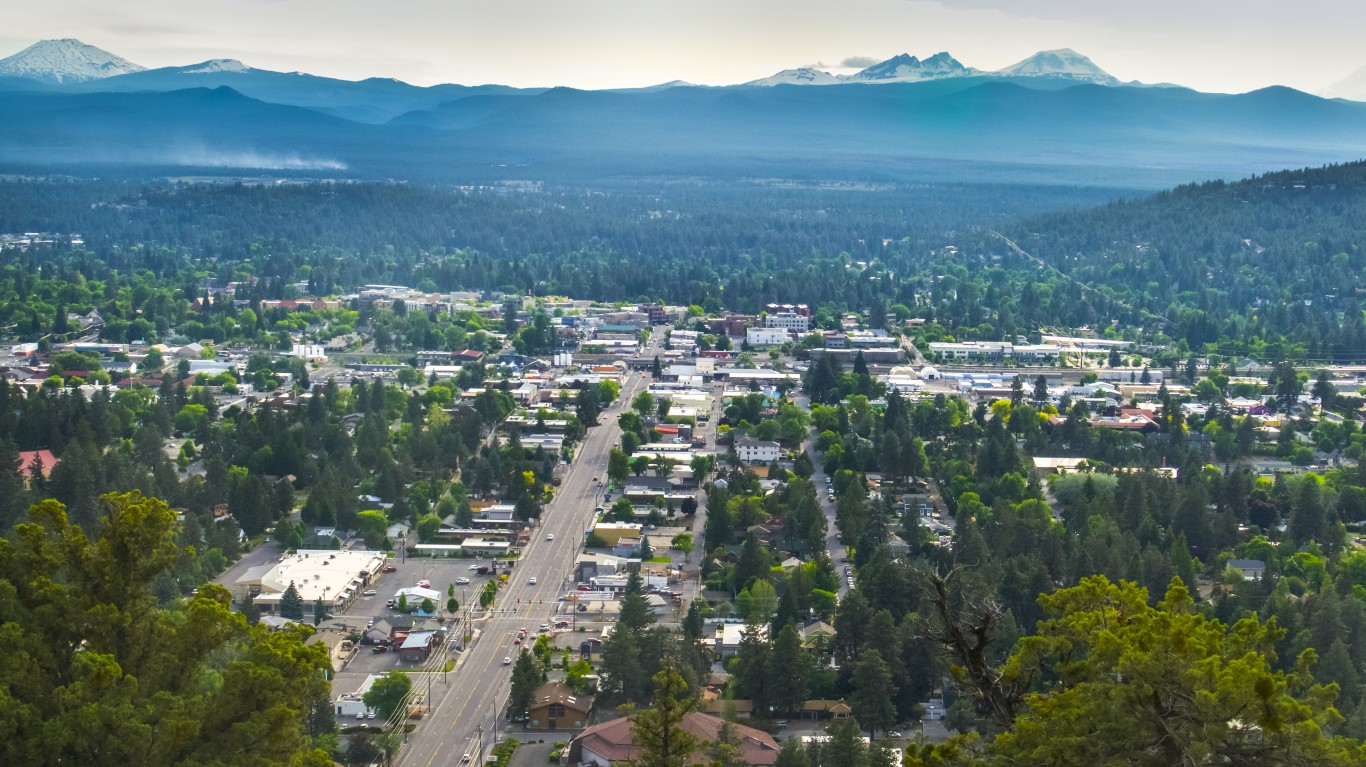
Bend is the fastest growing metro area in Oregon and seventh fastest growing nationwide. Between 2010 and 2019, the number of people living in Bend increased by 25.3%. Over that period, employment in the metro area climbed by 32% — making it one of the fastest growing job markets in the country. Still, the annual jobless rate in Bend of 3.9% is slightly higher than the 3.7% national rate.
The population surge in Bend has likely contributed to skyrocketing property values. The typical area home is worth $413,500, 58.6% more than in 2010.
[in-text-ad-2]
6. Greeley, CO
> 2010-2019 pop. change: +28.3% (+71,665)
> 2010-2019 median home value increase: 101.0% — the highest out of 383 MSAs
> 2010-2019 employment increase: 38.3% — 6th highest out of 383 MSAs
> 2019 unemployment: 2.5% — 19th lowest out of 383 MSAs
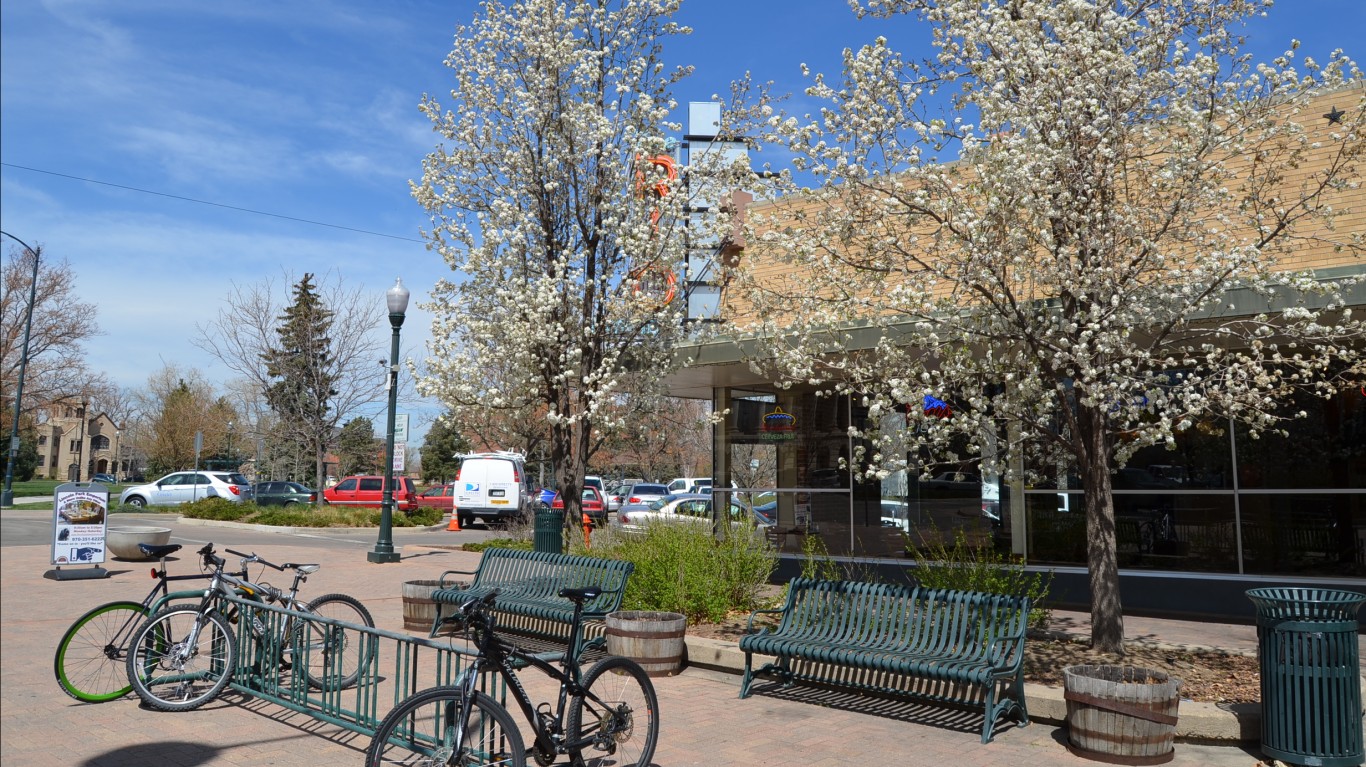
There were nearly 72,000 more people living in the Greeley, Colorado, metro area in 2019 than there were in 2010. The increase, driven primarily by inbound migration, has likely contributed to a nation-leading increase in home values. The typical home in Greeley is worth $366,800, more than double the median value in 2010.
One of the primary reasons Americans move is for job opportunities, and in Greeley, unemployment is low. Just 2.5% of the labor force were out of work in 2019, well below the 3.7% national unemployment rate.
5. St. George, UT
> 2010-2019 pop. change: +28.6% (+39,441)
> 2010-2019 median home value increase: 48.9% — 58th highest out of 383 MSAs
> 2010-2019 employment increase: 45.2% — 2nd highest out of 383 MSAs
> 2019 unemployment: 3.0% — 97th lowest out of 383 MSAs
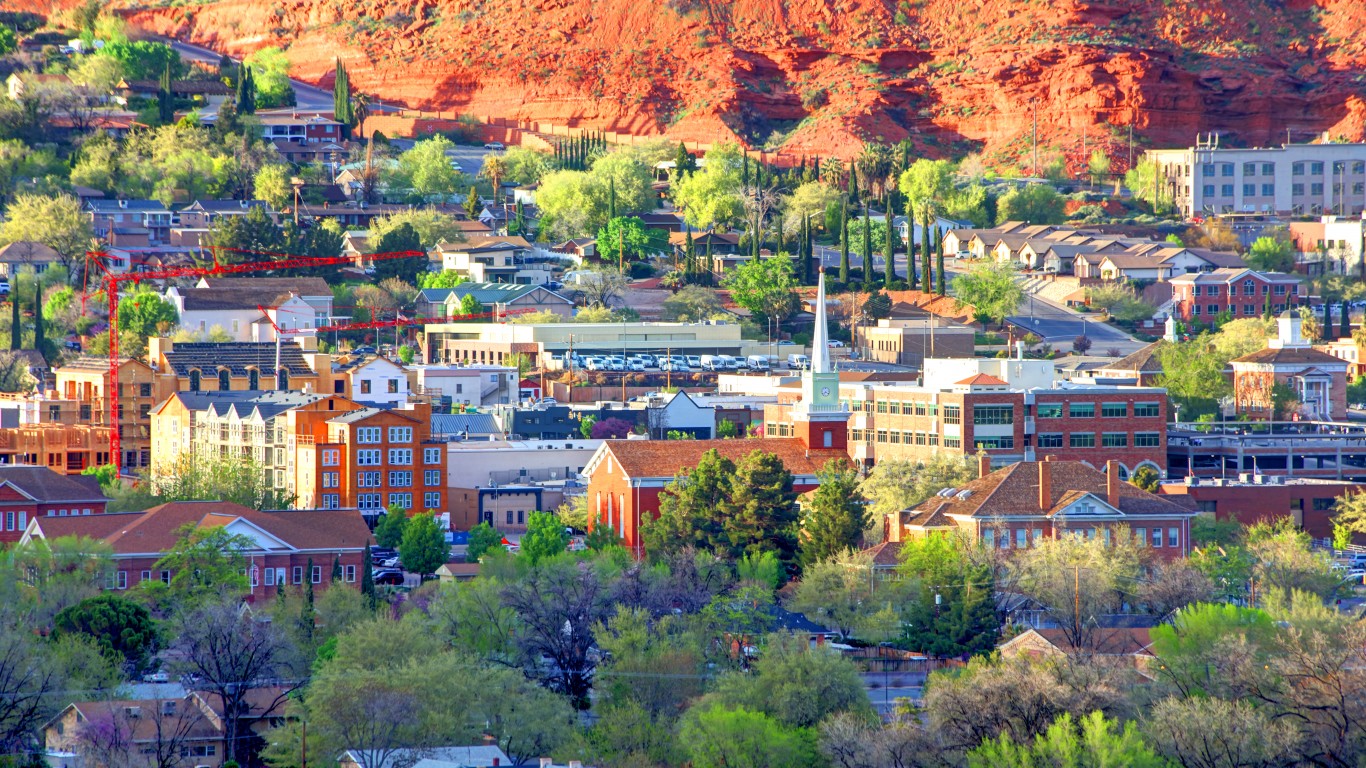
The population of the St. George, Utah, metro area was 28.6% larger in 2019 than it was in 2010. The increase was driven by an influx of new residents from other parts of the country, though births also accounted for some of the increase.
Population growth in the metro area was outpaced by job growth. Overall employment climbed by 45.2% over the same period, nearly the largest increase of any U.S. metro area. In fact, the 2010 unemployment rate in St. George stood at 10.5%, above the 9.6% national average. As of 2019, the local unemployment rate was 3.0%, below the 3.7% national rate.
[in-text-ad]

4. Midland, TX
> 2010-2019 pop. change: +28.9% (+40,932)
> 2010-2019 median home value increase: 74.5% — 11th highest out of 383 MSAs
> 2010-2019 employment increase: 56.2% — the highest out of 383 MSAs
> 2019 unemployment: 2.1% — 4th lowest out of 383 MSAs
The west Texas metro area of Midland reported a 28.9% population growth between 2010 and 2019, higher than all but three other metropolitan areas in the United States. Located in the oil-rich Permian Basin area, Midland’s rapid growth is closely tied to its natural resources.
Since 2010, oil production in the area has taken off as hydraulic fracturing improved extraction yields. In the last decade, oil production across Texas shattered records, and in Midland, employment opportunities surged. The number of people working in the metro area climbed by a nation-leading 56.2% between 2010 and 2019, and the 2019 unemployment rate in Midland of 2.1% was nearly the lowest of any U.S. metro area.
3. Austin-Round Rock-Georgetown, TX
> 2010-2019 pop. change: +29.8% (+510,760)
> 2010-2019 median home value increase: 69.7% — 12th highest out of 383 MSAs
> 2010-2019 employment increase: 39.2% — 5th highest out of 383 MSAs
> 2019 unemployment: 2.7% — 53rd lowest out of 383 MSAs
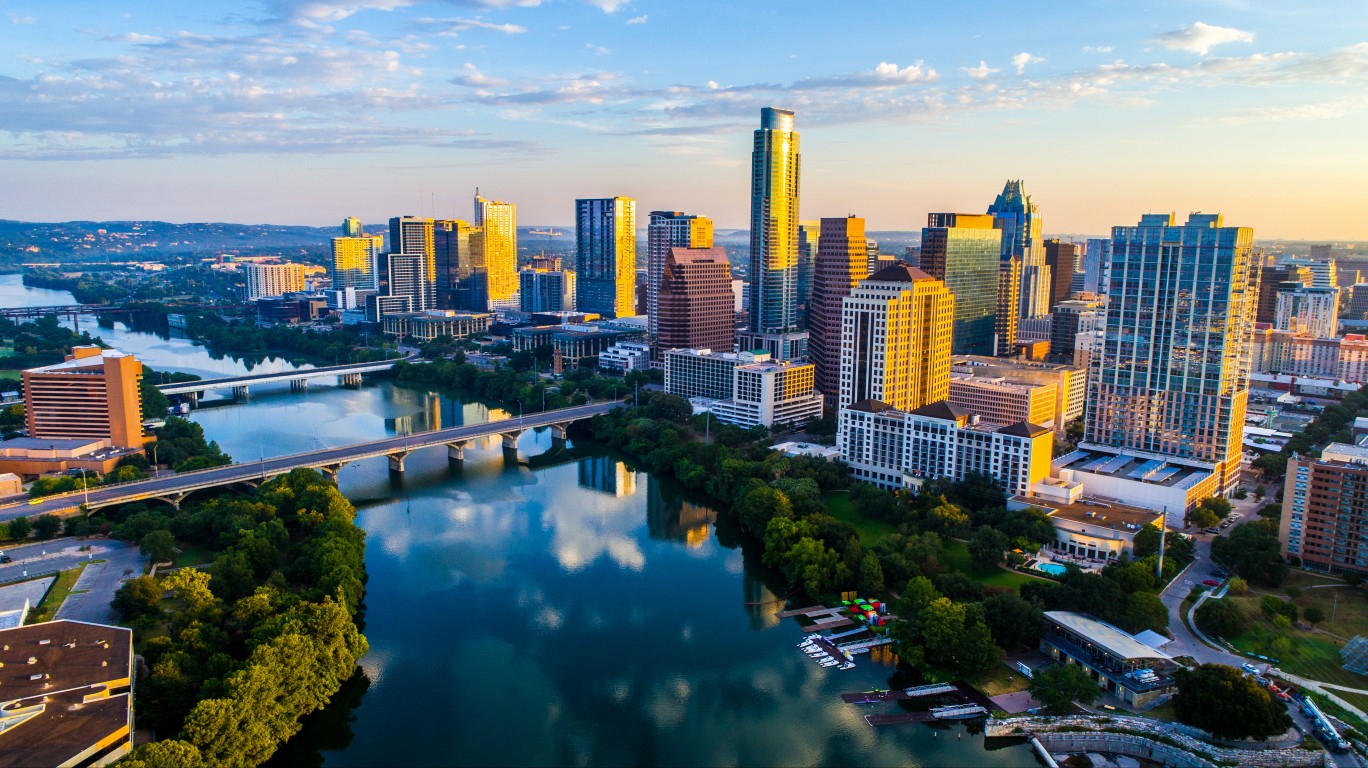
Reporting a 29.8% population growth between 2010 and 2019, Austin, Texas, is the fastest growing metro area in Texas and third fastest nationwide. Austin has drawn in hundreds of thousands of new residents over the past decade thanks in large part to its booming economy, which is driven in part by a concentration of tech giants and startups. As of 2019, unemployment in the metro area was just 2.7%, a full percentage point below the national rate.
Jobs in the Texas capital also tend to be well paying. The typical household in Austin earns $82,650 a year, well above the national median income of $65,712.
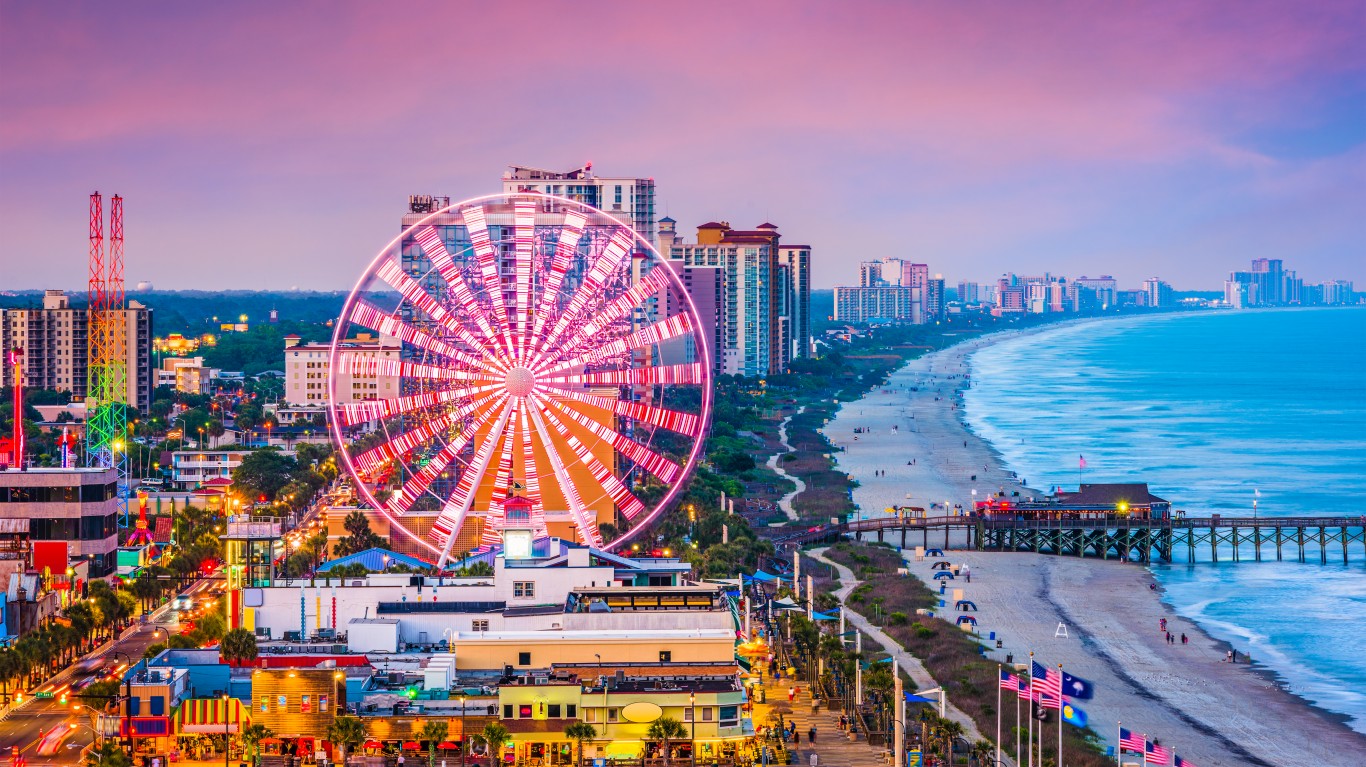
2. Myrtle Beach-Conway-North Myrtle Beach, SC-NC
> 2010-2019 pop. change: +32.0% (+120,326)
> 2010-2019 median home value increase: 31.5% — 140th highest out of 383 MSAs
> 2010-2019 employment increase: 25.2% — 33rd highest out of 383 MSAs
> 2019 unemployment: 4.0% — 256th lowest out of 383 MSAs
Myrtle Beach, South Carolina, is one of several coastal metro areas in the South to report near nation-leading population growth. Between 2010 and 2019, the number of people living in the Myrtle Beach metro area increased by 32%, or about 120,300. The population increase was driven overwhelmingly by people moving to the area, rather than a high birth rate.
During the COVID-19 pandemic, however, the influx of new residents to the area appears to have slowed. Preliminary data shows that the number of people who decided to move to the area was down 80% in 2020 compared to the previous year.
[in-text-ad-2]

1. The Villages, FL
> 2010-2019 pop. change: +41.7% (+39,000)
> 2010-2019 median home value increase: 49.4% — 56th highest out of 383 MSAs
> 2010-2019 employment increase: 41.8% — 3rd highest out of 383 MSAs
> 2019 unemployment: 4.6% — 312th lowest out of 383 MSAs
The Villages is the fastest growing metro area both in Florida and nationwide. Between 2010 and 2019, the number of people living in The Villages increased by 41.7%. The Villages, located in the central part of the state, markets itself as a collection of retirement communities. Draws for new residents, many of whom are retirees, include the state’s warm climate and lack of income tax.
As is often the case in rapidly growing areas, real estate values are climbing rapidly in The Villages. The typical area home is worth $282,000, nearly 50% more than in 2010.
“The Next NVIDIA” Could Change Your Life
If you missed out on NVIDIA’s historic run, your chance to see life-changing profits from AI isn’t over.
The 24/7 Wall Street Analyst who first called NVIDIA’s AI-fueled rise in 2009 just published a brand-new research report named “The Next NVIDIA.”
Click here to download your FREE copy.
Thank you for reading! Have some feedback for us?
Contact the 24/7 Wall St. editorial team.
 24/7 Wall St.
 24/7 Wall St.
 24/7 Wall St.
