Special Report
This Is the State Where People Don't Get Enough to Eat
Published:
Last Updated:

Among the problems created by the COVID-19 pandemic is that many people who live in poverty, those with low wages that keep them just above the poverty level and those who lack job security have to make very difficult decisions about expenses. The federal government, in particular the U.S. Census Bureau, has attempted to track the effects of the pandemic on the most vulnerable portions of the population through what it calls the Household Pulse Survey, which is now in its 23rd week of data gathering. Among the conditions its questionnaires probe for is whether people can afford food.
The Pulse Survey has labeled the hunger problem as “food scarcity.” This is defined as “adults in households where there was either sometimes or often not enough to eat in the last 7 days.”
The data is collected among a sample of adults ages 18 and older.
Kentucky ranked highest on the list at 16.9%, followed by Louisiana (16.7%), Georgia (15.2%) and Alabama and Alaska (both 14.4%).
The numbers were lowest in the Northeast and the Plains States: Vermont and Wyoming (both 5.8%), Montana (6.1%), North Dakota (6.5%) and Massachusetts and Washington (both 6.8%).
Although the Pulse Survey does not match the food scarcity issue with income, it is notable that Kentucky, Louisiana and Alabama all rank among the nine lowest states sorted by median household income.
Click here to see the state where people don’t get enough to eat.
The U.S. Census Bureau has conducted the Household Pulse Survey since April 23, 2020. The 23rd week covers the period from January 20 through February 1, 2021. Although the Census uses the term “week,” collection periods cover two weeks. Data is collected from all 50 states and the District of Columbia, as well as from the 15 largest metropolitan statistical areas. The primary subjects covered by the survey are learning activities, internet availability, education situations, anticipated loss of wages, presence of depression and anxiety, housing, transportation and travel.
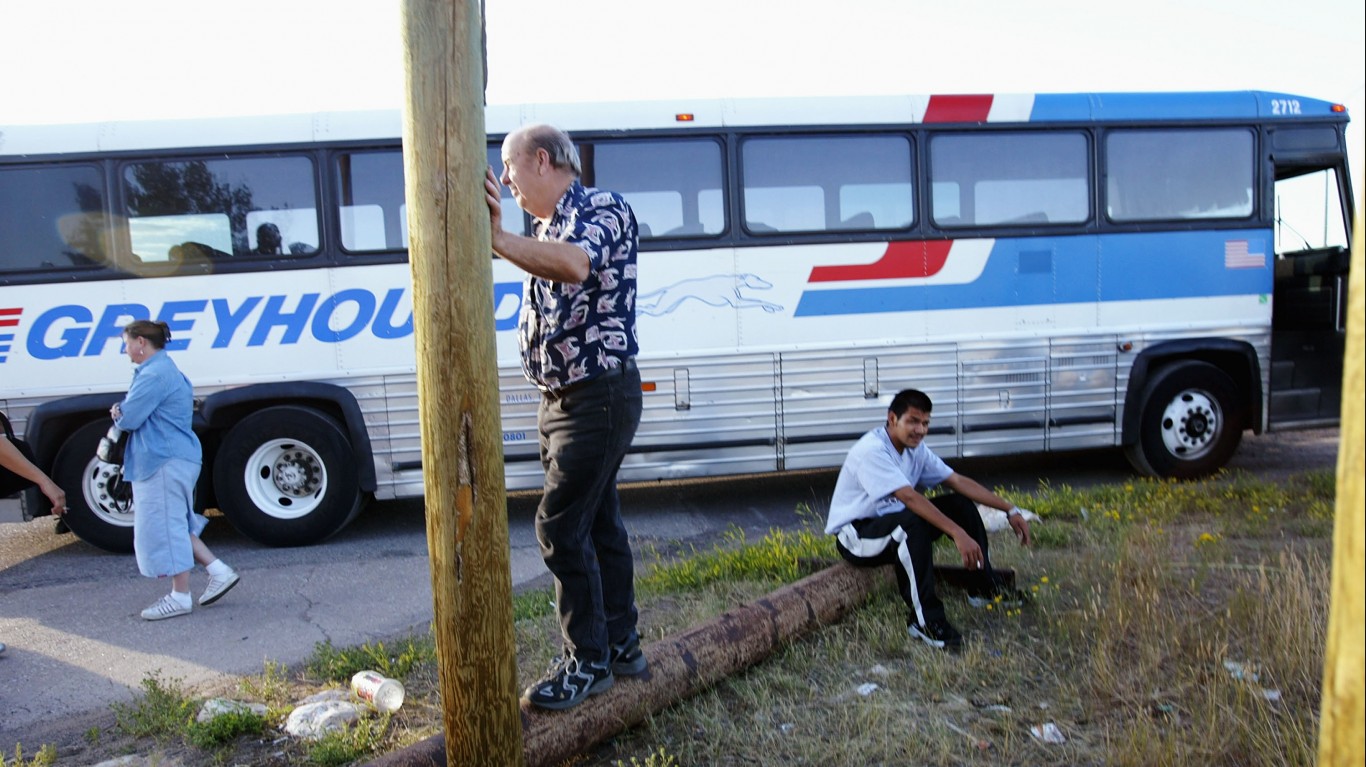
50. Wyoming
> Adults who did not get enough to eat at the end of Jan: 22,437
> Share of adults who did not get enough to eat: 5.8%
> Household pulse survey sample: 383,567
> Adult population in 2019: 444,570
> Poverty rate in 2019: 10.1% (14th lowest)
[in-text-ad]

49. Vermont
> Adults who did not get enough to eat at the end of Jan: 25,567
> Share of adults who did not get enough to eat: 5.8%
> Household pulse survey sample: 438,799
> Adult population in 2019: 510,430
> Poverty rate in 2019: 10.2% (15th lowest)

48. Montana
> Adults who did not get enough to eat at the end of Jan: 44,451
> Share of adults who did not get enough to eat: 6.1%
> Household pulse survey sample: 734,079
> Adult population in 2019: 842,254
> Poverty rate in 2019: 12.6% (20th highest)

47. North Dakota
> Adults who did not get enough to eat at the end of Jan: 31,677
> Share of adults who did not get enough to eat: 6.5%
> Household pulse survey sample: 490,167
> Adult population in 2019: 585,356
> Poverty rate in 2019: 10.6% (17th lowest)
[in-text-ad-2]

46. Washington
> Adults who did not get enough to eat at the end of Jan: 366,617
> Share of adults who did not get enough to eat: 6.8%
> Household pulse survey sample: 5,362,558
> Adult population in 2019: 5,951,928
> Poverty rate in 2019: 9.8% (9th lowest)
45. Massachusetts
> Adults who did not get enough to eat at the end of Jan: 317,541
> Share of adults who did not get enough to eat: 6.8%
> Household pulse survey sample: 4,639,601
> Adult population in 2019: 5,540,726
> Poverty rate in 2019: 9.4% (8th lowest)
[in-text-ad]
44. Utah
> Adults who did not get enough to eat at the end of Jan: 143,701
> Share of adults who did not get enough to eat: 7.1%
> Household pulse survey sample: 2,037,814
> Adult population in 2019: 2,275,650
> Poverty rate in 2019: 8.9% (2nd lowest)

43. Rhode Island
> Adults who did not get enough to eat at the end of Jan: 49,933
> Share of adults who did not get enough to eat: 7.5%
> Household pulse survey sample: 666,817
> Adult population in 2019: 855,786
> Poverty rate in 2019: 10.8% (18th lowest)

42. Idaho
> Adults who did not get enough to eat at the end of Jan: 92,297
> Share of adults who did not get enough to eat: 7.8%
> Household pulse survey sample: 1,186,454
> Adult population in 2019: 1,337,710
> Poverty rate in 2019: 11.2% (21st lowest)
[in-text-ad-2]
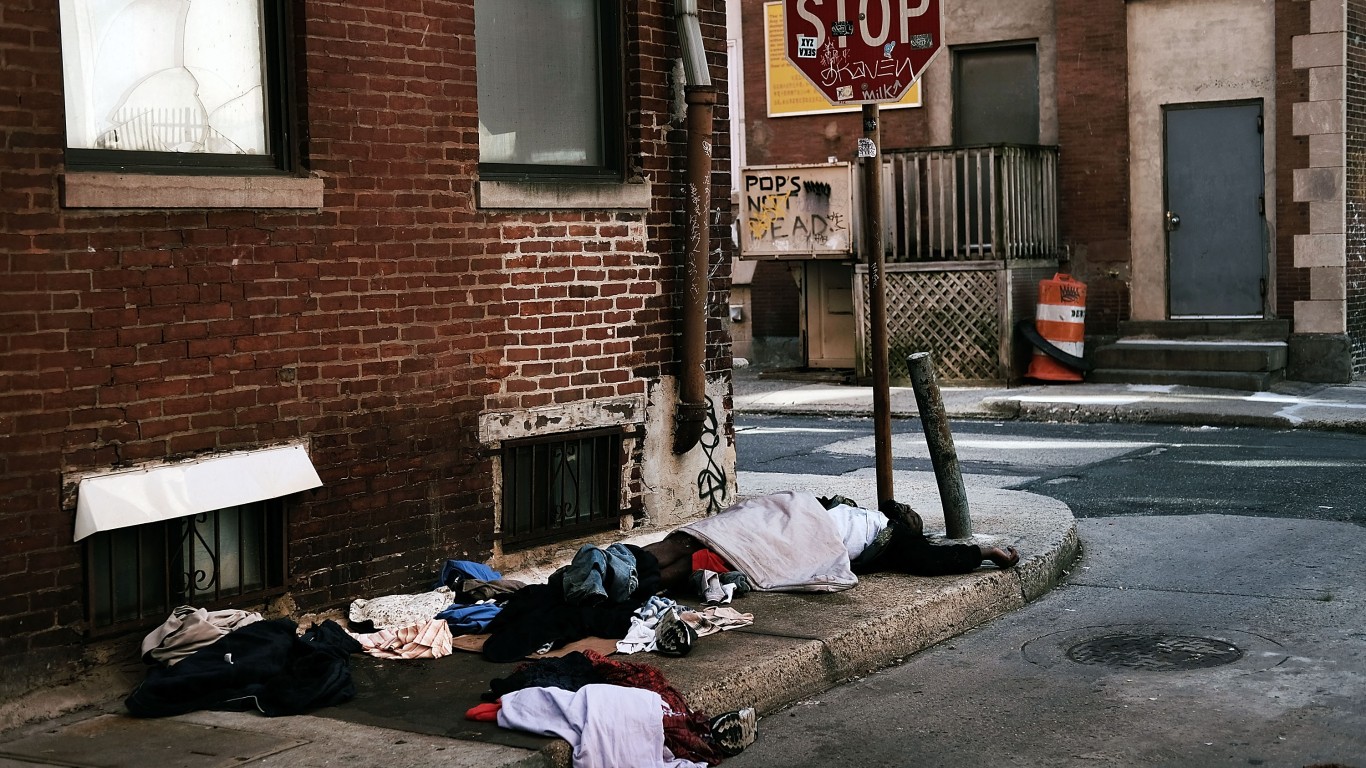
41. Pennsylvania
> Adults who did not get enough to eat at the end of Jan: 650,073
> Share of adults who did not get enough to eat: 7.8%
> Household pulse survey sample: 8,307,119
> Adult population in 2019: 10,169,664
> Poverty rate in 2019: 12.0% (22nd highest)

40. New Hampshire
> Adults who did not get enough to eat at the end of Jan: 73,388
> Share of adults who did not get enough to eat: 7.9%
> Household pulse survey sample: 934,544
> Adult population in 2019: 1,103,691
> Poverty rate in 2019: 7.3% (the lowest)
[in-text-ad]
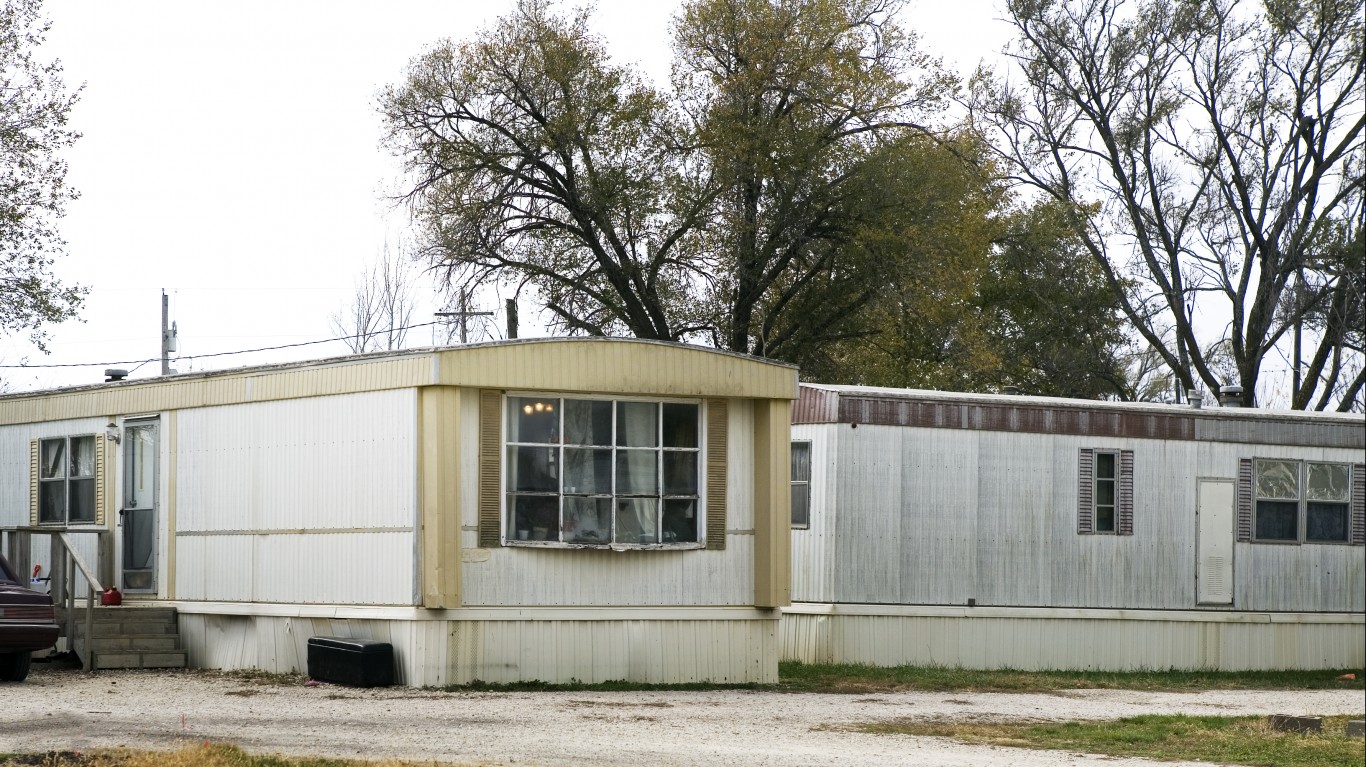
39. Kansas
> Adults who did not get enough to eat at the end of Jan: 148,874
> Share of adults who did not get enough to eat: 8.0%
> Household pulse survey sample: 1,863,031
> Adult population in 2019: 2,213,013
> Poverty rate in 2019: 11.4% (24th lowest)
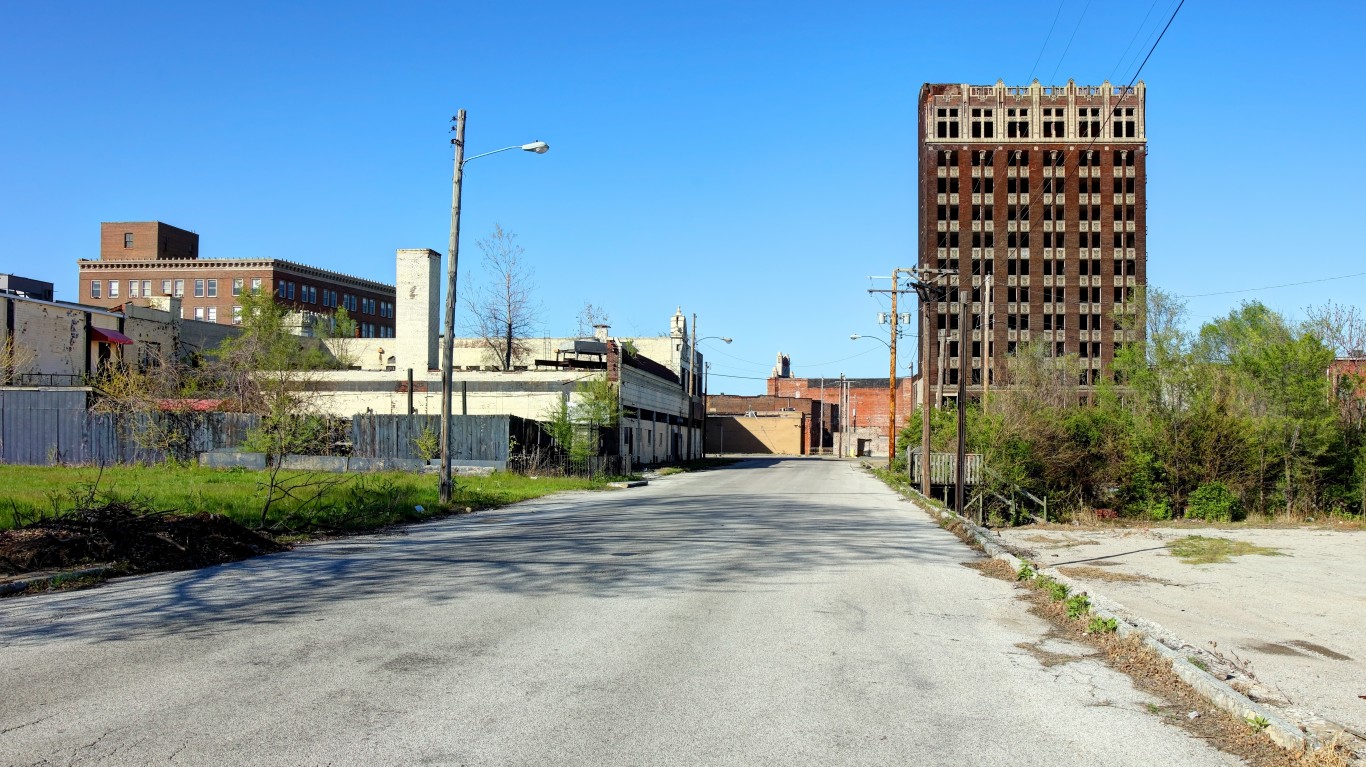
38. Missouri
> Adults who did not get enough to eat at the end of Jan: 328,102
> Share of adults who did not get enough to eat: 8.0%
> Household pulse survey sample: 4,102,435
> Adult population in 2019: 4,764,733
> Poverty rate in 2019: 12.9% (18th highest)
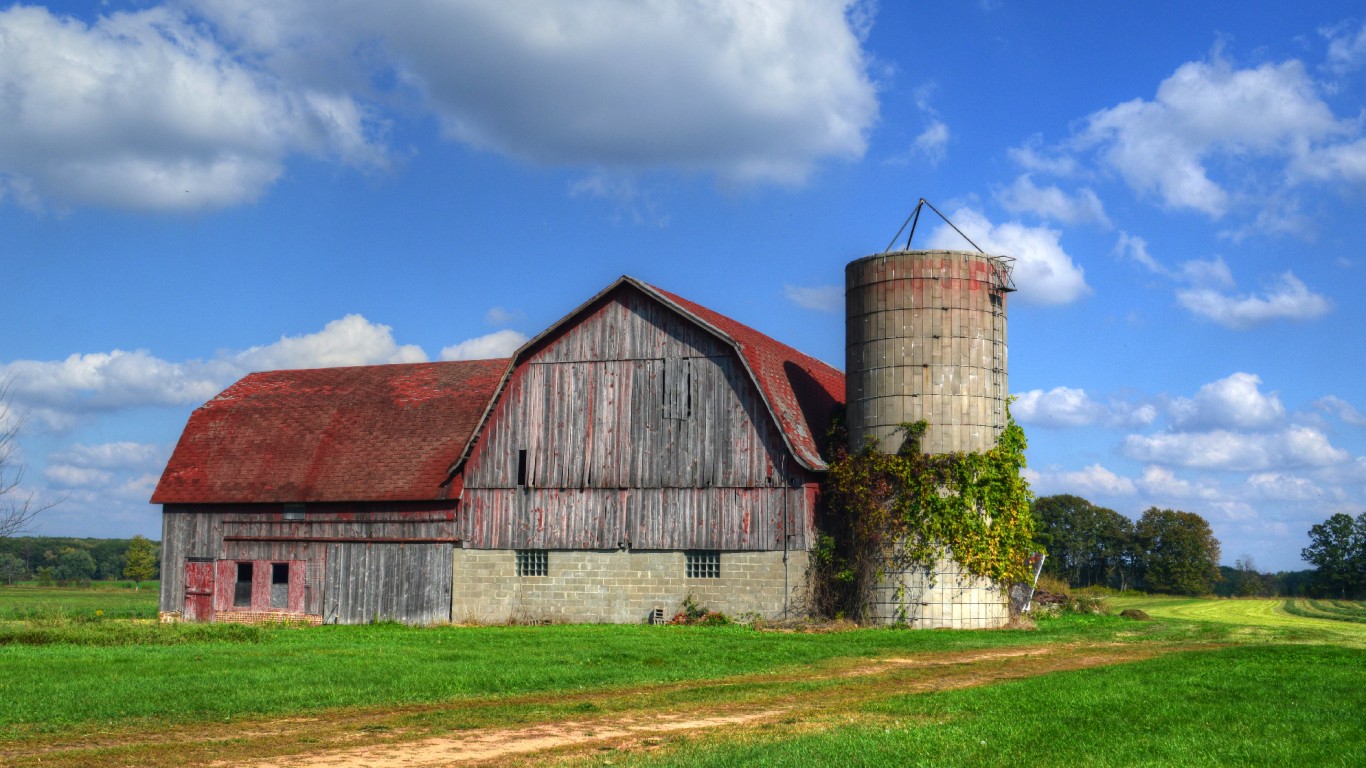
37. Wisconsin
> Adults who did not get enough to eat at the end of Jan: 340,924
> Share of adults who did not get enough to eat: 8.6%
> Household pulse survey sample: 3,973,154
> Adult population in 2019: 4,559,022
> Poverty rate in 2019: 10.4% (16th lowest)
[in-text-ad-2]
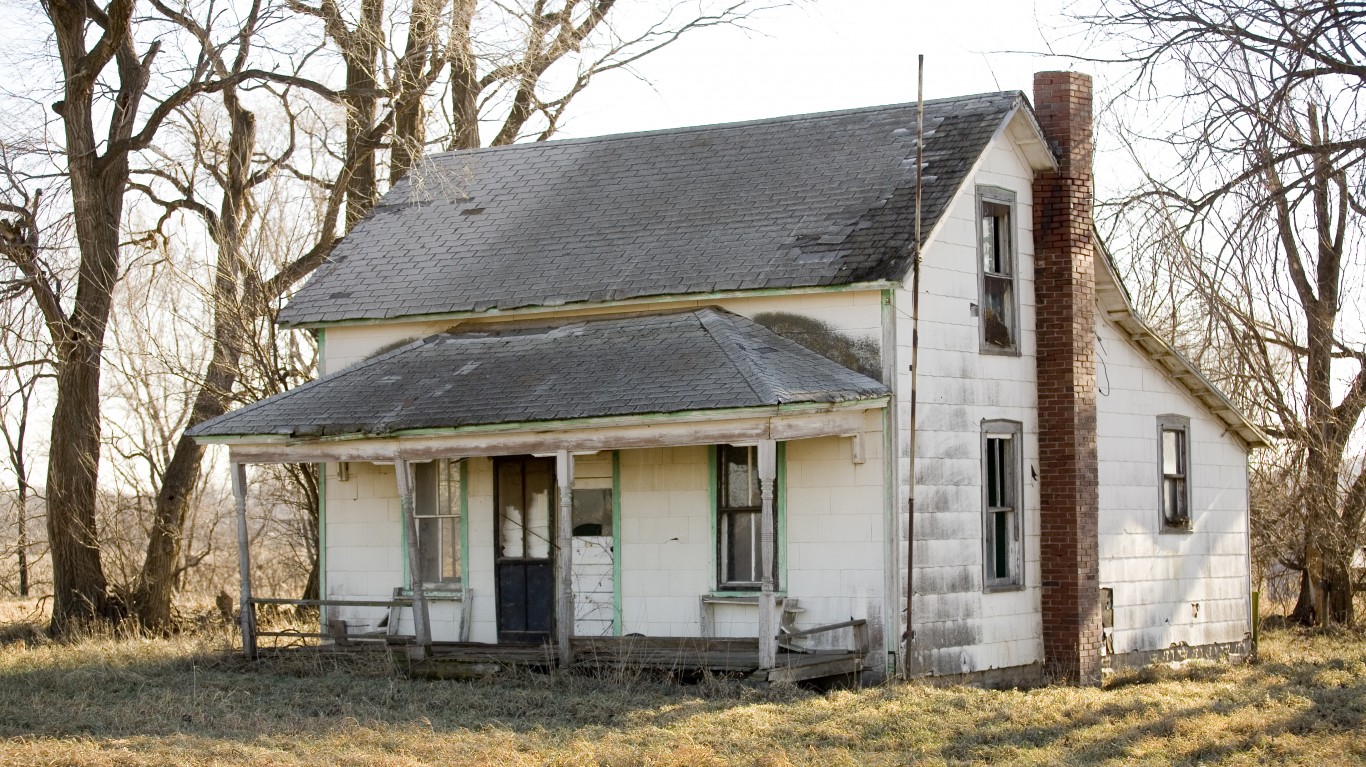
36. Iowa
> Adults who did not get enough to eat at the end of Jan: 183,584
> Share of adults who did not get enough to eat: 8.9%
> Household pulse survey sample: 2,061,109
> Adult population in 2019: 2,433,240
> Poverty rate in 2019: 11.2% (20th lowest)

35. New Jersey
> Adults who did not get enough to eat at the end of Jan: 529,887
> Share of adults who did not get enough to eat: 9.1%
> Household pulse survey sample: 5,797,065
> Adult population in 2019: 6,944,166
> Poverty rate in 2019: 9.2% (5th lowest)
[in-text-ad]

34. Ohio
> Adults who did not get enough to eat at the end of Jan: 737,436
> Share of adults who did not get enough to eat: 9.4%
> Household pulse survey sample: 7,845,569
> Adult population in 2019: 9,114,253
> Poverty rate in 2019: 13.1% (15th highest)

33. Maryland
> Adults who did not get enough to eat at the end of Jan: 367,710
> Share of adults who did not get enough to eat: 9.4%
> Household pulse survey sample: 3,901,466
> Adult population in 2019: 4,713,393
> Poverty rate in 2019: 9.0% (4th lowest)
32. Oregon
> Adults who did not get enough to eat at the end of Jan: 281,213
> Share of adults who did not get enough to eat: 9.5%
> Household pulse survey sample: 2,946,602
> Adult population in 2019: 3,354,921
> Poverty rate in 2019: 11.4% (23rd lowest)
[in-text-ad-2]
31. Hawaii
> Adults who did not get enough to eat at the end of Jan: 94,033
> Share of adults who did not get enough to eat: 9.6%
> Household pulse survey sample: 984,316
> Adult population in 2019: 1,115,685
> Poverty rate in 2019: 9.3% (6th lowest)
30. Connecticut
> Adults who did not get enough to eat at the end of Jan: 224,639
> Share of adults who did not get enough to eat: 9.6%
> Household pulse survey sample: 2,338,155
> Adult population in 2019: 2,837,855
> Poverty rate in 2019: 10.0% (12th lowest)
[in-text-ad]
29. Maine
> Adults who did not get enough to eat at the end of Jan: 90,677
> Share of adults who did not get enough to eat: 9.6%
> Household pulse survey sample: 948,170
> Adult population in 2019: 1,097,859
> Poverty rate in 2019: 10.9% (19th lowest)

28. Colorado
> Adults who did not get enough to eat at the end of Jan: 389,859
> Share of adults who did not get enough to eat: 9.8%
> Household pulse survey sample: 3,995,221
> Adult population in 2019: 4,502,416
> Poverty rate in 2019: 9.3% (7th lowest)
27. Virginia
> Adults who did not get enough to eat at the end of Jan: 560,586
> Share of adults who did not get enough to eat: 9.8%
> Household pulse survey sample: 5,704,403
> Adult population in 2019: 6,677,914
> Poverty rate in 2019: 9.9% (11th lowest)
[in-text-ad-2]

26. Indiana
> Adults who did not get enough to eat at the end of Jan: 429,824
> Share of adults who did not get enough to eat: 9.9%
> Household pulse survey sample: 4,357,922
> Adult population in 2019: 5,164,798
> Poverty rate in 2019: 11.9% (24th highest)
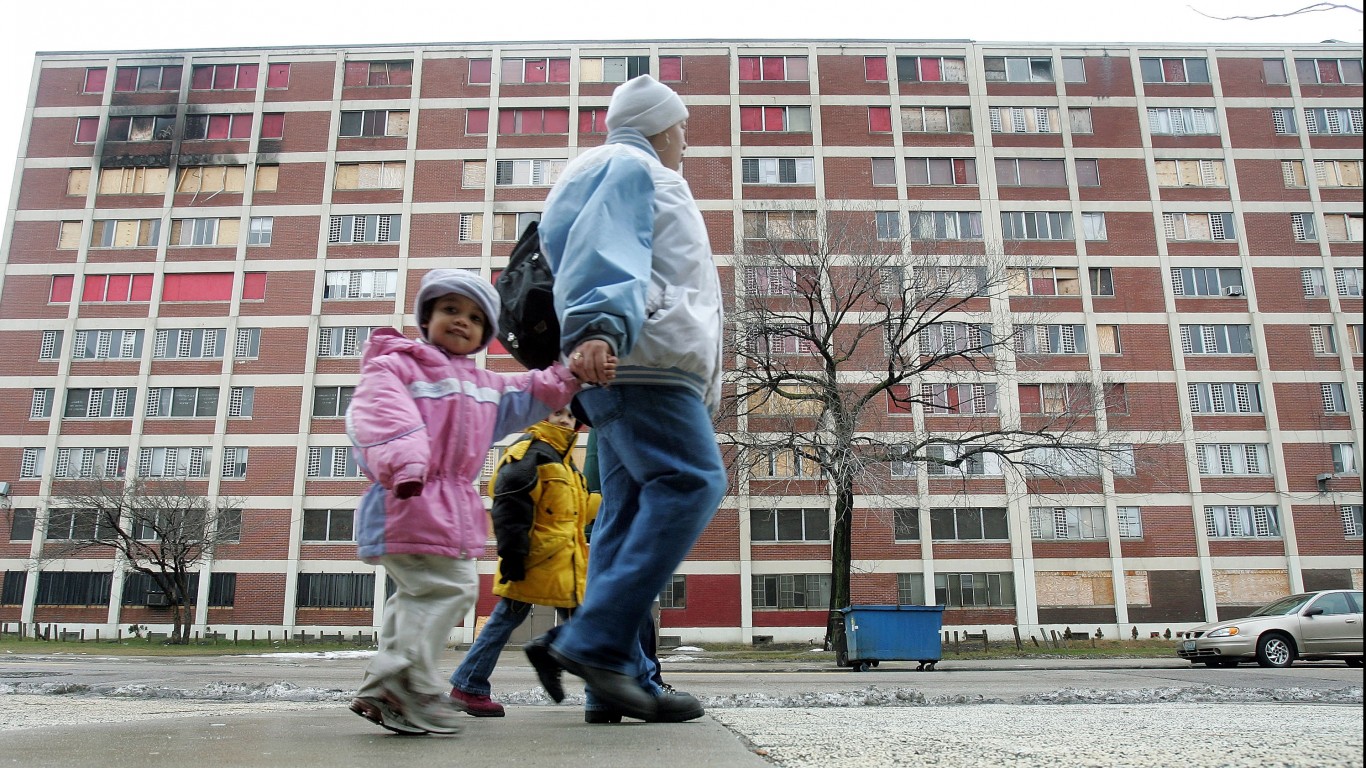
25. Illinois
> Adults who did not get enough to eat at the end of Jan: 817,313
> Share of adults who did not get enough to eat: 10.0%
> Household pulse survey sample: 8,201,509
> Adult population in 2019: 9,857,142
> Poverty rate in 2019: 11.5% (25th lowest)
[in-text-ad]
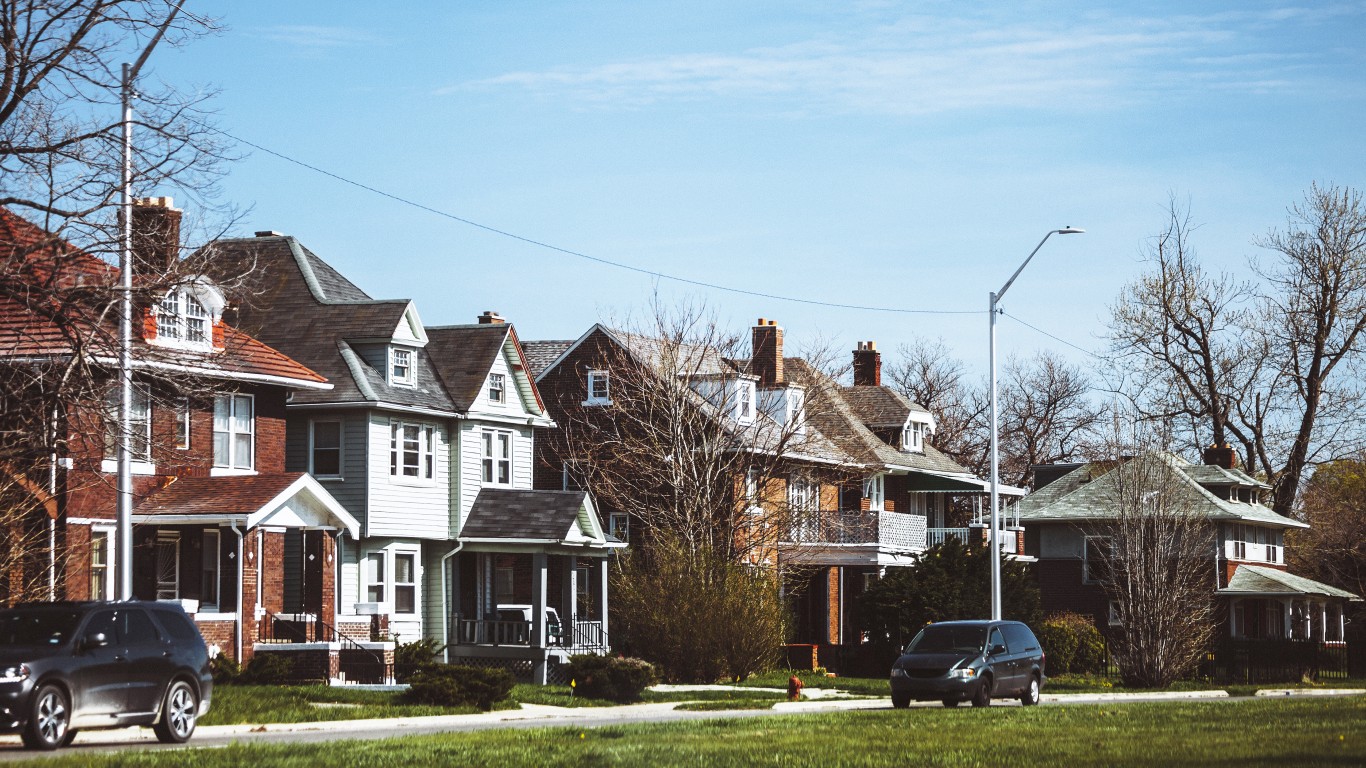
24. Michigan
> Adults who did not get enough to eat at the end of Jan: 652,664
> Share of adults who did not get enough to eat: 10.1%
> Household pulse survey sample: 6,491,394
> Adult population in 2019: 7,844,035
> Poverty rate in 2019: 13.0% (17th highest)

23. Nebraska
> Adults who did not get enough to eat at the end of Jan: 124,485
> Share of adults who did not get enough to eat: 10.1%
> Household pulse survey sample: 1,234,310
> Adult population in 2019: 1,459,312
> Poverty rate in 2019: 9.9% (10th lowest)
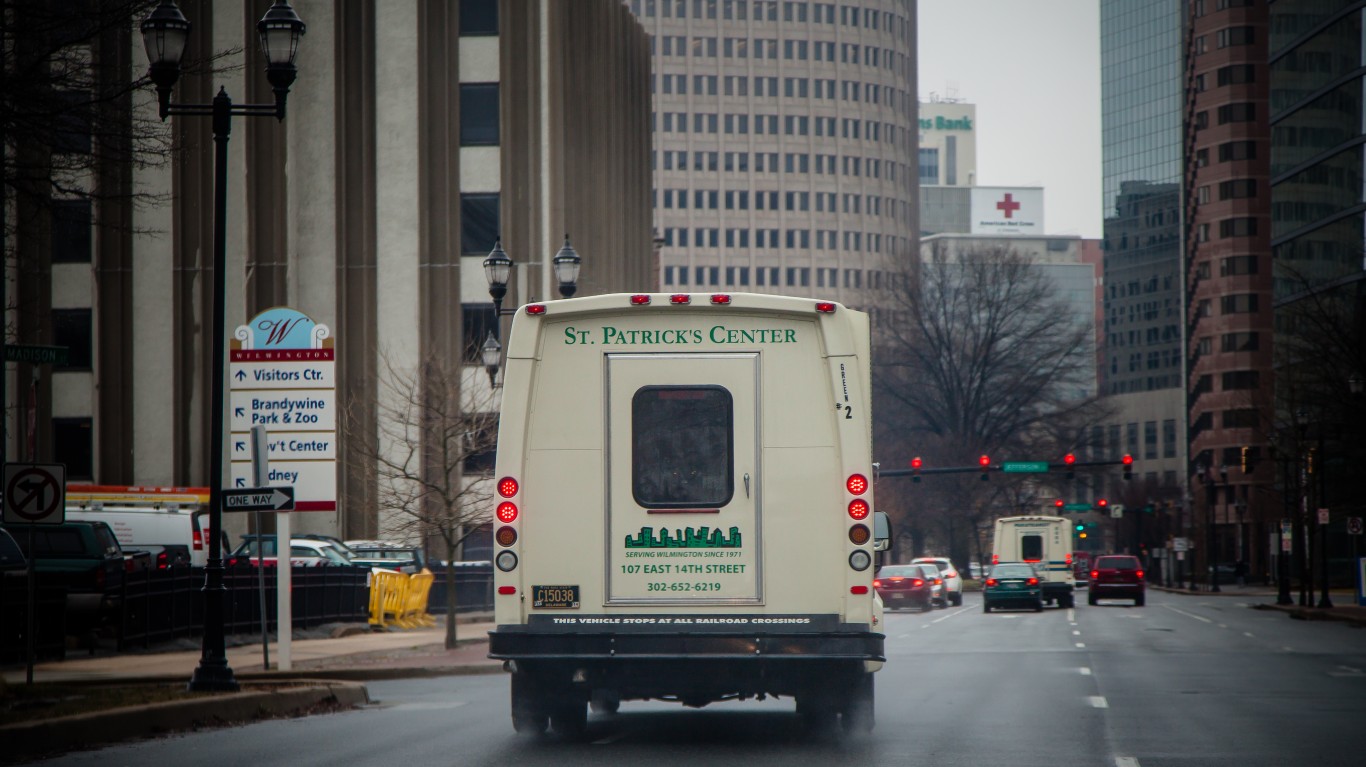
22. Delaware
> Adults who did not get enough to eat at the end of Jan: 68,396
> Share of adults who did not get enough to eat: 10.1%
> Household pulse survey sample: 674,193
> Adult population in 2019: 769,818
> Poverty rate in 2019: 11.3% (22nd lowest)
[in-text-ad-2]
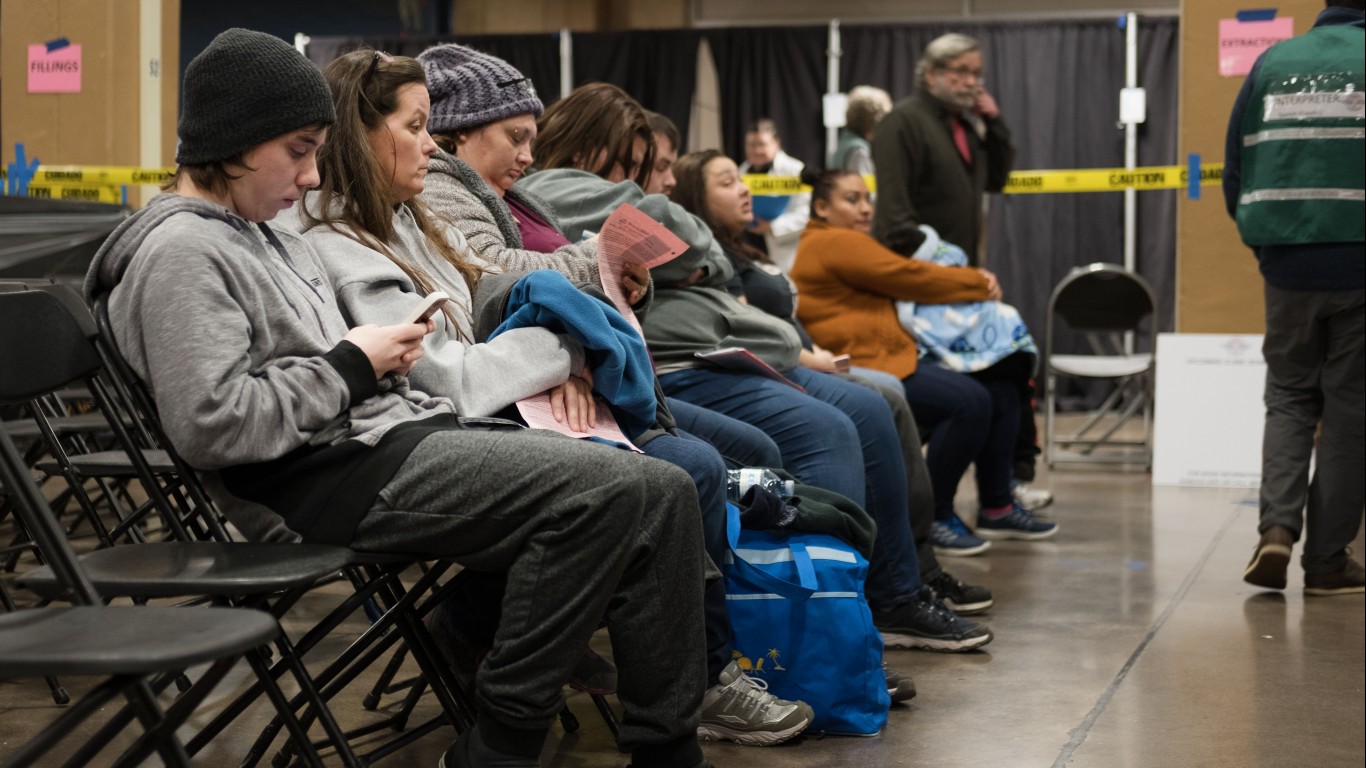
21. Tennessee
> Adults who did not get enough to eat at the end of Jan: 487,943
> Share of adults who did not get enough to eat: 10.8%
> Household pulse survey sample: 4,498,244
> Adult population in 2019: 5,318,422
> Poverty rate in 2019: 13.9% (9th highest)
20. Minnesota
> Adults who did not get enough to eat at the end of Jan: 403,509
> Share of adults who did not get enough to eat: 10.8%
> Household pulse survey sample: 3,726,109
> Adult population in 2019: 4,336,963
> Poverty rate in 2019: 9.0% (3rd lowest)
[in-text-ad]

19. South Dakota
> Adults who did not get enough to eat at the end of Jan: 63,655
> Share of adults who did not get enough to eat: 11.0%
> Household pulse survey sample: 578,944
> Adult population in 2019: 669,390
> Poverty rate in 2019: 11.9% (23rd highest)

18. South Carolina
> Adults who did not get enough to eat at the end of Jan: 386,023
> Share of adults who did not get enough to eat: 11.2%
> Household pulse survey sample: 3,434,287
> Adult population in 2019: 4,036,414
> Poverty rate in 2019: 13.8% (10th highest)
17. Oklahoma
> Adults who did not get enough to eat at the end of Jan: 294,542
> Share of adults who did not get enough to eat: 11.8%
> Household pulse survey sample: 2,486,319
> Adult population in 2019: 3,004,742
> Poverty rate in 2019: 15.2% (8th highest)
[in-text-ad-2]
16. North Carolina
> Adults who did not get enough to eat at the end of Jan: 839,473
> Share of adults who did not get enough to eat: 12.0%
> Household pulse survey sample: 6,991,403
> Adult population in 2019: 8,194,112
> Poverty rate in 2019: 13.6% (12th highest)
15. Arizona
> Adults who did not get enough to eat at the end of Jan: 578,787
> Share of adults who did not get enough to eat: 12.1%
> Household pulse survey sample: 4,782,586
> Adult population in 2019: 5,639,069
> Poverty rate in 2019: 13.5% (13th highest)
[in-text-ad]
14. California
> Adults who did not get enough to eat at the end of Jan: 3,137,005
> Share of adults who did not get enough to eat: 12.2%
> Household pulse survey sample: 25,625,838
> Adult population in 2019: 30,621,159
> Poverty rate in 2019: 11.8% (25th highest)
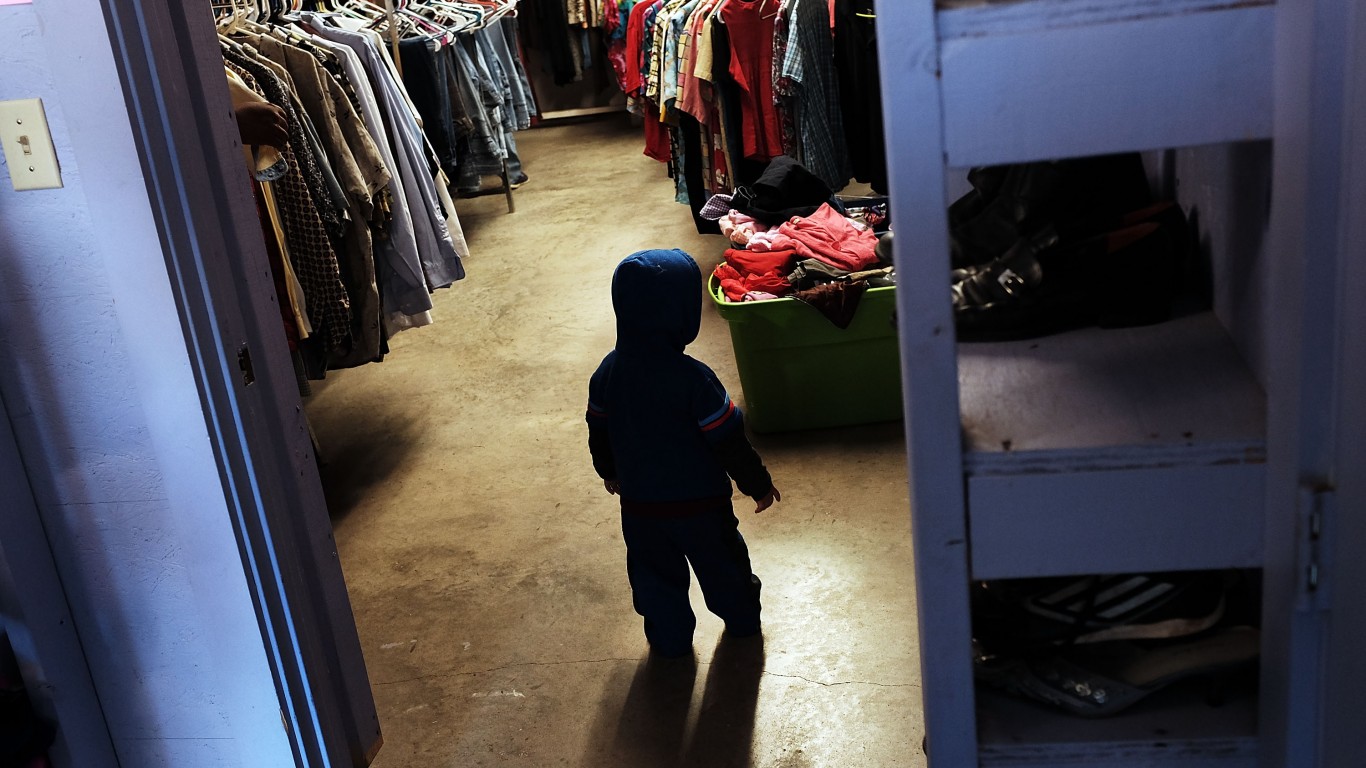
13. Texas
> Adults who did not get enough to eat at the end of Jan: 2,332,976
> Share of adults who did not get enough to eat: 12.8%
> Household pulse survey sample: 18,201,518
> Adult population in 2019: 21,599,250
> Poverty rate in 2019: 13.6% (11th highest)
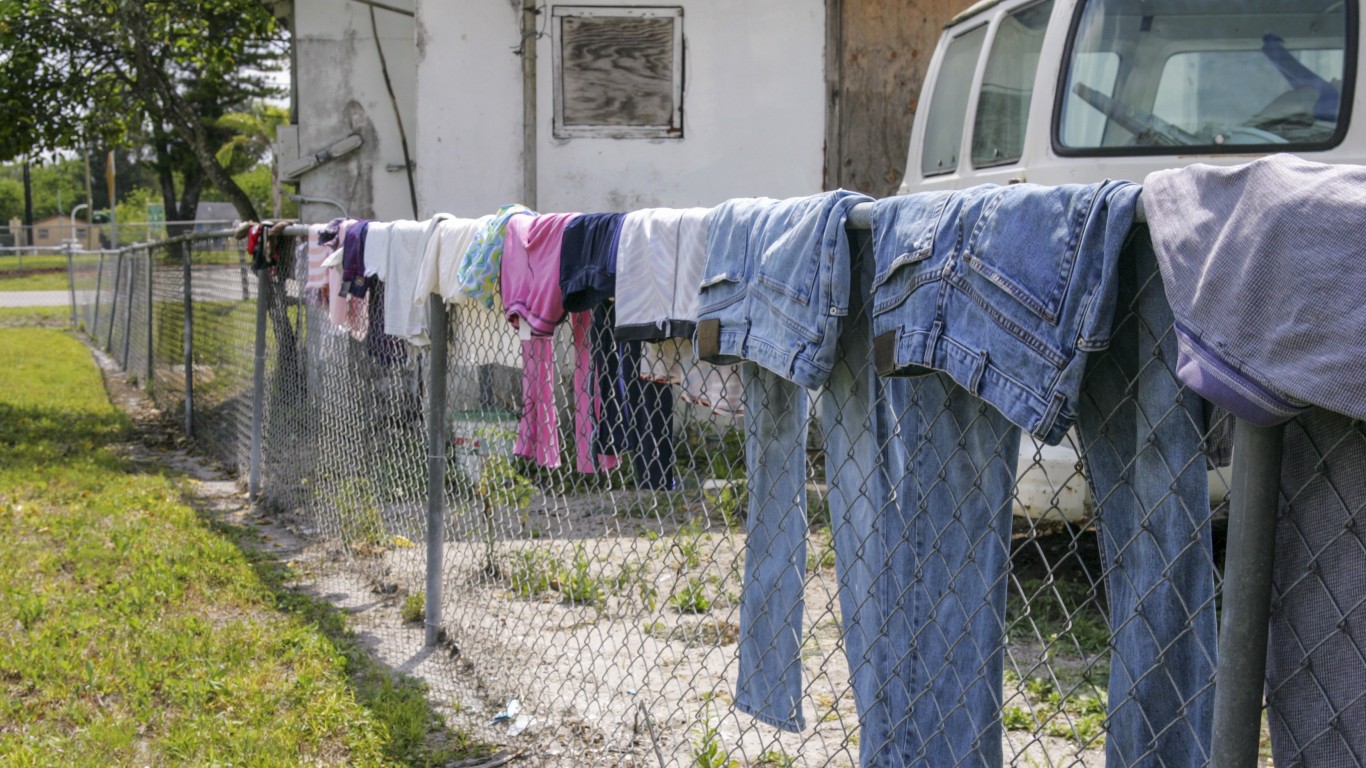
12. Florida
> Adults who did not get enough to eat at the end of Jan: 1,940,762
> Share of adults who did not get enough to eat: 12.9%
> Household pulse survey sample: 15,089,049
> Adult population in 2019: 17,245,782
> Poverty rate in 2019: 12.7% (19th highest)
[in-text-ad-2]
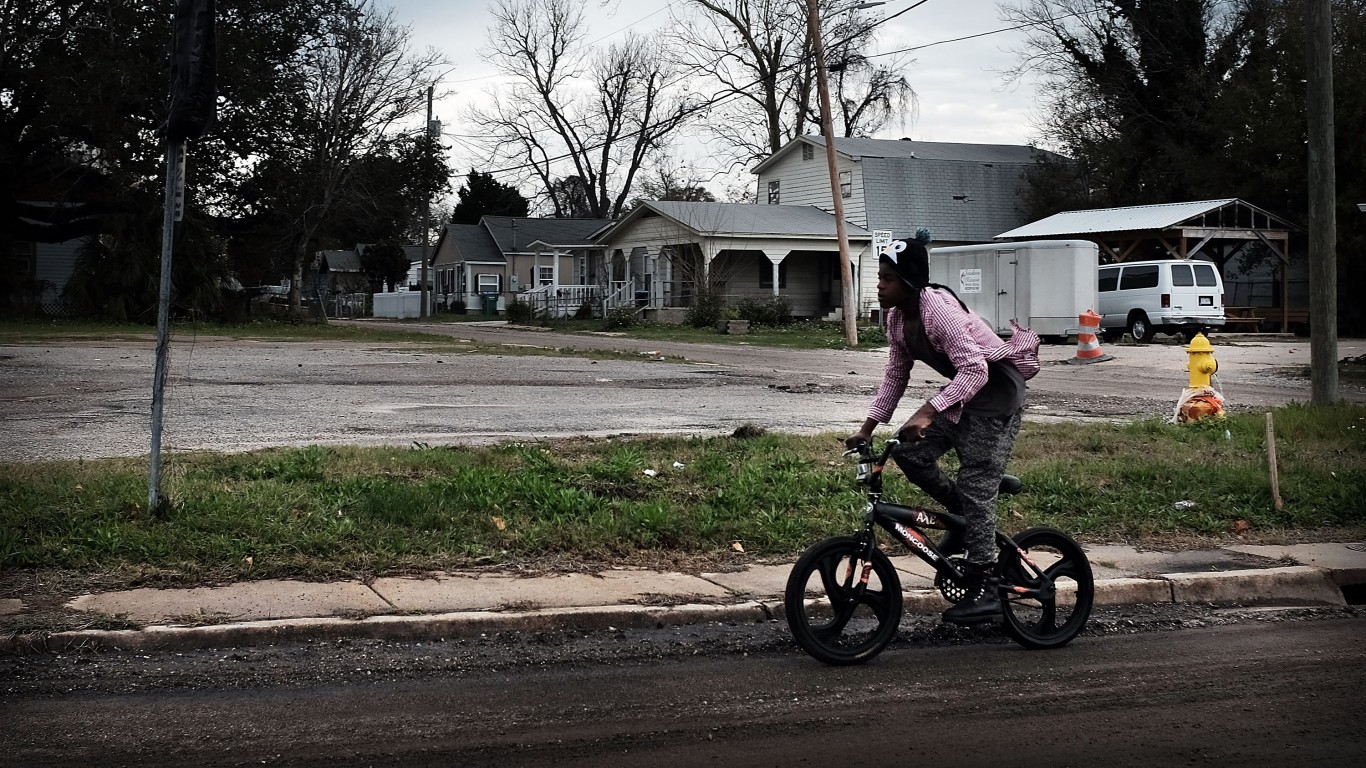
11. Mississippi
> Adults who did not get enough to eat at the end of Jan: 239,623
> Share of adults who did not get enough to eat: 13.0%
> Household pulse survey sample: 1,840,502
> Adult population in 2019: 2,277,729
> Poverty rate in 2019: 19.6% (the highest)
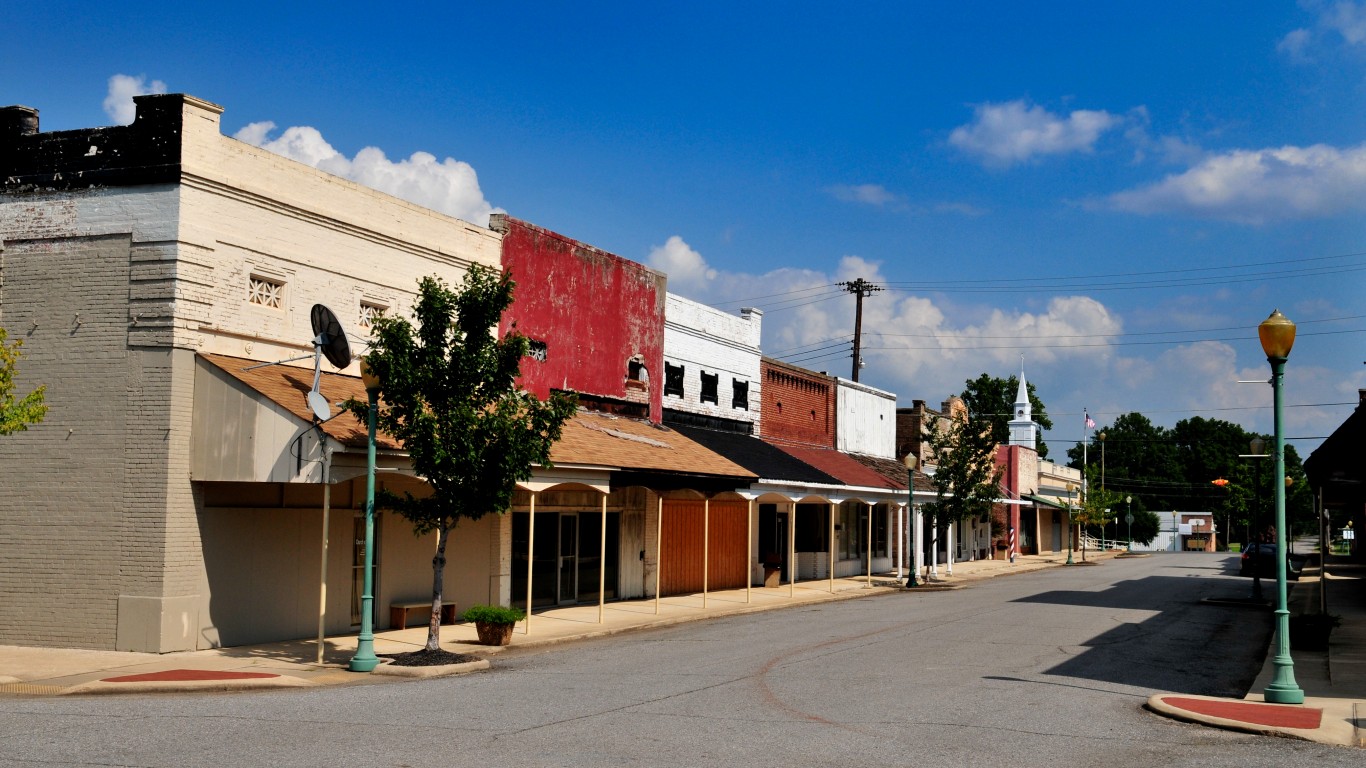
10. Arkansas
> Adults who did not get enough to eat at the end of Jan: 250,940
> Share of adults who did not get enough to eat: 13.1%
> Household pulse survey sample: 1,918,165
> Adult population in 2019: 2,318,792
> Poverty rate in 2019: 16.2% (5th highest)
[in-text-ad]

9. New Mexico
> Adults who did not get enough to eat at the end of Jan: 184,430
> Share of adults who did not get enough to eat: 13.3%
> Household pulse survey sample: 1,385,931
> Adult population in 2019: 1,622,979
> Poverty rate in 2019: 18.2% (3rd highest)

8. West Virginia
> Adults who did not get enough to eat at the end of Jan: 162,381
> Share of adults who did not get enough to eat: 13.9%
> Household pulse survey sample: 1,166,062
> Adult population in 2019: 1,433,329
> Poverty rate in 2019: 16.0% (6th highest)
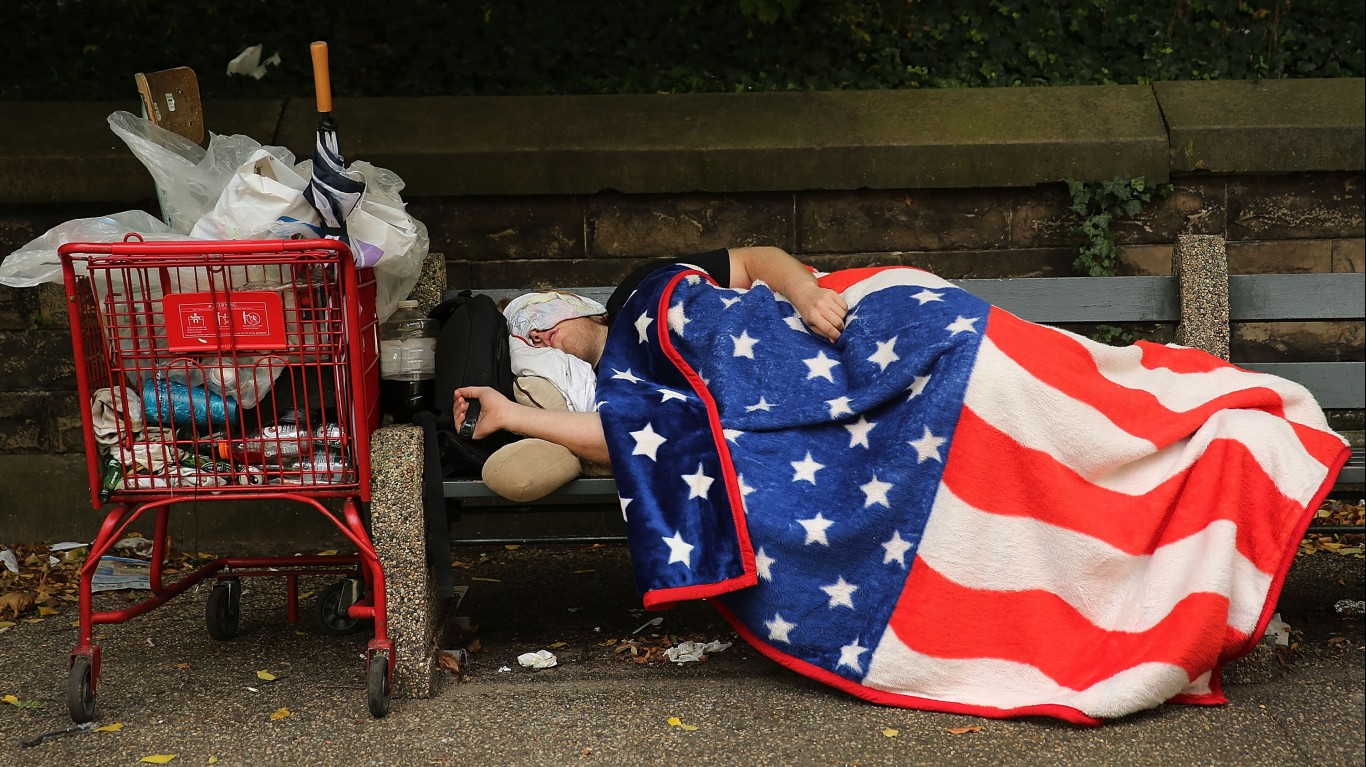
7. New York
> Adults who did not get enough to eat at the end of Jan: 1,752,965
> Share of adults who did not get enough to eat: 13.9%
> Household pulse survey sample: 12,638,613
> Adult population in 2019: 15,431,465
> Poverty rate in 2019: 13.0% (16th highest)
[in-text-ad-2]

6. Nevada
> Adults who did not get enough to eat at the end of Jan: 298,687
> Share of adults who did not get enough to eat: 14.2%
> Household pulse survey sample: 2,109,339
> Adult population in 2019: 2,389,419
> Poverty rate in 2019: 12.5% (21st highest)
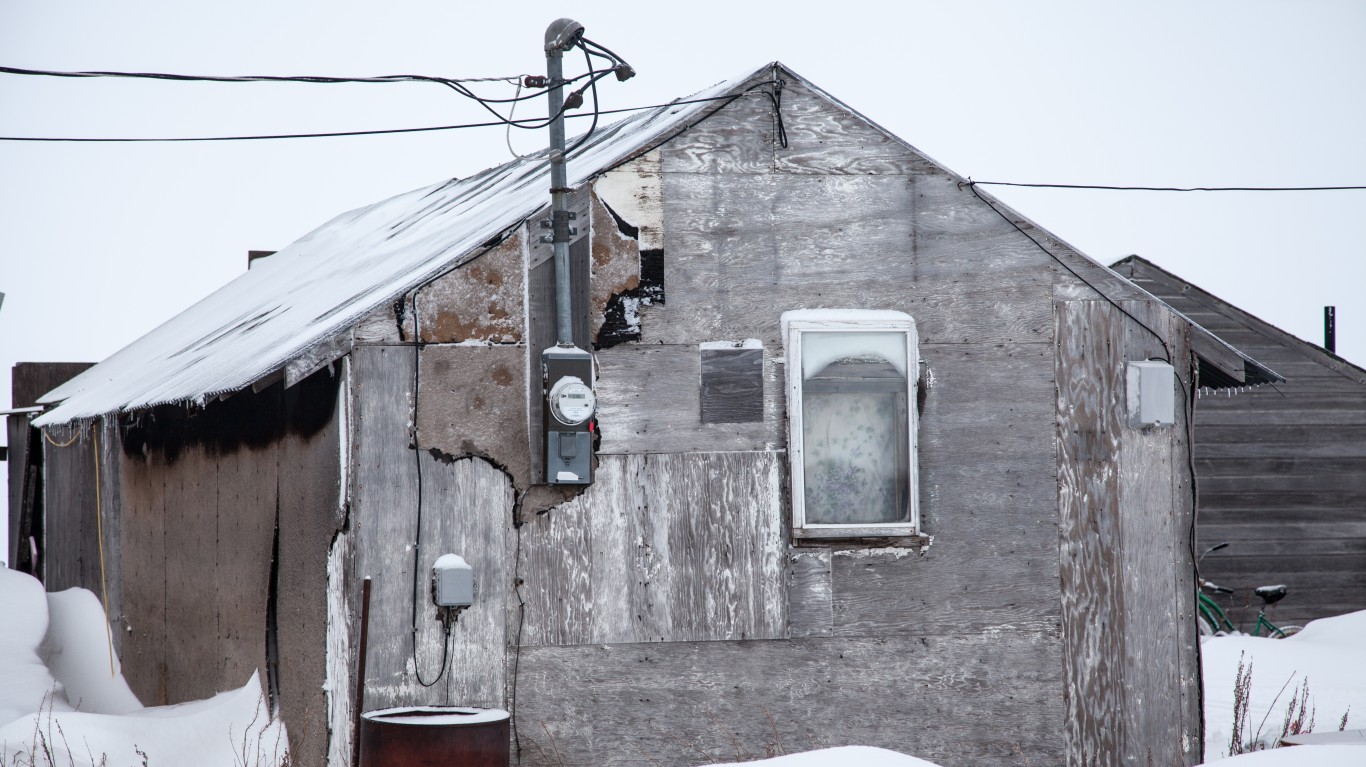
5. Alaska
> Adults who did not get enough to eat at the end of Jan: 66,514
> Share of adults who did not get enough to eat: 14.4%
> Household pulse survey sample: 463,459
> Adult population in 2019: 551,796
> Poverty rate in 2019: 10.1% (13th lowest)
[in-text-ad]
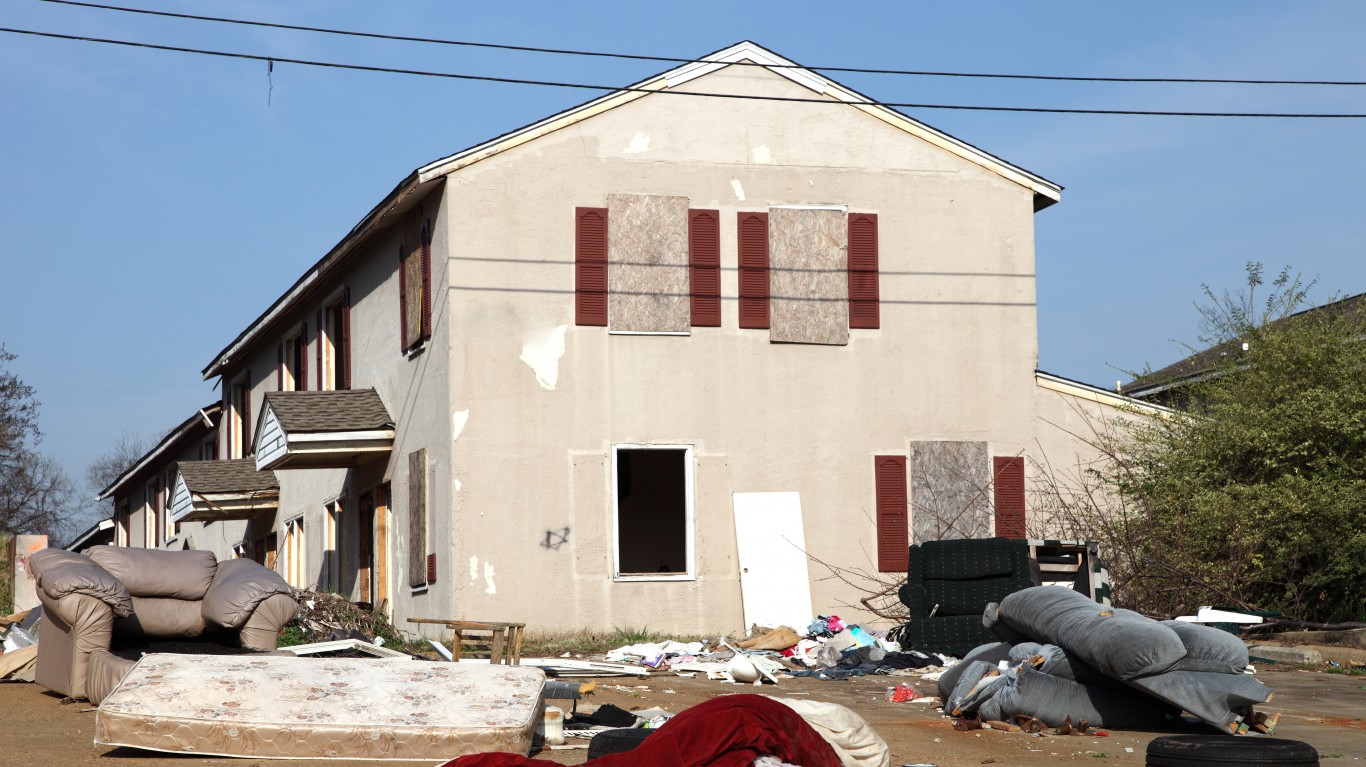
4. Alabama
> Adults who did not get enough to eat at the end of Jan: 441,252
> Share of adults who did not get enough to eat: 14.4%
> Household pulse survey sample: 3,060,704
> Adult population in 2019: 3,817,588
> Poverty rate in 2019: 15.5% (7th highest)
3. Georgia
> Adults who did not get enough to eat at the end of Jan: 1,035,769
> Share of adults who did not get enough to eat: 15.2%
> Household pulse survey sample: 6,807,198
> Adult population in 2019: 8,114,394
> Poverty rate in 2019: 13.3% (14th highest)
2. Louisiana
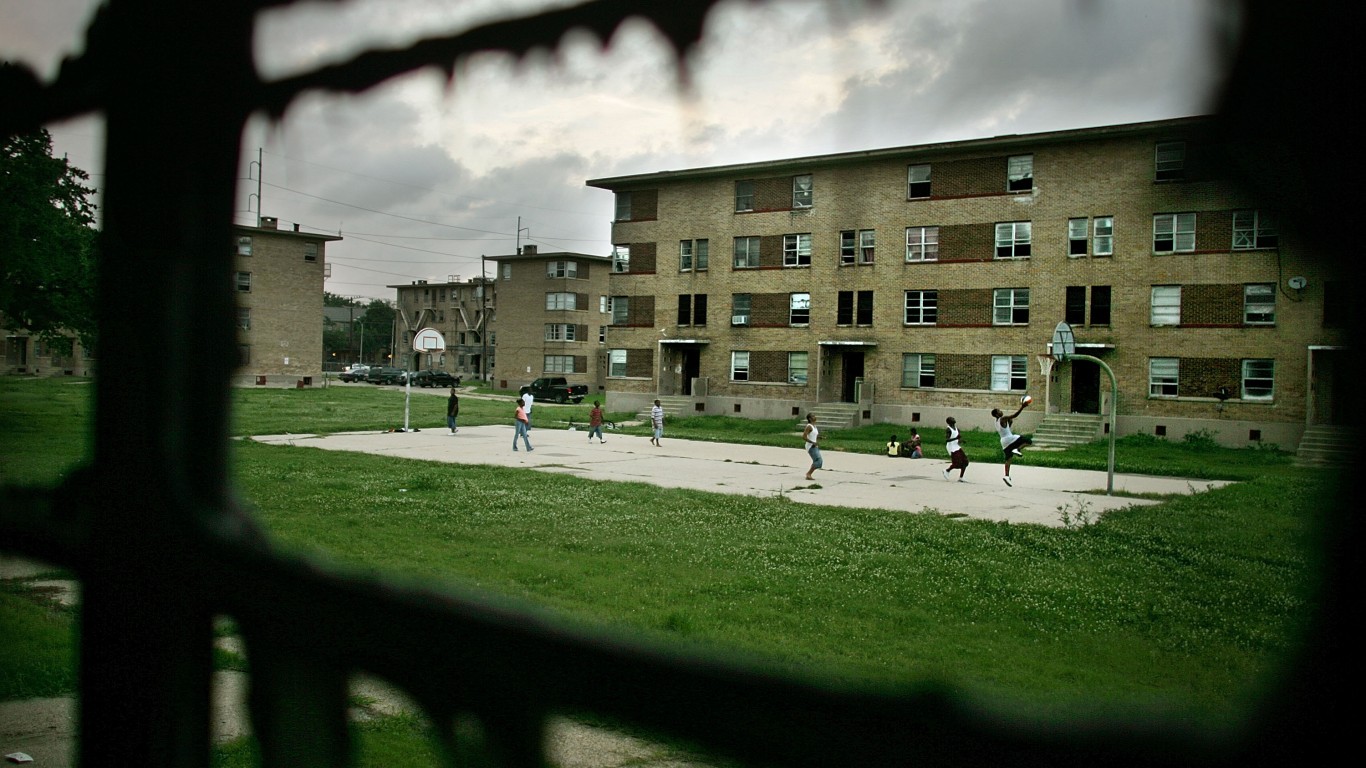
> Adults who did not get enough to eat at the end of Jan: 457,239
> Share of adults who did not get enough to eat: 16.7%
> Household pulse survey sample: 2,744,086
> Adult population in 2019: 3,563,908
> Poverty rate in 2019: 19.0% (2nd highest)
[in-text-ad-2]
1. Kentucky
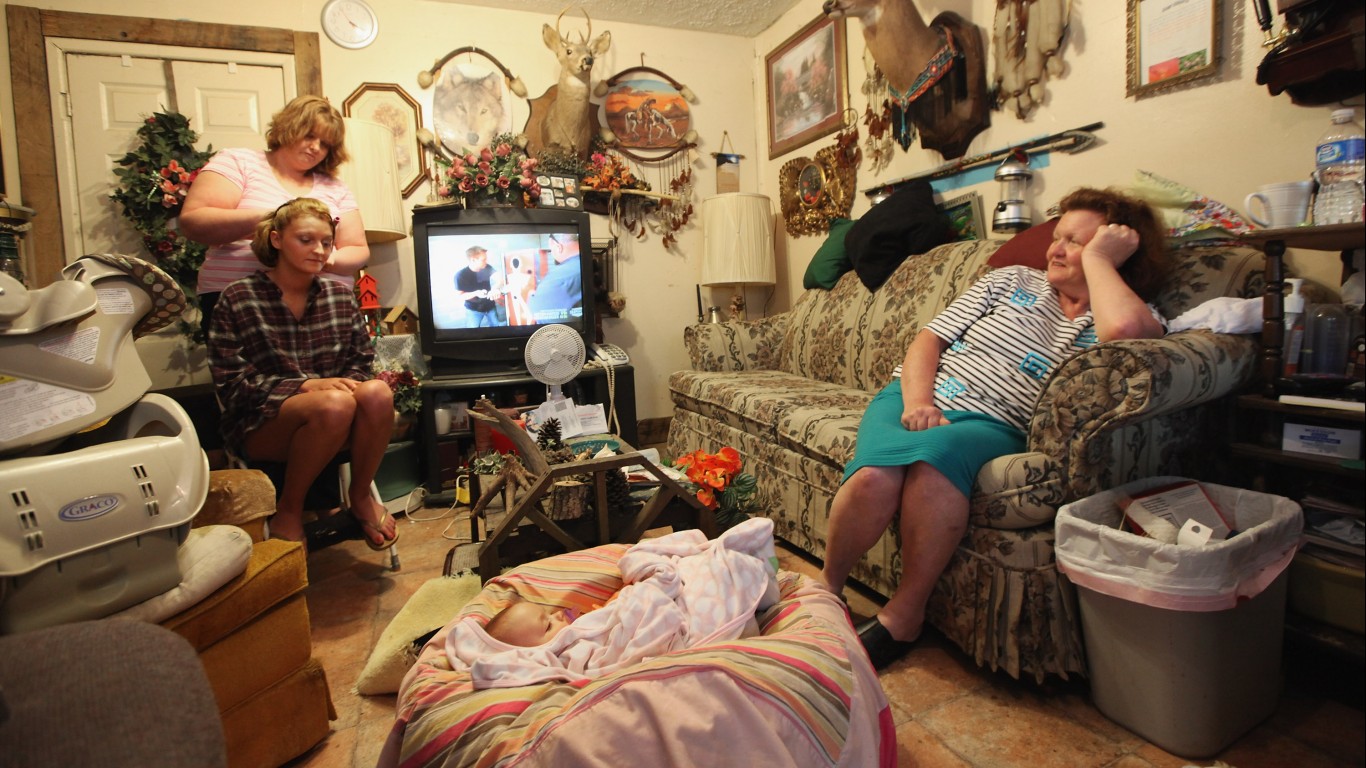
> Adults who did not get enough to eat at the end of Jan: 490,895
> Share of adults who did not get enough to eat: 16.9%
> Household pulse survey sample: 2,901,378
> Adult population in 2019: 3,465,848
> Poverty rate in 2019: 16.3% (4th highest)
Thank you for reading! Have some feedback for us?
Contact the 24/7 Wall St. editorial team.