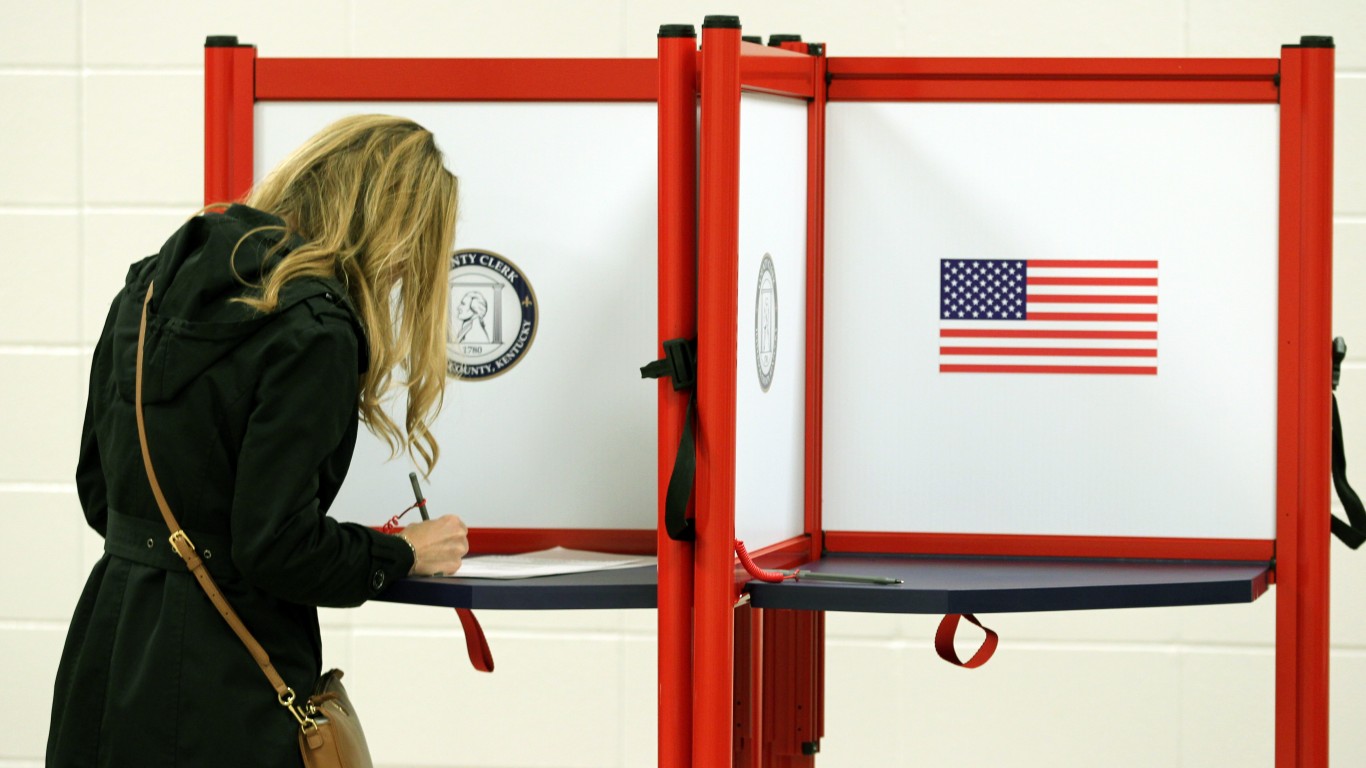
Disturbing and violent events such as the Jan. 6 Capitol insurrection in Washington and the 2017 white supremacist rally in Charlottesville, Va. have heightened public awareness of hate groups across the United States in recent years.
The reluctance of some political leaders to denounce hate groups has seemingly emboldened their members and brought racism and bigotry increasingly out in the open in the social media age. (These are the most segregated cities in America.)
24/7 Wall St. reviewed data from the Southern Poverty Law Center (SPLC), a legal advocacy organization with a focus on civil rights, to identify the states with the fewest hate groups per million people in 2020 and also, for comparison, in 2011. Also noted are each state’s percentage of adult residents who identify as white and each state’s percentage of foreign-born population. It is perhaps hopeful to note that in a dozen of the 20 states listed, the number of such organizations has decreased over the past nine years.
The SPLC defines a hate group as “an organization or collection of individuals that — based on its official statements or principles, the statements of its leaders, or its activities — has beliefs or practices that attack or malign an entire class of people, typically for their immutable characteristics.” These are states with the most hate groups.
Groups such as the Patriotic Front, The Base, Proud Boys, the American Nazi Party, Nation of Islam, Westboro Baptist Church, Soldiers of Odin, Family Research Council, and the National Socialist Movement are a few of the 838 organizations identified as hate groups and tracked across the country by the SPLC in 2020.
Take this ranking with a grain of salt, however. As the SPLC states on its website, “The number is a barometer, albeit only one, of the level of activity in the country.” Many people who aren’t official members of a specific hate group can still hold white nationalist, anti-Semitic, anti-Muslim, neo-Nazi, anti-LGBTQ ,or other extremist views.
Click here to see the states with the fewest hate groups.

20. Maine
> Hate groups in 2020: 2.22 per million people (total: 3)
> Hate groups in 2011: 4.52 per million people (total: 6)
> Adult residents who identify as white: 92.8% — the highest
> Foreign-born population: 3.9% — 6th lowest
[in-text-ad]

19. Minnesota
> Hate groups in 2020: 1.94 per million people (total: 11)
> Hate groups in 2011: 2.24 per million people (total: 12)
> Adult residents who identify as white: 78.9% — 14th highest
> Foreign-born population: 8.4% — 22nd highest
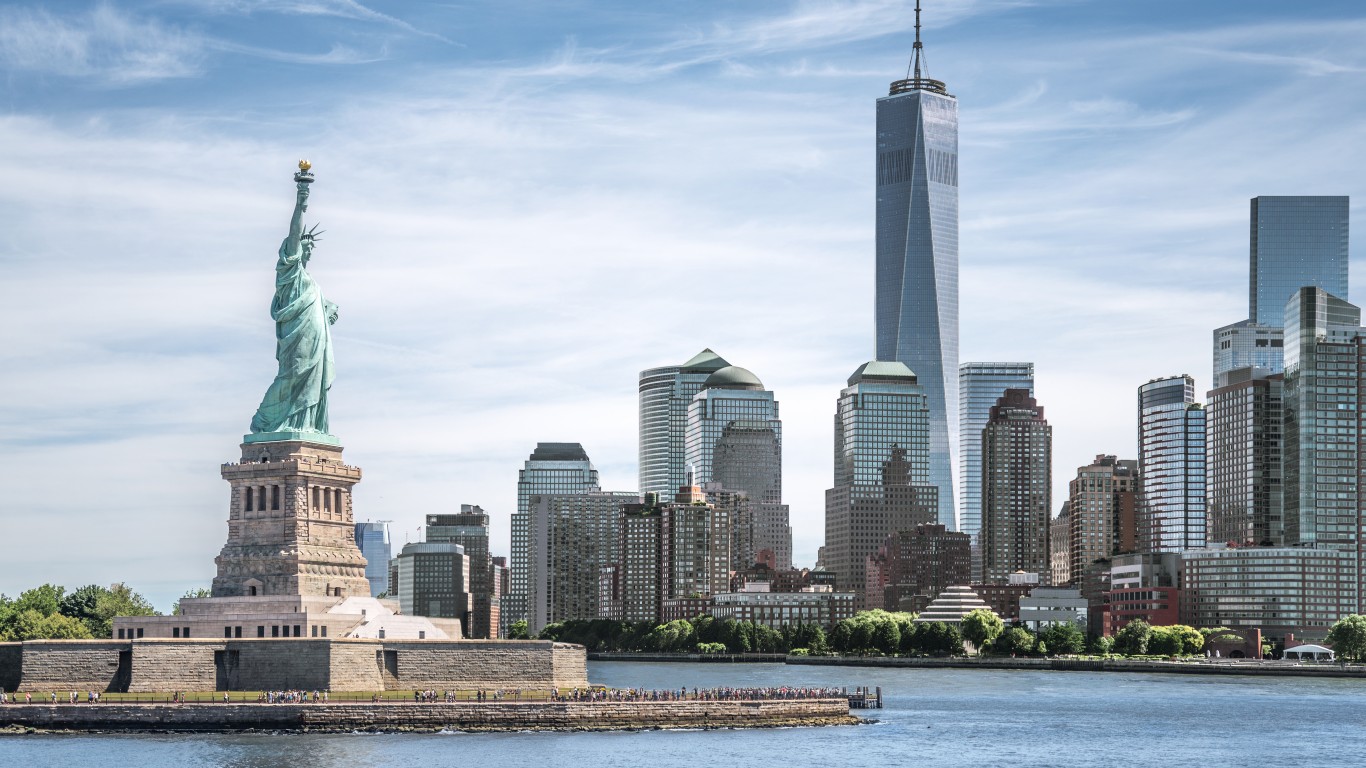
18. New York
> Hate groups in 2020: 1.91 per million people (total: 37)
> Hate groups in 2011: 1.90 per million people (total: 37)
> Adult residents who identify as white: 55.1% — 11th lowest
> Foreign-born population: 22.4% — 3rd highest

17. Rhode Island
> Hate groups in 2020: 1.89 per million people (total: 2)
> Hate groups in 2011: 0.95 per million people (total: 1)
> Adult residents who identify as white: 70.8% — 25th highest
> Foreign-born population: 13.7% — 13th highest
[in-text-ad-2]

16. Texas
> Hate groups in 2020: 1.84 per million people (total: 54)
> Hate groups in 2011: 1.75 per million people (total: 45)
> Adult residents who identify as white: 41.1% — 4th lowest
> Foreign-born population: 17.1% — 8th highest

15. California
> Hate groups in 2020: 1.83 per million people (total: 72)
> Hate groups in 2011: 2.23 per million people (total: 84)
> Adult residents who identify as white: 36.3% — 2nd lowest
> Foreign-born population: 26.7% — the highest
[in-text-ad]

14. New Jersey
> Hate groups in 2020: 1.80 per million people (total: 16)
> Hate groups in 2011: 5.32 per million people (total: 47)
> Adult residents who identify as white: 54.3% — 10th lowest
> Foreign-born population: 23.4% — 2nd highest

13. Ohio
> Hate groups in 2020: 1.80 per million people (total: 21)
> Hate groups in 2011: 2.77 per million people (total: 32)
> Adult residents who identify as white: 78.3% — 16th highest
> Foreign-born population: 4.8% — 13th lowest

12. Massachusetts
> Hate groups in 2020: 1.74 per million people (total: 12)
> Hate groups in 2011: 1.51 per million people (total: 10)
> Adult residents who identify as white: 70.3% — 25th lowest
> Foreign-born population: 17.3% — 7th highest
[in-text-ad-2]

11. Wyoming
> Hate groups in 2020: 1.72 per million people (total: 1)
> Hate groups in 2011: 3.52 per million people (total: 2)
> Adult residents who identify as white: 83.7% — 8th highest
> Foreign-born population: 3.1% — 4th lowest

10. Connecticut
> Hate groups in 2020: 1.69 per million people (total: 6)
> Hate groups in 2011: 1.39 per million people (total: 5)
> Adult residents who identify as white: 65.6% — 22nd lowest
> Foreign-born population: 14.8% — 11th highest
[in-text-ad]

9. Vermont
> Hate groups in 2020: 1.60 per million people (total: 1)
> Hate groups in 2011: 1.59 per million people (total: 1)
> Adult residents who identify as white: 92.5% — 2nd highest
> Foreign-born population: 4.7% — 12th lowest

8. Illinois
> Hate groups in 2020: 1.51 per million people (total: 19)
> Hate groups in 2011: 2.18 per million people (total: 28)
> Adult residents who identify as white: 60.7% — 15th lowest
> Foreign-born population: 13.9% — 12th highest

7. Alaska
> Hate groups in 2020: 1.37 per million people (total: 1)
> Hate groups in 2011: 1.38 per million people (total: 1)
> Adult residents who identify as white: 59.8% — 14th lowest
> Foreign-born population: 8.0% — 24th highest
[in-text-ad-2]

6. North Dakota
> Hate groups in 2020: 1.31 per million people (total: 1)
> Hate groups in 2011: 4.38 per million people (total: 3)
> Adult residents who identify as white: 83.6% — 9th highest
> Foreign-born population: 4.1% — 8th lowest

5. Utah
> Hate groups in 2020: 1.23 per million people (total: 4)
> Hate groups in 2011: 1.42 per million people (total: 4)
> Adult residents who identify as white: 77.7% — 18th highest
> Foreign-born population: 8.6% — 21st highest
[in-text-ad]
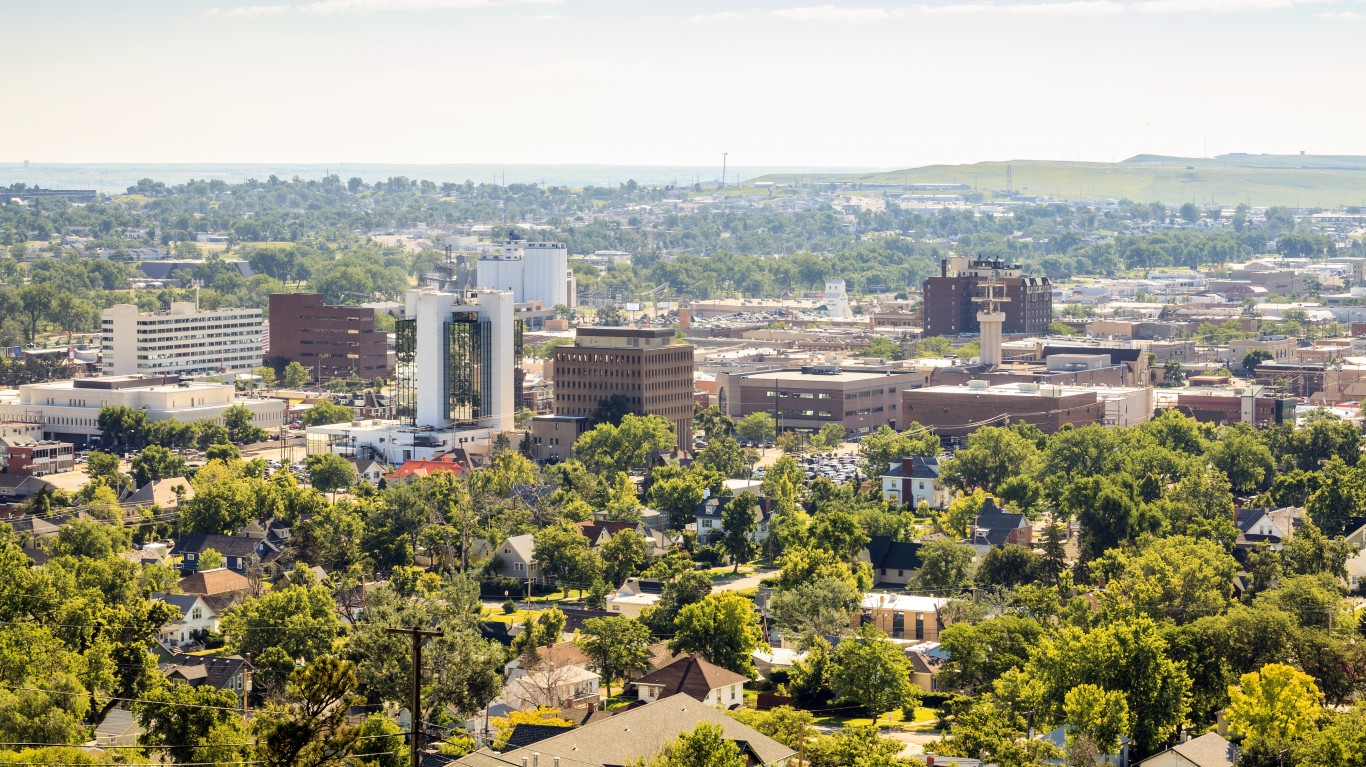
4. South Dakota
> Hate groups in 2020: 1.12 per million people (total: 1)
> Hate groups in 2011: 3.64 per million people (total: 3)
> Adult residents who identify as white: 81.5% — 11th highest
> Foreign-born population: 4.1% — 8th lowest

3. Iowa
> Hate groups in 2020: 0.95 per million people (total: 3)
> Hate groups in 2011: 1.30 per million people (total: 4)
> Adult residents who identify as white: 85.1% — 6th highest
> Foreign-born population: 5.6% — 19th lowest

2. Kansas
> Hate groups in 2020: 0.69 per million people (total: 2)
> Hate groups in 2011: 1.05 per million people (total: 3)
> Adult residents who identify as white: 75.4% — 20th highest
> Foreign-born population: 7.2% — 25th lowest
[in-text-ad-2]

1. New Mexico
> Hate groups in 2020: 0.47 per million people (total: 1)
> Hate groups in 2011: 1.92 per million people (total: 4)
> Adult residents who identify as white: 36.8% — 3rd lowest
> Foreign-born population: 9.6% — 19th highest
Get Ready To Retire (Sponsored)
Start by taking a quick retirement quiz from SmartAsset that will match you with up to 3 financial advisors that serve your area and beyond in 5 minutes, or less.
Each advisor has been vetted by SmartAsset and is held to a fiduciary standard to act in your best interests.
Here’s how it works:
1. Answer SmartAsset advisor match quiz
2. Review your pre-screened matches at your leisure. Check out the advisors’ profiles.
3. Speak with advisors at no cost to you. Have an introductory call on the phone or introduction in person and choose whom to work with in the future
Thank you for reading! Have some feedback for us?
Contact the 24/7 Wall St. editorial team.
 24/7 Wall St.
 24/7 Wall St.
