Last year, car sales in the United States were battered from March well into the late fall because of the COVID-19 pandemic. People stayed away from dealerships, because of both the disease and the financial uncertainty and unsettled job market. Toward the end of 2020, sales started to return to “normal,” particularly for some brands and models.
Demand for cars by brand and model varies widely. Manufacturers and dealers constantly work to balance inventory.
One primary measure of inventory is the average number of days it takes to sell an individual car once it reaches the dealer. Usually, this is 40 to 50 days. This means dealers have enough cars in inventory to meet customer demand, but not so may as to strain their physical facilities and raise their expenses.
The auto industry is headed toward a major inventory problem. Chips used to make many vehicles are in short supply. The problem is so acute some car companies expect their earnings to be undermined. Car & Driver recently reported:
The first signs of a semiconductor shortage appeared late last year, and now, a month and a half into 2021, the scope of the impacts is coming into view. Plants across North America are seeing production schedules adjusted to properly allocate the limited number of microchips—which are made up of semiconductors—reaching automotive assembly plants.
However, this is an unusual cause for inventory problems. Cars may well catch the public’s attention and sales spike higher than the manufacturer expected. Alternatively, special discounts on an individual car can pull people to dealers. Then dealers are left with unhappy potential customers. Manufacturers are left to decide if they should change factory production.
On the other hand, some cars have so little demand that dealers cannot clear their lots of them. These dealers are stuck with vehicles that they bought from manufacturers, only to see them sit in inventory for months, or as much as half a year.
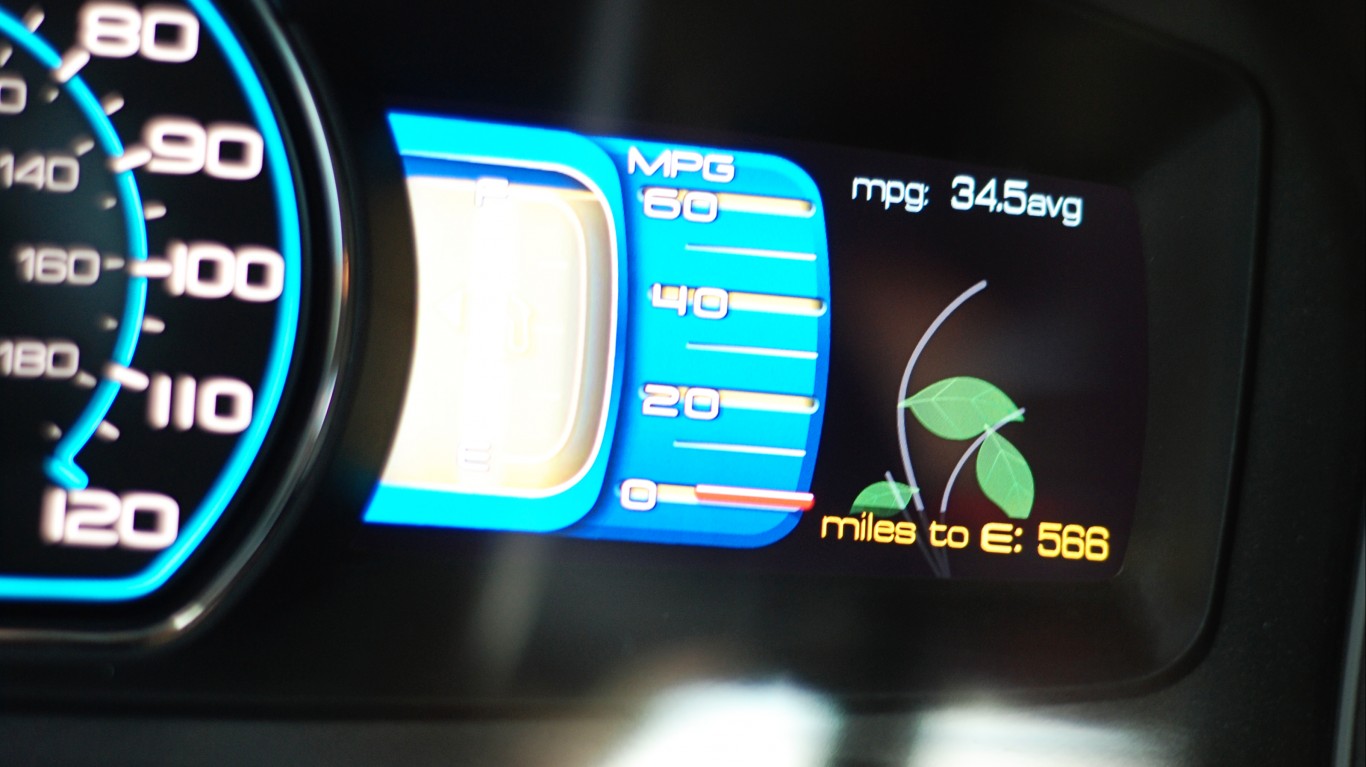
iSeeCars keeps monthly data on “days to sell” by vehicle as a means to determine the balance of supply and demand. The average number of days to sell across the industry in January was 46, which is within the normal range. Among the fastest selling cars in America, it was as low as 10 days. However, the days to sell figure for a Ford Fusion Hybrid was 179.
The Ford Fusion is a sedan built and sold by a company that is trying to exit the car business in the United States and move much more into the sport utility vehicle, crossover and pickup markets. The Fusion was one of these holdovers. In fact, the regular version of the Fusion was the vehicle with the second most days to sell at 157. Several other vehicles on the list were also small sedans.
Quarterly sales figures came from goodcarbadcar.net. In a few cases, the listed sales figures are for a larger segment of the model’s sales. For example, listed sales for the Toyota RAV4 Hybrid are for the entire RAV4 series.
Click here to see the slowest selling new car.
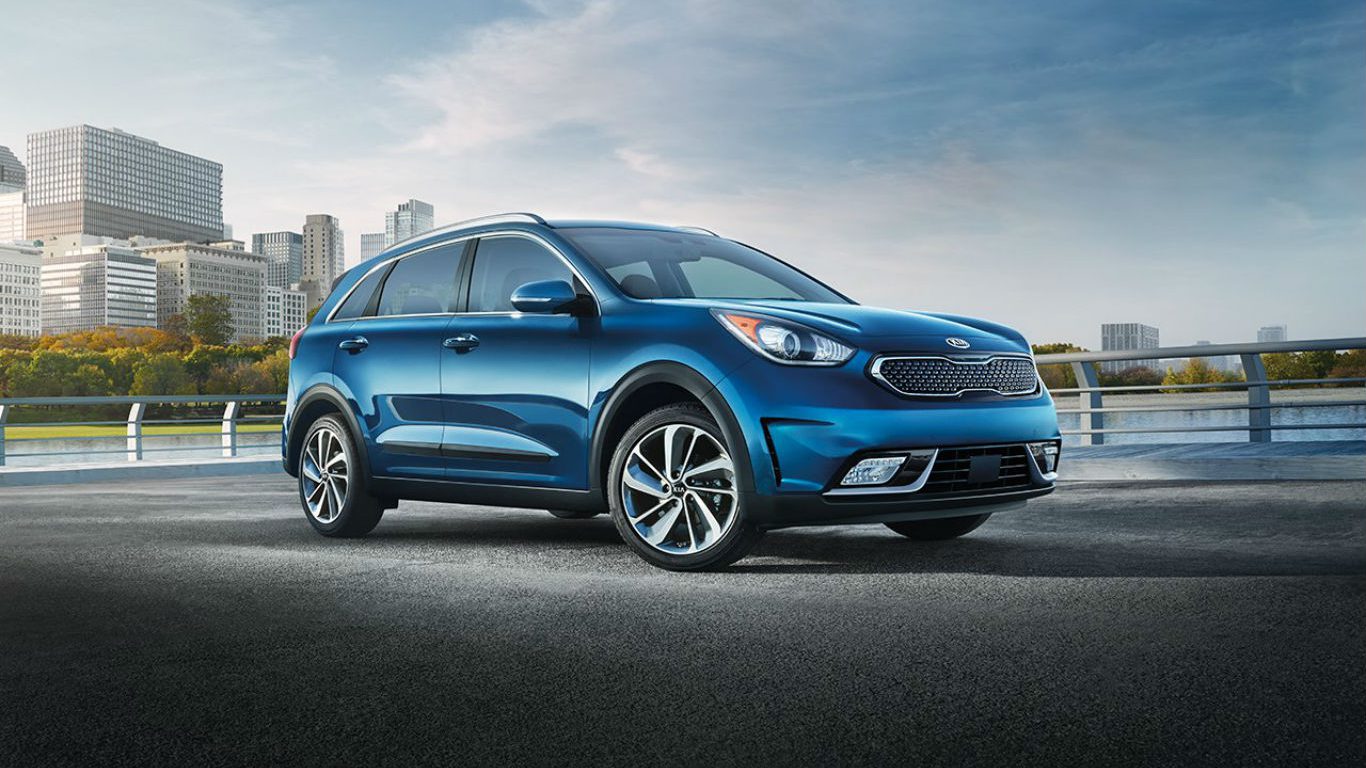
20. Kia Niro
> Avg. days to sell: 76.1
> Avg. price: $26,204
> 2019 Q4 U.S. sales: 6,459
> 2020 Q4 U.S. sales: 4,202
> Year-over-year sales change: -34.9%
[in-text-ad]
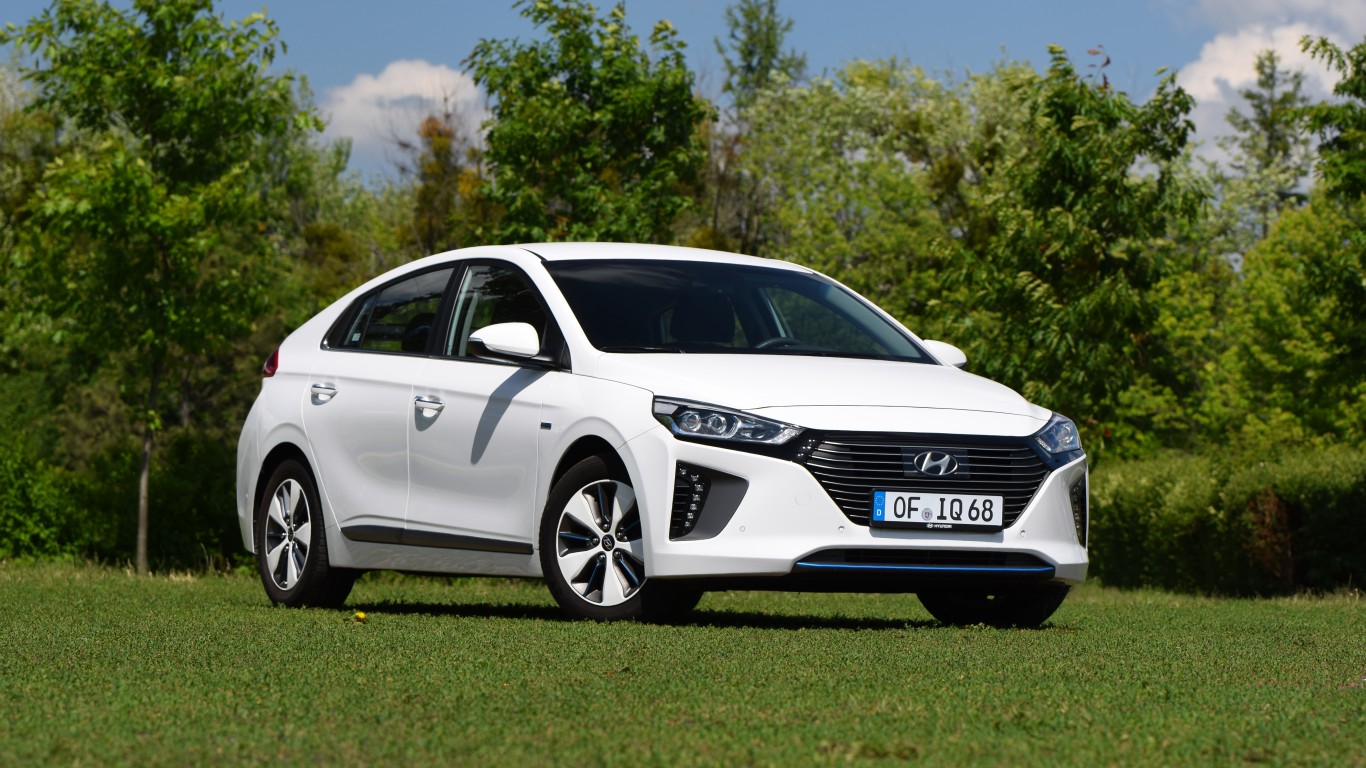
19. Hyundai Ioniq Hybrid
> Avg. days to sell: 77.7
> Avg. price: $25,749
> 2019 Q4 U.S. sales: 5,428
> 2020 Q4 U.S. sales: 4,331
> Year-over-year sales change: -20.2%
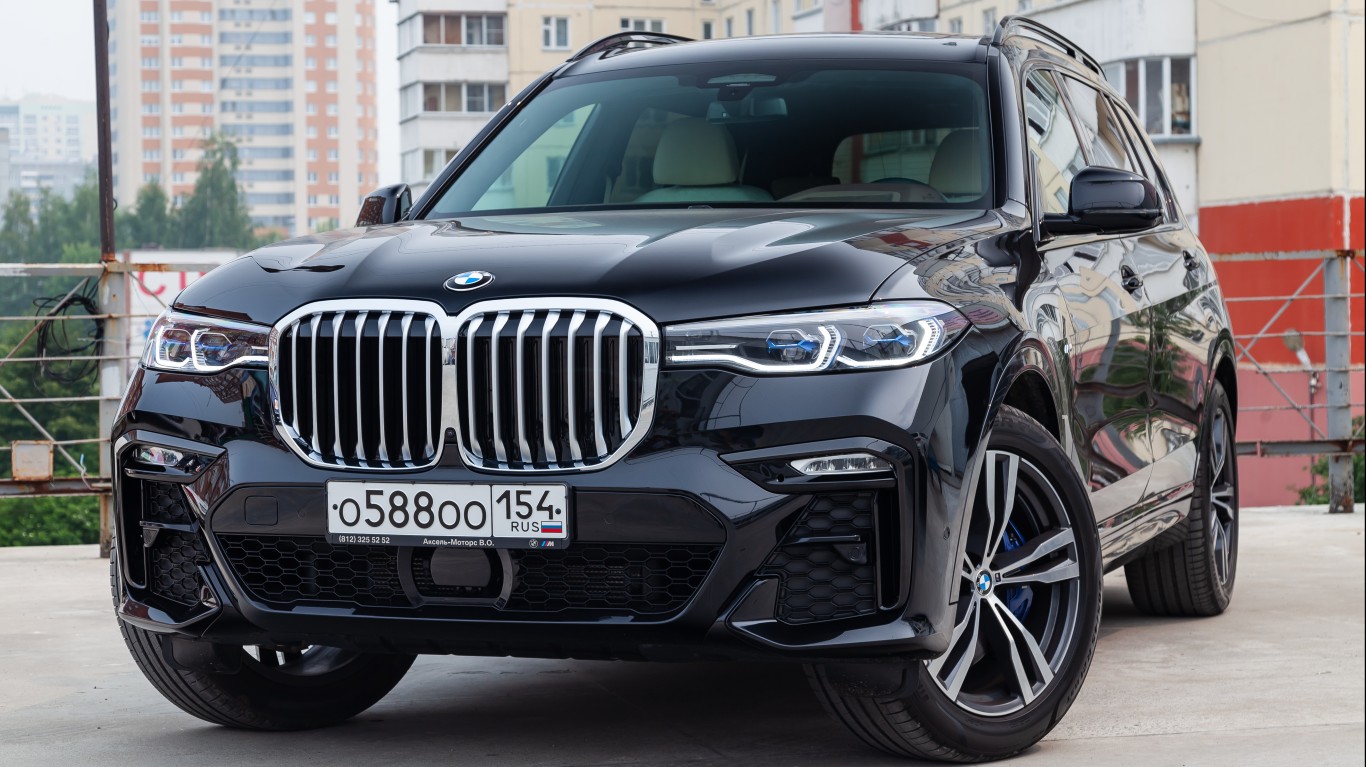
18. BMW X7
> Avg. days to sell: 80.0
> Avg. price: $90,455
> 2019 Q4 U.S. sales: 7,820
> 2020 Q4 U.S. sales: 7,044
> Year-over-year sales change: -9.9%
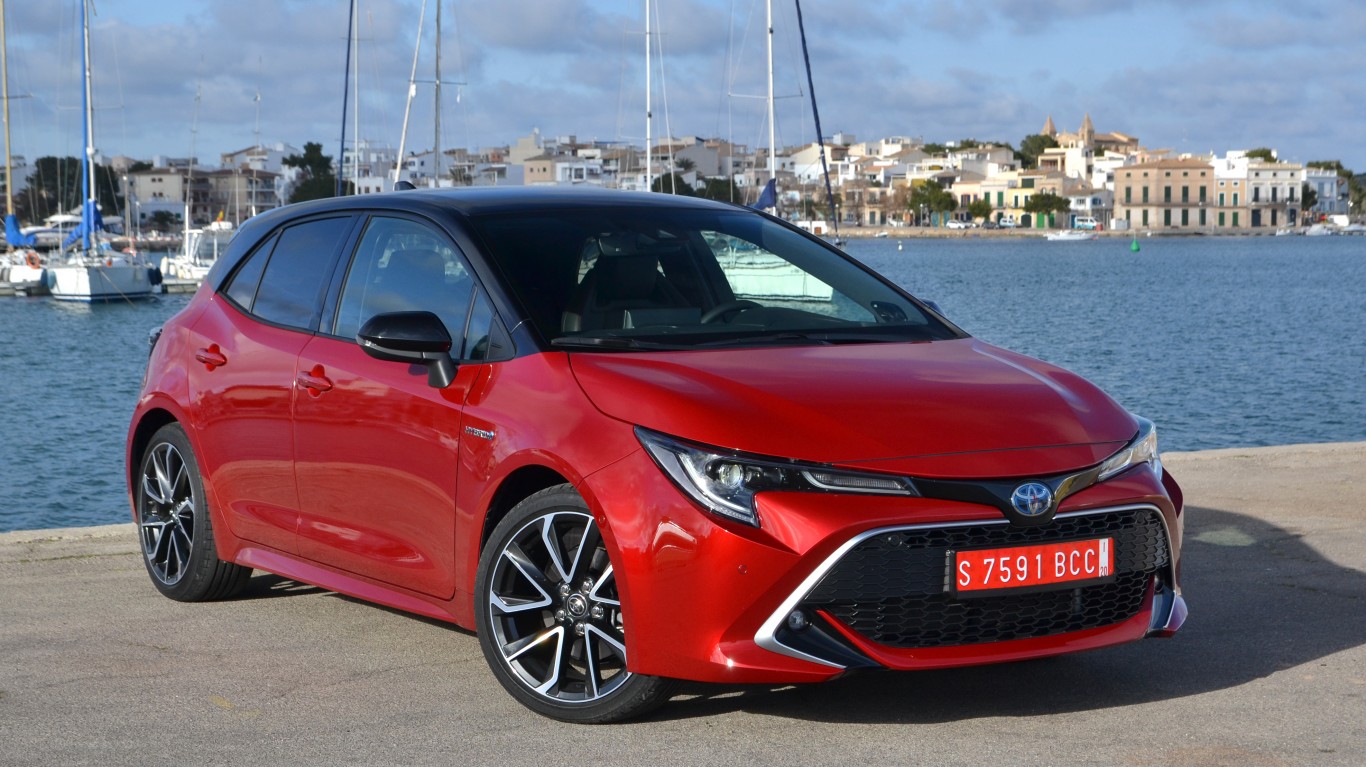
17. Toyota Corolla Hybrid
> Avg. days to sell: 80.2
> Avg. price: $24,149
> 2019 Q4 U.S. sales: 70,872
> 2020 Q4 U.S. sales: 70,965
> Year-over-year sales change: +0.1%
[in-text-ad-2]
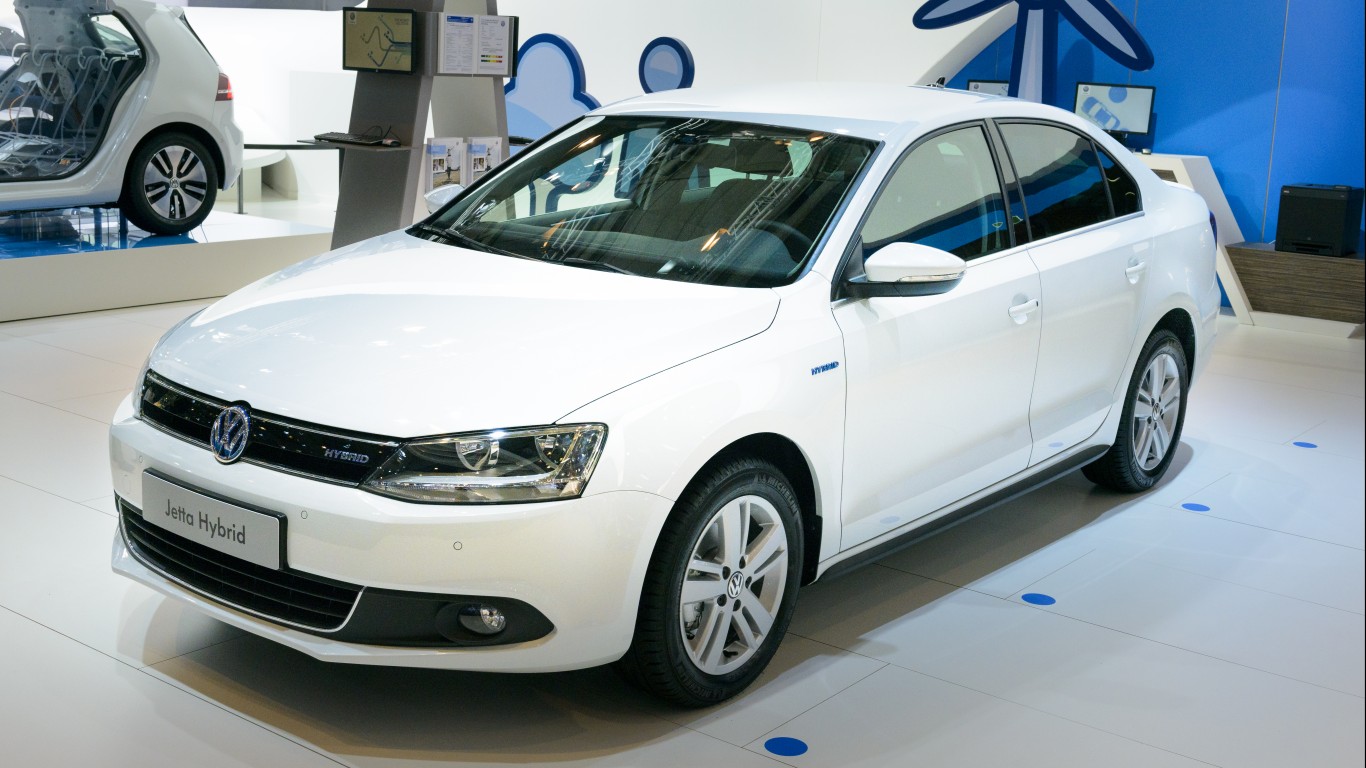
16. Volkswagen Jetta
> Avg. days to sell: 81.9
> Avg. price: $21,582
> 2019 Q4 U.S. sales: 25,712
> 2020 Q4 U.S. sales: 25,182
> Year-over-year sales change: -2.1%

15. Nissan Leaf
> Avg. days to sell: 82.8
> Avg. price: $35,579
> 2019 Q4 U.S. sales: 3,254
> 2020 Q4 U.S. sales: 4,635
> Year-over-year sales change: +42.4%
[in-text-ad]
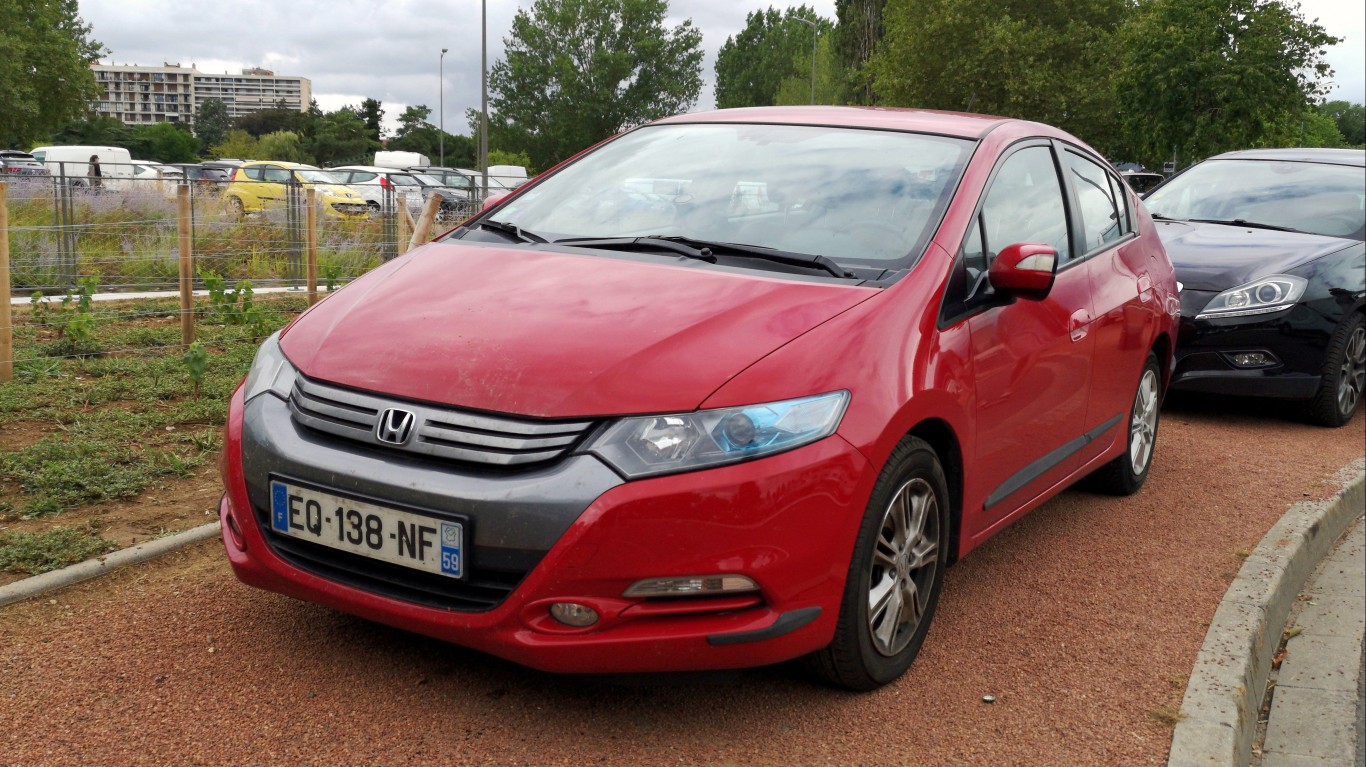
14. Honda Insight
> Avg. days to sell: 83.6
> Avg. price: $26,530
> 2019 Q4 U.S. sales: 4,902
> 2020 Q4 U.S. sales: 3,688
> Year-over-year sales change: -24.8%
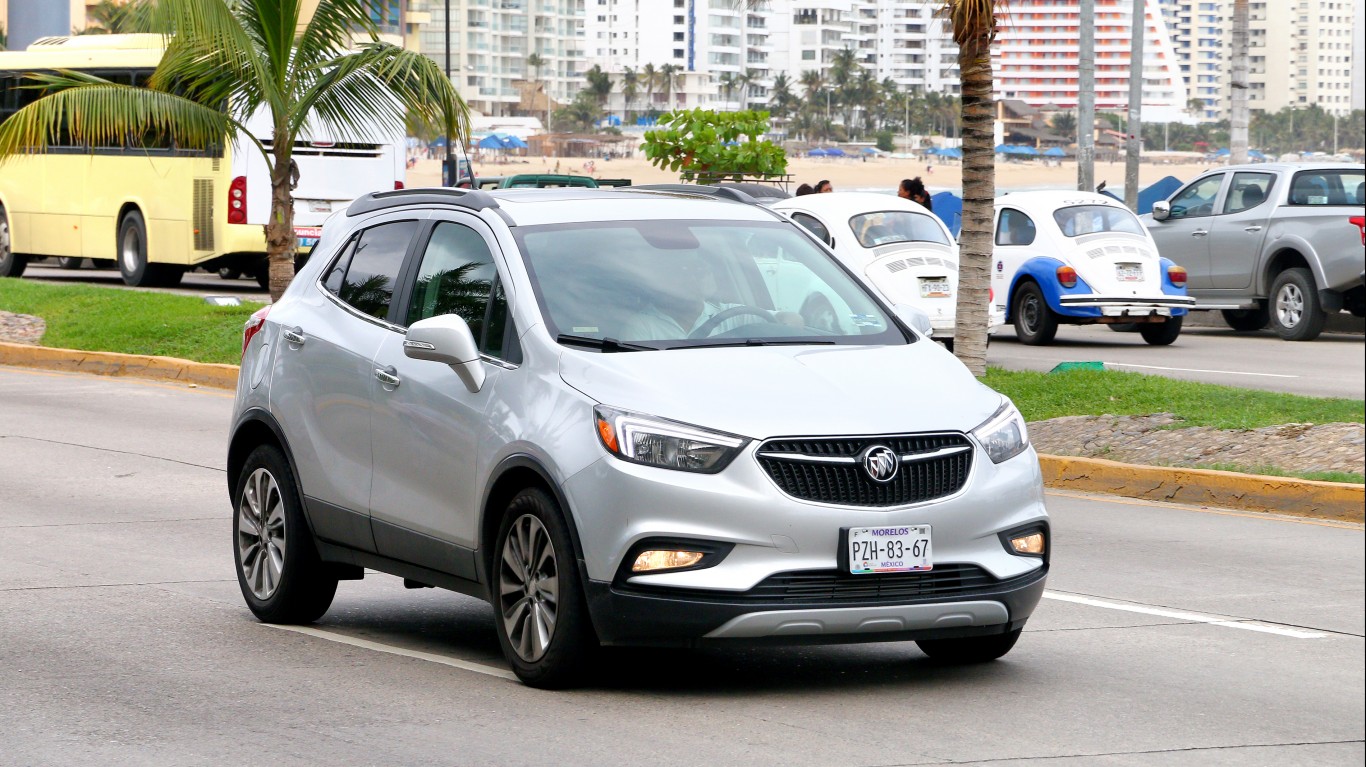
13. Buick Encore
> Avg. days to sell: 85.5
> Avg. price: $23,715
> 2019 Q4 U.S. sales: 28,497
> 2020 Q4 U.S. sales: 6,338
> Year-over-year sales change: -77.8%
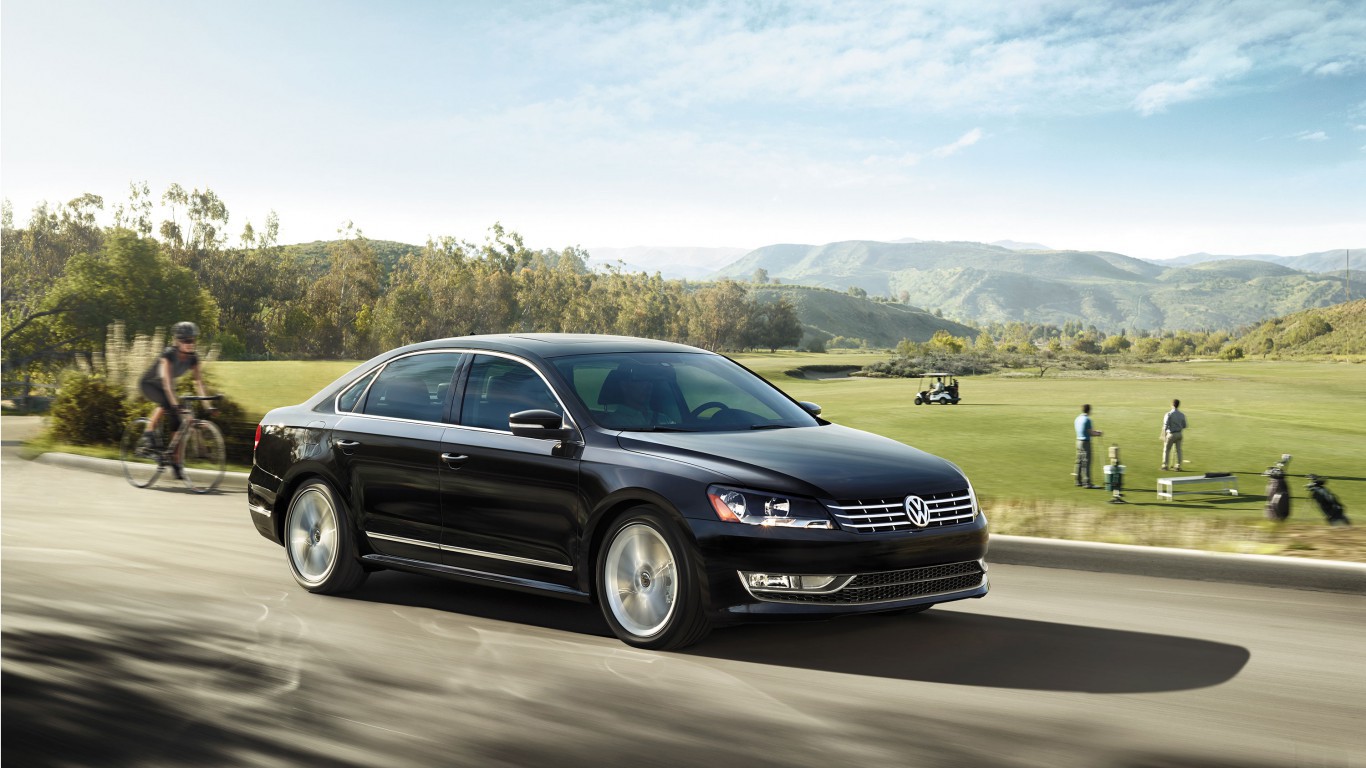
12. Volkswagen Passat
> Avg. days to sell: 91.8
> Avg. price: $25,183
> 2019 Q4 U.S. sales: 1,153
> 2020 Q4 U.S. sales: 6,774
> Year-over-year sales change: +487.5%
[in-text-ad-2]
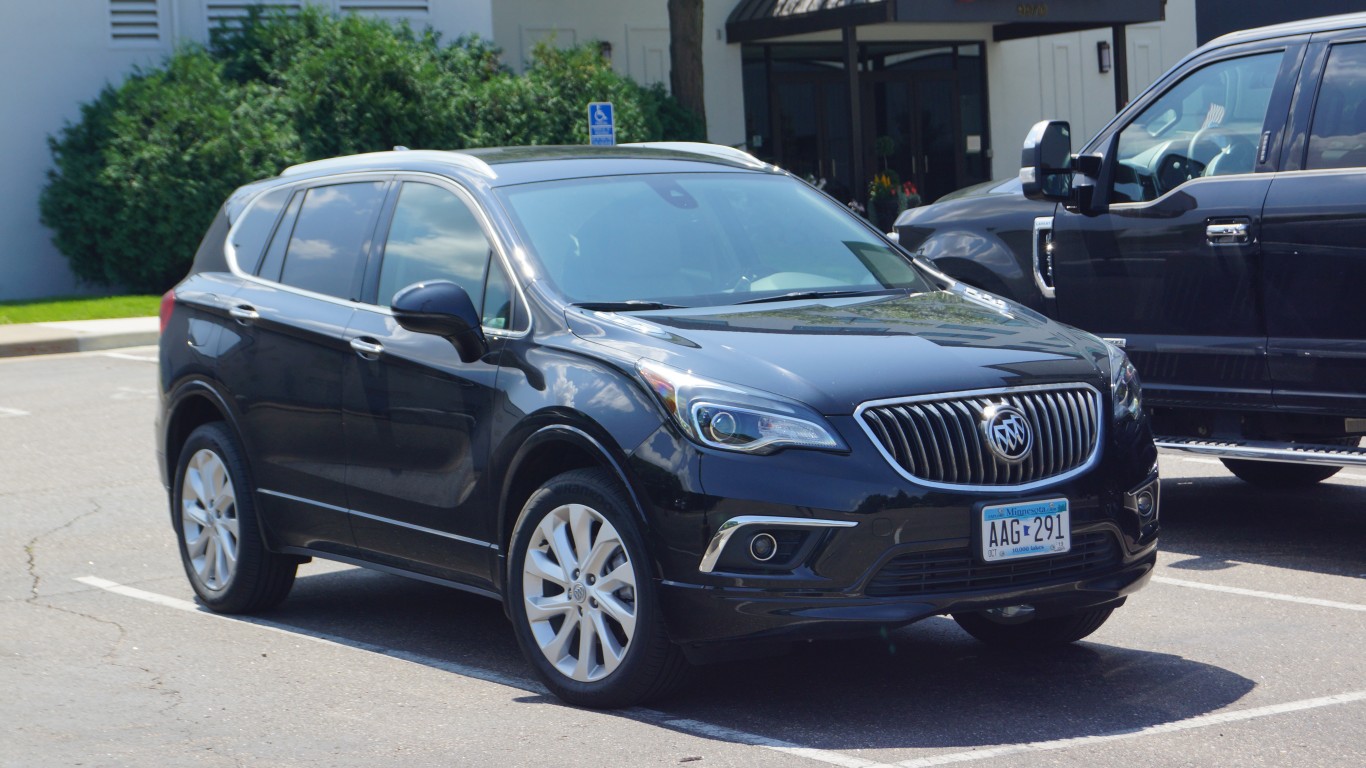
11. Buick Envision
> Avg. days to sell: 94.4
> Avg. price: $34,684
> 2019 Q4 U.S. sales: 8,380
> 2020 Q4 U.S. sales: 8,474
> Year-over-year sales change: +1.1%
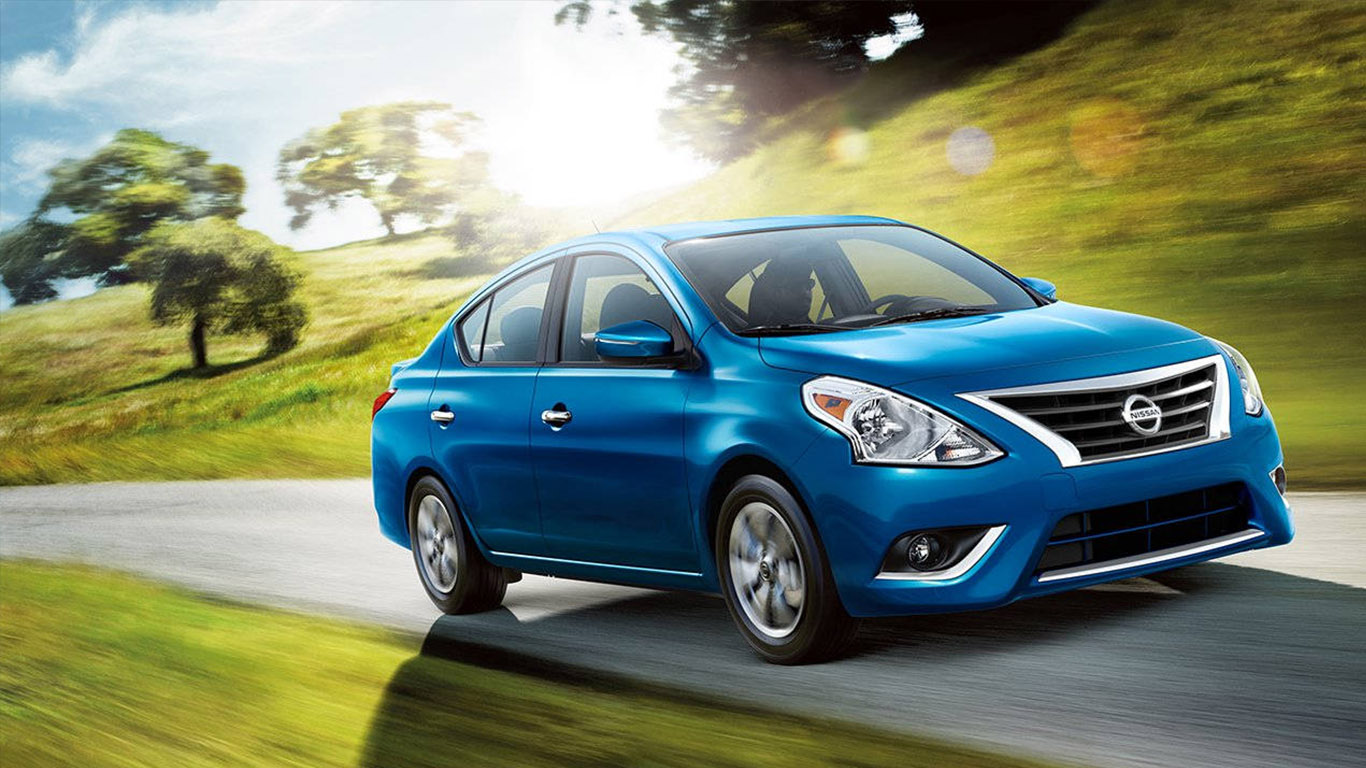
10. Nissan Versa
> Avg. days to sell: 94.4
> Avg. price: $17,203
> 2019 Q4 U.S. sales: 9,463
> 2020 Q4 U.S. sales: 17,964
> Year-over-year sales change: +89.8%
[in-text-ad]
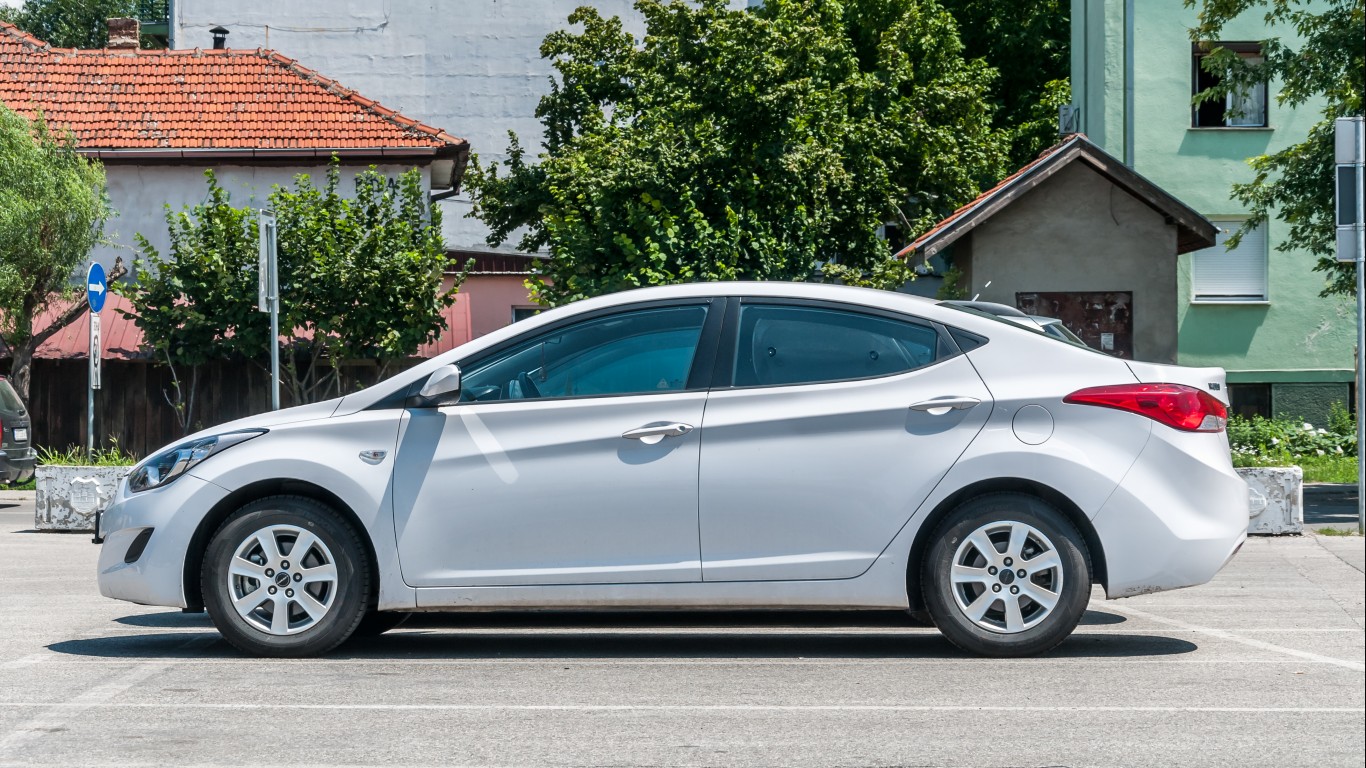
9. Hyundai Elantra GT
> Avg. days to sell: 94.9
> Avg. price: $21,820
> 2019 Q4 U.S. sales: 49,625
> 2020 Q4 U.S. sales: 30,372
> Year-over-year sales change: -38.8%
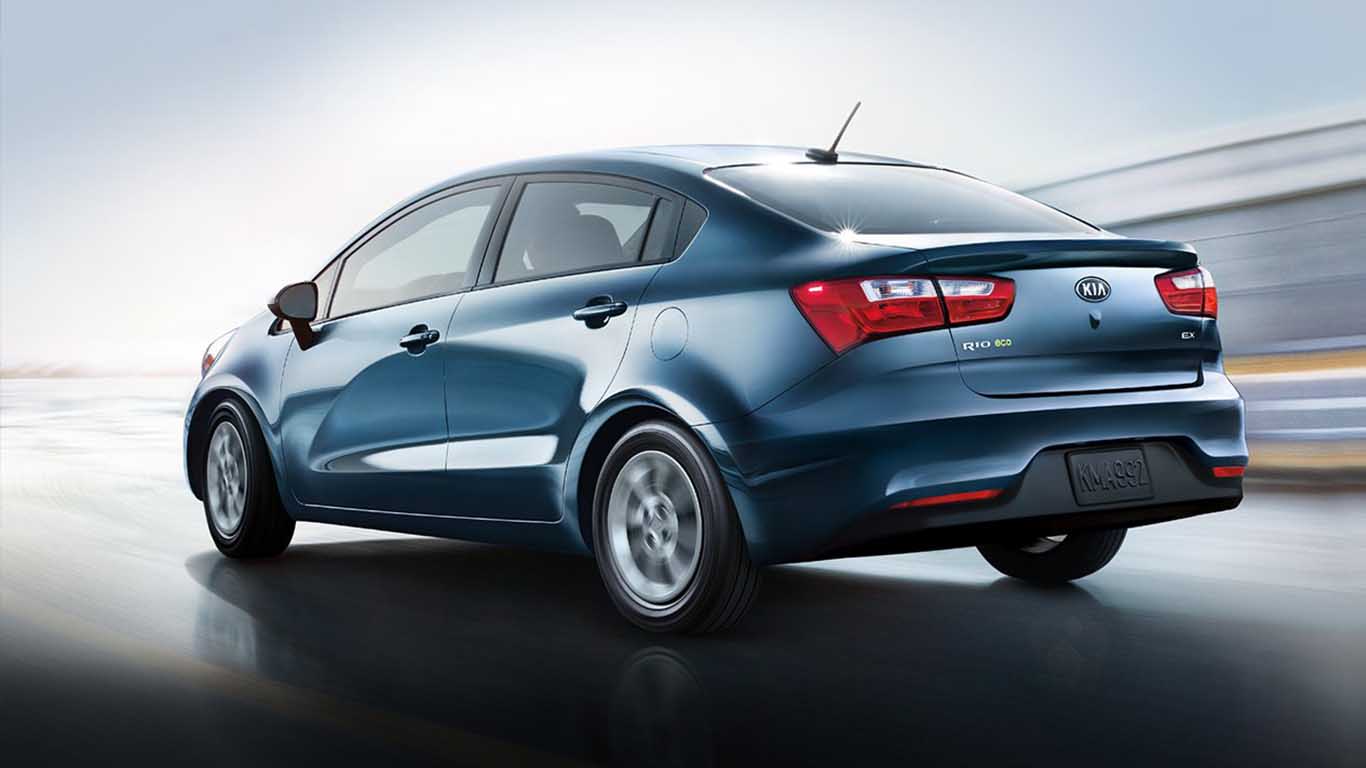
8. Kia Rio
> Avg. days to sell: 96.5
> Avg. price: $15,918
> 2019 Q4 U.S. sales: 5,323
> 2020 Q4 U.S. sales: 5,884
> Year-over-year sales change: +10.5%
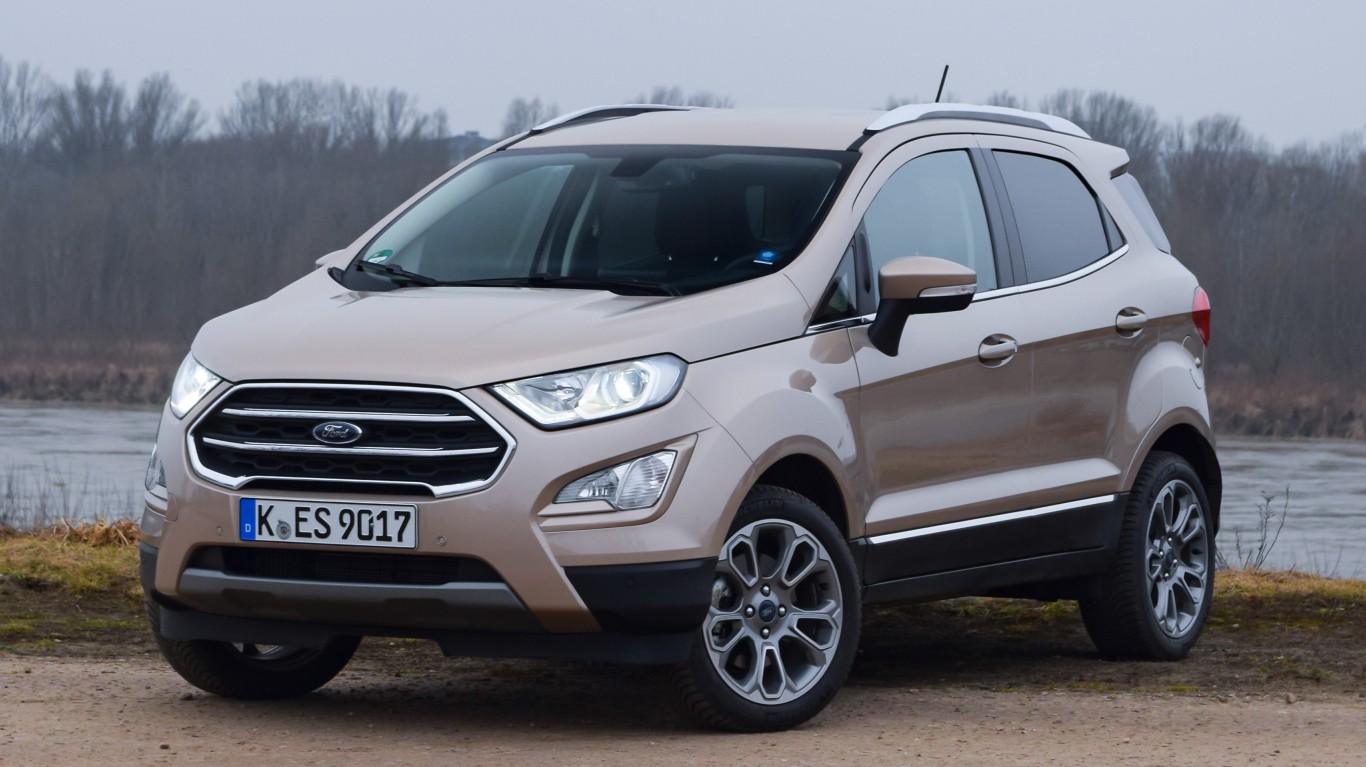
7. Ford EcoSport
> Avg. days to sell: 96.7
> Avg. price: $22,023
> 2019 Q4 U.S. sales: 14,051
> 2020 Q4 U.S. sales: 13,345
> Year-over-year sales change: -5.0%
[in-text-ad-2]
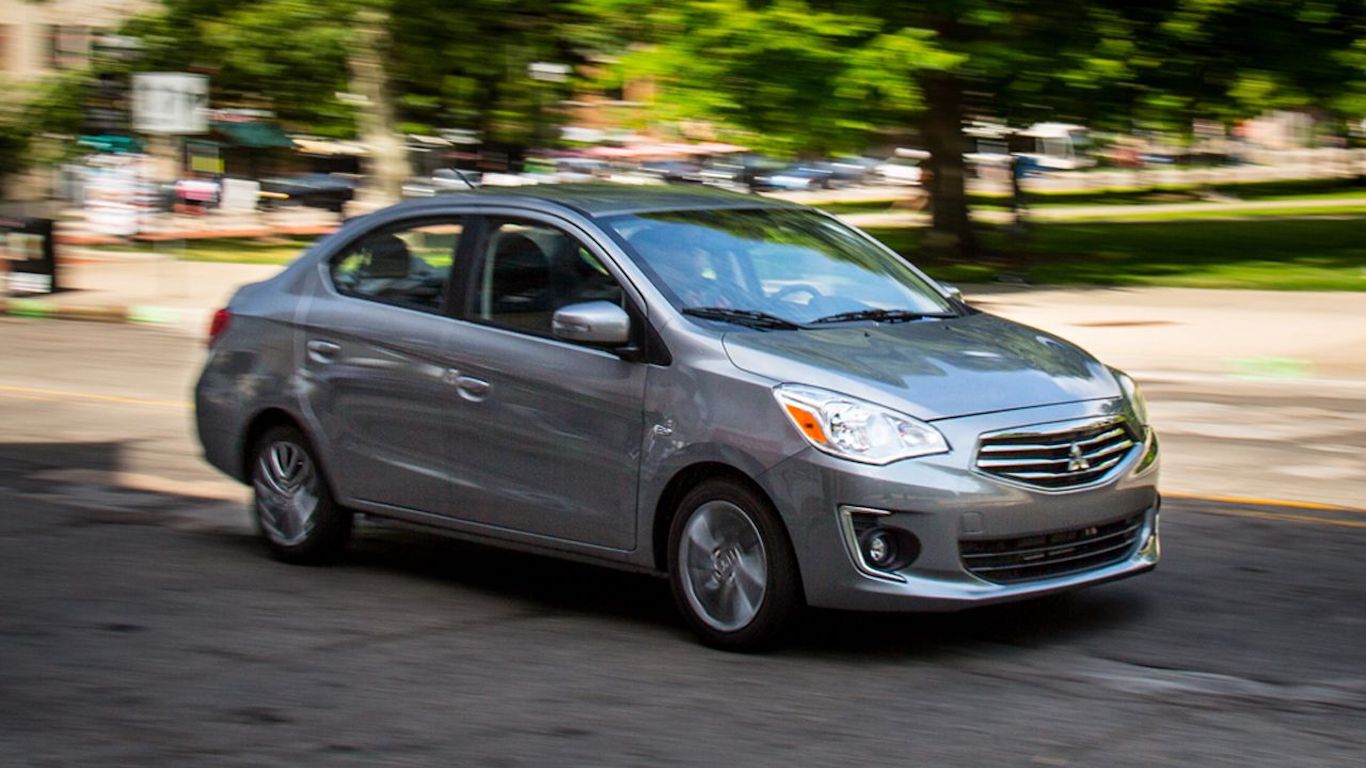
6. Mitsubishi Mirage G4
> Avg. days to sell: 97.1
> Avg. price: $16,210
> 2019 Q4 U.S. sales: 5,789
> 2020 Q4 U.S. sales: 4,844
> Year-over-year sales change: -16.3%
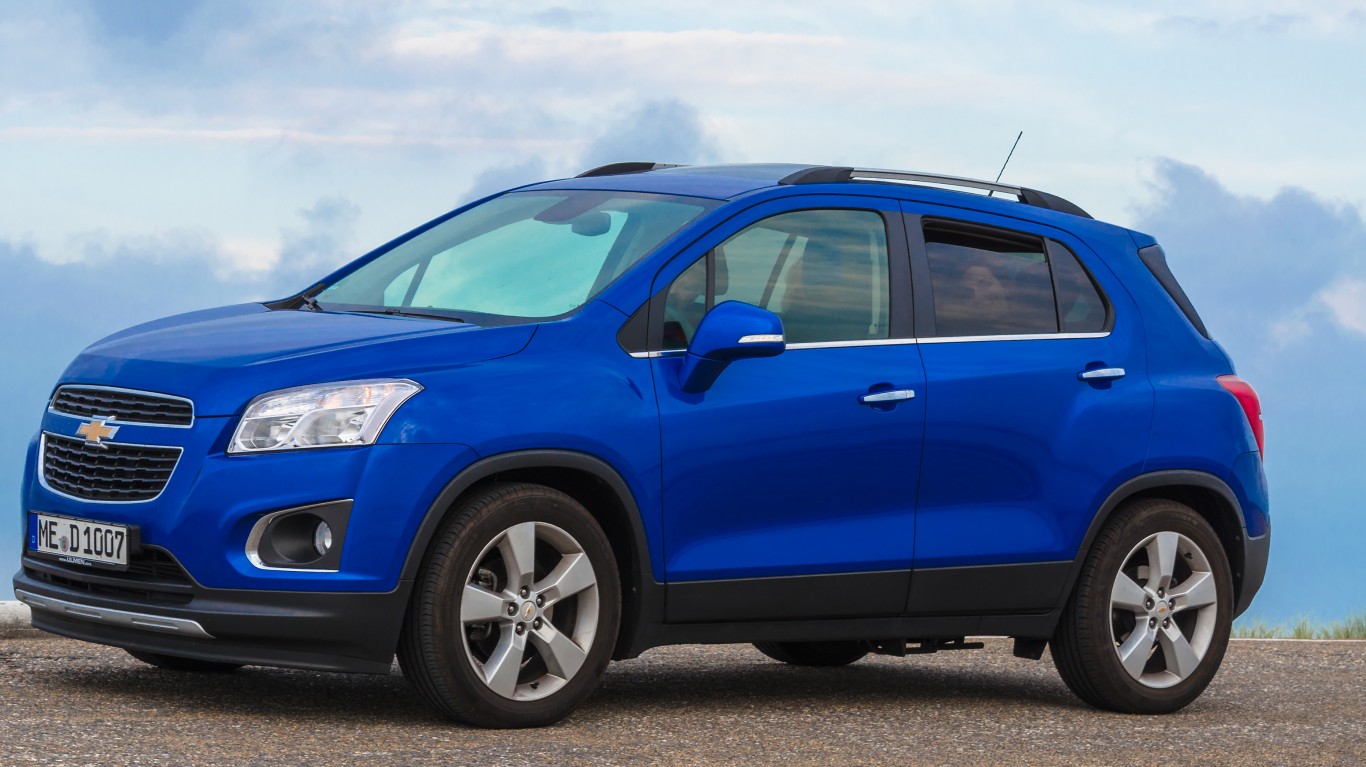
5. Chevrolet Trax
> Avg. days to sell: 102.1
> Avg. price: $21,499
> 2019 Q4 U.S. sales: 33,039
> 2020 Q4 U.S. sales: 26,106
> Year-over-year sales change: -21.0%
[in-text-ad]
4. Kia Sedona
> Avg. days to sell: 102.9
> Avg. price: $32,039
> 2019 Q4 U.S. sales: 4,267
> 2020 Q4 U.S. sales: 3,059
> Year-over-year sales change: -28.3%
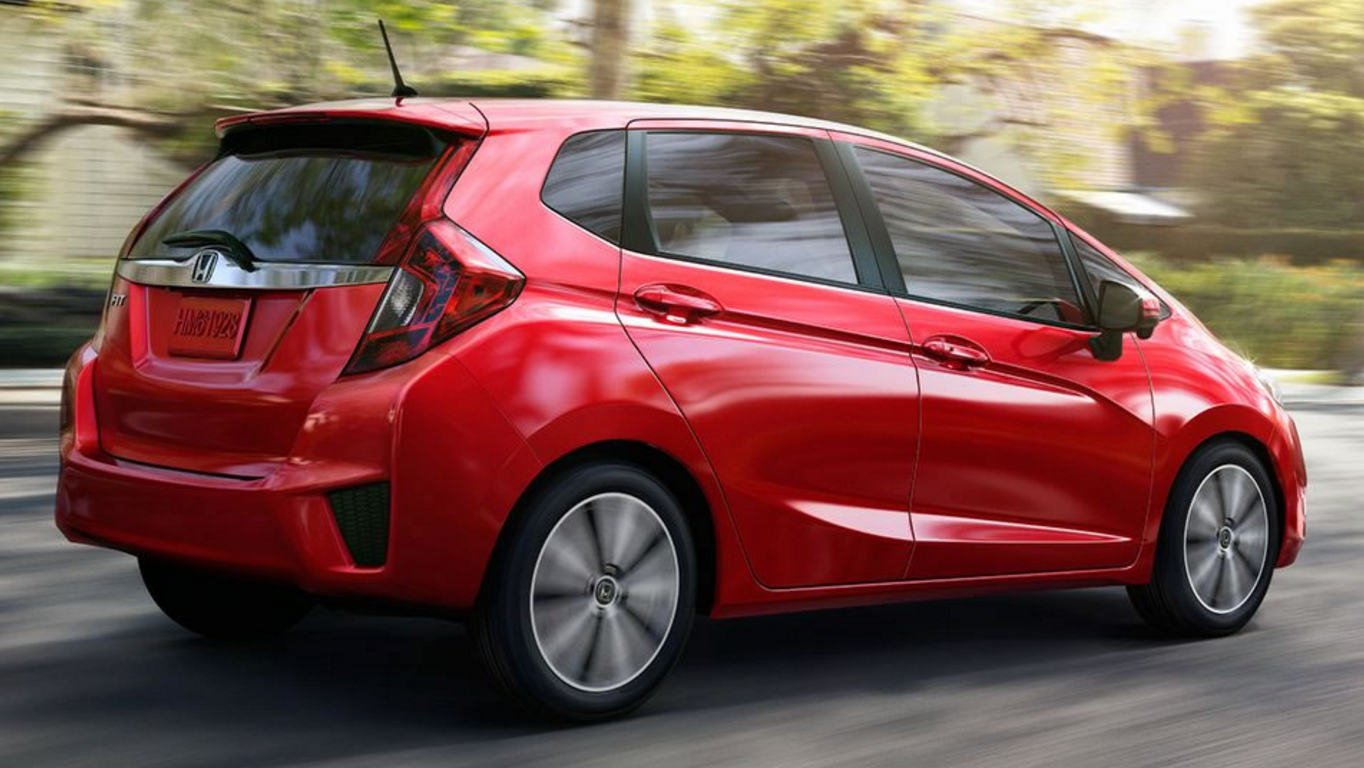
3. Honda Fit
> Avg. days to sell: 113.1
> Avg. price: $18,680
> 2019 Q4 U.S. sales: 8,146
> 2020 Q4 U.S. sales: 8,100
> Year-over-year sales change: -0.6%
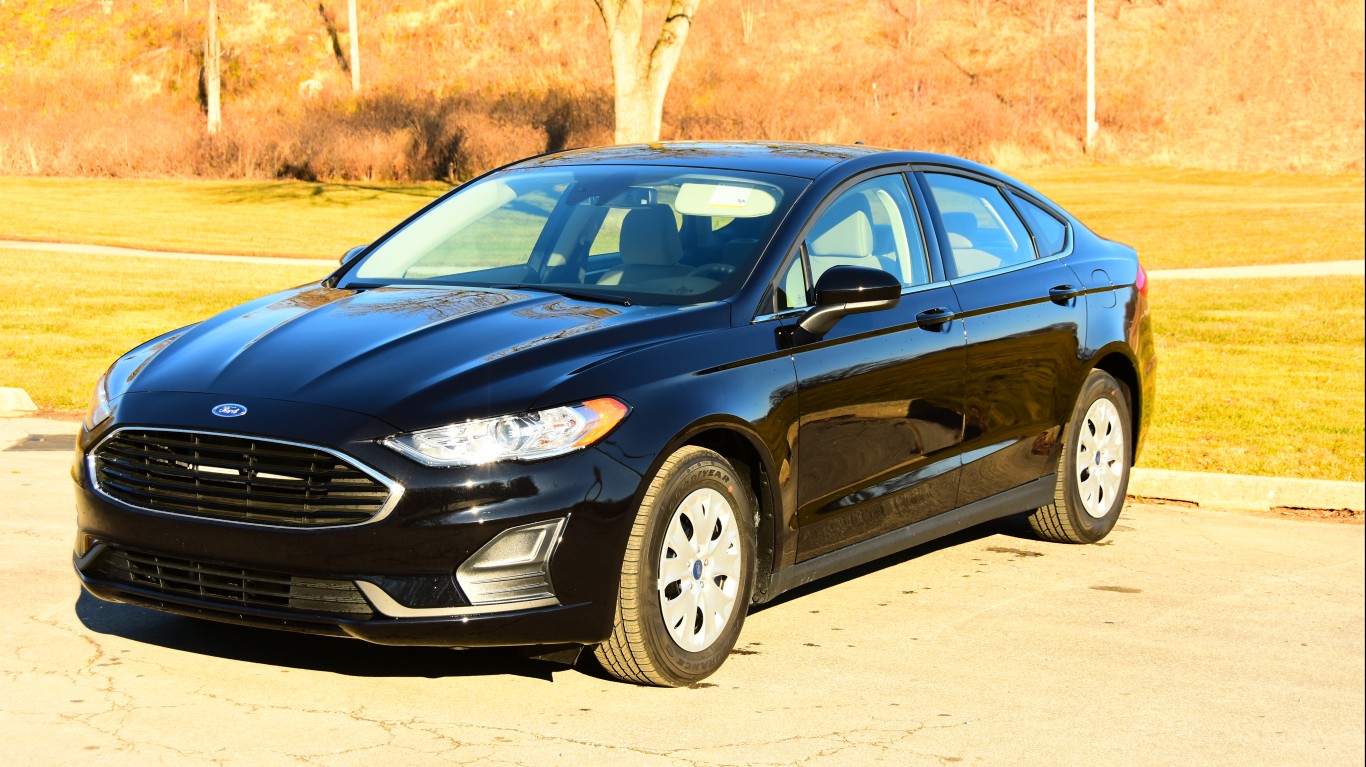
2. Ford Fusion
> Avg. days to sell: 157.7
> Avg. price: $22,942
> 2019 Q4 U.S. sales: 32,137
> 2020 Q4 U.S. sales: 20,001
> Year-over-year sales change: -37.8%
[in-text-ad-2]
1. Ford Fusion Hybrid
> Avg. days to sell: 179.7
> Avg. price: $26,490
> 2019 Q4 U.S. sales: 32,137
> 2020 Q4 U.S. sales: 20,001
> Year-over-year sales change: -37.8%
In 20 Years, I Haven’t Seen A Cash Back Card This Good
After two decades of reviewing financial products I haven’t seen anything like this. Credit card companies are at war, handing out free rewards and benefits to win the best customers.
A good cash back card can be worth thousands of dollars a year in free money, not to mention other perks like travel, insurance, and access to fancy lounges.
Our top pick today pays up to 5% cash back, a $200 bonus on top, and $0 annual fee. Click here to apply before they stop offering rewards this generous.
Flywheel Publishing has partnered with CardRatings for our coverage of credit card products. Flywheel Publishing and CardRatings may receive a commission from card issuers.
Thank you for reading! Have some feedback for us?
Contact the 24/7 Wall St. editorial team.
 24/7 Wall St.
 24/7 Wall St.
![2012-Kia-Sedona-1[2] by loubeat 2012-Kia-Sedona-1[2] by loubeat](https://a673b.bigscoots-temp.com/wp-content/uploads/2021/03/imageForEntry17-L1C.jpg)
