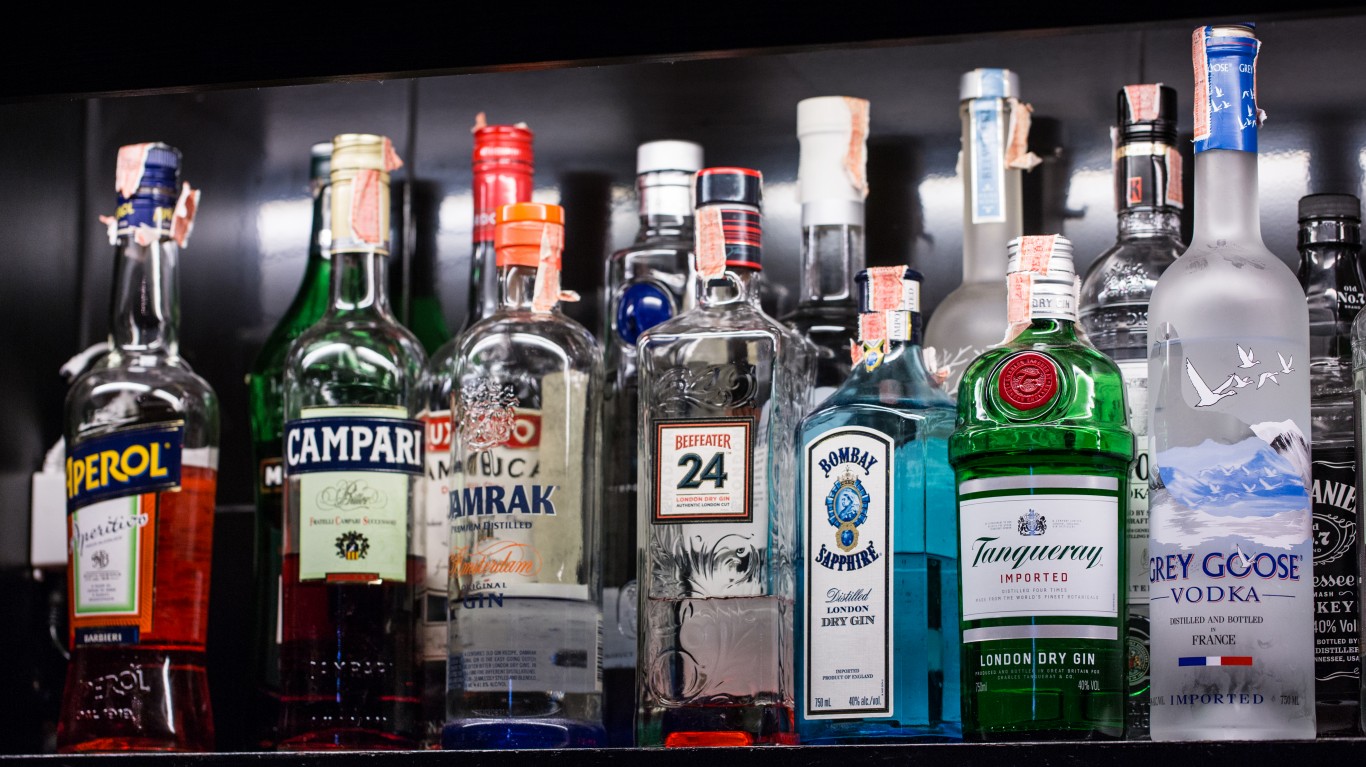
Alcohol is enjoyed responsibly by millions of Americans every day. Nearly 60% of adult men and 51% of adult women drink regularly, according to the 2019 National Survey on Drug Use and Health, an annual survey of more than 67,000 U.S. residents.
Many people, however, also report heavy use of alcohol. Approximately 19.0% of adults in the U.S. report regularly consuming unhealthy amounts of alcohol. In some states, excessive drinking rates are higher.
24/7 Tempo reviewed the adult excessive drinking rate in every state from the 2020 County Health Rankings & Roadmaps, a Robert Wood Johnson Foundation and University of Wisconsin Population Health Institute joint program, to identify the states with the lowest and highest shares of people reporting binge or heavy drinking.
Excessive drinking, according to the Centers for Disease Control and Prevention, includes binge drinking, which is defined as four or more drinks on a single occasion for women and five or more for men. Excessive drinking also includes heavy drinking, which is defined as eight or more drinks per week for women and 15 or more for men.
The states with the highest excessive drinking rates are concentrated in the Midwest, while those with the lowest rates are mostly Southern states. For example, 10 of the 15 states with the highest excessive rates are in the Midwest, including all of the top six. Seven of the 10 states with the lowest rates of excessive drinking are in the South.
Roadway fatalities involving alcohol are one of the most common causes of preventable death in the United States. Nearly 28% all fatal car accidents in the U.S. involve an alcohol-impaired driver. Not surprisingly, states with higher excessive drinking rates are more likely to have deadly roadway accidents involving alcohol. All but one of the 15 states with the largest shares of adults binge drinking or drinking heavily have above average rates of alcohol-related roadway fatalities. These are America’s 50 worst cities to drive in.
In the short term, excessive drinking can increase the likelihood of violence, risky sexual behavior, alcohol poisoning, and injuries. The potential long-term effects of excessive alcohol consumption include alcohol dependence, heart disease, liver disease, certain types of cancer, and mental health problems, including depression. This is the least healthy county in every state.
Click here to see Americas drunkest states
To identify the drunkest U.S. states, 24/7 Tempo reviewed the percentage of men and women 18 and over who report excessive drinking in every state.
Excessive alcohol consumption, according to the Centers for Disease Control and Prevention, includes binge drinking and heavy drinking. Binge drinking is defined as four or more drinks in a single occasion for women and five or more for men, and heavy drinking is defined as at least eight drinks per week for women and 15 for men.
Drinking data per state is from the 2020 County Health Rankings & Roadmaps, a Robert Wood Johnson Foundation and University of Wisconsin Population Health Institute joint program. Health outcomes, including percentage of driving deaths that are alcohol related, and the percentage of adults who report being in fair or poor health are also from the CHR.
All data are as of the most recent available year. Social and economic factors, including poverty rates, are from the U.S. Census Bureau’s 2019 American Community Survey.

50. Utah
> Adults drinking excessively: 12.2% (US share: 19.0%)
>Pct. driving deaths that are alcohol related: 22.5% — 7th lowest (US share: 27.8%)
> Adults in poor of fair health: 13.9% — 6th lowest (US share: 17.2%)
> Poverty rate: 8.9% — 2nd lowest (US rate: 12.3%)
> Drunkest metro area in Utah: Salt Lake City
> Adults drinking excessively in Salt Lake City: 15.6% (323rd highest among all 384 metro areas)
> Drunkest county in Utah: Summit
> Adults drinking excessively in Summit: 16.0% (2,116th highest among all 3,142 counties)
[in-text-ad]

49. West Virginia
> Adults drinking excessively: 12.3% (US share: 19.0%)
>Pct. driving deaths that are alcohol related: 27.4% — 17th lowest (US share: 27.8%)
> Adults in poor of fair health: 23.9% — 2nd highest (US share: 17.2%)
> Poverty rate: 16.0% — 6th highest (US rate: 12.3%)
> Drunkest metro area in West Virginia: Morgantown
> Adults drinking excessively in Morgantown: 16.5% (297th highest among all 384 metro areas)
> Drunkest county in West Virginia: Monongalia
> Adults drinking excessively in Monongalia: 17.5% (1,590th highest among all 3,142 counties)
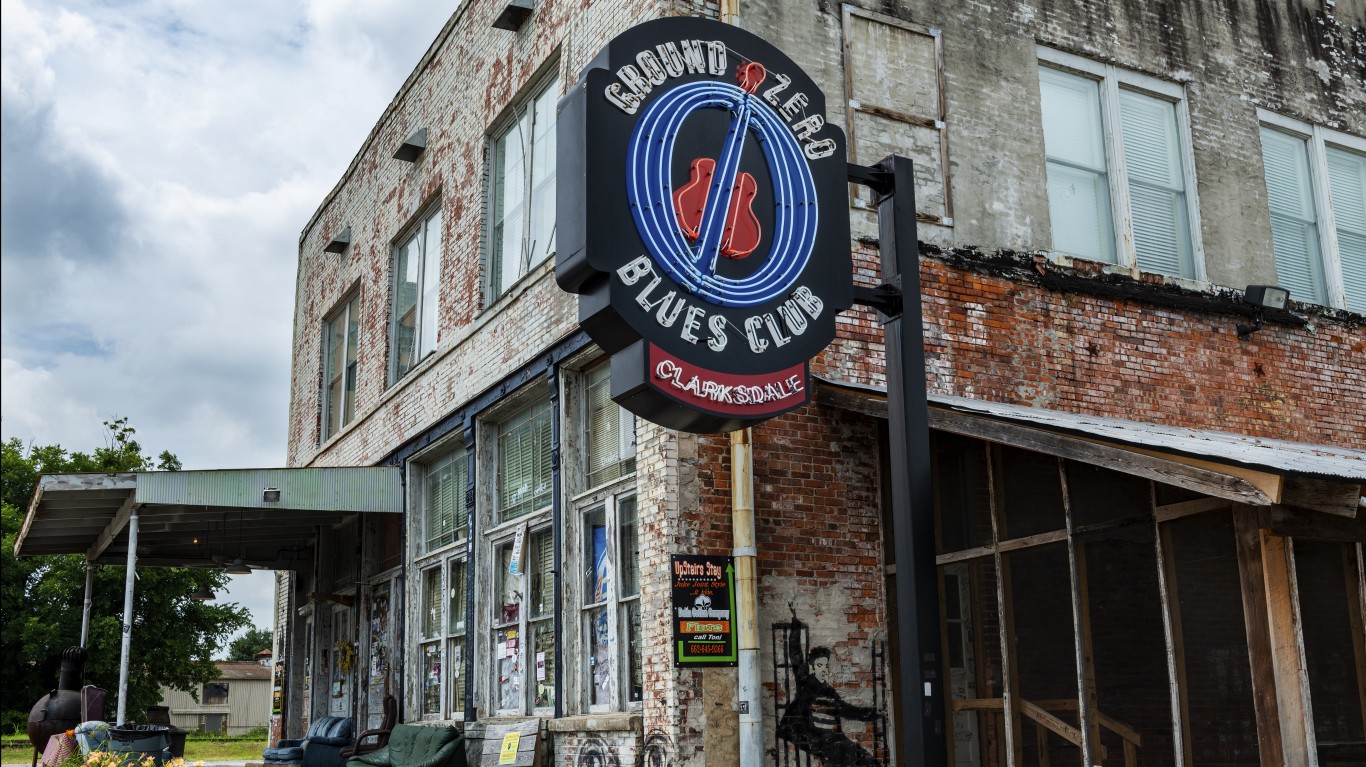
48. Mississippi
> Adults drinking excessively: 13.6% (US share: 19.0%)
>Pct. driving deaths that are alcohol related: 20.0% — 2nd lowest (US share: 27.8%)
> Adults in poor of fair health: 24.1% — the highest (US share: 17.2%)
> Poverty rate: 19.6% — the highest (US rate: 12.3%)
> Drunkest metro area in Mississippi: Hattiesburg
> Adults drinking excessively in Hattiesburg: 16.3% (300th highest among all 384 metro areas)
> Drunkest county in Mississippi: Lafayette
> Adults drinking excessively in Lafayette: 18.2% (1,347th highest among all 3,142 counties)
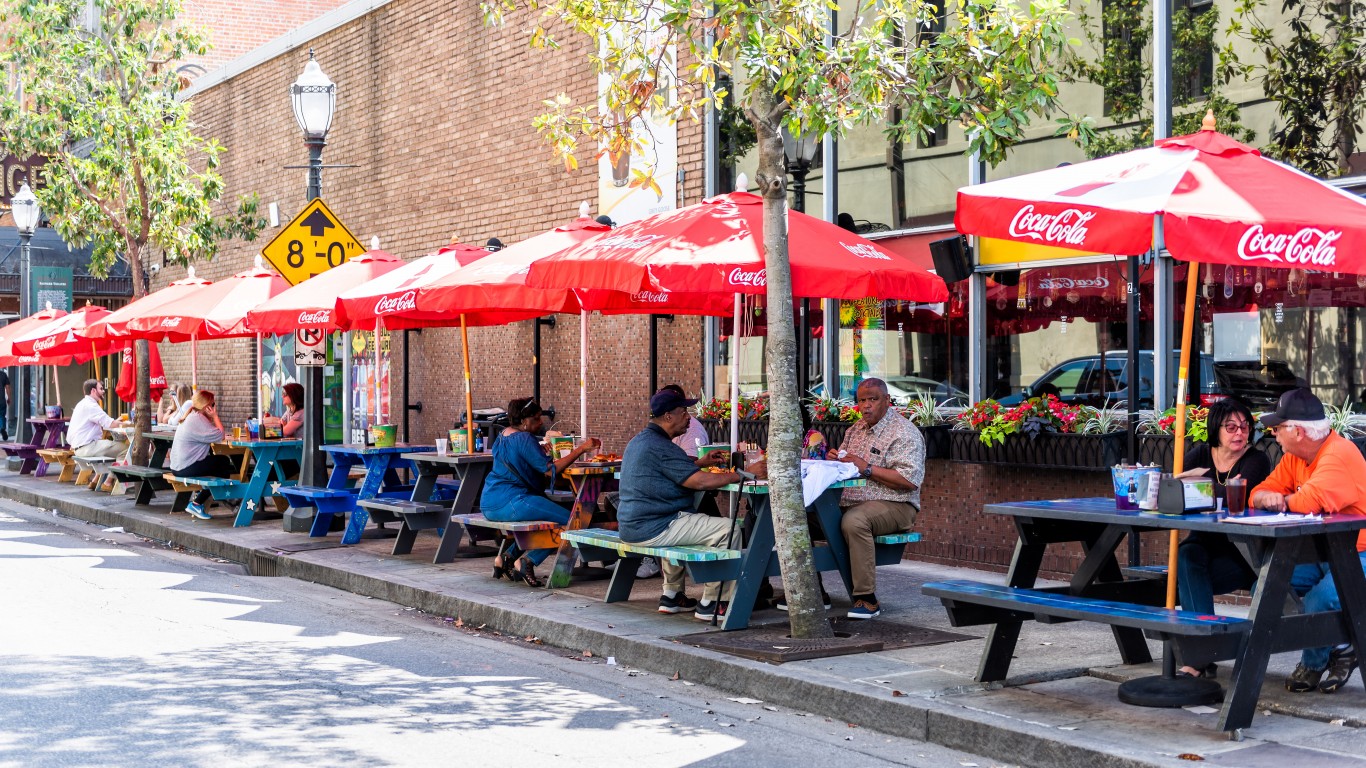
47. Alabama
> Adults drinking excessively: 13.9% (US share: 19.0%)
>Pct. driving deaths that are alcohol related: 27.6% — 19th lowest (US share: 27.8%)
> Adults in poor of fair health: 22.0% — 5th highest (US share: 17.2%)
> Poverty rate: 15.5% — 7th highest (US rate: 12.3%)
> Drunkest metro area in Alabama: Daphne-Fairhope-Foley
> Adults drinking excessively in Daphne-Fairhope-Foley: 18.0% (229th highest among all 384 metro areas)
> Drunkest county in Alabama: Baldwin
> Adults drinking excessively in Baldwin: 18.0% (1,422nd highest among all 3,142 counties)
[in-text-ad-2]
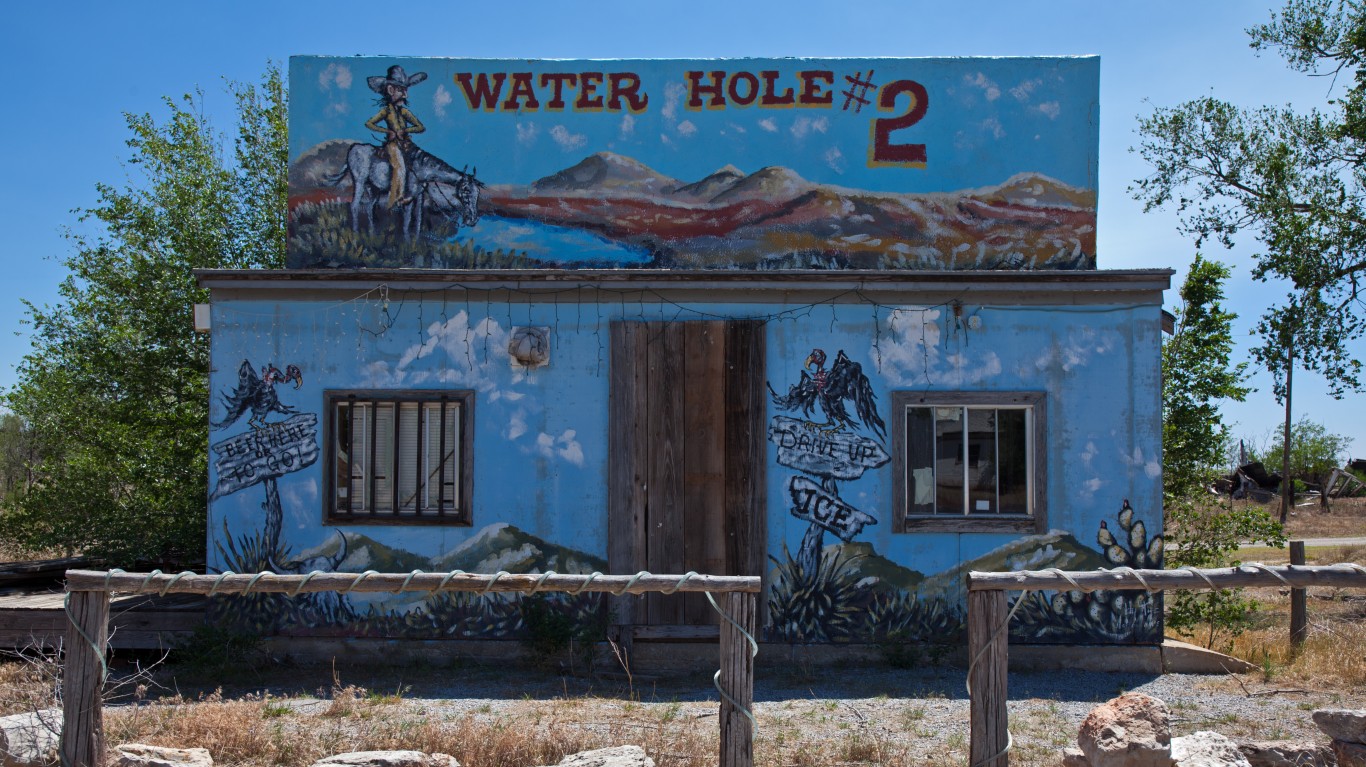
46. Oklahoma
> Adults drinking excessively: 14.1% (US share: 19.0%)
>Pct. driving deaths that are alcohol related: 26.4% — 13th lowest (US share: 27.8%)
> Adults in poor of fair health: 20.8% — 8th highest (US share: 17.2%)
> Poverty rate: 15.2% — 8th highest (US rate: 12.3%)
> Drunkest metro area in Oklahoma: Oklahoma City
> Adults drinking excessively in Oklahoma City: 15.4% (331st highest among all 384 metro areas)
> Drunkest county in Oklahoma: Payne
> Adults drinking excessively in Payne: 16.2% (2,074th highest among all 3,142 counties)
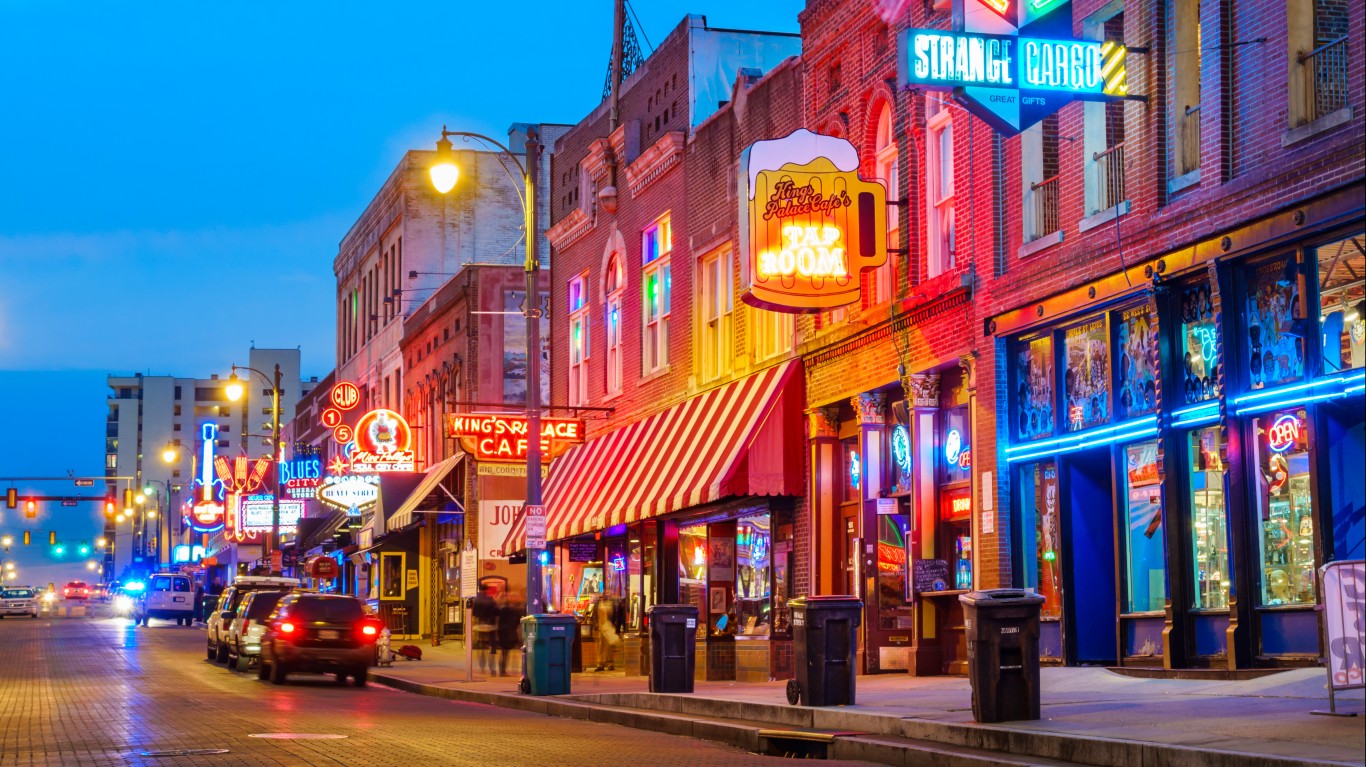
45. Tennessee
> Adults drinking excessively: 14.3% (US share: 19.0%)
>Pct. driving deaths that are alcohol related: 25.1% — 9th lowest (US share: 27.8%)
> Adults in poor of fair health: 19.7% — 12th highest (US share: 17.2%)
> Poverty rate: 13.9% — 9th highest (US rate: 12.3%)
> Drunkest metro area in Tennessee: Chattanooga
> Adults drinking excessively in Chattanooga: 16.9% (269th highest among all 384 metro areas)
> Drunkest county in Tennessee: Hamilton
> Adults drinking excessively in Hamilton: 17.5% (1,604th highest among all 3,142 counties)
[in-text-ad]

44. Georgia
> Adults drinking excessively: 14.4% (US share: 19.0%)
>Pct. driving deaths that are alcohol related: 21.5% — 4th lowest (US share: 27.8%)
> Adults in poor of fair health: 18.0% — 17th highest (US share: 17.2%)
> Poverty rate: 13.3% — 14th highest (US rate: 12.3%)
> Drunkest metro area in Georgia: Savannah
> Adults drinking excessively in Savannah: 17.1% (260th highest among all 384 metro areas)
> Drunkest county in Georgia: Chattahoochee
> Adults drinking excessively in Chattahoochee: 22.9% (138th highest among all 3,142 counties)
43. Arkansas
> Adults drinking excessively: 15.8% (US share: 19.0%)
>Pct. driving deaths that are alcohol related: 26.3% — 12th lowest (US share: 27.8%)
> Adults in poor of fair health: 23.2% — 4th highest (US share: 17.2%)
> Poverty rate: 16.2% — 5th highest (US rate: 12.3%)
> Drunkest metro area in Arkansas: Fayetteville-Springdale-Rogers
> Adults drinking excessively in Fayetteville-Springdale-Rogers: 17.2% (256th highest among all 384 metro areas)
> Drunkest county in Arkansas: Faulkner
> Adults drinking excessively in Faulkner: 17.9% (1,446th highest among all 3,142 counties)

42. New Mexico
> Adults drinking excessively: 16.2% (US share: 19.0%)
>Pct. driving deaths that are alcohol related: 30.5% — 20th highest (US share: 27.8%)
> Adults in poor of fair health: 20.6% — 9th highest (US share: 17.2%)
> Poverty rate: 18.2% — 3rd highest (US rate: 12.3%)
> Drunkest metro area in New Mexico: Albuquerque
> Adults drinking excessively in Albuquerque: 16.5% (292nd highest among all 384 metro areas)
> Drunkest county in New Mexico: Los Alamos
> Adults drinking excessively in Los Alamos: 19.6% (807th highest among all 3,142 counties)
[in-text-ad-2]
41. Idaho
> Adults drinking excessively: 16.6% (US share: 19.0%)
>Pct. driving deaths that are alcohol related: 30.2% — 23rd highest (US share: 27.8%)
> Adults in poor of fair health: 14.6% — 12th lowest (US share: 17.2%)
> Poverty rate: 11.2% — 21st lowest (US rate: 12.3%)
> Drunkest metro area in Idaho: Coeur d’Alene
> Adults drinking excessively in Coeur d’Alene: 20.3% (89th highest among all 384 metro areas)
> Drunkest county in Idaho: Latah
> Adults drinking excessively in Latah: 21.0% (362nd highest among all 3,142 counties)
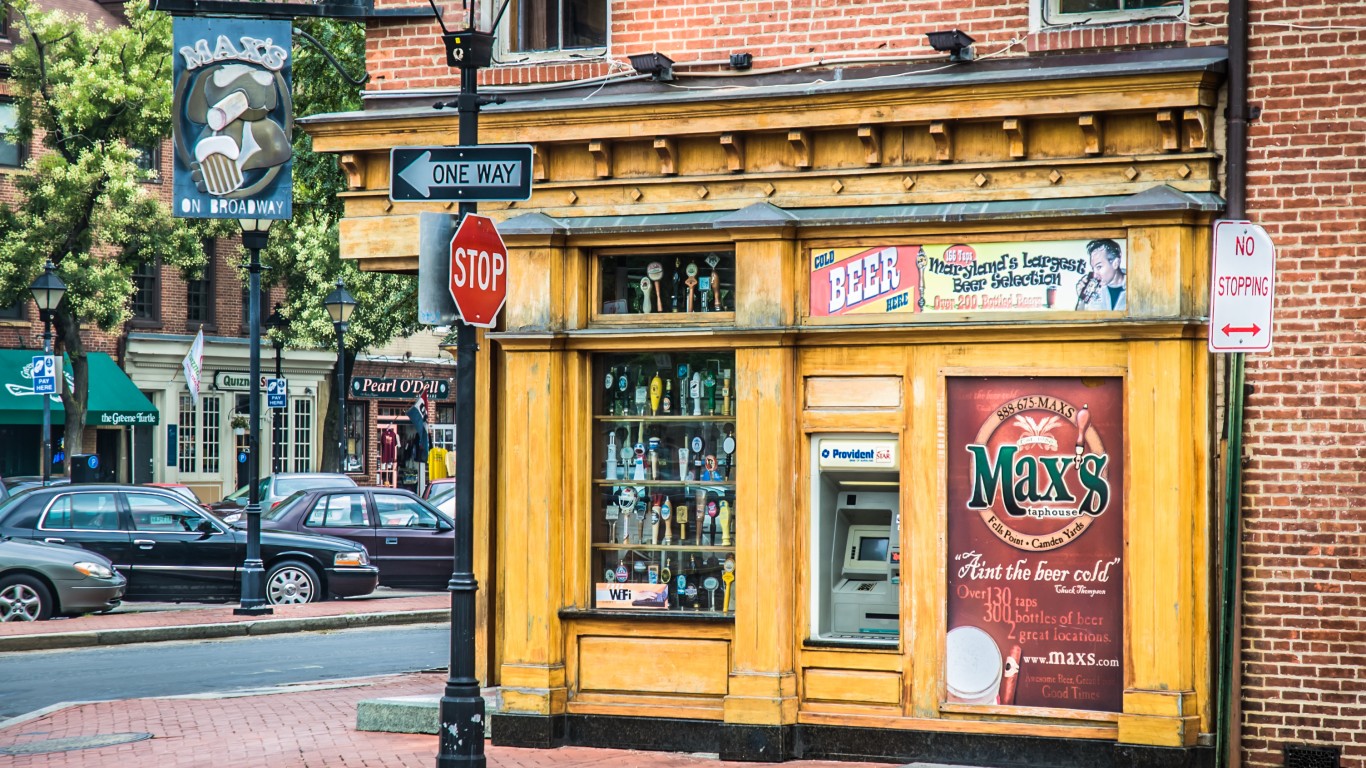
40. Maryland
> Adults drinking excessively: 16.6% (US share: 19.0%)
>Pct. driving deaths that are alcohol related: 28.9% — 20th lowest (US share: 27.8%)
> Adults in poor of fair health: 14.9% — 14th lowest (US share: 17.2%)
> Poverty rate: 9.0% — 4th lowest (US rate: 12.3%)
> Drunkest metro area in Maryland: California-Lexington Park
> Adults drinking excessively in California-Lexington Park: 19.0% (168th highest among all 384 metro areas)
> Drunkest county in Maryland: Anne Arundel
> Adults drinking excessively in Anne Arundel: 19.2% (938th highest among all 3,142 counties)
[in-text-ad]
39. Arizona
> Adults drinking excessively: 16.7% (US share: 19.0%)
>Pct. driving deaths that are alcohol related: 25.4% — 10th lowest (US share: 27.8%)
> Adults in poor of fair health: 18.6% — 13th highest (US share: 17.2%)
> Poverty rate: 13.5% — 13th highest (US rate: 12.3%)
> Drunkest metro area in Arizona: Phoenix-Mesa-Scottsdale
> Adults drinking excessively in Phoenix-Mesa-Scottsdale: 18.0% (225th highest among all 384 metro areas)
> Drunkest county in Arizona: Maricopa
> Adults drinking excessively in Maricopa: 18.2% (1,340th highest among all 3,142 counties)

38. Delaware
> Adults drinking excessively: 16.8% (US share: 19.0%)
>Pct. driving deaths that are alcohol related: 30.3% — 22nd highest (US share: 27.8%)
> Adults in poor of fair health: 18.0% — 20th highest (US share: 17.2%)
> Poverty rate: 11.3% — 22nd lowest (US rate: 12.3%)
> Drunkest metro area in Delaware: Dover
> Adults drinking excessively in Dover: 16.6% (287th highest among all 384 metro areas)
> Drunkest county in Delaware: New Castle
> Adults drinking excessively in New Castle: 19.4% (871st highest among all 3,142 counties)
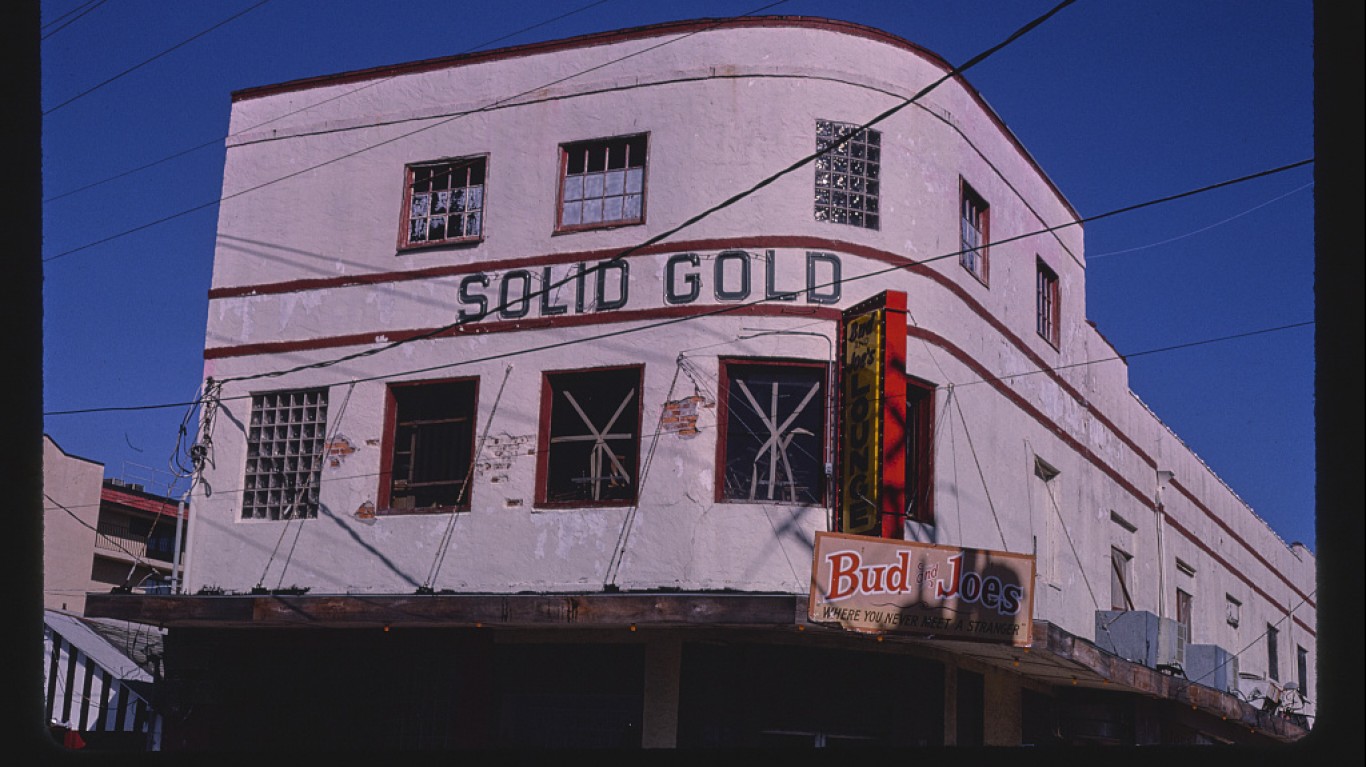
37. North Carolina
> Adults drinking excessively: 16.9% (US share: 19.0%)
>Pct. driving deaths that are alcohol related: 29.5% — 23rd lowest (US share: 27.8%)
> Adults in poor of fair health: 18.5% — 14th highest (US share: 17.2%)
> Poverty rate: 13.6% — 12th highest (US rate: 12.3%)
> Drunkest metro area in North Carolina: Jacksonville
> Adults drinking excessively in Jacksonville: 22.3% (35th highest among all 384 metro areas)
> Drunkest county in North Carolina: Onslow
> Adults drinking excessively in Onslow: 22.3% (181st highest among all 3,142 counties)
[in-text-ad-2]
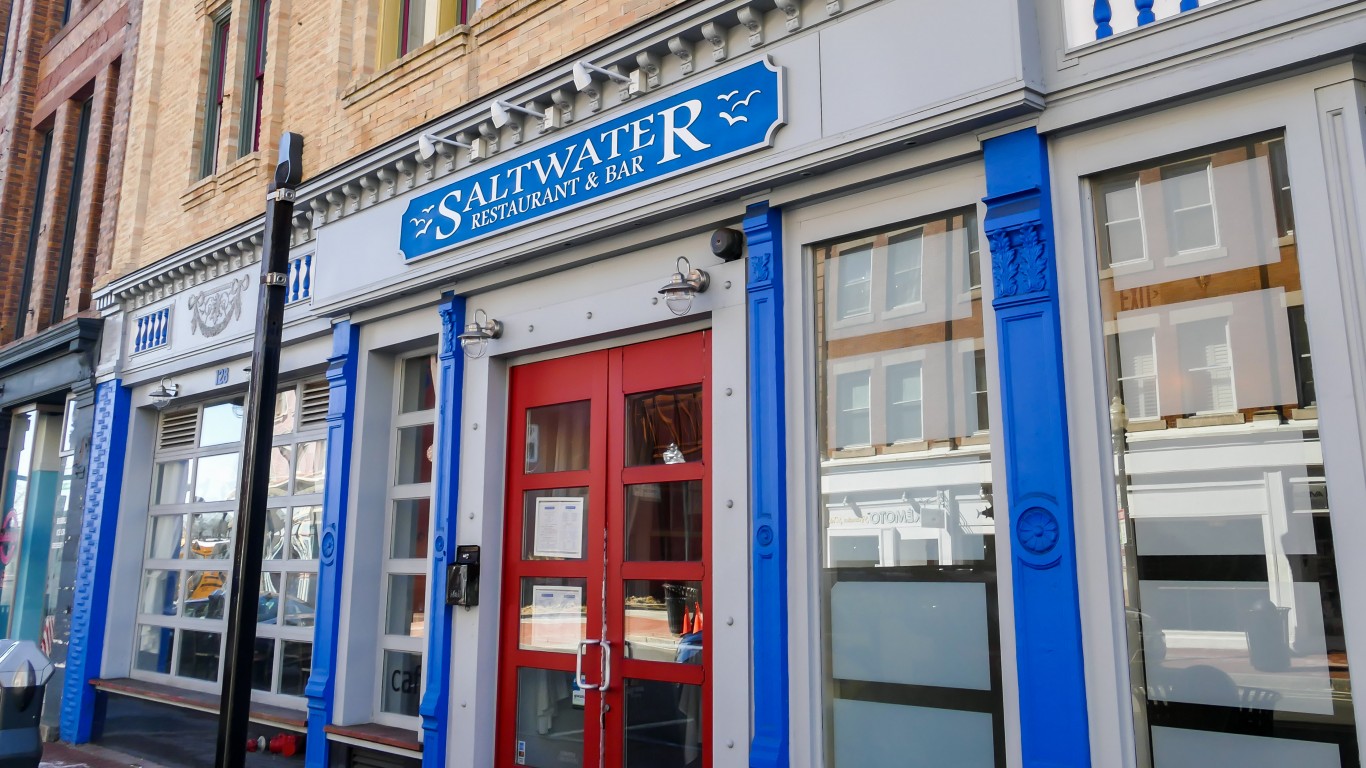
36. Connecticut
> Adults drinking excessively: 17.1% (US share: 19.0%)
>Pct. driving deaths that are alcohol related: 32.0% — 16th highest (US share: 27.8%)
> Adults in poor of fair health: 13.8% — 5th lowest (US share: 17.2%)
> Poverty rate: 10.0% — 12th lowest (US rate: 12.3%)
> Drunkest metro area in Connecticut: Bridgeport-Stamford-Norwalk
> Adults drinking excessively in Bridgeport-Stamford-Norwalk: 19.4% (147th highest among all 384 metro areas)
> Drunkest county in Connecticut: Fairfield
> Adults drinking excessively in Fairfield: 19.4% (886th highest among all 3,142 counties)
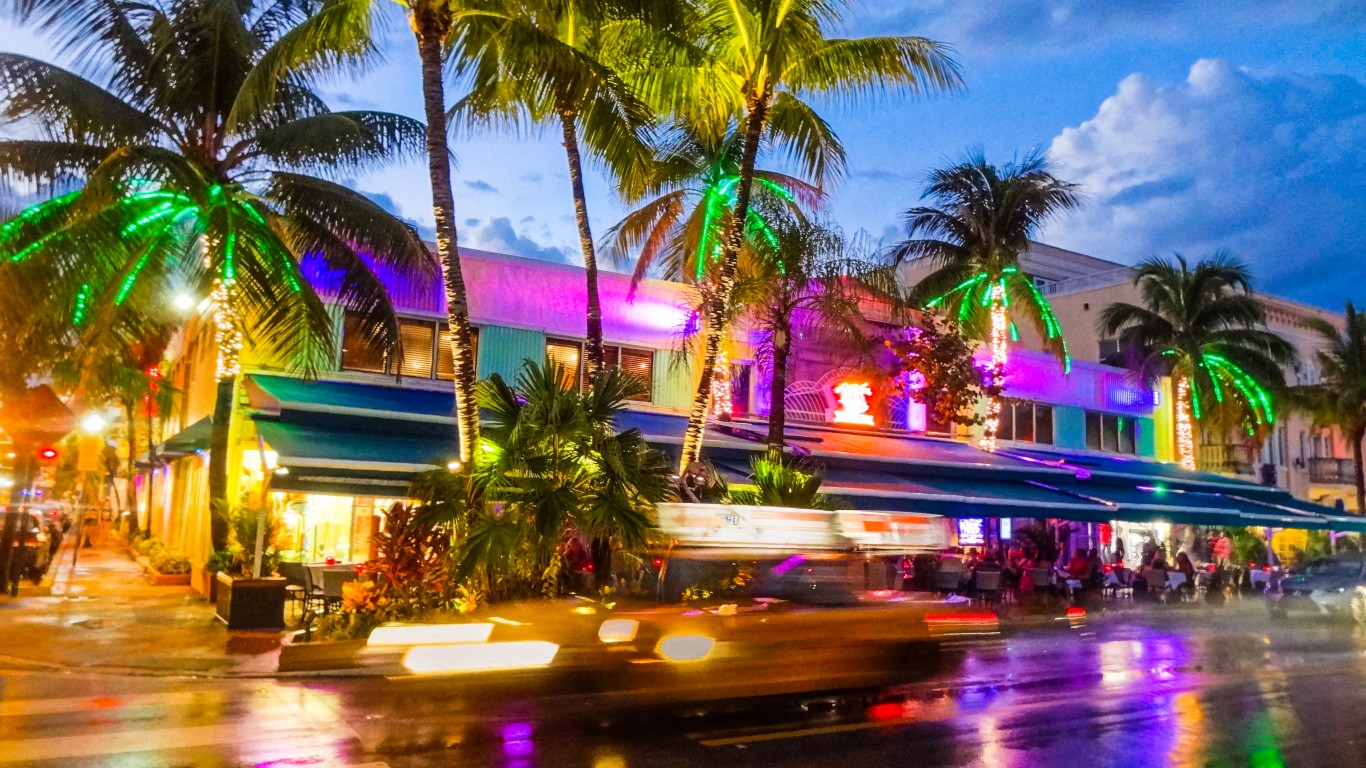
35. Florida
> Adults drinking excessively: 17.1% (US share: 19.0%)
>Pct. driving deaths that are alcohol related: 23.3% — 8th lowest (US share: 27.8%)
> Adults in poor of fair health: 17.5% — 23rd highest (US share: 17.2%)
> Poverty rate: 12.7% — 19th highest (US rate: 12.3%)
> Drunkest metro area in Florida: Jacksonville
> Adults drinking excessively in Jacksonville: 19.8% (123rd highest among all 384 metro areas)
> Drunkest county in Florida: St. Johns
> Adults drinking excessively in St. Johns: 22.4% (170th highest among all 3,142 counties)
[in-text-ad]

34. Kentucky
> Adults drinking excessively: 17.3% (US share: 19.0%)
>Pct. driving deaths that are alcohol related: 26.1% — 11th lowest (US share: 27.8%)
> Adults in poor of fair health: 23.9% — 3rd highest (US share: 17.2%)
> Poverty rate: 16.3% — 4th highest (US rate: 12.3%)
> Drunkest metro area in Kentucky: Lexington-Fayette
> Adults drinking excessively in Lexington-Fayette: 19.8% (125th highest among all 384 metro areas)
> Drunkest county in Kentucky: Kenton
> Adults drinking excessively in Kenton: 24.2% (76th highest among all 3,142 counties)
33. South Carolina
> Adults drinking excessively: 17.4% (US share: 19.0%)
>Pct. driving deaths that are alcohol related: 33.1% — 12th highest (US share: 27.8%)
> Adults in poor of fair health: 18.2% — 15th highest (US share: 17.2%)
> Poverty rate: 13.8% — 10th highest (US rate: 12.3%)
> Drunkest metro area in South Carolina: Charleston-North Charleston
> Adults drinking excessively in Charleston-North Charleston: 21.0% (64th highest among all 384 metro areas)
> Drunkest county in South Carolina: Charleston
> Adults drinking excessively in Charleston: 23.0% (130th highest among all 3,142 counties)
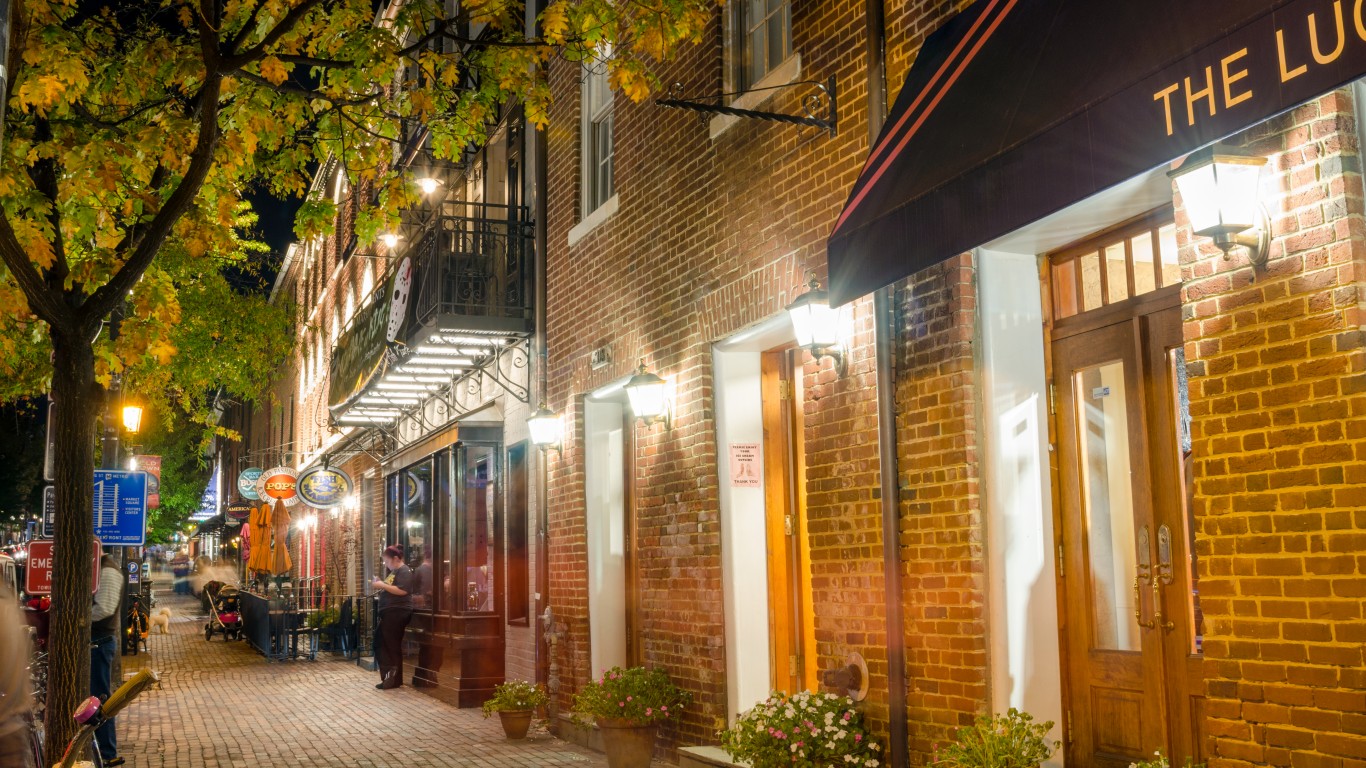
32. Virginia
> Adults drinking excessively: 17.4% (US share: 19.0%)
>Pct. driving deaths that are alcohol related: 30.2% — 24th highest (US share: 27.8%)
> Adults in poor of fair health: 15.8% — 19th lowest (US share: 17.2%)
> Poverty rate: 9.9% — 11th lowest (US rate: 12.3%)
> Drunkest metro area in Virginia: Blacksburg-Christiansburg-Radford
> Adults drinking excessively in Blacksburg-Christiansburg-Radford: 19.4% (144th highest among all 384 metro areas)
> Drunkest county in Virginia: Arlington
> Adults drinking excessively in Arlington: 22.2% (186th highest among all 3,142 counties)
[in-text-ad-2]
31. Washington
> Adults drinking excessively: 17.4% (US share: 19.0%)
>Pct. driving deaths that are alcohol related: 32.1% — 15th highest (US share: 27.8%)
> Adults in poor of fair health: 15.6% — 18th lowest (US share: 17.2%)
> Poverty rate: 9.8% — 9th lowest (US rate: 12.3%)
> Drunkest metro area in Washington: Bellingham
> Adults drinking excessively in Bellingham: 22.7% (32nd highest among all 384 metro areas)
> Drunkest county in Washington: Whatcom
> Adults drinking excessively in Whatcom: 22.7% (149th highest among all 3,142 counties)
30. Indiana
> Adults drinking excessively: 17.6% (US share: 19.0%)
>Pct. driving deaths that are alcohol related: 19.7% — the lowest (US share: 27.8%)
> Adults in poor of fair health: 19.8% — 11th highest (US share: 17.2%)
> Poverty rate: 11.9% — 24th highest (US rate: 12.3%)
> Drunkest metro area in Indiana: South Bend-Mishawaka
> Adults drinking excessively in South Bend-Mishawaka: 19.8% (117th highest among all 384 metro areas)
> Drunkest county in Indiana: Hamilton
> Adults drinking excessively in Hamilton: 20.1% (645th highest among all 3,142 counties)
[in-text-ad]
29. New Jersey
> Adults drinking excessively: 18.1% (US share: 19.0%)
>Pct. driving deaths that are alcohol related: 21.9% — 6th lowest (US share: 27.8%)
> Adults in poor of fair health: 17.7% — 21st highest (US share: 17.2%)
> Poverty rate: 9.2% — 5th lowest (US rate: 12.3%)
> Drunkest metro area in New Jersey: Trenton
> Adults drinking excessively in Trenton: 19.0% (172nd highest among all 384 metro areas)
> Drunkest county in New Jersey: Hunterdon
> Adults drinking excessively in Hunterdon: 21.7% (254th highest among all 3,142 counties)
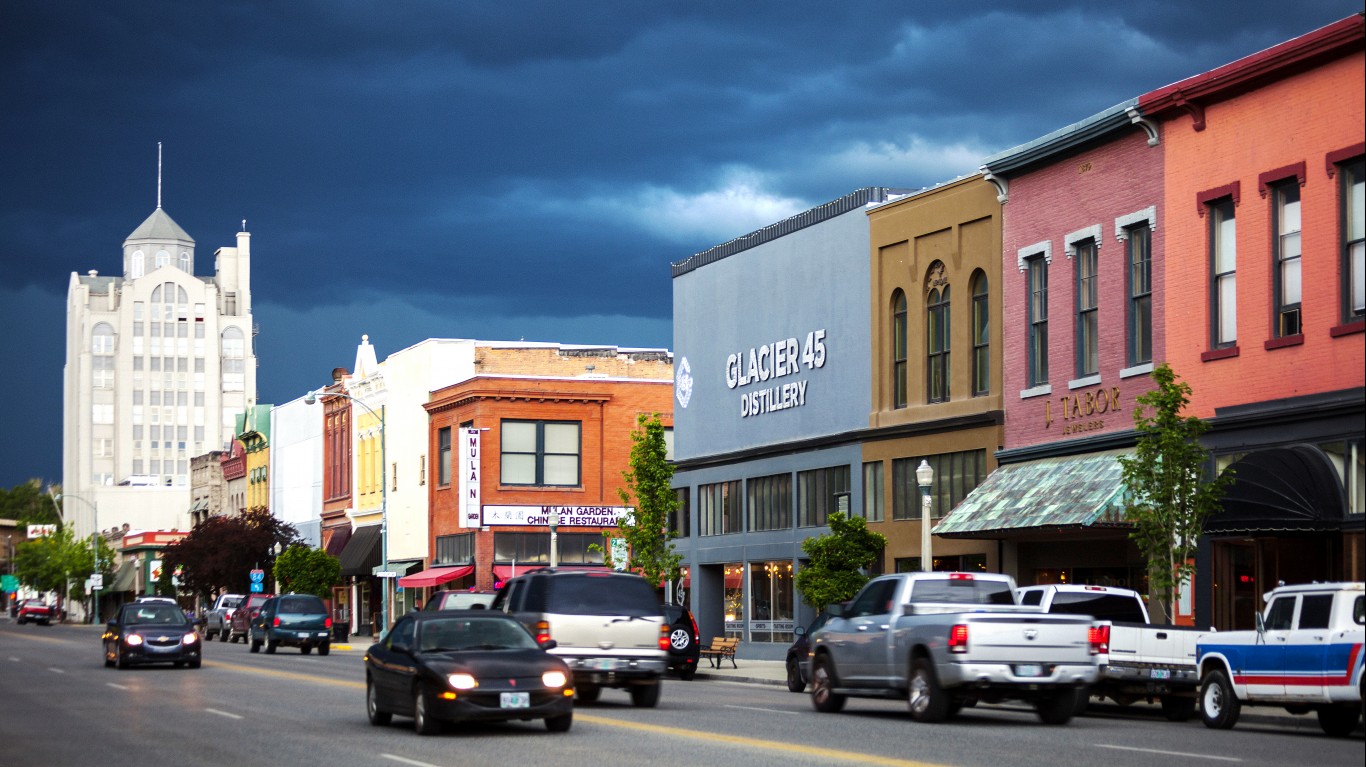
28. Oregon
> Adults drinking excessively: 18.6% (US share: 19.0%)
>Pct. driving deaths that are alcohol related: 30.9% — 19th highest (US share: 27.8%)
> Adults in poor of fair health: 16.7% — 24th lowest (US share: 17.2%)
> Poverty rate: 11.4% — 23rd lowest (US rate: 12.3%)
> Drunkest metro area in Oregon: Corvallis
> Adults drinking excessively in Corvallis: 21.3% (61st highest among all 384 metro areas)
> Drunkest county in Oregon: Multnomah
> Adults drinking excessively in Multnomah: 23.7% (96th highest among all 3,142 counties)

27. Kansas
> Adults drinking excessively: 18.7% (US share: 19.0%)
>Pct. driving deaths that are alcohol related: 21.9% — 5th lowest (US share: 27.8%)
> Adults in poor of fair health: 16.1% — 20th lowest (US share: 17.2%)
> Poverty rate: 11.4% — 24th lowest (US rate: 12.3%)
> Drunkest metro area in Kansas: Lawrence
> Adults drinking excessively in Lawrence: 24.0% (20th highest among all 384 metro areas)
> Drunkest county in Kansas: Douglas
> Adults drinking excessively in Douglas: 24.0% (83rd highest among all 3,142 counties)
[in-text-ad-2]

26. New York
> Adults drinking excessively: 18.8% (US share: 19.0%)
>Pct. driving deaths that are alcohol related: 20.9% — 3rd lowest (US share: 27.8%)
> Adults in poor of fair health: 16.6% — 22nd lowest (US share: 17.2%)
> Poverty rate: 13.0% — 16th highest (US rate: 12.3%)
> Drunkest metro area in New York: Buffalo-Cheektowaga-Niagara Falls
> Adults drinking excessively in Buffalo-Cheektowaga-Niagara Falls: 22.2% (37th highest among all 384 metro areas)
> Drunkest county in New York: New York
> Adults drinking excessively in New York: 24.8% (50th highest among all 3,142 counties)

25. South Dakota
> Adults drinking excessively: 19.0% (US share: 19.0%)
>Pct. driving deaths that are alcohol related: 36.7% — 4th highest (US share: 27.8%)
> Adults in poor of fair health: 13.4% — 4th lowest (US share: 17.2%)
> Poverty rate: 11.9% — 23rd highest (US rate: 12.3%)
> Drunkest metro area in South Dakota: Sioux Falls
> Adults drinking excessively in Sioux Falls: 19.7% (127th highest among all 384 metro areas)
> Drunkest county in South Dakota: Clay
> Adults drinking excessively in Clay: 22.6% (155th highest among all 3,142 counties)
[in-text-ad]
24. Pennsylvania
> Adults drinking excessively: 19.2% (US share: 19.0%)
>Pct. driving deaths that are alcohol related: 26.8% — 14th lowest (US share: 27.8%)
> Adults in poor of fair health: 17.5% — 22nd highest (US share: 17.2%)
> Poverty rate: 12.0% — 22nd highest (US rate: 12.3%)
> Drunkest metro area in Pennsylvania: State College
> Adults drinking excessively in State College: 24.0% (19th highest among all 384 metro areas)
> Drunkest county in Pennsylvania: Centre
> Adults drinking excessively in Centre: 24.0% (82nd highest among all 3,142 counties)

23. California
> Adults drinking excessively: 19.2% (US share: 19.0%)
>Pct. driving deaths that are alcohol related: 29.6% — 24th lowest (US share: 27.8%)
> Adults in poor of fair health: 17.2% — 25th highest (US share: 17.2%)
> Poverty rate: 11.8% — 25th highest (US rate: 12.3%)
> Drunkest metro area in California: Santa Cruz-Watsonville
> Adults drinking excessively in Santa Cruz-Watsonville: 23.2% (29th highest among all 384 metro areas)
> Drunkest county in California: Lassen
> Adults drinking excessively in Lassen: 23.9% (91st highest among all 3,142 counties)
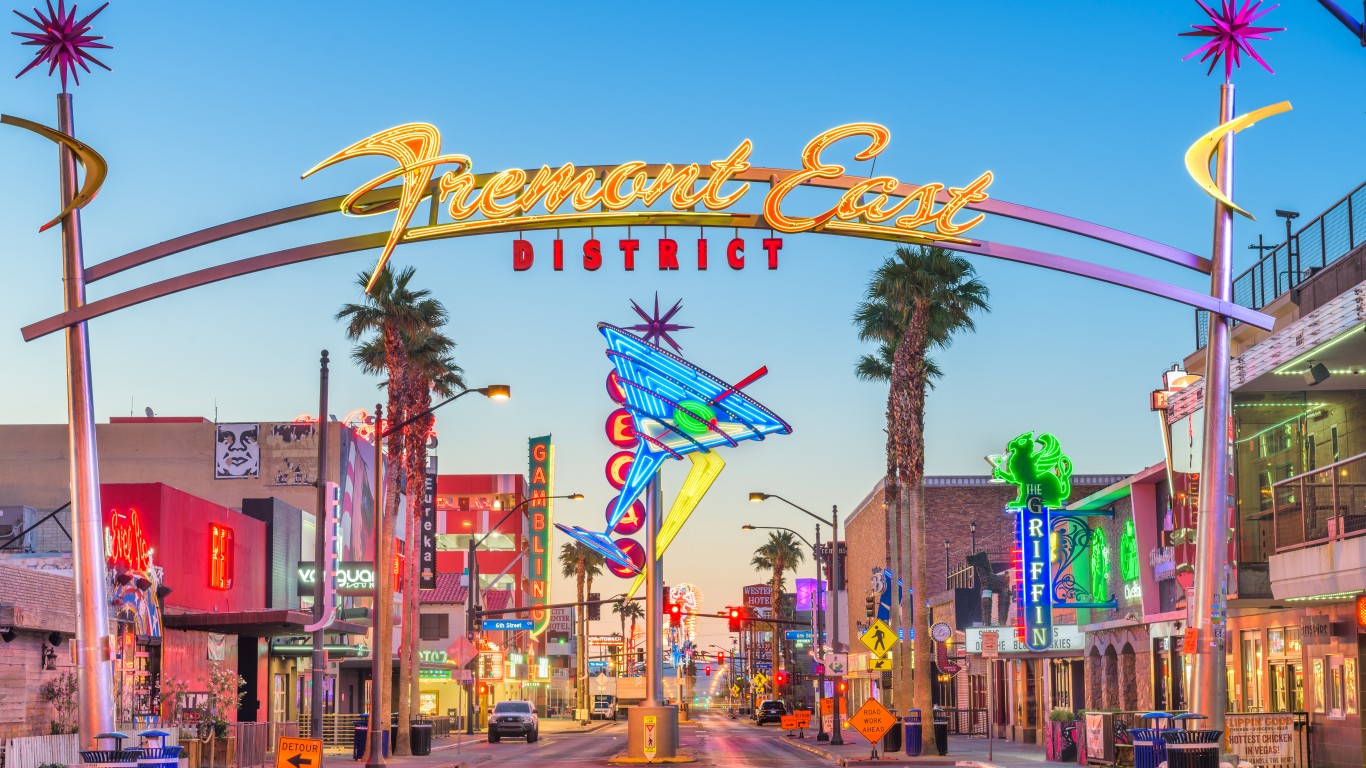
22. Nevada
> Adults drinking excessively: 19.3% (US share: 19.0%)
>Pct. driving deaths that are alcohol related: 29.4% — 22nd lowest (US share: 27.8%)
> Adults in poor of fair health: 19.9% — 10th highest (US share: 17.2%)
> Poverty rate: 12.5% — 21st highest (US rate: 12.3%)
> Drunkest metro area in Nevada: Reno
> Adults drinking excessively in Reno: 24.3% (16th highest among all 384 metro areas)
> Drunkest county in Nevada: Washoe
> Adults drinking excessively in Washoe: 24.4% (68th highest among all 3,142 counties)
[in-text-ad-2]
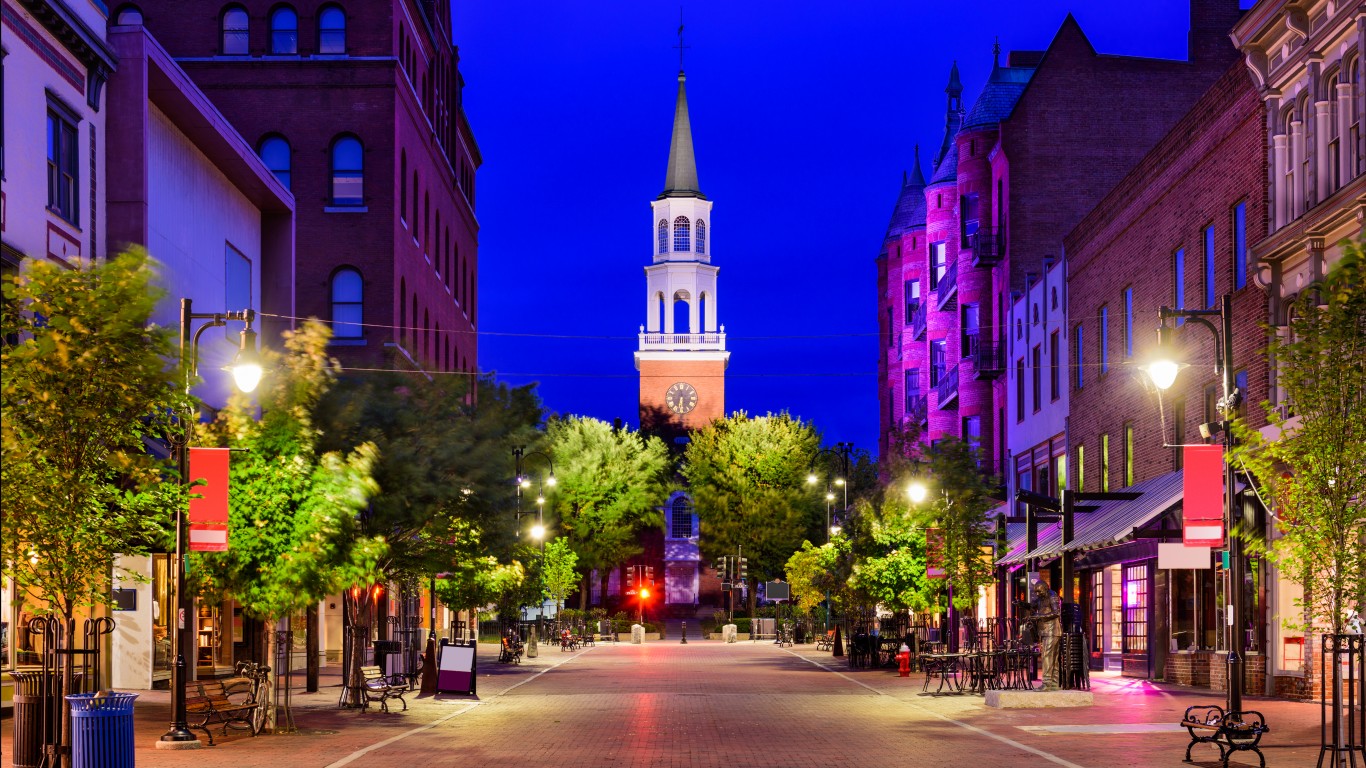
21. Vermont
> Adults drinking excessively: 19.5% (US share: 19.0%)
>Pct. driving deaths that are alcohol related: 34.7% — 8th highest (US share: 27.8%)
> Adults in poor of fair health: 13.1% — 2nd lowest (US share: 17.2%)
> Poverty rate: 10.2% — 15th lowest (US rate: 12.3%)
> Drunkest metro area in Vermont: Burlington-South Burlington
> Adults drinking excessively in Burlington-South Burlington: 21.5% (52nd highest among all 384 metro areas)
> Drunkest county in Vermont: Lamoille
> Adults drinking excessively in Lamoille: 21.9% (237th highest among all 3,142 counties)
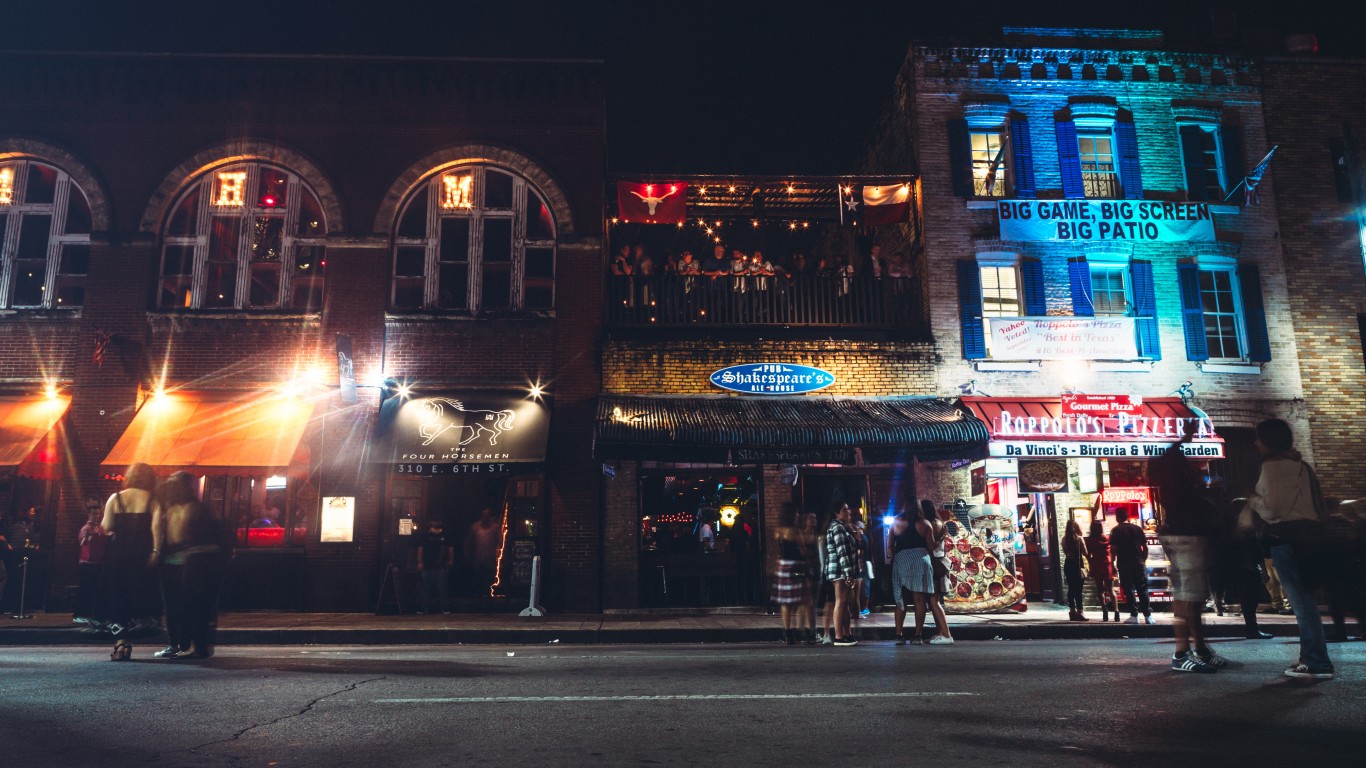
20. Texas
> Adults drinking excessively: 19.5% (US share: 19.0%)
>Pct. driving deaths that are alcohol related: 26.9% — 15th lowest (US share: 27.8%)
> Adults in poor of fair health: 20.8% — 7th highest (US share: 17.2%)
> Poverty rate: 13.6% — 11th highest (US rate: 12.3%)
> Drunkest metro area in Texas: Austin-Round Rock
> Adults drinking excessively in Austin-Round Rock: 23.4% (26th highest among all 384 metro areas)
> Drunkest county in Texas: Travis
> Adults drinking excessively in Travis: 25.1% (42nd highest among all 3,142 counties)
[in-text-ad]

19. Louisiana
> Adults drinking excessively: 19.6% (US share: 19.0%)
>Pct. driving deaths that are alcohol related: 33.1% — 13th highest (US share: 27.8%)
> Adults in poor of fair health: 22.0% — 6th highest (US share: 17.2%)
> Poverty rate: 19.0% — 2nd highest (US rate: 12.3%)
> Drunkest metro area in Louisiana: Baton Rouge
> Adults drinking excessively in Baton Rouge: 21.5% (53rd highest among all 384 metro areas)
> Drunkest county in Louisiana: Ascension
> Adults drinking excessively in Ascension: 24.0% (85th highest among all 3,142 counties)

18. Michigan
> Adults drinking excessively: 19.6% (US share: 19.0%)
>Pct. driving deaths that are alcohol related: 29.0% — 21st lowest (US share: 27.8%)
> Adults in poor of fair health: 17.4% — 24th highest (US share: 17.2%)
> Poverty rate: 13.0% — 17th highest (US rate: 12.3%)
> Drunkest metro area in Michigan: Grand Rapids-Wyoming
> Adults drinking excessively in Grand Rapids-Wyoming: 21.8% (43rd highest among all 384 metro areas)
> Drunkest county in Michigan: Clinton
> Adults drinking excessively in Clinton: 22.9% (137th highest among all 3,142 counties)

17. Rhode Island
> Adults drinking excessively: 19.6% (US share: 19.0%)
>Pct. driving deaths that are alcohol related: 36.2% — 7th highest (US share: 27.8%)
> Adults in poor of fair health: 16.4% — 21st lowest (US share: 17.2%)
> Poverty rate: 10.8% — 18th lowest (US rate: 12.3%)
> Drunkest metro area in Rhode Island: Providence-Warwick
> Adults drinking excessively in Providence-Warwick: 19.9% (112th highest among all 384 metro areas)
> Drunkest county in Rhode Island: Newport
> Adults drinking excessively in Newport: 22.1% (209th highest among all 3,142 counties)
[in-text-ad-2]
16. Missouri
> Adults drinking excessively: 19.8% (US share: 19.0%)
>Pct. driving deaths that are alcohol related: 27.4% — 18th lowest (US share: 27.8%)
> Adults in poor of fair health: 18.0% — 18th highest (US share: 17.2%)
> Poverty rate: 12.9% — 18th highest (US rate: 12.3%)
> Drunkest metro area in Missouri: Columbia
> Adults drinking excessively in Columbia: 24.2% (17th highest among all 384 metro areas)
> Drunkest county in Missouri: Boone
> Adults drinking excessively in Boone: 24.2% (77th highest among all 3,142 counties)
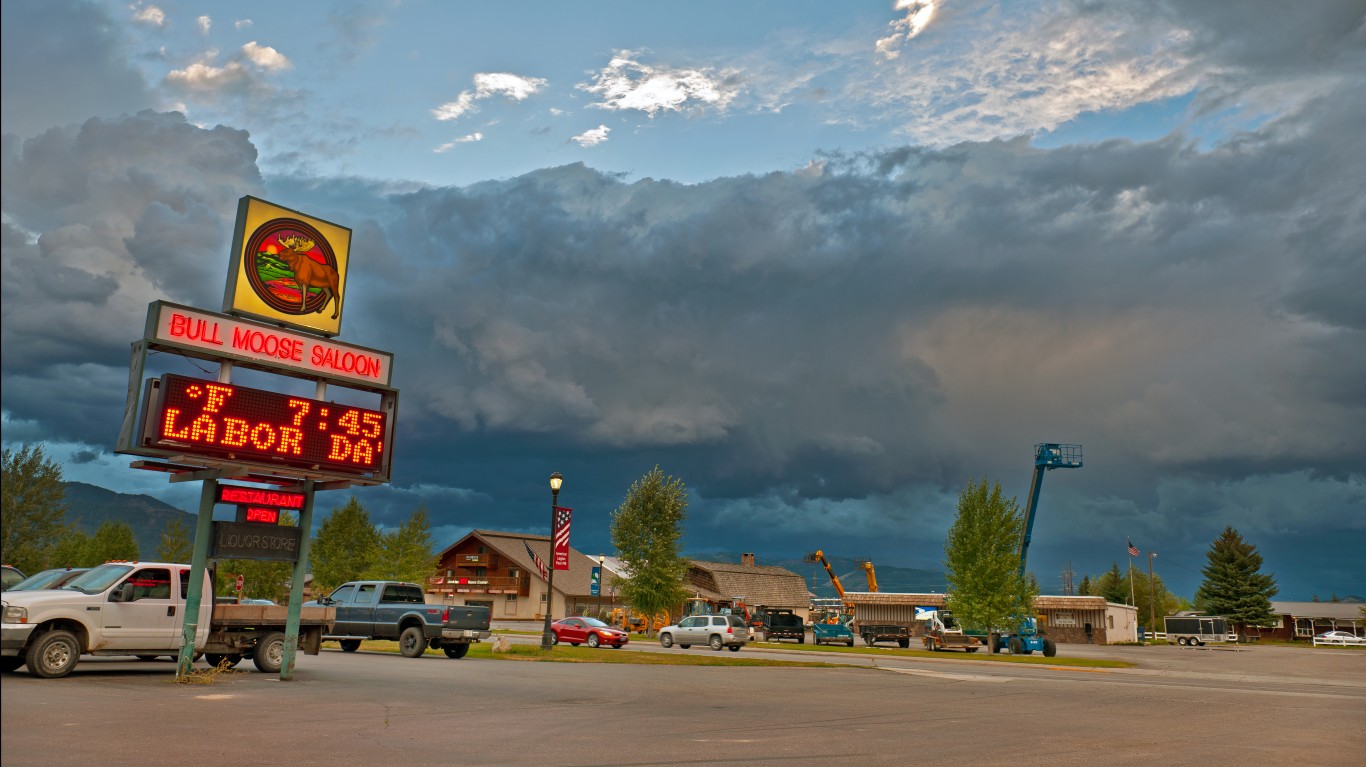
15. Wyoming
> Adults drinking excessively: 19.8% (US share: 19.0%)
>Pct. driving deaths that are alcohol related: 34.2% — 9th highest (US share: 27.8%)
> Adults in poor of fair health: 15.0% — 15th lowest (US share: 17.2%)
> Poverty rate: 10.1% — 14th lowest (US rate: 12.3%)
> Drunkest metro area in Wyoming: Casper
> Adults drinking excessively in Casper: 18.3% (206th highest among all 384 metro areas)
> Drunkest county in Wyoming: Teton
> Adults drinking excessively in Teton: 25.5% (32nd highest among all 3,142 counties)
[in-text-ad]
14. Ohio
> Adults drinking excessively: 20.2% (US share: 19.0%)
>Pct. driving deaths that are alcohol related: 32.7% — 14th highest (US share: 27.8%)
> Adults in poor of fair health: 18.0% — 19th highest (US share: 17.2%)
> Poverty rate: 13.1% — 15th highest (US rate: 12.3%)
> Drunkest metro area in Ohio: Columbus
> Adults drinking excessively in Columbus: 20.6% (75th highest among all 384 metro areas)
> Drunkest county in Ohio: Mercer
> Adults drinking excessively in Mercer: 21.7% (247th highest among all 3,142 counties)
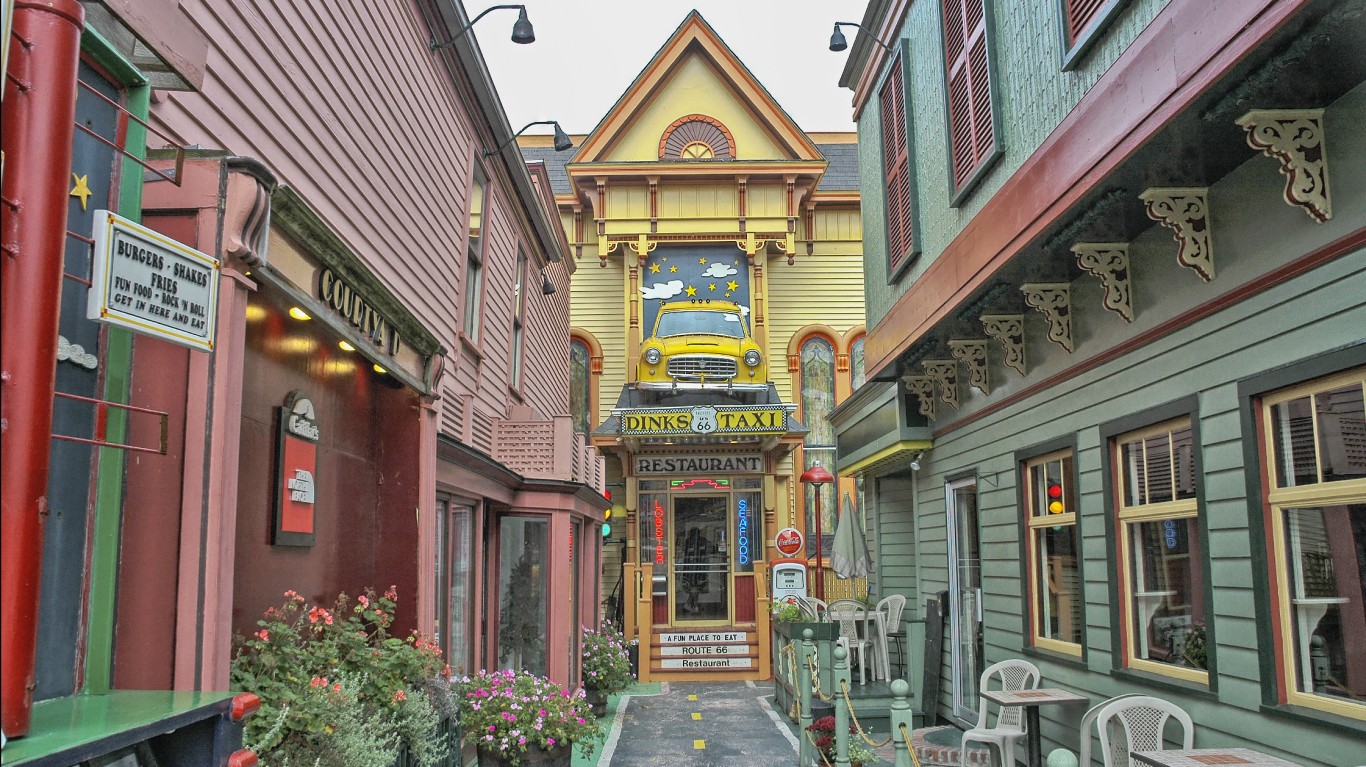
13. Maine
> Adults drinking excessively: 20.2% (US share: 19.0%)
>Pct. driving deaths that are alcohol related: 36.7% — 5th highest (US share: 27.8%)
> Adults in poor of fair health: 15.0% — 16th lowest (US share: 17.2%)
> Poverty rate: 10.9% — 19th lowest (US rate: 12.3%)
> Drunkest metro area in Maine: Portland-South Portland
> Adults drinking excessively in Portland-South Portland: 22.1% (38th highest among all 384 metro areas)
> Drunkest county in Maine: Cumberland
> Adults drinking excessively in Cumberland: 22.8% (144th highest among all 3,142 counties)
12. Colorado
> Adults drinking excessively: 20.5% (US share: 19.0%)
>Pct. driving deaths that are alcohol related: 34.1% — 10th highest (US share: 27.8%)
> Adults in poor of fair health: 14.5% — 10th lowest (US share: 17.2%)
> Poverty rate: 9.3% — 7th lowest (US rate: 12.3%)
> Drunkest metro area in Colorado: Fort Collins
> Adults drinking excessively in Fort Collins: 22.0% (39th highest among all 384 metro areas)
> Drunkest county in Colorado: Denver
> Adults drinking excessively in Denver: 26.6% (18th highest among all 3,142 counties)
[in-text-ad-2]
11. New Hampshire
> Adults drinking excessively: 20.7% (US share: 19.0%)
>Pct. driving deaths that are alcohol related: 30.5% — 21st highest (US share: 27.8%)
> Adults in poor of fair health: 13.1% — 3rd lowest (US share: 17.2%)
> Poverty rate: 7.3% — the lowest (US rate: 12.3%)
> Drunkest metro area in New Hampshire: Manchester
> Adults drinking excessively in Manchester: 20.2% (91st highest among all 384 metro areas)
> Drunkest county in New Hampshire: Strafford
> Adults drinking excessively in Strafford: 21.6% (279th highest among all 3,142 counties)
10. Montana
> Adults drinking excessively: 20.9% (US share: 19.0%)
>Pct. driving deaths that are alcohol related: 45.1% — the highest (US share: 27.8%)
> Adults in poor of fair health: 14.7% — 13th lowest (US share: 17.2%)
> Poverty rate: 12.6% — 20th highest (US rate: 12.3%)
> Drunkest metro area in Montana: Missoula
> Adults drinking excessively in Missoula: 25.3% (10th highest among all 384 metro areas)
> Drunkest county in Montana: Gallatin
> Adults drinking excessively in Gallatin: 26.8% (15th highest among all 3,142 counties)
[in-text-ad]
9. Hawaii
> Adults drinking excessively: 21.1% (US share: 19.0%)
>Pct. driving deaths that are alcohol related: 31.2% — 18th highest (US share: 27.8%)
> Adults in poor of fair health: 14.2% — 7th lowest (US share: 17.2%)
> Poverty rate: 9.3% — 6th lowest (US rate: 12.3%)
> Drunkest metro area in Hawaii: Kahului-Wailuku-Lahaina
> Adults drinking excessively in Kahului-Wailuku-Lahaina: 21.1% (62nd highest among all 384 metro areas)
> Drunkest county in Hawaii: Kauai
> Adults drinking excessively in Kauai: 21.6% (265th highest among all 3,142 counties)
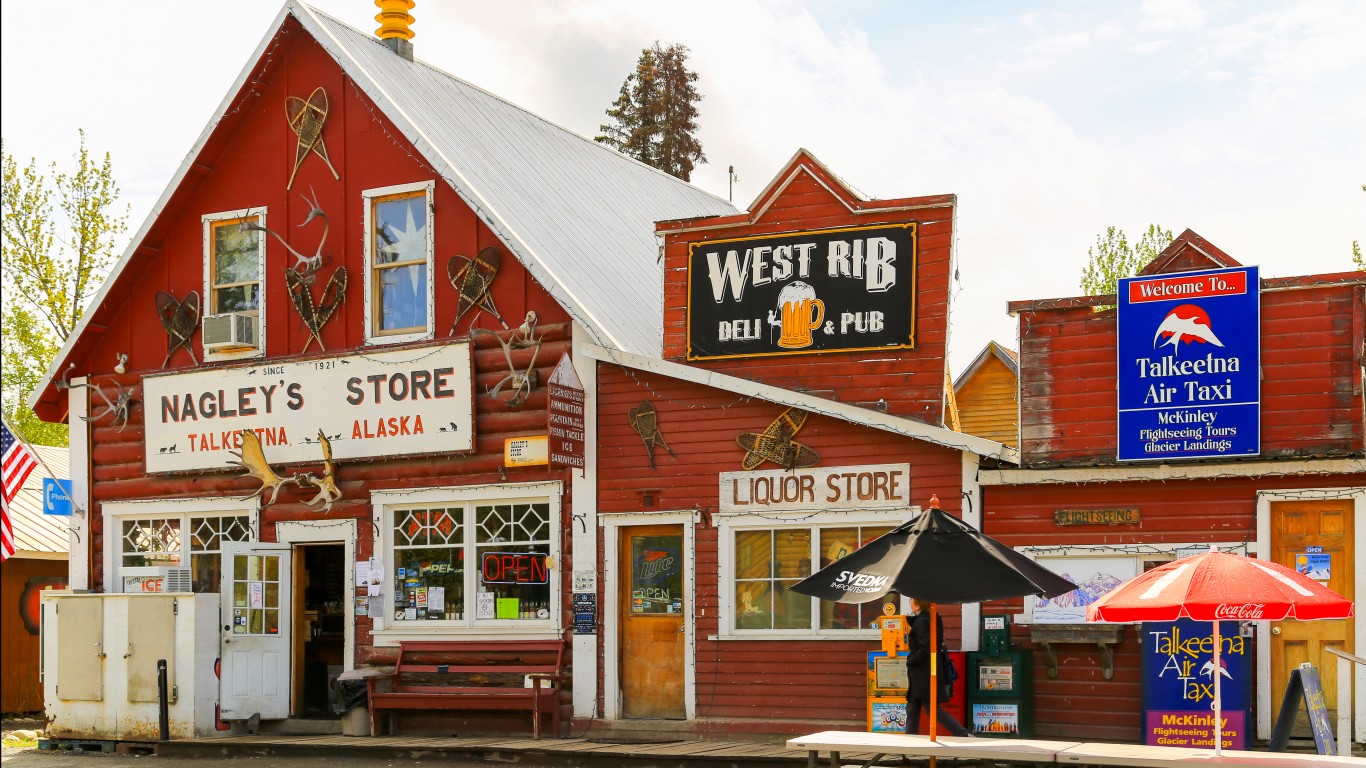
8. Alaska
> Adults drinking excessively: 21.3% (US share: 19.0%)
>Pct. driving deaths that are alcohol related: 38.1% — 3rd highest (US share: 27.8%)
> Adults in poor of fair health: 18.1% — 16th highest (US share: 17.2%)
> Poverty rate: 10.1% — 13th lowest (US rate: 12.3%)
> Drunkest metro area in Alaska: Fairbanks
> Adults drinking excessively in Fairbanks: 22.8% (31st highest among all 384 metro areas)
> Drunkest county in Alaska: Valdez-Cordova
> Adults drinking excessively in Valdez-Cordova: 24.6% (58th highest among all 3,142 counties)
7. Massachusetts
> Adults drinking excessively: 21.3% (US share: 19.0%)
>Pct. driving deaths that are alcohol related: 30.0% — 25th lowest (US share: 27.8%)
> Adults in poor of fair health: 14.4% — 8th lowest (US share: 17.2%)
> Poverty rate: 9.4% — 8th lowest (US rate: 12.3%)
> Drunkest metro area in Massachusetts: Boston-Cambridge-Nashua
> Adults drinking excessively in Boston-Cambridge-Nashua: 22.2% (36th highest among all 384 metro areas)
> Drunkest county in Massachusetts: Suffolk
> Adults drinking excessively in Suffolk: 24.4% (70th highest among all 3,142 counties)
[in-text-ad-2]
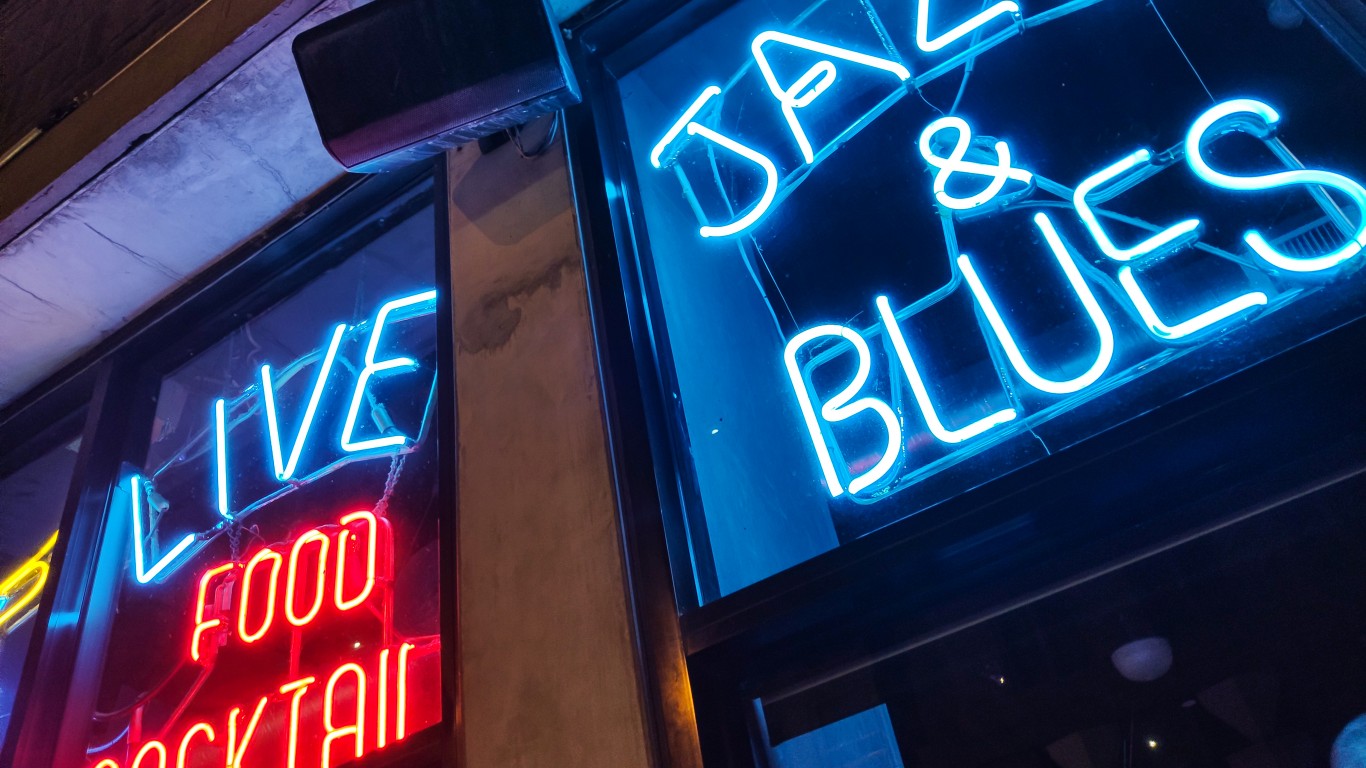
6. Illinois
> Adults drinking excessively: 21.4% (US share: 19.0%)
>Pct. driving deaths that are alcohol related: 31.9% — 17th highest (US share: 27.8%)
> Adults in poor of fair health: 17.2% — 25th lowest (US share: 17.2%)
> Poverty rate: 11.5% — 25th lowest (US rate: 12.3%)
> Drunkest metro area in Illinois: Bloomington
> Adults drinking excessively in Bloomington: 21.8% (44th highest among all 384 metro areas)
> Drunkest county in Illinois: Clinton
> Adults drinking excessively in Clinton: 23.2% (118th highest among all 3,142 counties)
5. Minnesota
> Adults drinking excessively: 21.7% (US share: 19.0%)
>Pct. driving deaths that are alcohol related: 30.0% — 25th highest (US share: 27.8%)
> Adults in poor of fair health: 12.1% — the lowest (US share: 17.2%)
> Poverty rate: 9.0% — 3rd lowest (US rate: 12.3%)
> Drunkest metro area in Minnesota: Mankato-North Mankato
> Adults drinking excessively in Mankato-North Mankato: 24.4% (14th highest among all 384 metro areas)
> Drunkest county in Minnesota: Chisago
> Adults drinking excessively in Chisago: 25.1% (41st highest among all 3,142 counties)
[in-text-ad]
4. Nebraska
> Adults drinking excessively: 21.7% (US share: 19.0%)
>Pct. driving deaths that are alcohol related: 34.0% — 11th highest (US share: 27.8%)
> Adults in poor of fair health: 14.4% — 9th lowest (US share: 17.2%)
> Poverty rate: 9.9% — 10th lowest (US rate: 12.3%)
> Drunkest metro area in Nebraska: Lincoln
> Adults drinking excessively in Lincoln: 25.0% (12th highest among all 384 metro areas)
> Drunkest county in Nebraska: Lancaster
> Adults drinking excessively in Lancaster: 25.1% (39th highest among all 3,142 counties)

3. Iowa
> Adults drinking excessively: 22.1% (US share: 19.0%)
>Pct. driving deaths that are alcohol related: 26.9% — 16th lowest (US share: 27.8%)
> Adults in poor of fair health: 14.5% — 11th lowest (US share: 17.2%)
> Poverty rate: 11.2% — 20th lowest (US rate: 12.3%)
> Drunkest metro area in Iowa: Dubuque
> Adults drinking excessively in Dubuque: 24.0% (21st highest among all 384 metro areas)
> Drunkest county in Iowa: Johnson
> Adults drinking excessively in Johnson: 24.6% (61st highest among all 3,142 counties)
2. North Dakota
> Adults drinking excessively: 24.1% (US share: 19.0%)
>Pct. driving deaths that are alcohol related: 43.2% — 2nd highest (US share: 27.8%)
> Adults in poor of fair health: 15.1% — 17th lowest (US share: 17.2%)
> Poverty rate: 10.6% — 17th lowest (US rate: 12.3%)
> Drunkest metro area in North Dakota: Fargo
> Adults drinking excessively in Fargo: 25.1% (11th highest among all 384 metro areas)
> Drunkest county in North Dakota: Williams
> Adults drinking excessively in Williams: 26.3% (20th highest among all 3,142 counties)
[in-text-ad-2]
1. Wisconsin
> Adults drinking excessively: 24.2% (US share: 19.0%)
>Pct. driving deaths that are alcohol related: 36.2% — 6th highest (US share: 27.8%)
> Adults in poor of fair health: 16.7% — 23rd lowest (US share: 17.2%)
> Poverty rate: 10.4% — 16th lowest (US rate: 12.3%)
> Drunkest metro area in Wisconsin: Madison
> Adults drinking excessively in Madison: 27.8% (the highest among all 384 metro areas)
> Drunkest county in Wisconsin: Pierce
> Adults drinking excessively in Pierce: 28.6% (the highest among all 3,142 counties)
Take Charge of Your Retirement: Find the Right Financial Advisor For You in Minutes (Sponsor)
Retirement planning doesn’t have to feel overwhelming. The key is finding professional guidance—and we’ve made it easier than ever for you to connect with the right financial advisor for your unique needs.
Here’s how it works:
1️ Answer a Few Simple Questions
Tell us a bit about your goals and preferences—it only takes a few minutes!
2️ Get Your Top Advisor Matches
This tool matches you with qualified advisors who specialize in helping people like you achieve financial success.
3️ Choose Your Best Fit
Review their profiles, schedule an introductory meeting, and select the advisor who feels right for you.
Why wait? Start building the retirement you’ve always dreamed of. Click here to get started today!
Thank you for reading! Have some feedback for us?
Contact the 24/7 Wall St. editorial team.
 24/7 Wall St.
 24/7 Wall St.
 24/7 Wall St.
 24/7 Wall St.



 24/7 Wall St.
