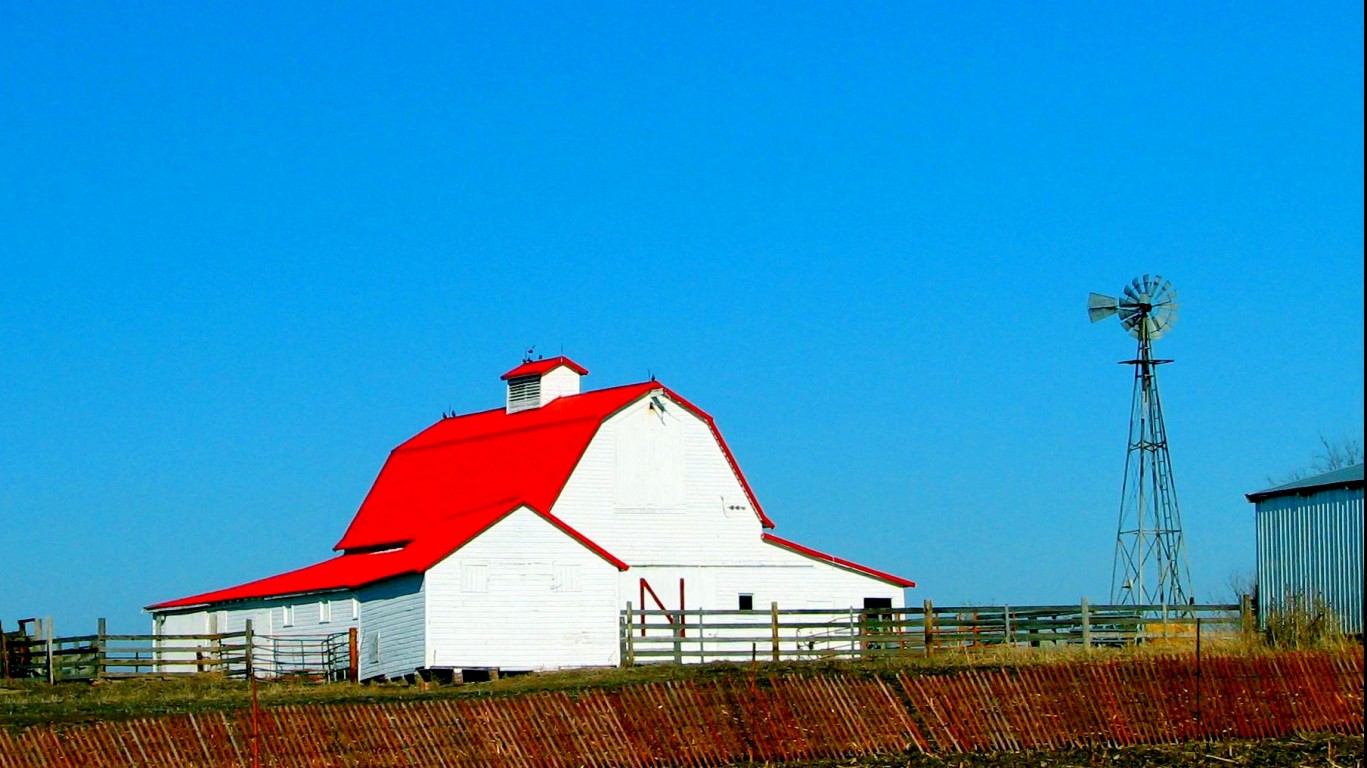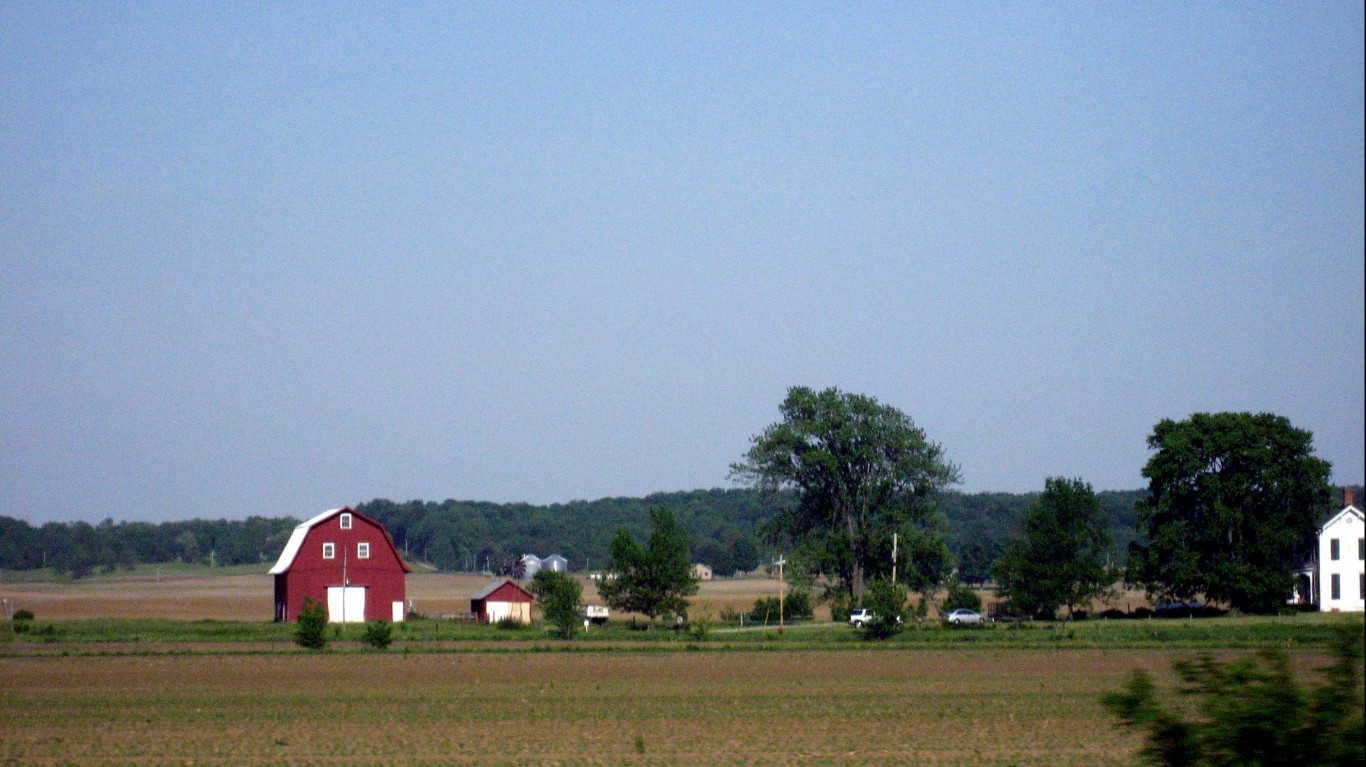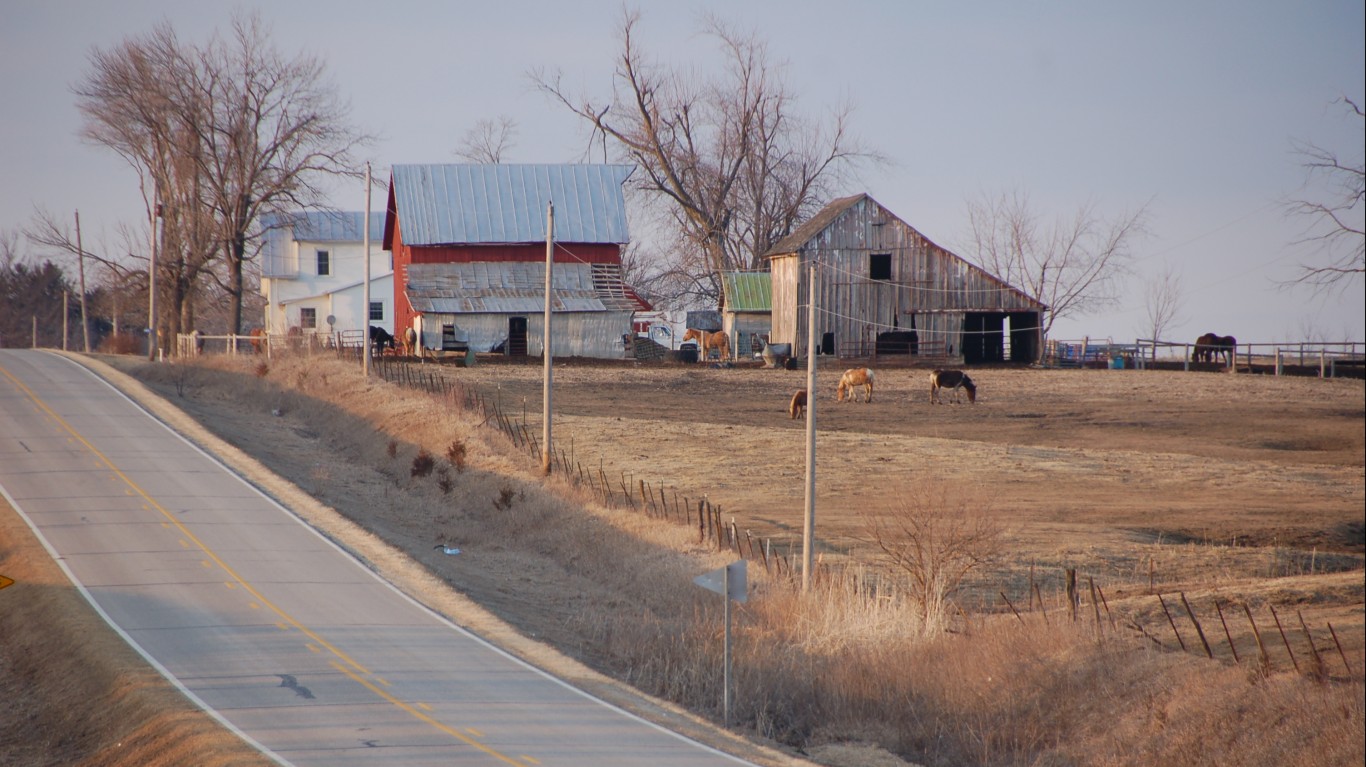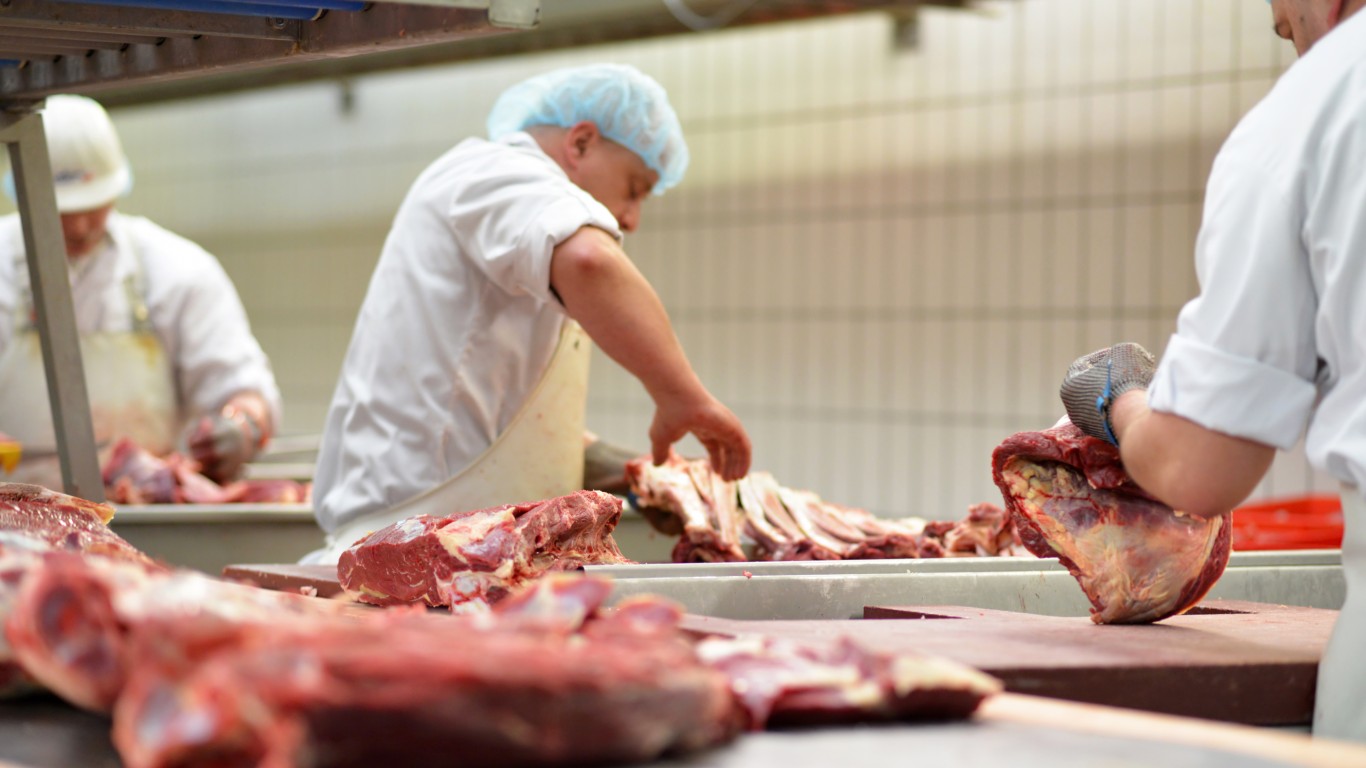
The United States is the world’s third-largest producer and consumer of pork and pork products, according to the USDA Economic Research Service’s report on hogs and pork. Country by country, however, we’re the second-largest, because the USDA and other agencies that record such data list the European Union — an agglomeration of 28 nations — as number two.
Number one? As the trade publication National Hog Farmer puts it, “China has probably been the world’s largest pork-producing country for as long as China has been a country.” (In 2018, it accounted for 48% of the world’s pork production.) The Chinese also consume almost two-and-a-half times what the entire EU does and more than five times what we Americans manage to eat.
Per capita pork consumption in the U.S. has grown from 49.9 pounds in 2015 to 52.1 pounds last year. Industry analysts suggest that the ever-increasing popularity of Asian and Latin American cuisines, in which pork is frequently a centerpiece, might be contributing to the rise. The never-ending bacon “trend” probably contributes, too.
The country’s largest pork producer by far is Iowa, responsible for some 14.46 billion pounds in 2019 — roughly three times what the number-two state, Minnesota, Iowa’s northern neighbor, manages. (It may or may not be coincidental that Iowa records the seventh-highest adult obesity rate in the country, according to 24/7 Wall St.’s special report on the healthiest states in America.)
As is the case with beef, tiny Rhode Island — our smallest state — takes last place in production, accounting for a total of only 638,000 pounds of pork in 2019.
Click here to see the state first in the nation for hog production.

50. Rhode Island
> Hog production 2019: 638,000 pounds ($322,000)
> 1-year change in hog production: 20.4% — 13th largest increase
> 1-year change in hog sales: 13.0% — 16th largest increase
[in-text-ad]

49. Nevada
> Hog production 2019: 648,000 pounds ($530,000)
> 1-year change in hog production: -16.3% — the largest decline
> 1-year change in hog sales: 153.6% — largest increase

48. Louisiana
> Hog production 2019: 919,000 pounds ($689,000)
> 1-year change in hog production: -35.5% — 2nd largest decline
> 1-year change in hog sales: -26.4% — 5th largest decline

47. New Mexico
> Hog production 2019: 957,000 pounds ($614,000)
> 1-year change in hog production: -8.5% — 9th largest decline
> 1-year change in hog sales: -16.1% — 6th largest decline
[in-text-ad-2]

46. Alaska
> Hog production 2019: 982,000 pounds ($615,000)
> 1-year change in hog production: 26.1% — 9th largest increase
> 1-year change in hog sales: 42.0% — 3rd largest increase

45. New Jersey
> Hog production 2019: 1.0 million pounds ($743,000)
> 1-year change in hog production: 22.8% — 11th largest increase
> 1-year change in hog sales: 7.4% — 22nd largest increase
[in-text-ad]

44. Hawaii
> Hog production 2019: 1.0 million pounds ($478,000)
> 1-year change in hog production: -16.5% — 5th largest decline
> 1-year change in hog sales: -28.1% — 3rd largest decline

43. Connecticut
> Hog production 2019: 1.4 million pounds ($693,000)
> 1-year change in hog production: 63.4% — 2nd largest increase
> 1-year change in hog sales: 54.0% — 2nd largest increase

42. New York
> Hog production 2019: 1.4 million pounds ($6.4 million)
> 1-year change in hog production: -84.4% — the largest decline
> 1-year change in hog sales: -3.4% — 15th largest decline
[in-text-ad-2]

41. Maine
> Hog production 2019: 1.4 million pounds ($792,000)
> 1-year change in hog production: -30.5% — the largest decline
> 1-year change in hog sales: -29.1% — 2nd largest decline
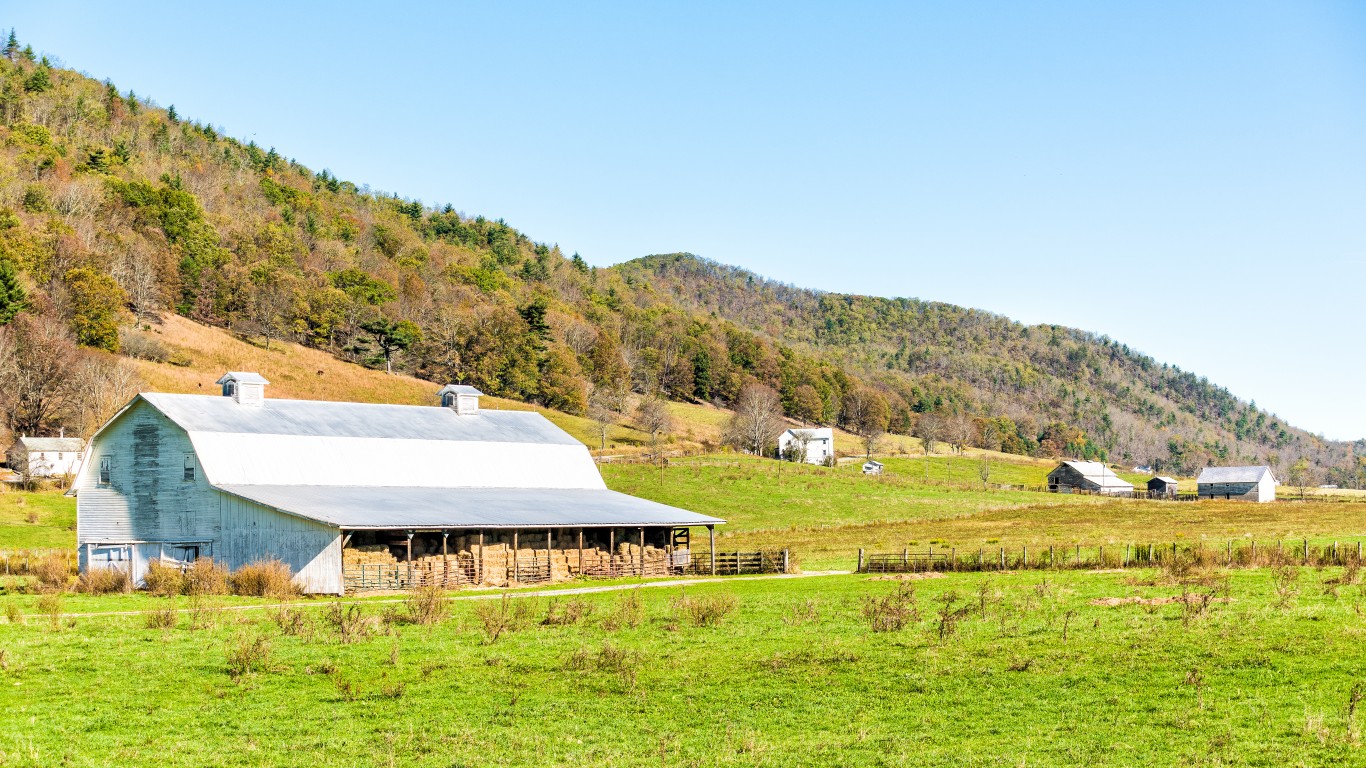
40. West Virginia
> Hog production 2019: 1.5 million pounds ($885,000)
> 1-year change in hog production: 4.7% — 26th largest increase
> 1-year change in hog sales: -1.3% — 17th largest decline
[in-text-ad]

39. Vermont
> Hog production 2019: 1.6 million pounds ($867,000)
> 1-year change in hog production: -27.5% — 4th largest decline
> 1-year change in hog sales: -26.9% — 4th largest decline
38. New Hampshire
> Hog production 2019: 1.7 million pounds ($883,000)
> 1-year change in hog production: -0.7% — 12th largest decline
> 1-year change in hog sales: -6.0% — 12th largest decline

37. Oregon
> Hog production 2019: 2.2 million pounds ($1.2 million)
> 1-year change in hog production: -33.1% — 3rd largest decline
> 1-year change in hog sales: -38.1% — the largest decline
[in-text-ad-2]
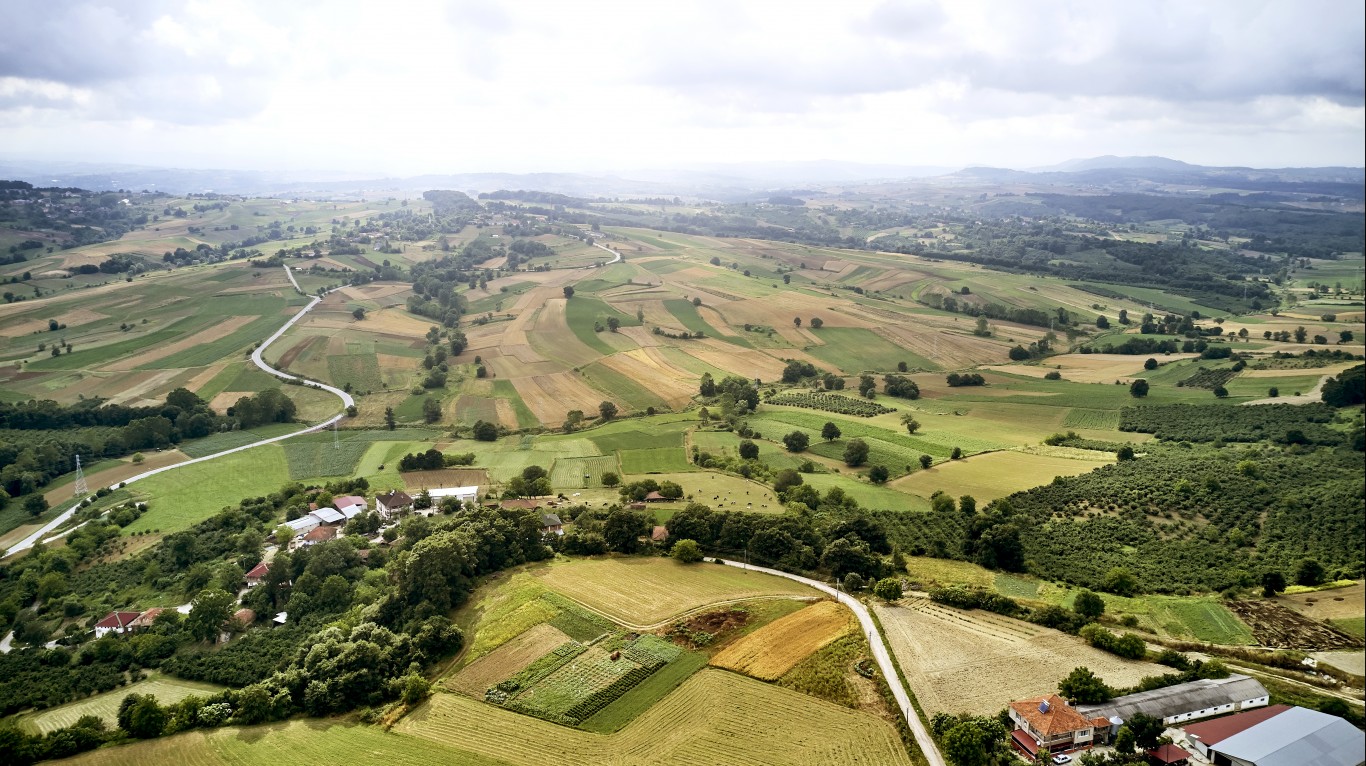
36. Massachusetts
> Hog production 2019: 3.2 million pounds ($1.7 million)
> 1-year change in hog production: -12.3% — the largest decline
> 1-year change in hog sales: -13.9% — 7th largest decline

35. Florida
> Hog production 2019: 3.7 million pounds ($2.4 million)
> 1-year change in hog production: 9.3% — 20th largest increase
> 1-year change in hog sales: 21.6% — 12th largest increase
[in-text-ad]

34. Washington
> Hog production 2019: 6.7 million pounds ($4.0 million)
> 1-year change in hog production: -12.0% — 8th largest decline
> 1-year change in hog sales: -8.5% — 11th largest decline
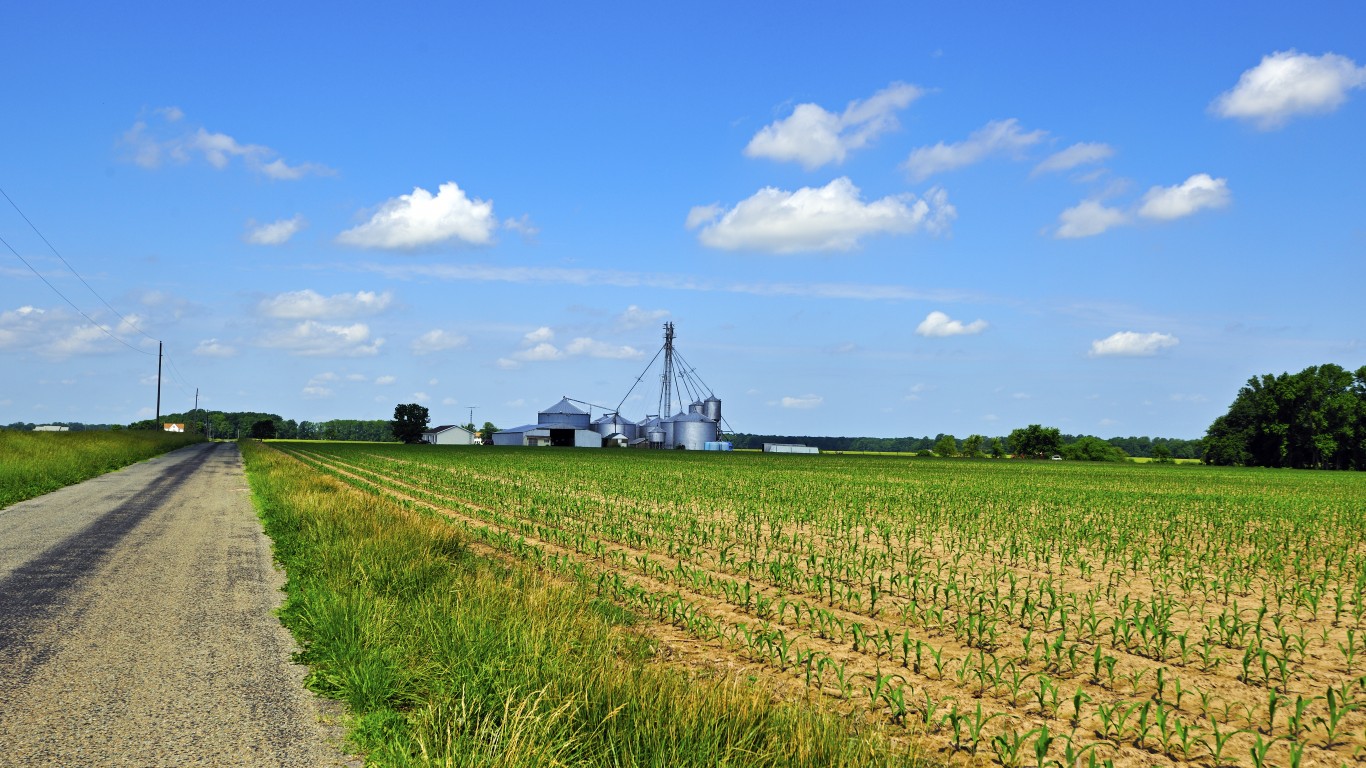
33. Delaware
> Hog production 2019: 9.9 million pounds ($5.1 million)
> 1-year change in hog production: 32.4% — 5th largest increase
> 1-year change in hog sales: 31.2% — 7th largest increase

32. Maryland
> Hog production 2019: 9.9 million pounds ($5.9 million)
> 1-year change in hog production: -12.8% — 7th largest decline
> 1-year change in hog sales: -13.3% — 8th largest decline
[in-text-ad-2]
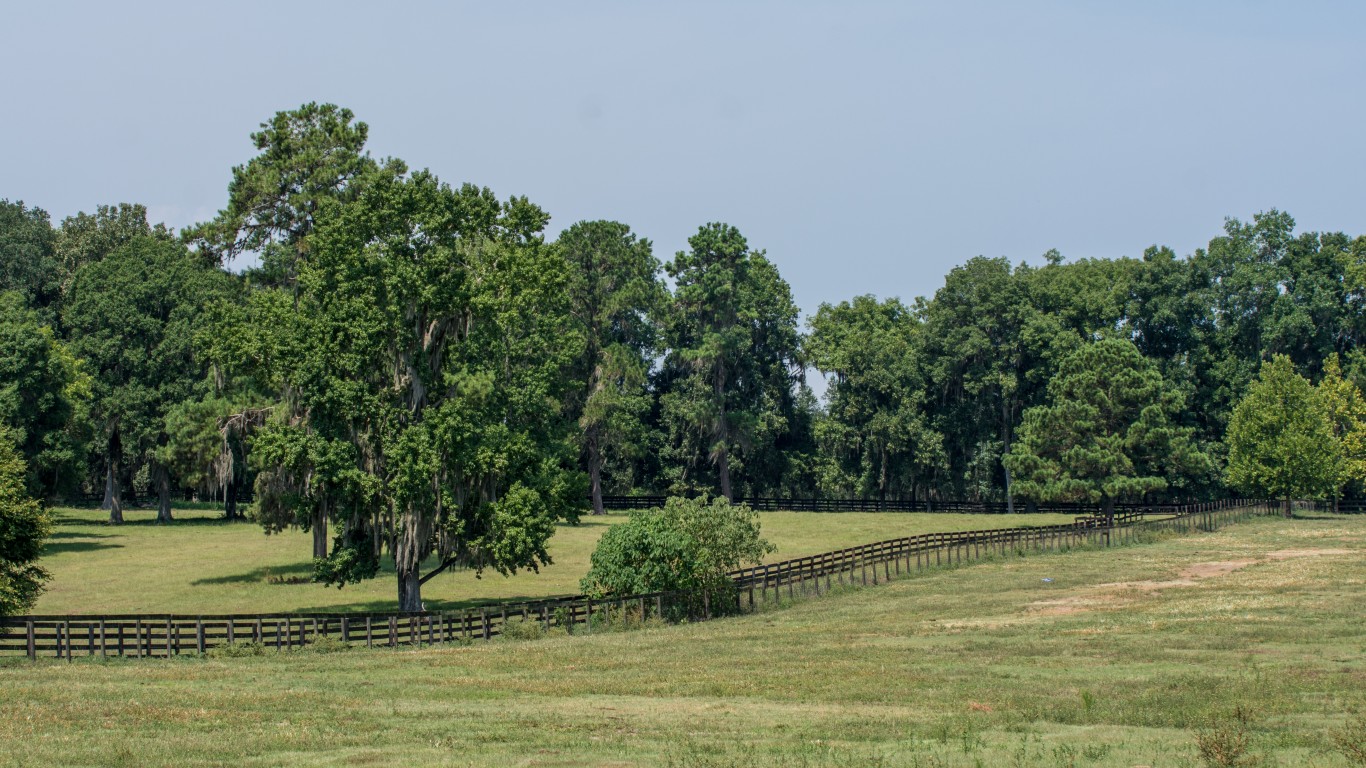
31. Alabama
> Hog production 2019: 28.0 million pounds ($18.4 million)
> 1-year change in hog production: -6.5% — 10th largest decline
> 1-year change in hog sales: -10.6% — 9th largest decline
30. Idaho
> Hog production 2019: 28.3 million pounds ($17.3 million)
> 1-year change in hog production: 3.7% — 27th largest increase
> 1-year change in hog sales: 5.6% — 26th largest increase
[in-text-ad]
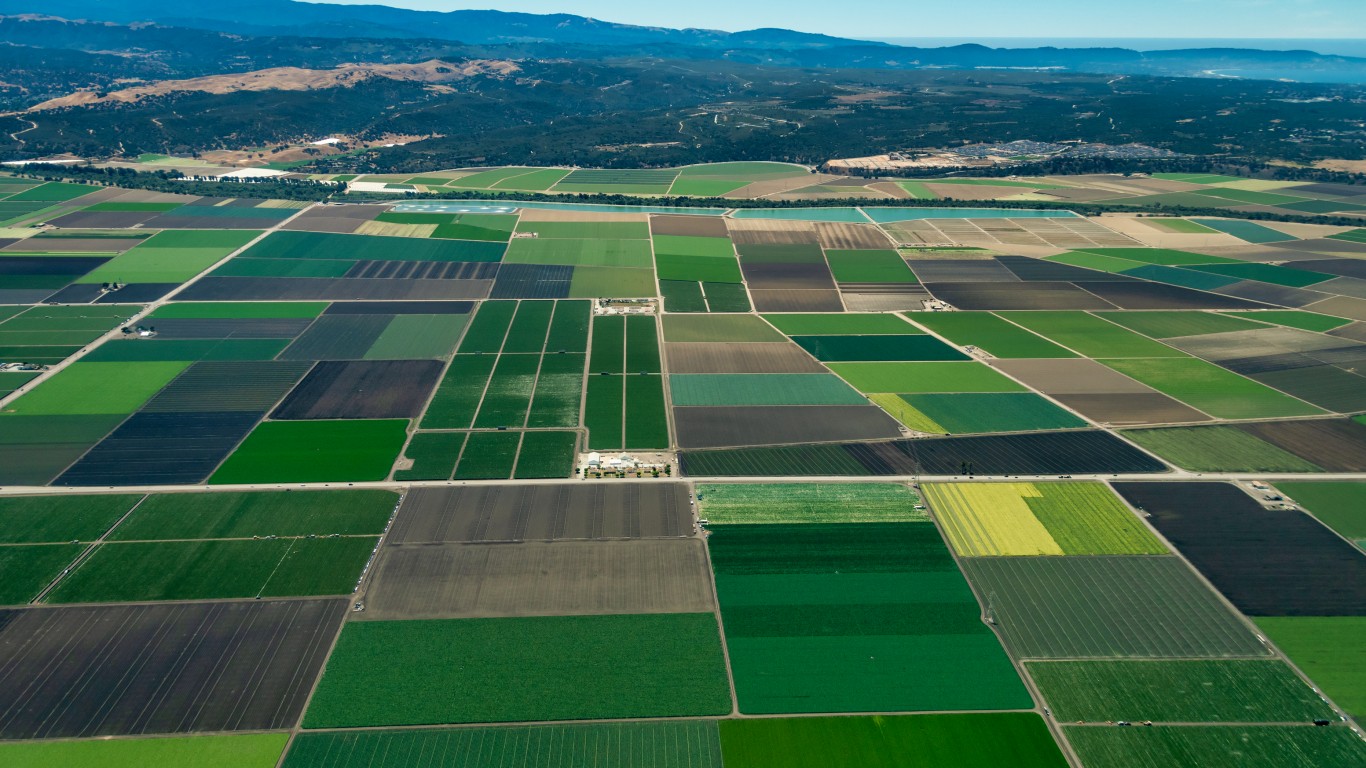
29. California
> Hog production 2019: 39.8 million pounds ($27.2 million)
> 1-year change in hog production: -6.3% — 11th largest decline
> 1-year change in hog sales: -3.1% — 16th largest decline
28. South Carolina
> Hog production 2019: 40.1 million pounds ($24.1 million)
> 1-year change in hog production: 13.5% — 15th largest increase
> 1-year change in hog sales: 33.8% — 6th largest increase
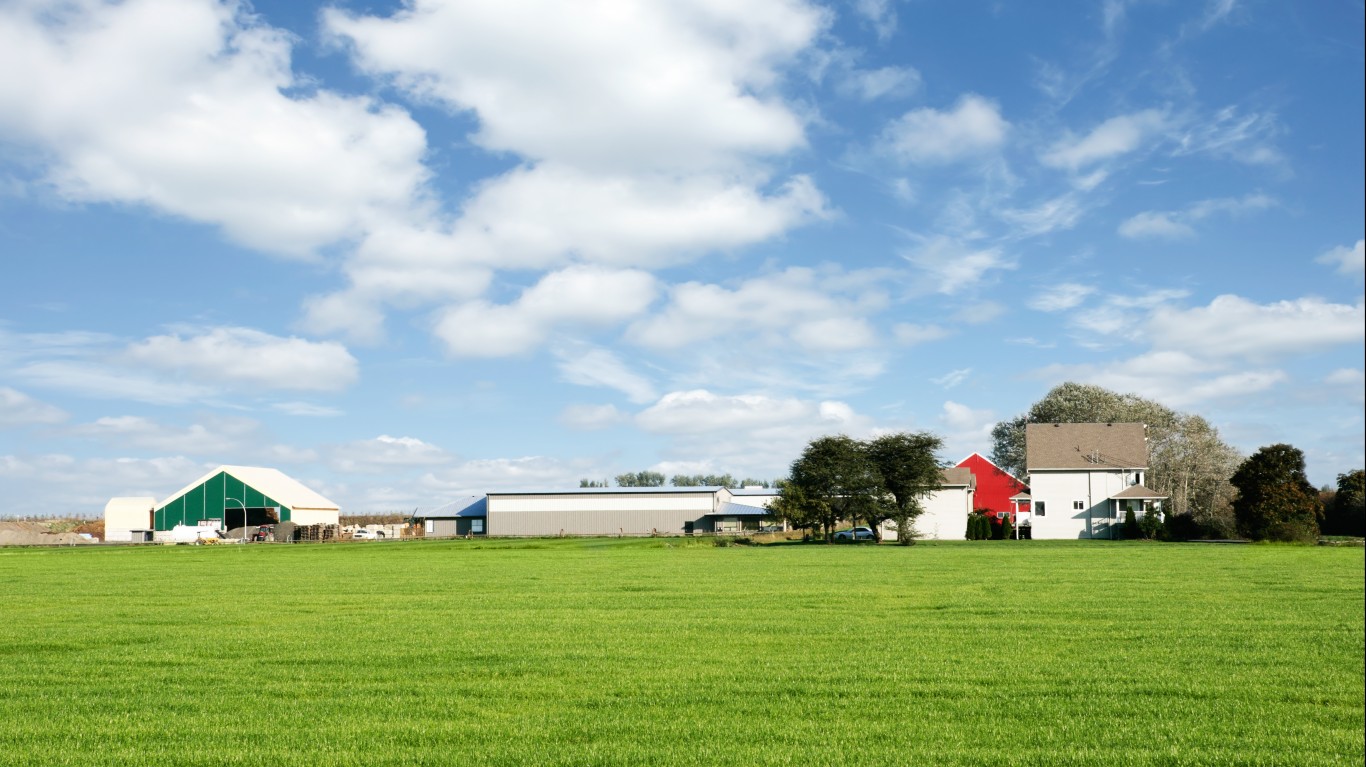
27. North Dakota
> Hog production 2019: 44.9 million pounds ($60.7 million)
> 1-year change in hog production: -4.0% — the largest decline
> 1-year change in hog sales: 6.9% — 24th largest increase
[in-text-ad-2]
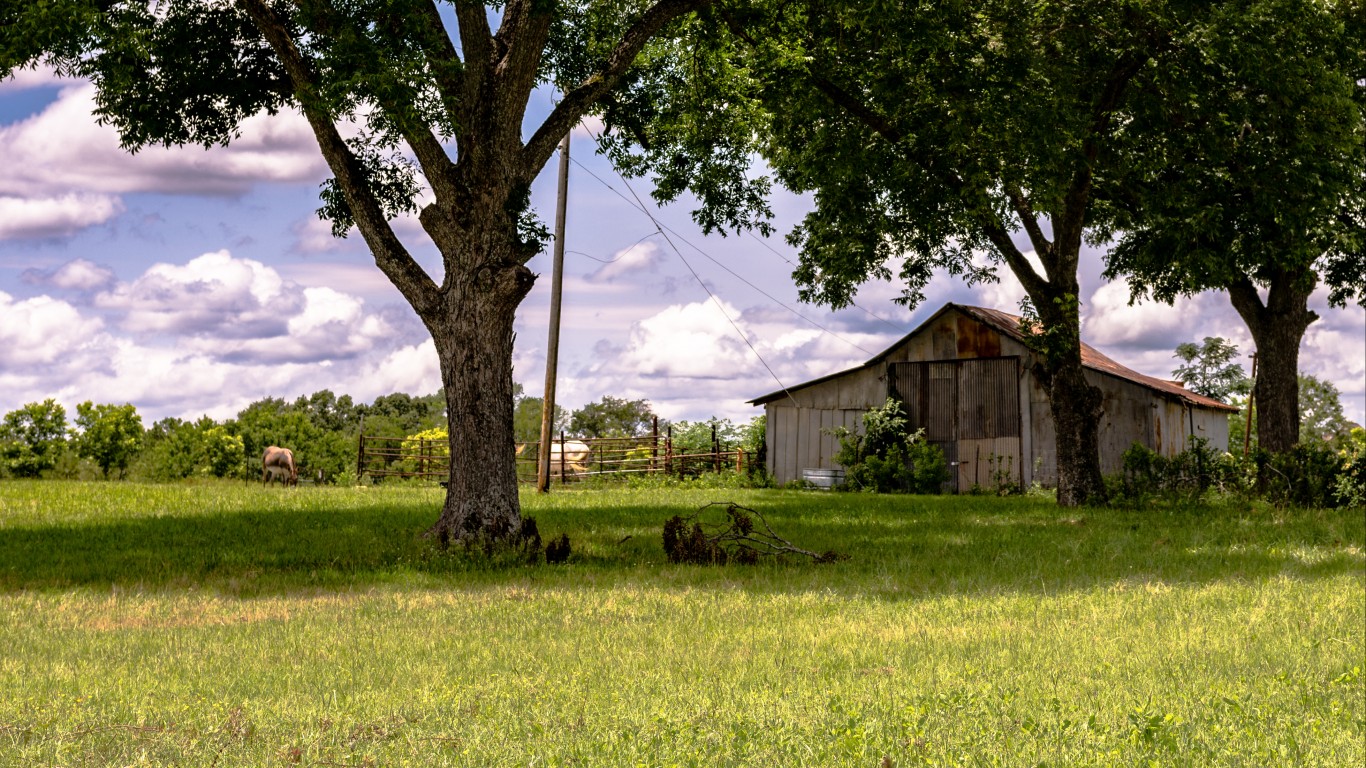
26. Georgia
> Hog production 2019: 58.0 million pounds ($36.8 million)
> 1-year change in hog production: -13.0% — 6th largest decline
> 1-year change in hog sales: -9.1% — 10th largest decline

25. Mississippi
> Hog production 2019: 61.3 million pounds ($41.8 million)
> 1-year change in hog production: 451.3% — the largest increase
> 1-year change in hog sales: 7.7% — 21st largest increase
[in-text-ad]
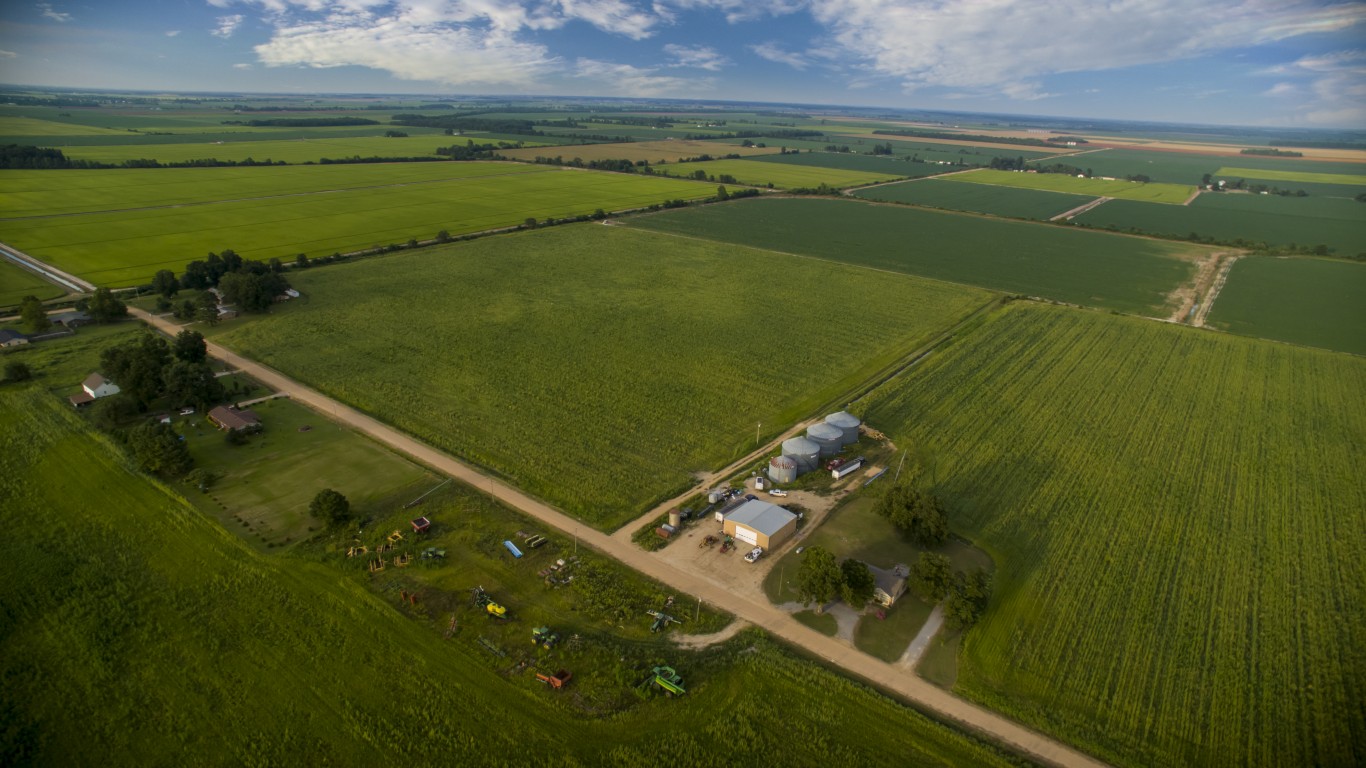
24. Arkansas
> Hog production 2019: 65.2 million pounds ($57.4 million)
> 1-year change in hog production: -7.2% — the largest decline
> 1-year change in hog sales: -4.3% — 13th largest decline
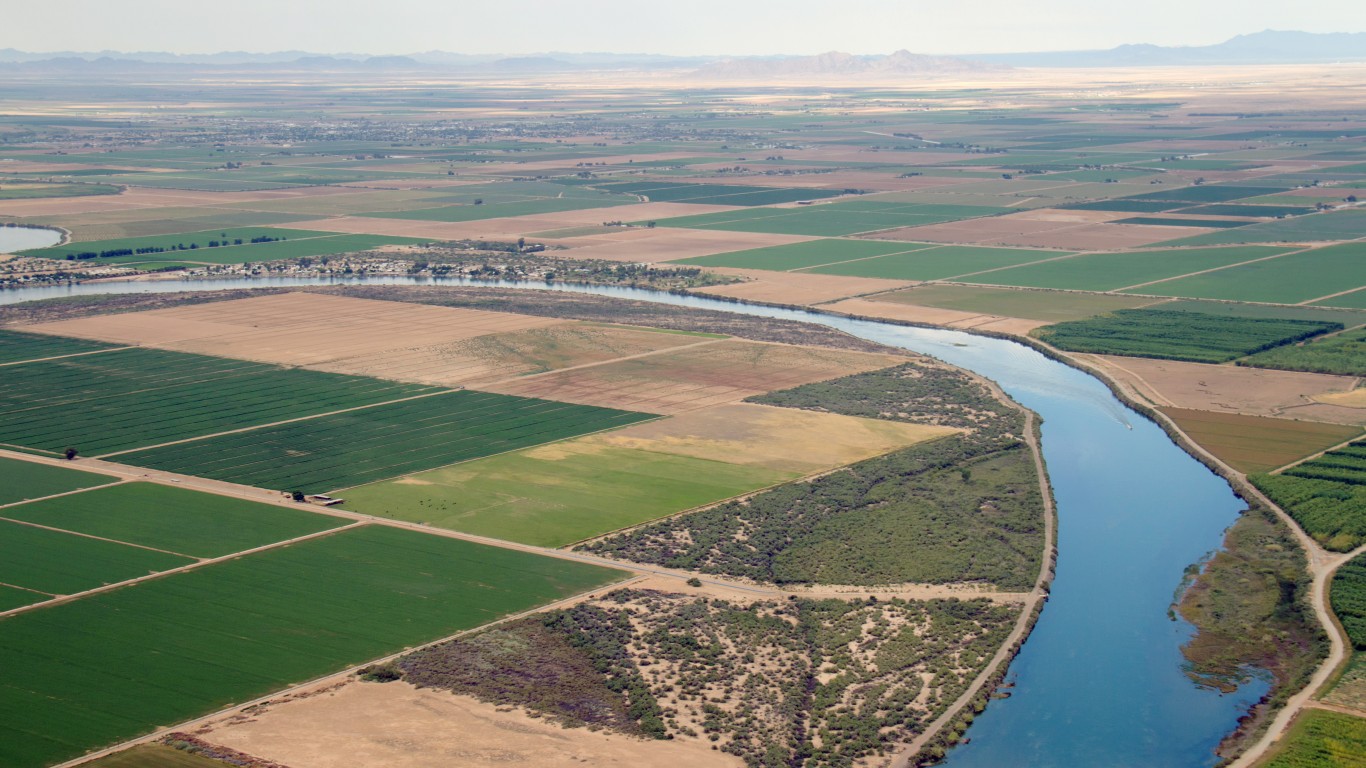
23. Arizona
> Hog production 2019: 67.7 million pounds ($40.9 million)
> 1-year change in hog production: 1.8% — 31st largest increase
> 1-year change in hog sales: 10.2% — 18th largest increase

22. Wyoming
> Hog production 2019: 108.8 million pounds ($65.7 million)
> 1-year change in hog production: 11.0% — 16th largest increase
> 1-year change in hog sales: 14.4% — 15th largest increase
[in-text-ad-2]
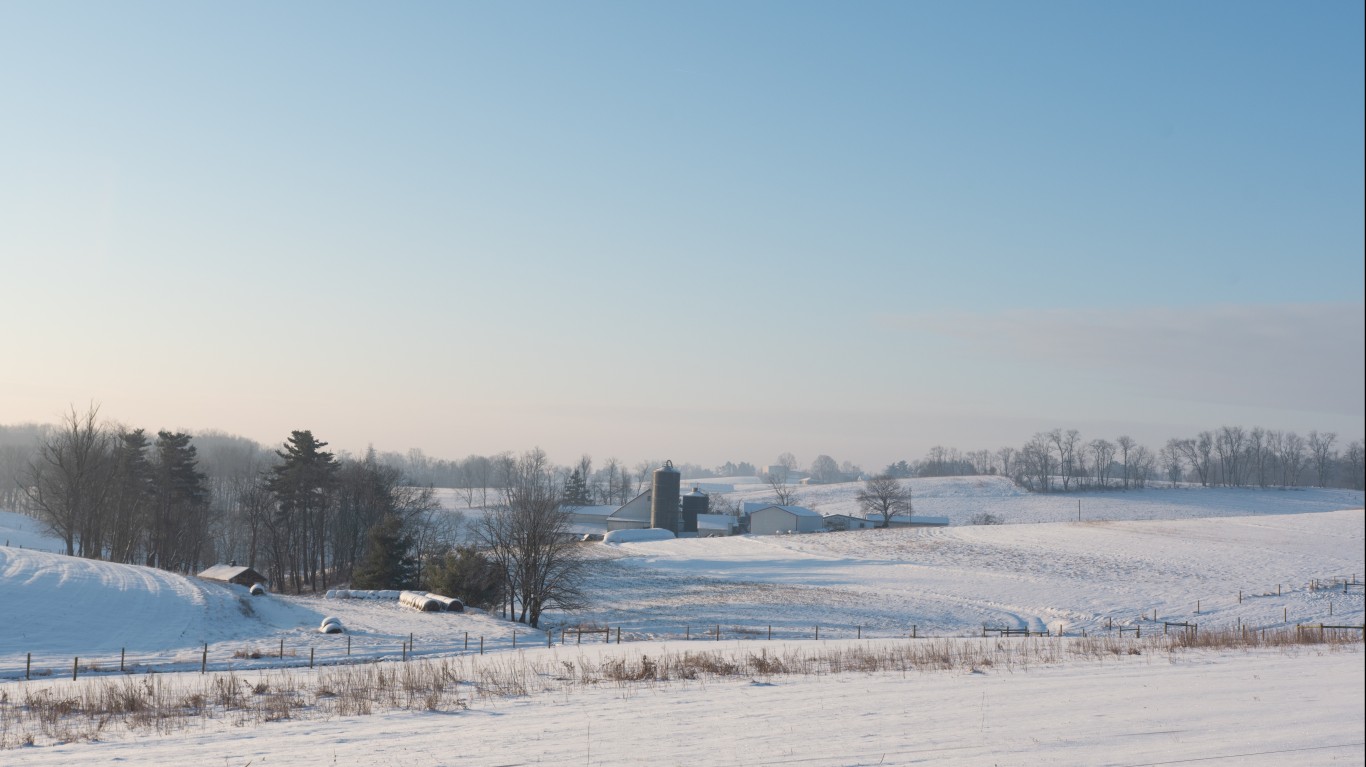
21. Virginia
> Hog production 2019: 109.5 million pounds ($61.9 million)
> 1-year change in hog production: 26.4% — 8th largest increase
> 1-year change in hog sales: 40.0% — 4th largest increase
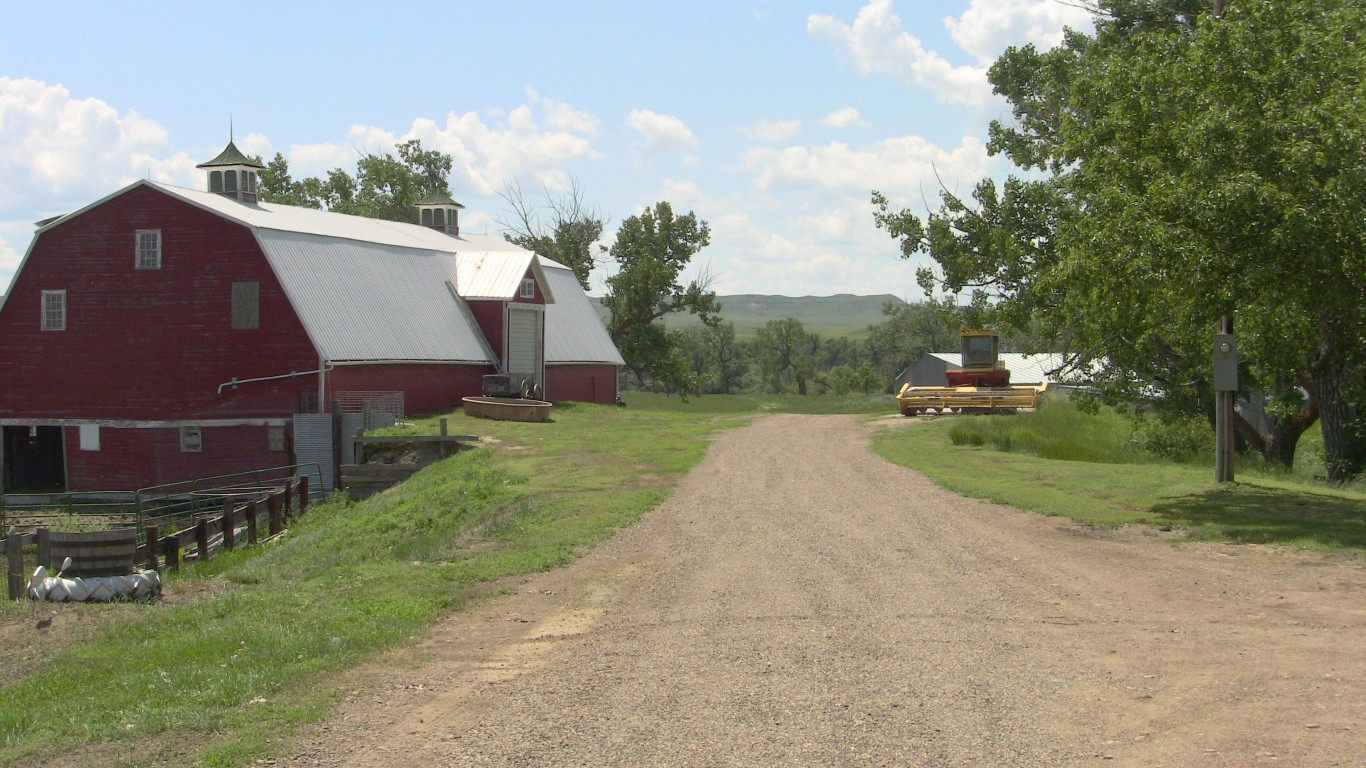
20. Montana
> Hog production 2019: 120.6 million pounds ($70.3 million)
> 1-year change in hog production: 21.2% — 12th largest increase
> 1-year change in hog sales: 22.8% — 11th largest increase
[in-text-ad]

19. Tennessee
> Hog production 2019: 160.4 million pounds ($89.5 million)
> 1-year change in hog production: 8.0% — 22nd largest increase
> 1-year change in hog sales: 11.9% — 17th largest increase
18. Kentucky
> Hog production 2019: 195.0 million pounds ($115.6 million)
> 1-year change in hog production: 9.5% — 19th largest increase
> 1-year change in hog sales: -4.2% — 14th largest decline
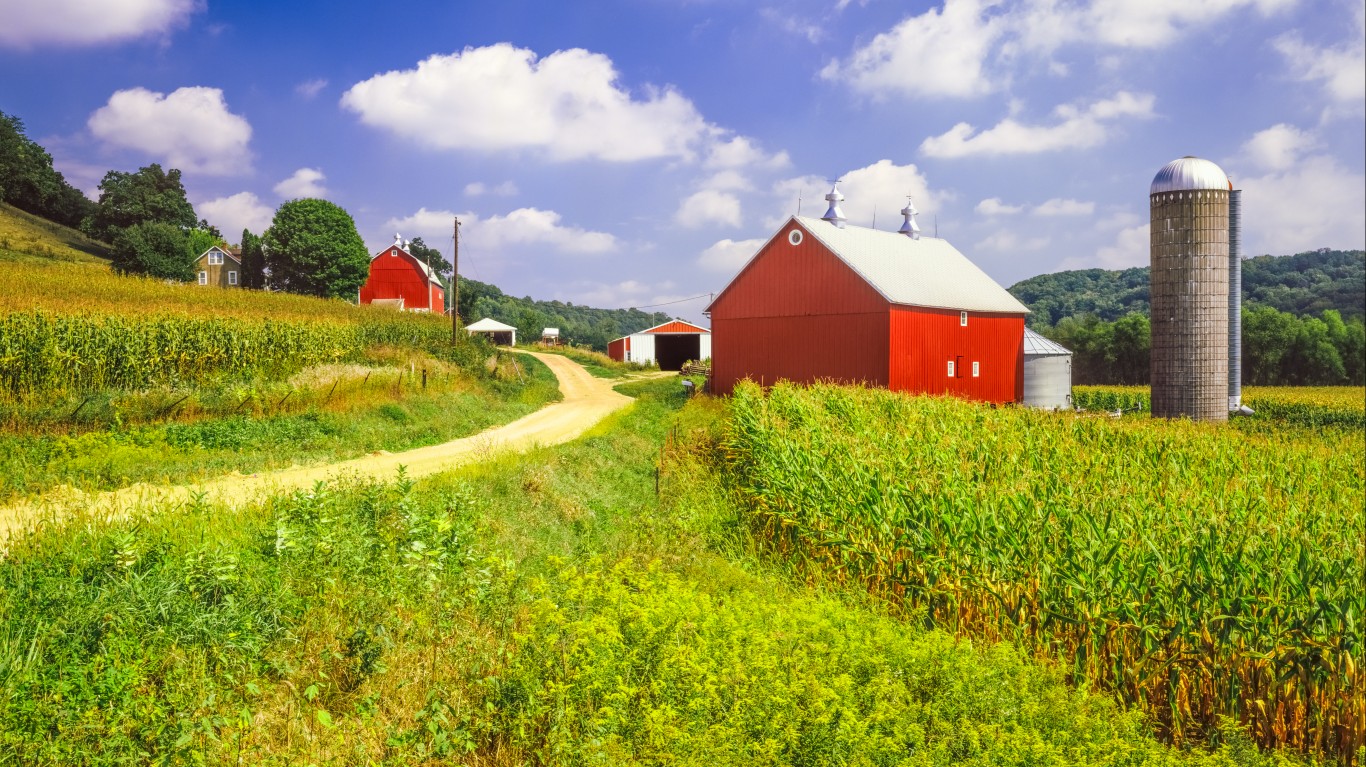
17. Wisconsin
> Hog production 2019: 218.4 million pounds ($150.7 million)
> 1-year change in hog production: 28.2% — 7th largest increase
> 1-year change in hog sales: 24.4% — 10th largest increase
[in-text-ad-2]
16. Utah
> Hog production 2019: 292.4 million pounds ($166.4 million)
> 1-year change in hog production: 36.9% — 4th largest increase
> 1-year change in hog sales: 34.2% — 5th largest increase
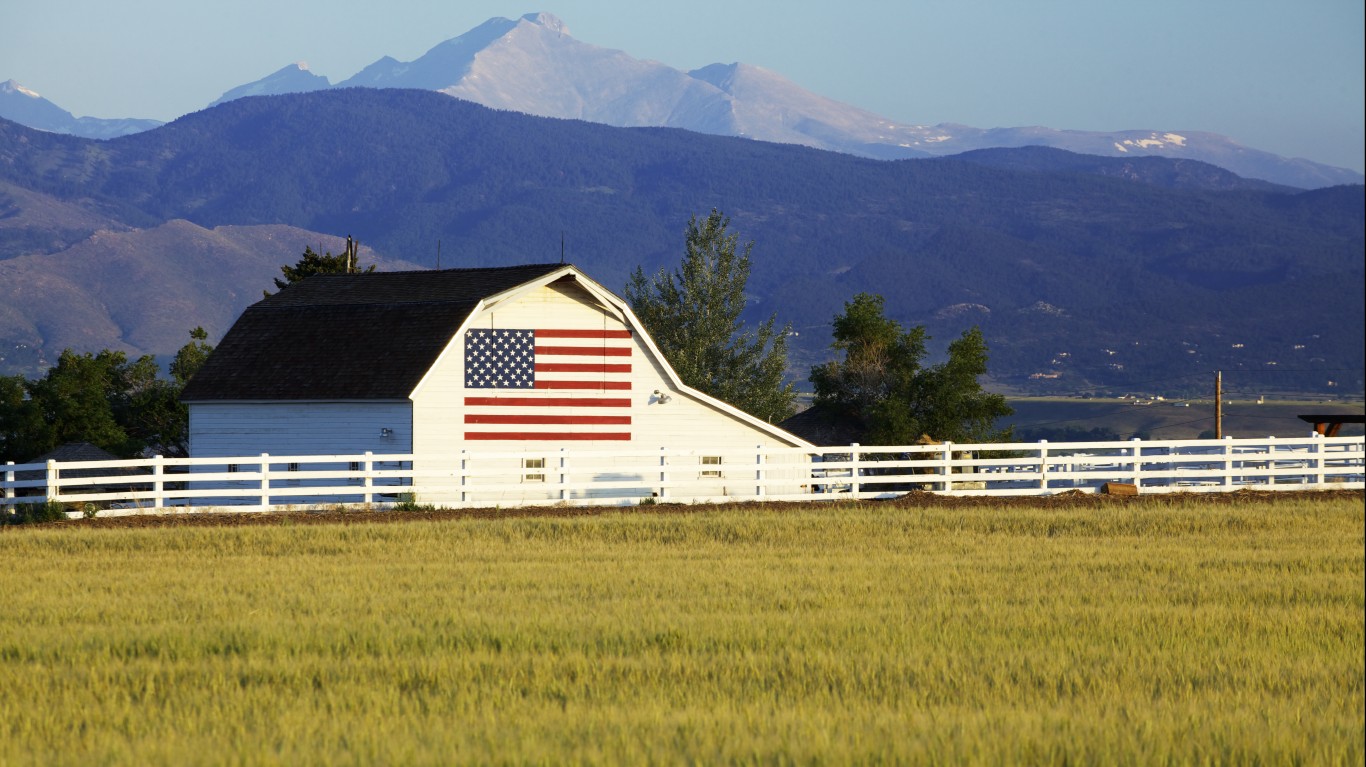
15. Colorado
> Hog production 2019: 293.2 million pounds ($183.9 million)
> 1-year change in hog production: 28.2% — 6th largest increase
> 1-year change in hog sales: 30.8% — 8th largest increase
[in-text-ad]
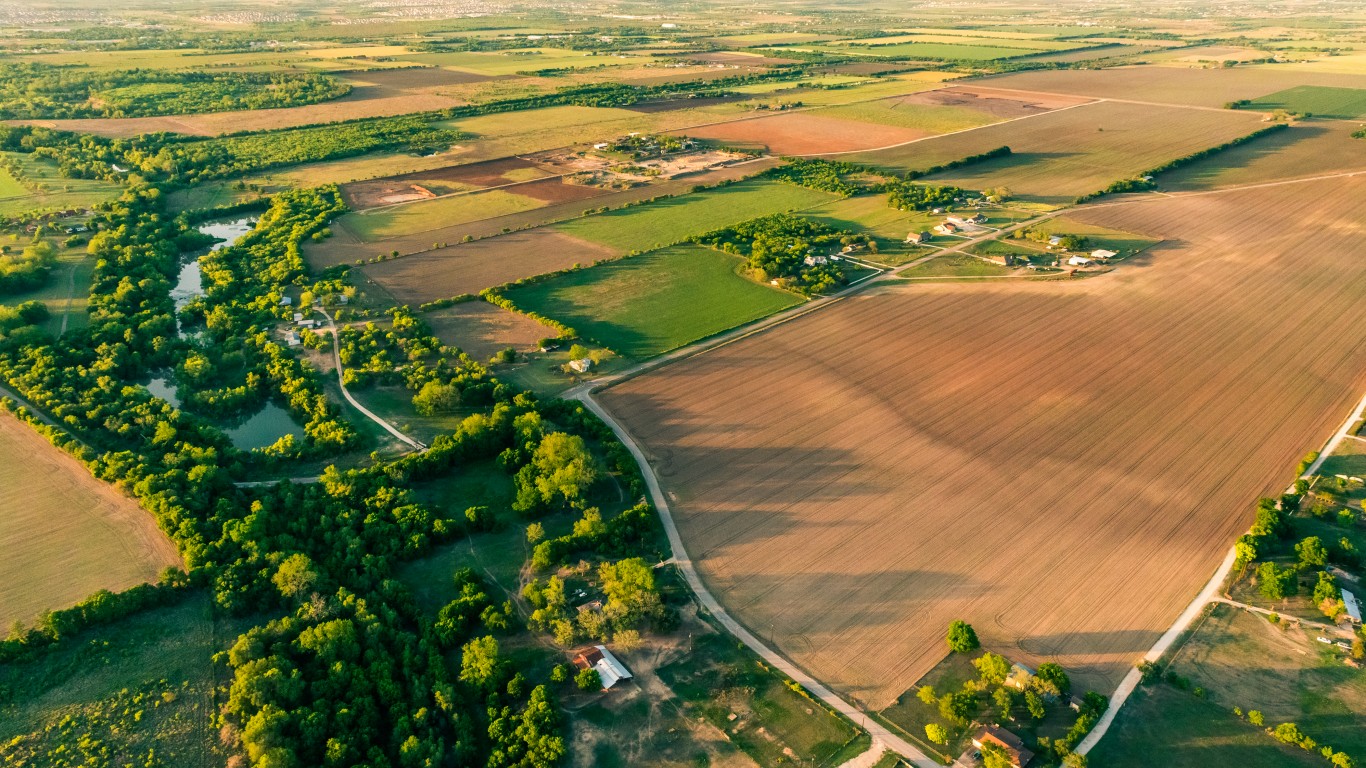
14. Texas
> Hog production 2019: 487.7 million pounds ($244.4 million)
> 1-year change in hog production: 10.2% — 18th largest increase
> 1-year change in hog sales: 8.6% — 19th largest increase
13. Michigan
> Hog production 2019: 635.0 million pounds ($330.1 million)
> 1-year change in hog production: 3.7% — 28th largest increase
> 1-year change in hog sales: 1.9% — 32nd largest increase

12. Pennsylvania
> Hog production 2019: 642.8 million pounds ($330.1 million)
> 1-year change in hog production: 19.3% — 14th largest increase
> 1-year change in hog sales: 19.5% — 13th largest increase
[in-text-ad-2]
11. Kansas
> Hog production 2019: 1.0 billion pounds ($549.5 million)
> 1-year change in hog production: 10.9% — 17th largest increase
> 1-year change in hog sales: 5.8% — 25th largest increase
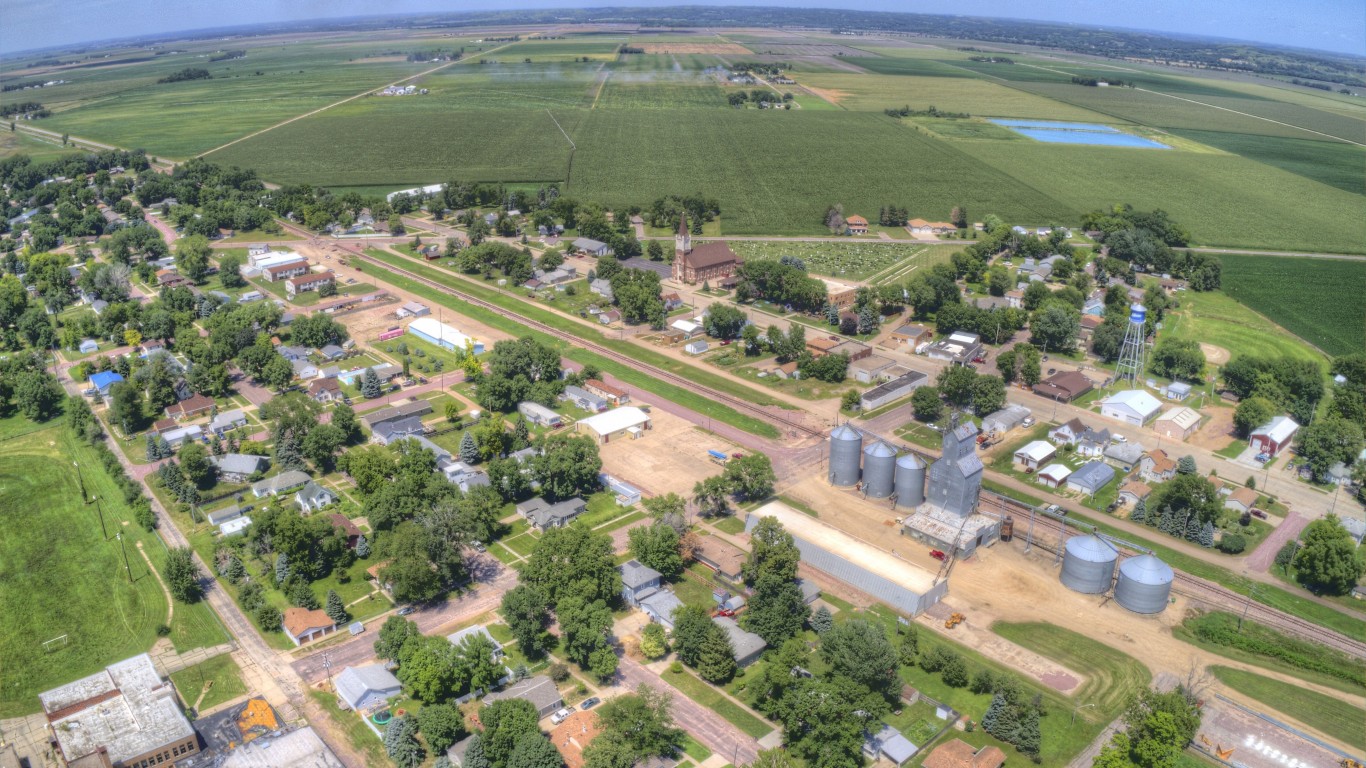
10. South Dakota
> Hog production 2019: 1.2 billion pounds ($731.3 million)
> 1-year change in hog production: 24.5% — 10th largest increase
> 1-year change in hog sales: 24.9% — 9th largest increase
[in-text-ad]
9. Ohio
> Hog production 2019: 1.3 billion pounds ($677.9 million)
> 1-year change in hog production: 3.3% — 29th largest increase
> 1-year change in hog sales: 0.6% — 33rd largest increase
8. Nebraska
> Hog production 2019: 1.5 billion pounds ($873.7 million)
> 1-year change in hog production: 7.8% — 23rd largest increase
> 1-year change in hog sales: 7.1% — 23rd largest increase

7. Missouri
> Hog production 2019: 1.7 billion pounds ($927.3 million)
> 1-year change in hog production: 37.1% — 3rd largest increase
> 1-year change in hog sales: 19.5% — 14th largest increase
[in-text-ad-2]
6. Oklahoma
> Hog production 2019: 2.0 billion pounds ($976.1 million)
> 1-year change in hog production: 8.7% — 21st largest increase
> 1-year change in hog sales: 4.0% — 27th largest increase
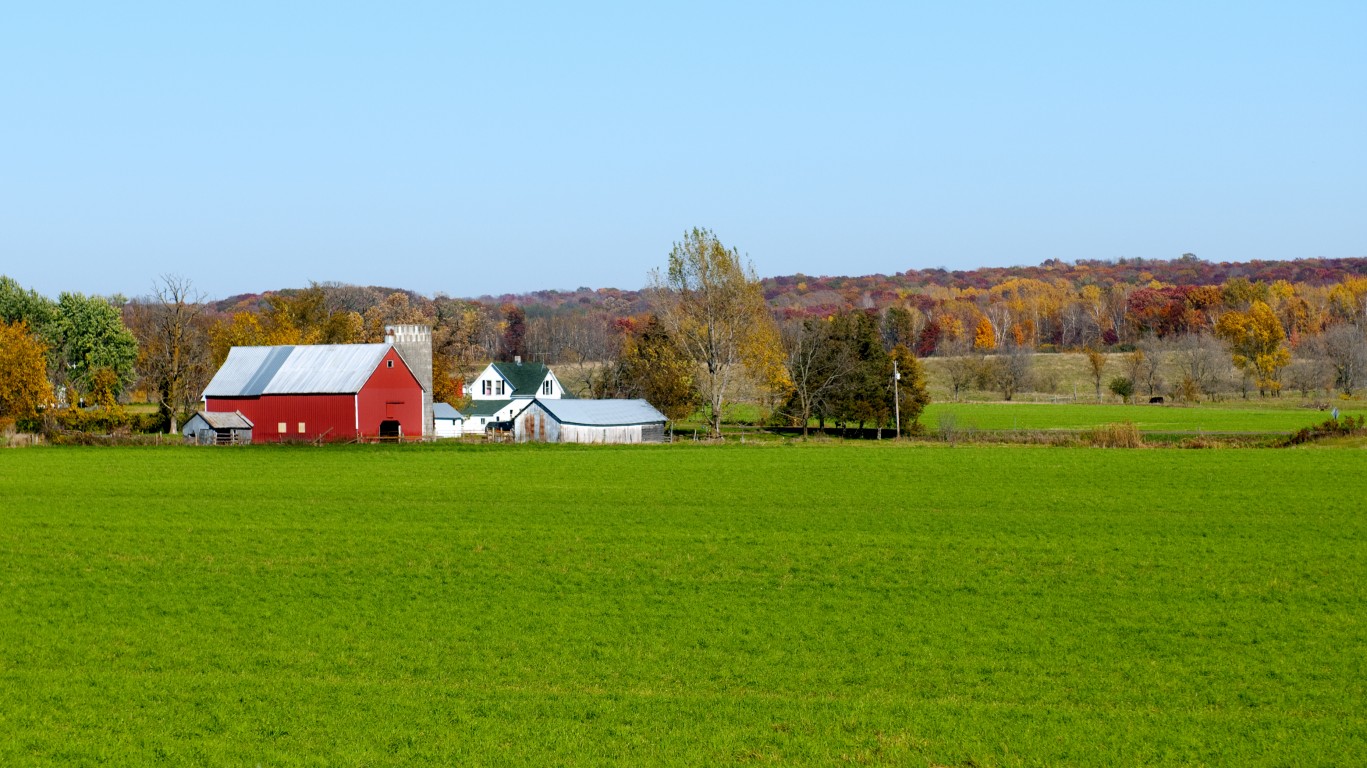
5. Illinois
> Hog production 2019: 2.2 billion pounds ($1.2 billion)
> 1-year change in hog production: 2.0% — 30th largest increase
> 1-year change in hog sales: 2.2% — 29th largest increase
[in-text-ad]
4. Indiana
> Hog production 2019: 2.2 billion pounds ($1.2 billion)
> 1-year change in hog production: 1.6% — 32nd largest increase
> 1-year change in hog sales: 2.9% — 28th largest increase
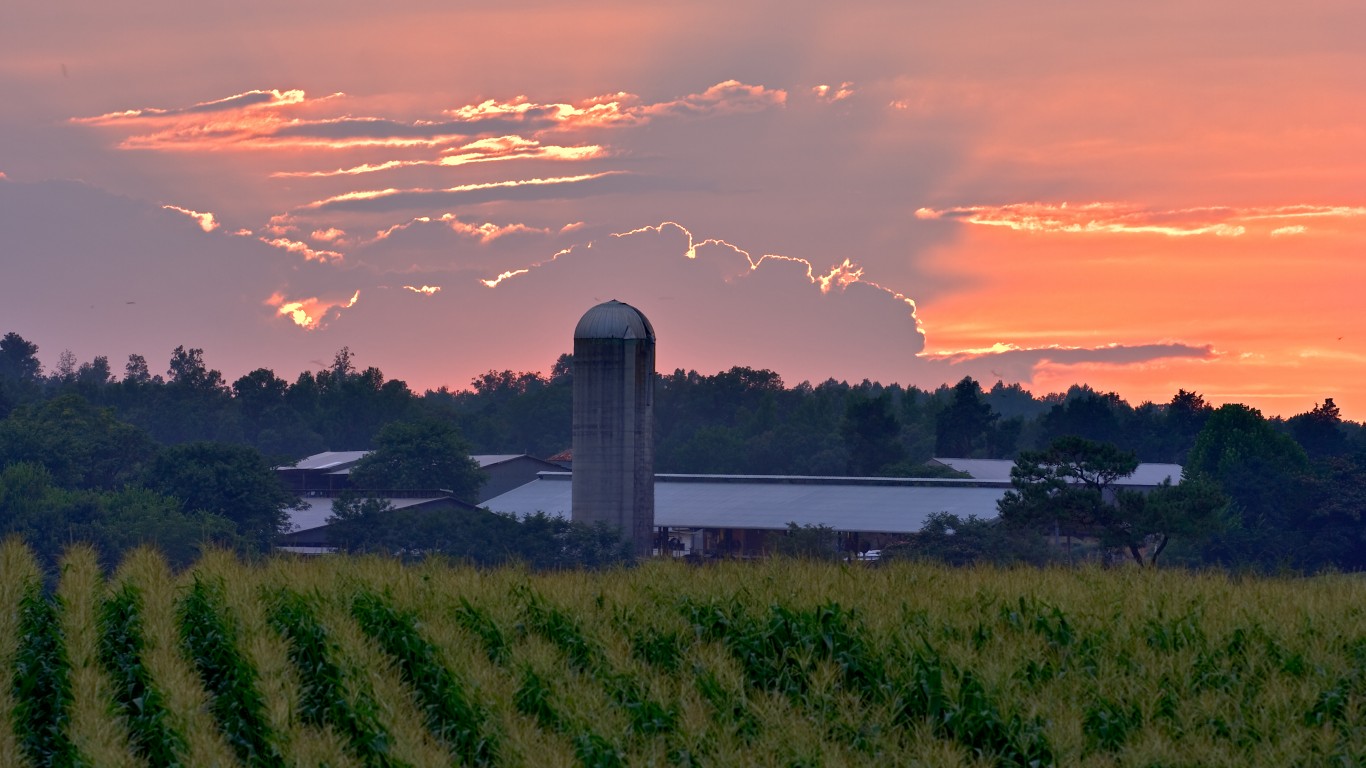
3. North Carolina
> Hog production 2019: 4.4 billion pounds ($2.2 billion)
> 1-year change in hog production: 4.8% — 25th largest increase
> 1-year change in hog sales: 2.1% — 30th largest increase

2. Minnesota
> Hog production 2019: 4.8 billion pounds ($2.7 billion)
> 1-year change in hog production: 4.8% — 24th largest increase
> 1-year change in hog sales: 8.3% — 20th largest increase
[in-text-ad-2]
1. Iowa
> Hog production 2019: 14.5 billion pounds ($7.8 billion)
> 1-year change in hog production: -0.4% — 13th largest decline
> 1-year change in hog sales: 1.9% — 31st largest increase
Are You Ahead, or Behind on Retirement?
If you’re one of the over 4 Million Americans set to retire this year, you may want to pay attention. Many people have worked their whole lives preparing to retire without ever knowing the answer to the most important question: am I ahead, or behind on my goals?
Don’t make the same mistake. It’s an easy question to answer. A quick conversation with a financial advisor can help you unpack your savings, spending, and goals for your money. With Zoe Financial’s free matching tool, you can connect with trusted financial advisors in minutes.
Why wait? Click here to get started today!
Thank you for reading! Have some feedback for us?
Contact the 24/7 Wall St. editorial team.
 24/7 Wall St.
 24/7 Wall St.
 24/7 Wall St.
 24/7 Wall St.

 24/7 Wall St.