
Despite significant strides in cancer detection and treatment, cancer remains a scary word. It’s certainly scarier than hearing you have a chronic condition. But the truth is that the potentially deadly disease, in many cases, can often be put in the same category as other manageable illnesses and chronic conditions such as hypertension and diabetes.
“We see more and more cases in which the disease doesn’t lead to the demise of the patient,” said Dr. Francisco Garcia-Moreno, Chief of Oncology and Hematology at ProHEALTH in Lake Success, New York.
An increasing number of people are surviving within five years of being diagnosed with almost all major types of cancer, according to the latest data provided by the American Cancer Society. But the improvement has been uneven across the different types of cancer. Some forms of the illness have survival rates that have more than quadrupled since the late 1970s, while others have seen little progress.
Garcia-Moreno explained that words such as “remission” or “cured” are not used on purpose depending on the type of cancer. “For example, for people with colon cancer, if they have no evidence of the cancer after five years, we say they are now cured because it doesn’t usually come back.” Doctors don’t use these words for breast cancer and malignant melanoma because they can recur after 10 or even 25 years.
The higher survival rates are largely due to several factors, including early detection and better treatment. Early detection, especially in the case of prostate cancer, is a “fundamental reason why more people survive it,” Garcia-Moreno said. “You can now detect prostate cancer with a blood test.”
Many cancers are still very difficult to detect early because of their location, symptoms manifesting late, and when they do, the symptoms tend to be vague, Garcia-Moreno explained. Pancreatic cancer, for example, is deep within the abdominal cavity, he noted. “By the time symptoms occur, it’s so advanced, it can’t be removed surgically.” Ovarian cancer is another type that is difficult to detect by virtue of anatomy. In addition, most symptoms are too vague, Garcia-Moreno noted. Most have to do with abdominal discomfort, which everyone experiences at some point and can mean anything, he noted.
Treatment options have been “revolutionized,” he said. While a few decades ago surgery and chemotherapy were the main kinds of medical care cancer patients got, now they have many more options — from immunotherapy and targeted drugs to hormone therapy and radiation therapies.
There will be nearly 1.8 million new cancer diagnoses and 606,900 cancer deaths in the United States in 2019, according to the American Cancer Society. Nationwide, women are slightly more likely than men to be diagnosed with cancer partially because women can develop five different common types of cancer than men cannot, while men can only develop three different types of cancer that women cannot.
Prostate cancer patients expected to survive 5 years after diagnosis based on data from 2008-2014 number 99.0%, the highest level among all cancers. Additionally, patients expected to survive 5 years after diagnosis in 1975-1977 were 68.0% of that total The new cases diagnosed in 2016 hit 192,443 or 101 per 100,000 people. The total number of deaths in 2016 was 30,370 or 19 per 100,000 people.
Methodology: To identify the cancers with the highest survival rates, 24/7 Tempo reviewed data on 5-year relative survival rates for cancers by cancer site for the years 2008-2014. Survival rates data is from the American Cancer Society’s “Cancer Facts and Figures 2019.” Survival rates for previous years were also from Facts and Figures, while data on mortality and new cases by cancer site are from the U.S. Cancer Statistics Data Visualizations Tool for 2016, which was provided by the Centers for Disease Control and Prevention.
Expected survival rates are based on mortality rates for the entire population, taking into account, as appropriate, the age, sex, race, and year of diagnosis of the patients. Assuming that the presence of cancer is the only factor that distinguishes the cancer patient cohort from the general population, the relative survival figure estimates the probability that a patient will not die of the diagnosed cancer within the given time interval.
Click here to see the cancers with the highest survival rate.

23. Pancreas
> Patients expected to survive 5 years after diagnosis (2008-2014): 9.0%
> Patients expected to survive 5 years after diagnosis (1975-1977): 3.0%
> New cases in 2016: 49,093 (or 13 per 100,000 people)
> Total no. of deaths in 2016: 42,757 (or 11 per 100,000 people)
[in-text-ad]

22. Liver and Intrahepatic Bile Duct
> Patients expected to survive 5 years after diagnosis (2008-2014): 19.0%
> Patients expected to survive 5 years after diagnosis (1975-1977): 3.0%
> New cases in 2016: 33,482 (or 8 per 100,000 people)
> Total no. of deaths in 2016: 26,569 (or 7 per 100,000 people)
[recirclink id=465385]

21. Lung and Bronchus
> Patients expected to survive 5 years after diagnosis (2008-2014): 20.0%
> Patients expected to survive 5 years after diagnosis (1975-1977): 12.0%
> New cases in 2016: 218,229 (or 56 per 100,000 people)
> Total no. of deaths in 2016: 148,869 (or 39 per 100,000 people)

20. Esophagus
> Patients expected to survive 5 years after diagnosis (2008-2014): 21.0%
> Patients expected to survive 5 years after diagnosis (1975-1977): 5.0%
> New cases in 2016: 17,478 (or 4 per 100,000 people)
> Total no. of deaths in 2016: 15,459 (or 4 per 100,000 people)
[in-text-ad-2]

19. Stomach
> Patients expected to survive 5 years after diagnosis (2008-2014): 32.0%
> Patients expected to survive 5 years after diagnosis (1975-1977): 15.0%
> New cases in 2016: 24,146 (or 6 per 100,000 people)
> Total no. of deaths in 2016: 11,433 (or 3 per 100,000 people)

18. Brain and Other Nervous System
> Patients expected to survive 5 years after diagnosis (2008-2014): 35.0%
> Patients expected to survive 5 years after diagnosis (1975-1977): 23.0%
> New cases in 2016: 22,376 (or 6 per 100,000 people)
> Total no. of deaths in 2016: 16,834 (or 5 per 100,000 people)
[in-text-ad]

17. Ovary
> Patients expected to survive 5 years after diagnosis (2008-2014): 48.0%
> Patients expected to survive 5 years after diagnosis (1975-1977): 36.0%
> New cases in 2016: 20,418 (or 10 per 100,000 people)
> Total no. of deaths in 2016: 14,223 (or 7 per 100,000 people)
[recirclink id=497223]
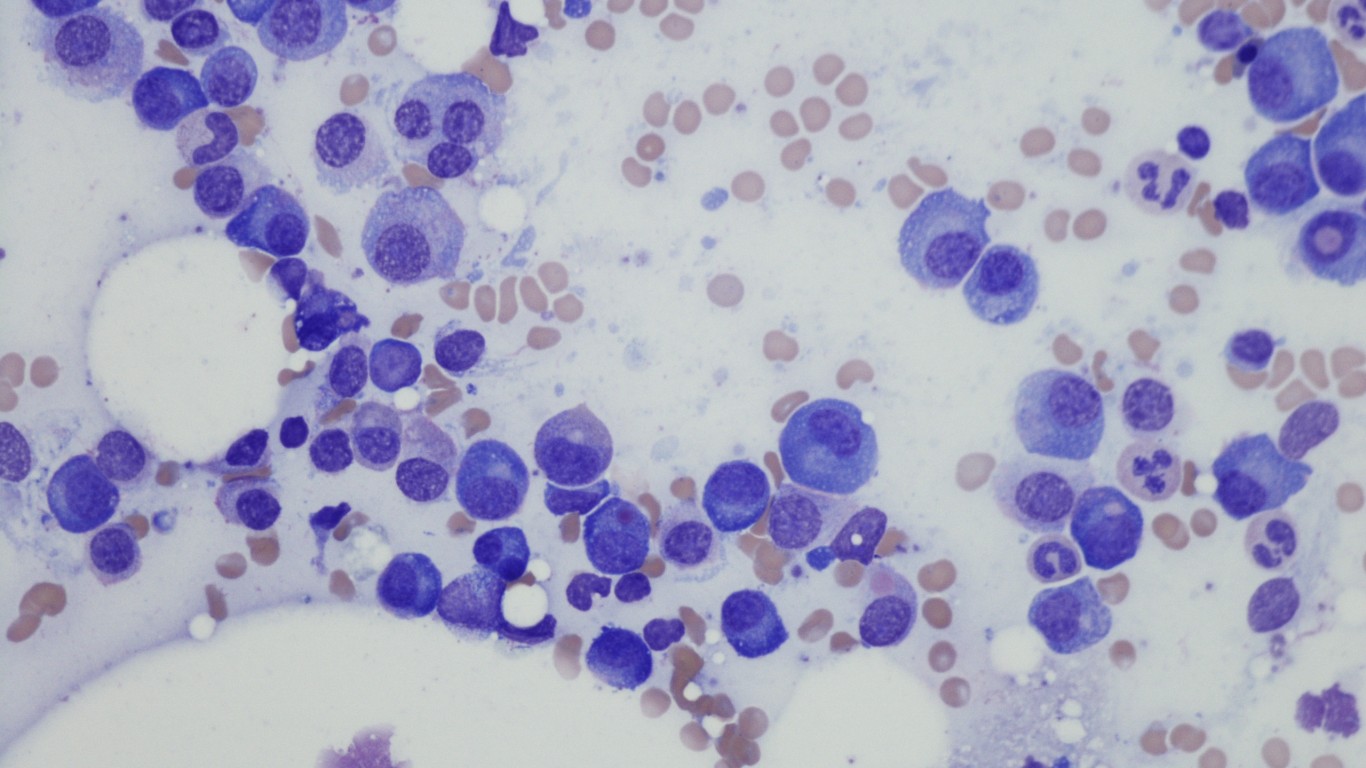
16. Myeloma
> Patients expected to survive 5 years after diagnosis (2008-2014): 52.0%
> Patients expected to survive 5 years after diagnosis (1975-1977): 25.0%
> New cases in 2016: 25,286 (or 7 per 100,000 people)
> Total no. of deaths in 2016: 12,266 (or 3 per 100,000 people)

15. Larynx
> Patients expected to survive 5 years after diagnosis (2008-2014): 62.0%
> Patients expected to survive 5 years after diagnosis (1975-1977): 66.0%
> New cases in 2016: 12,243 (or 3 per 100,000 people)
> Total no. of deaths in 2016: 3,866 (or 1 per 100,000 people)
[in-text-ad-2]

14. Leukemias
> Patients expected to survive 5 years after diagnosis (2008-2014): 65.0%
> Patients expected to survive 5 years after diagnosis (1975-1977): 34.0%
> New cases in 2016: 48,082 (or 13 per 100,000 people)
> Total no. of deaths in 2016: 23,287 (or 6 per 100,000 people)

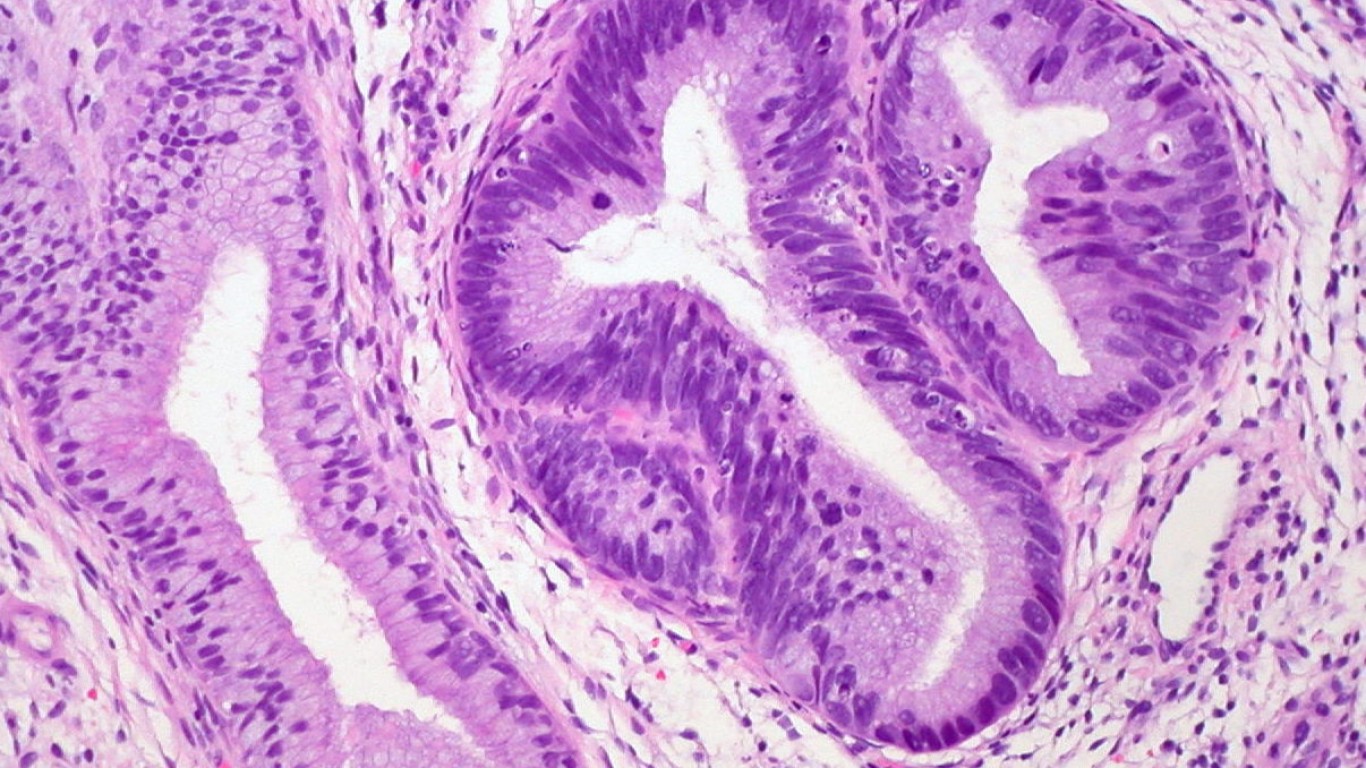
13. Colon and Rectum
> Patients expected to survive 5 years after diagnosis (2008-2014): 66.0%
> Patients expected to survive 5 years after diagnosis (1975-1977): 50.0%
> New cases in 2016: 141,270 (or 37 per 100,000 people)
> Total no. of deaths in 2016: 52,286 (or 14 per 100,000 people)
[in-text-ad]

12. Oral Cavity and Pharynx
> Patients expected to survive 5 years after diagnosis (2008-2014): 68.0%
> Patients expected to survive 5 years after diagnosis (1975-1977): 53.0%
> New cases in 2016: 45,543 (or 12 per 100,000 people)
> Total no. of deaths in 2016: 10,170 (or 3 per 100,000 people)
[recirclink id=548543]
11. Cervix
> Patients expected to survive 5 years after diagnosis (2008-2014): 69.0%
> Patients expected to survive 5 years after diagnosis (1975-1977): 69.0%
> New cases in 2016: 12,984 (or 8 per 100,000 people)
> Total no. of deaths in 2016: 4,188 (or 2 per 100,000 people)

10. Non-Hodgkin Lymphoma
> Patients expected to survive 5 years after diagnosis (2008-2014): 74.0%
> Patients expected to survive 5 years after diagnosis (1975-1977): 47.0%
> New cases in 2016: 68,403 (or 18 per 100,000 people)
> Total no. of deaths in 2016: 20,268 (or 5 per 100,000 people)
[in-text-ad-2]

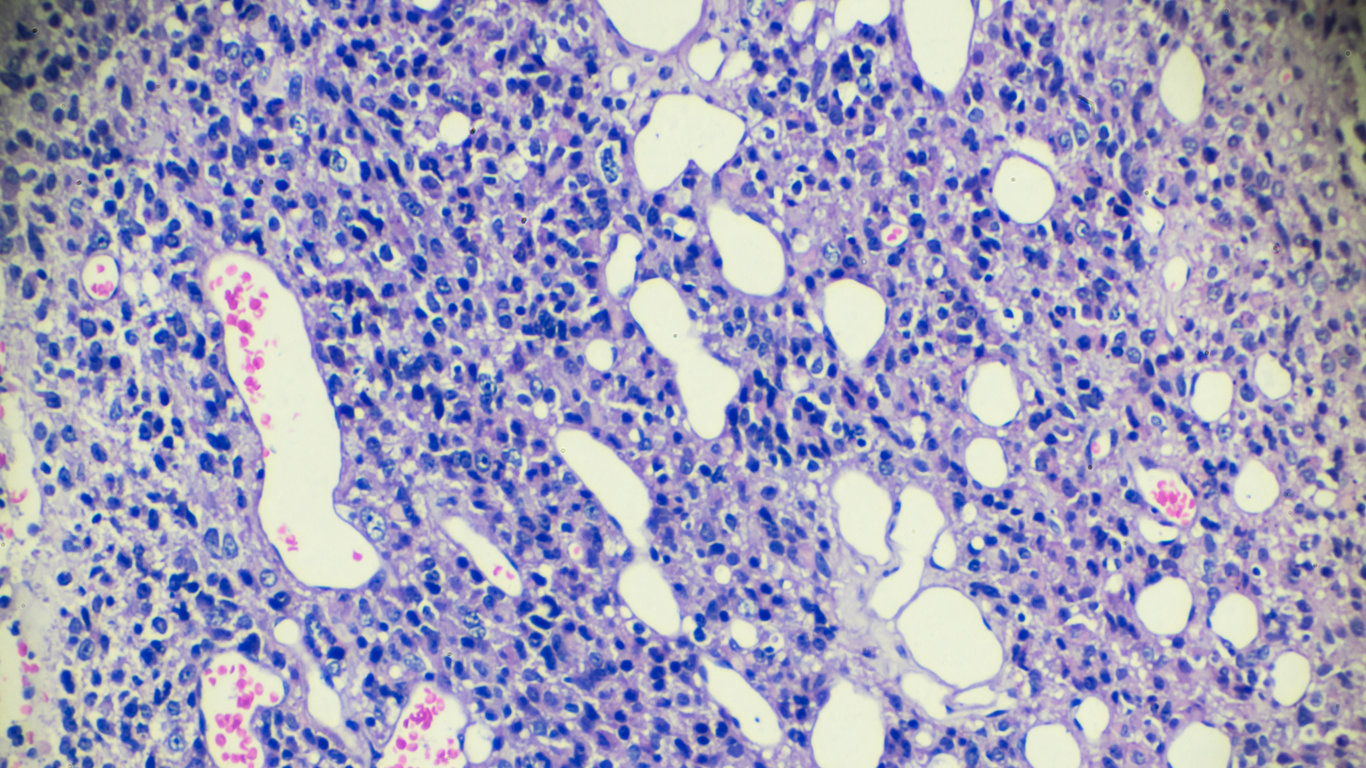
9. Kidney and Renal Pelvis
> Patients expected to survive 5 years after diagnosis (2008-2014): 75.0%
> Patients expected to survive 5 years after diagnosis (1975-1977): 50.0%
> New cases in 2016: 63,639 (or 17 per 100,000 people)
> Total no. of deaths in 2016: 13,842 (or 4 per 100,000 people)

8. Urinary bladder
> Patients expected to survive 5 years after diagnosis (2008-2014): 78.0%
> Patients expected to survive 5 years after diagnosis (1975-1977): 72.0%
> New cases in 2016: 73,469 (or 19 per 100,000 people)
> Total no. of deaths in 2016: 16,646 (or 4 per 100,000 people)
[in-text-ad]

7. Corpus and Uterus, NOS
> Patients expected to survive 5 years after diagnosis (2008-2014): 83.0%
> Patients expected to survive 5 years after diagnosis (1975-1977): 87.0%
> New cases in 2016: 56,808 (or 27 per 100,000 people)
> Total no. of deaths in 2016: 10,733 (or 5 per 100,000 people)
[recirclink id=549728]

6. Hodgkin Lymphoma
> Patients expected to survive 5 years after diagnosis (2008-2014): 88.0%
> Patients expected to survive 5 years after diagnosis (1975-1977): 72.0%
> New cases in 2016: 8,389 (or 3 per 100,000 people)
> Total no. of deaths in 2016: 1,000 (or 0 per 100,000 people)

5. Female Breast
> Patients expected to survive 5 years after diagnosis (2008-2014): 91.0%
> Patients expected to survive 5 years after diagnosis (1975-1977): 75.0%
> New cases in 2016: 245,299 (or 124 per 100,000 people)
> Total no. of deaths in 2016: 41,487 (or 20 per 100,000 people)
[in-text-ad-2]

4. Melanomas of the Skin
> Patients expected to survive 5 years after diagnosis (2008-2014): 94.0%
> Patients expected to survive 5 years after diagnosis (1975-1977): 82.0%
> New cases in 2016: 82,476 (or 22 per 100,000 people)
> Total no. of deaths in 2016: 8,188 (or 2 per 100,000 people)
3. Testis
> Patients expected to survive 5 years after diagnosis (2008-2014): 97.0%
> Patients expected to survive 5 years after diagnosis (1975-1977): 83.0%
> New cases in 2016: 8,826 (or 6 per 100,000 people)
> Total no. of deaths in 2016: 431 (or 1 per 100,000 people)
[in-text-ad]

2. Thyroid
> Patients expected to survive 5 years after diagnosis (2008-2014): 98.0%
> Patients expected to survive 5 years after diagnosis (1975-1977): 92.0%
> New cases in 2016: 47,755 (or 14 per 100,000 people)
> Total no. of deaths in 2016: 2,042 (or 1 per 100,000 people)
[recirclink id=561681]

1. Prostate
> Patients expected to survive 5 years after diagnosis (2008-2014): 99.0%
> Patients expected to survive 5 years after diagnosis (1975-1977): 68.0%
> New cases in 2016: 192,443 (or 101 per 100,000 people)
> Total no. of deaths in 2016: 30,370 (or 19 per 100,000 people)