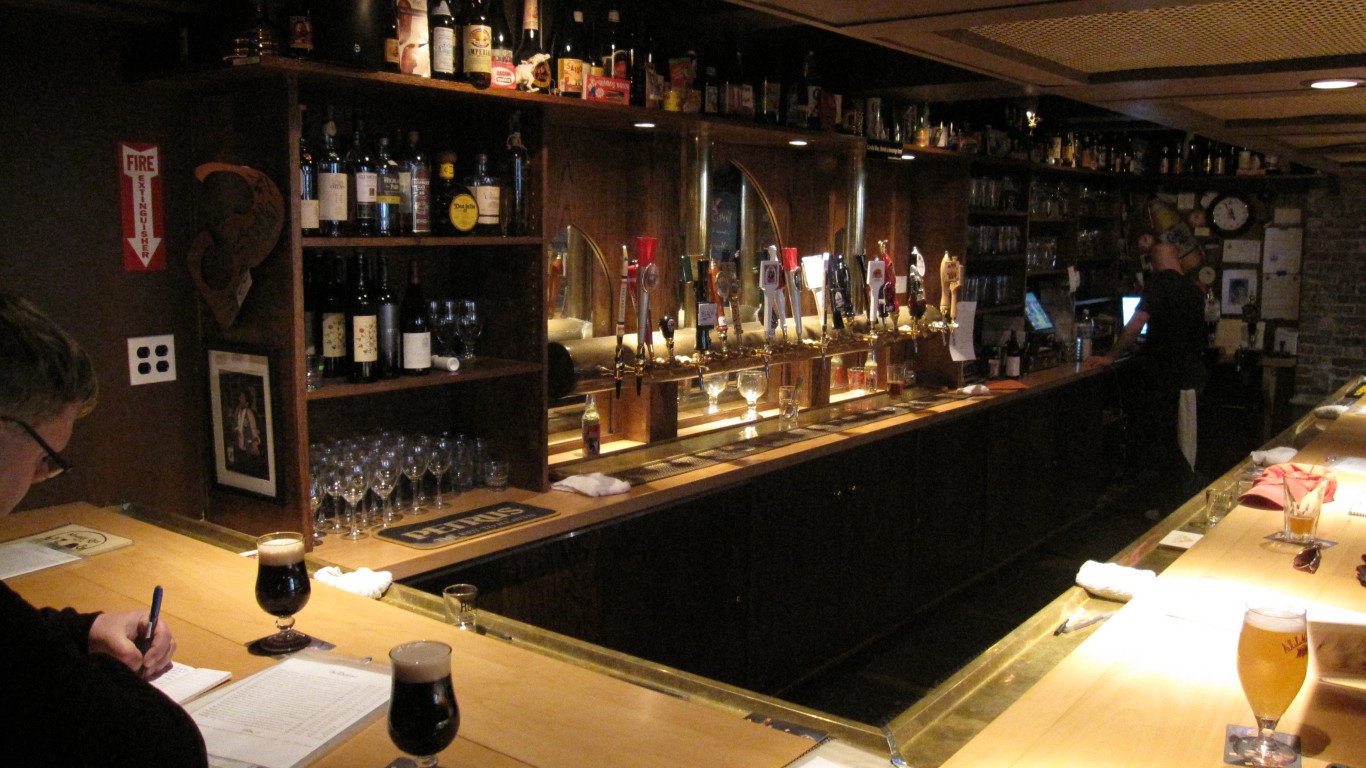
Americans are drinking more alcohol amid the COVID-19 pandemic, according to data from Nielsen. Though the lifestyle restrictions seem to have changed alcohol consumption habits, including shifting consumer preferences to wine and spirits, beer is still a favorite alcoholic beverage in the U.S.
People in all 50 states consumed less beer in 2019 compared to 2015. In 2020, however, the five-year change was negative in 40 states. In nine states, people have consumed more beer in 2020 compared to 2016.
The average American adult consumed nearly 26 gallons of beer in 2020, which was about 3.2 gallons less than in 2010, but only about 1.3 gallons less than in 2016. Beer consumption tends to vary considerably across the country.
To determine the states where people drink the most and least amounts of beer, 24/7 Tempo reviewed annual beer shipment data per capita provided by Beer Marketer’s Insights, a brewing industry trade publisher. We used shipments as proxy for consumption.
A standard “drink” serving is a 12-ounce beer or hard seltzer with 5% alcohol and light beers with about 4.2% alcohol.
Annual shipments of beer per capita range from more than 40 gallons in some states to less than 20 in others. While the states reporting the highest beer shipments per capita are not confined to a particular region, the states with the lowest per capita shipments tend to be concentrated in the Northeast.
There were 6,400 brewing facilities around the U.S. in 2019, producing the equivalent of more than 2.8 billion 24-container cases of 12-ounce cans or bottles, according to a report by the National Beer Wholesalers Association. Most of the beer people drink does not come from where they might think it does — there are at least 10 “imported” beers that are actually brewed in the U.S.
Click here to see the states drinking the most beer
Click here to see our detailed methodology
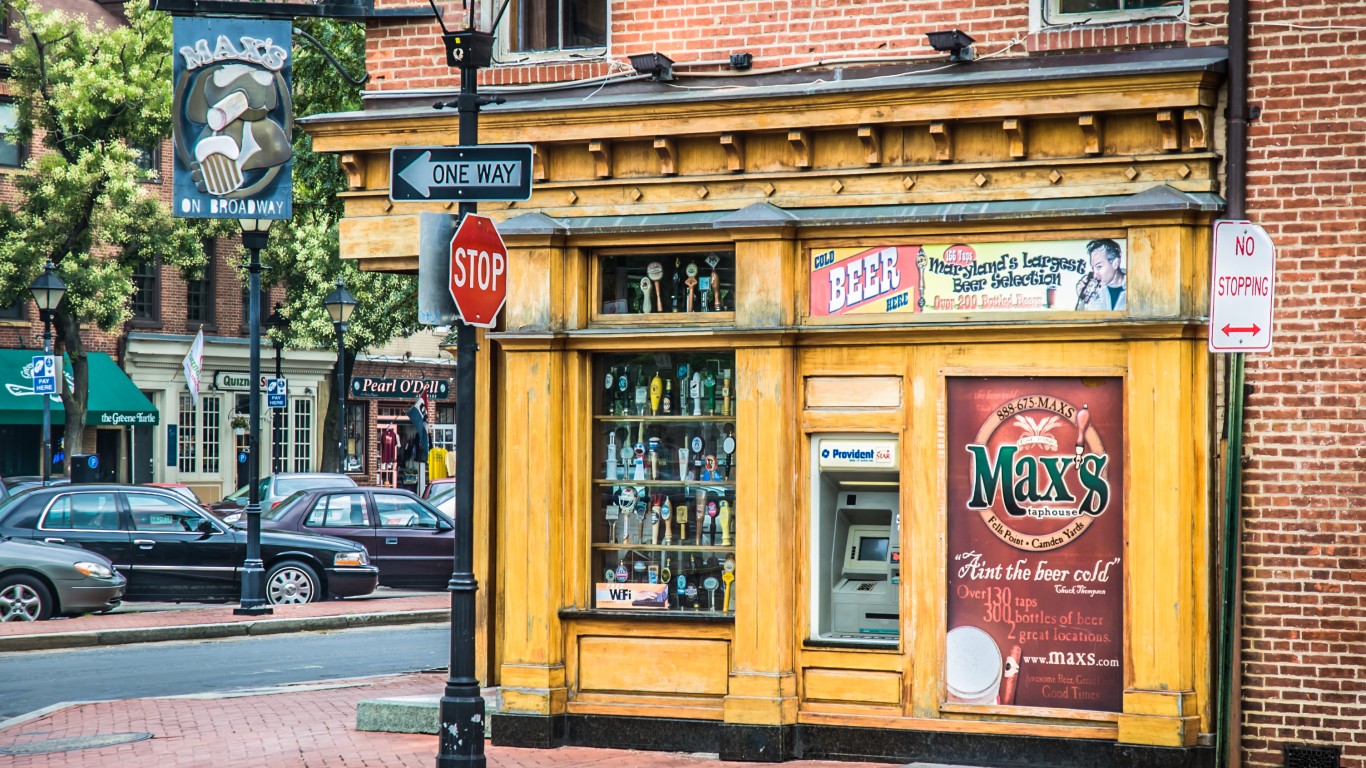
50. Maryland
> Beer shipment per adult 21+ in 2020: 18.5 gallons per adult
> 5 yr. change (2016-2020): -11.1% — 4th largest decrease ( -2.3 gallons)
> 10 yr. change (2010-2020): -22.9% — 3rd largest decrease (-5.5 gallons)
> Beer tax rate: $0.55 per gallon — 7th highest
> Adults who report excessive drinking: 16.6% — 11th lowest
> Median household income: $86,738 — the highest
[in-text-ad]
49. Connecticut
> Beer shipment per adult 21+ in 2020: 19.8 gallons per adult
> 5 yr. change (2016-2020): -7.0% — 18th largest decrease ( -1.5 gallons)
> 10 yr. change (2010-2020): -12.8% — 18th largest decrease (-2.9 gallons)
> Beer tax rate: $0.23 per gallon — 24th lowest
> Adults who report excessive drinking: 17.1% — 15th lowest
> Median household income: $78,833 — 6th highest
48. Utah
> Beer shipment per adult 21+ in 2020: 19.9 gallons per adult
> 5 yr. change (2016-2020): 7.0% — the largest increase ( 1.3 gallons)
> 10 yr. change (2010-2020): 2.6% — the largest increase (0.5 gallons)
> Beer tax rate: $0.41 per gallon — 14th highest
> Adults who report excessive drinking: 12.2% — the lowest
> Median household income: $75,780 — 11th highest
47. New Jersey
> Beer shipment per adult 21+ in 2020: 20.0 gallons per adult
> 5 yr. change (2016-2020): -6.5% — 19th largest decrease ( -1.4 gallons)
> 10 yr. change (2010-2020): -13.0% — 14th largest decrease (-3.0 gallons)
> Beer tax rate: $0.12 per gallon — 9th lowest
> Adults who report excessive drinking: 18.1% — 22nd lowest
> Median household income: $85,751 — 3rd highest
[in-text-ad-2]

46. Rhode Island
> Beer shipment per adult 21+ in 2020: 20.1 gallons per adult
> 5 yr. change (2016-2020): -14.5% — the largest decrease ( -3.4 gallons)
> 10 yr. change (2010-2020): -26.6% — the largest decrease (-7.3 gallons)
> Beer tax rate: $0.12 per gallon — 10th lowest
> Adults who report excessive drinking: 19.6% — 17th highest
> Median household income: $71,169 — 15th highest

45. New York
> Beer shipment per adult 21+ in 2020: 20.2 gallons per adult
> 5 yr. change (2016-2020): -10.6% — 6th largest decrease ( -2.4 gallons)
> 10 yr. change (2010-2020): -13.3% — 13th largest decrease (-3.1 gallons)
> Beer tax rate: $0.14 per gallon — 12th lowest
> Adults who report excessive drinking: 18.8% — 25th lowest
> Median household income: $72,108 — 14th highest
[in-text-ad]
44. Massachusetts
> Beer shipment per adult 21+ in 2020: 21.5 gallons per adult
> 5 yr. change (2016-2020): -10.8% — 5th largest decrease ( -2.6 gallons)
> 10 yr. change (2010-2020): -18.6% — 6th largest decrease (-4.9 gallons)
> Beer tax rate: $0.11 per gallon — 7th lowest
> Adults who report excessive drinking: 21.3% — 7th highest
> Median household income: $85,843 — 2nd highest

43. Georgia
> Beer shipment per adult 21+ in 2020: 23.0 gallons per adult
> 5 yr. change (2016-2020): -8.4% — 10th largest decrease ( -2.1 gallons)
> 10 yr. change (2010-2020): -12.9% — 17th largest decrease (-3.4 gallons)
> Beer tax rate: $0.48 per gallon — 9th highest
> Adults who report excessive drinking: 14.4% — 7th lowest
> Median household income: $61,980 — 22nd lowest

42. Kentucky
> Beer shipment per adult 21+ in 2020: 23.1 gallons per adult
> 5 yr. change (2016-2020): -5.3% — 18th smallest decrease ( -1.3 gallons)
> 10 yr. change (2010-2020): -6.5% — 9thsmallest decrease (-1.6 gallons)
> Beer tax rate: $0.89 per gallon — 4th highest
> Adults who report excessive drinking: 17.3% — 17th lowest
> Median household income: $52,295 — 7th lowest
[in-text-ad-2]

41. West Virginia
> Beer shipment per adult 21+ in 2020: 23.3 gallons per adult
> 5 yr. change (2016-2020): -4.5% — 16th smallest decrease ( -1.1 gallons)
> 10 yr. change (2010-2020): -11.1% — 23rd smallest decrease (-2.9 gallons)
> Beer tax rate: $0.18 per gallon — 16th lowest
> Adults who report excessive drinking: 12.3% — 2nd lowest
> Median household income: $48,850 — 2nd lowest
40. Indiana
> Beer shipment per adult 21+ in 2020: 23.6 gallons per adult
> 5 yr. change (2016-2020): -0.8% — 2nd smallest decrease ( -0.2 gallons)
> 10 yr. change (2010-2020): -12.9% — 16th largest decrease (-3.5 gallons)
> Beer tax rate: $0.12 per gallon — 8th lowest
> Adults who report excessive drinking: 17.6% — 21st lowest
> Median household income: $57,603 — 14th lowest
[in-text-ad]

39. Michigan
> Beer shipment per adult 21+ in 2020: 23.6 gallons per adult
> 5 yr. change (2016-2020): -8.2% — 12th largest decrease ( -2.1 gallons)
> 10 yr. change (2010-2020): -14.2% — 12th largest decrease (-3.9 gallons)
> Beer tax rate: $0.2 per gallon — 22nd lowest
> Adults who report excessive drinking: 19.6% — 18th highest
> Median household income: $59,584 — 19th lowest

38. Arkansas
> Beer shipment per adult 21+ in 2020: 23.9 gallons per adult
> 5 yr. change (2016-2020): -1.6% — 5th smallest decrease ( -0.4 gallons)
> 10 yr. change (2010-2020): -10.5% — 22nd smallest decrease (-2.8 gallons)
> Beer tax rate: $0.34 per gallon — 19th highest
> Adults who report excessive drinking: 15.8% — 8th lowest
> Median household income: $48,952 — 3rd lowest
37. Virginia
> Beer shipment per adult 21+ in 2020: 24.2 gallons per adult
> 5 yr. change (2016-2020): -4.0% — 11th smallest decrease ( -1.0 gallons)
> 10 yr. change (2010-2020): -12.3% — 23rd largest decrease (-3.4 gallons)
> Beer tax rate: $0.26 per gallon — 25th lowest
> Adults who report excessive drinking: 17.4% — 19th lowest
> Median household income: $76,456 — 10th highest
[in-text-ad-2]

36. Tennessee
> Beer shipment per adult 21+ in 2020: 24.2 gallons per adult
> 5 yr. change (2016-2020): -5.5% — 19th smallest decrease ( -1.4 gallons)
> 10 yr. change (2010-2020): -9.4% — 18th smallest decrease (-2.5 gallons)
> Beer tax rate: $1.29 per gallon — the highest
> Adults who report excessive drinking: 14.3% — 6th lowest
> Median household income: $56,071 — 9th lowest

35. California
> Beer shipment per adult 21+ in 2020: 24.7 gallons per adult
> 5 yr. change (2016-2020): -3.1% — 8th smallest decrease ( -0.8 gallons)
> 10 yr. change (2010-2020): -7.5% — 13th smallest decrease (-2.0 gallons)
> Beer tax rate: $0.2 per gallon — 21st lowest
> Adults who report excessive drinking: 19.2% — 23rd highest
> Median household income: $80,440 — 5th highest
[in-text-ad]

34. Pennsylvania
> Beer shipment per adult 21+ in 2020: 24.9 gallons per adult
> 5 yr. change (2016-2020): -7.8% — 14th largest decrease ( -2.1 gallons)
> 10 yr. change (2010-2020): -15.6% — 10th largest decrease (-4.6 gallons)
> Beer tax rate: $0.08 per gallon — 5th lowest
> Adults who report excessive drinking: 19.2% — 24th highest
> Median household income: $63,463 — 23rd highest
33. Idaho
> Beer shipment per adult 21+ in 2020: 25.0 gallons per adult
> 5 yr. change (2016-2020): -6.4% — 20th largest decrease ( -1.7 gallons)
> 10 yr. change (2010-2020): -15.3% — 11th largest decrease (-4.5 gallons)
> Beer tax rate: $0.15 per gallon — 13th lowest
> Adults who report excessive drinking: 16.6% — 10th lowest
> Median household income: $60,999 — 20th lowest
32. Ohio
> Beer shipment per adult 21+ in 2020: 25.5 gallons per adult
> 5 yr. change (2016-2020): -9.9% — 7th largest decrease ( -2.8 gallons)
> 10 yr. change (2010-2020): -18.5% — 7th largest decrease (-5.8 gallons)
> Beer tax rate: $0.18 per gallon — 17th lowest
> Adults who report excessive drinking: 20.2% — 14th highest
> Median household income: $58,642 — 15th lowest
[in-text-ad-2]

31. Florida
> Beer shipment per adult 21+ in 2020: 25.6 gallons per adult
> 5 yr. change (2016-2020): -4.8% — 17th smallest decrease ( -1.3 gallons)
> 10 yr. change (2010-2020): -9.5% — 21st smallest decrease (-2.7 gallons)
> Beer tax rate: $0.48 per gallon — 9th highest
> Adults who report excessive drinking: 17.1% — 16th lowest
> Median household income: $59,227 — 17th lowest
30. North Carolina
> Beer shipment per adult 21+ in 2020: 25.8 gallons per adult
> 5 yr. change (2016-2020): 0.4% — the smallest increase ( 0.1 gallons)
> 10 yr. change (2010-2020): -6.5% — 10th smallest decrease (-1.8 gallons)
> Beer tax rate: $0.62 per gallon — 6th highest
> Adults who report excessive drinking: 16.9% — 14th lowest
> Median household income: $57,341 — 12th lowest
[in-text-ad]

29. Alaska
> Beer shipment per adult 21+ in 2020: 26.0 gallons per adult
> 5 yr. change (2016-2020): -4.4% — 14th smallest decrease ( -1.2 gallons)
> 10 yr. change (2010-2020): -8.8% — 15th smallest decrease (-2.5 gallons)
> Beer tax rate: $1.07 per gallon — 2nd highest
> Adults who report excessive drinking: 21.3% — 8th highest
> Median household income: $75,463 — 12th highest

28. Illinois
> Beer shipment per adult 21+ in 2020: 26.1 gallons per adult
> 5 yr. change (2016-2020): -7.8% — 15th largest decrease ( -2.2 gallons)
> 10 yr. change (2010-2020): -12.7% — 19th largest decrease (-3.8 gallons)
> Beer tax rate: $0.23 per gallon — 23rd lowest
> Adults who report excessive drinking: 21.4% — 6th highest
> Median household income: $69,187 — 17th highest
27. Missouri
> Beer shipment per adult 21+ in 2020: 26.6 gallons per adult
> 5 yr. change (2016-2020): -7.3% — 16th largest decrease ( -2.1 gallons)
> 10 yr. change (2010-2020): -16.9% — 9th largest decrease (-5.4 gallons)
> Beer tax rate: $0.06 per gallon — 2nd lowest
> Adults who report excessive drinking: 19.8% — 16th highest
> Median household income: $57,409 — 13th lowest
[in-text-ad-2]
26. Hawaii
> Beer shipment per adult 21+ in 2020: 26.7 gallons per adult
> 5 yr. change (2016-2020): -12.5% — 3rd largest decrease ( -3.8 gallons)
> 10 yr. change (2010-2020): -11.9% — 24th largest decrease (-3.6 gallons)
> Beer tax rate: $0.93 per gallon — 3rd highest
> Adults who report excessive drinking: 21.1% — 9th highest
> Median household income: $83,102 — 4th highest

25. Oklahoma
> Beer shipment per adult 21+ in 2020: 26.8 gallons per adult
> 5 yr. change (2016-2020): 3.9% — 2nd largest increase ( 1.0 gallons)
> 10 yr. change (2010-2020): -6.6% — 11th smallest decrease (-1.9 gallons)
> Beer tax rate: $0.4 per gallon — 16th highest
> Adults who report excessive drinking: 14.1% — 5th lowest
> Median household income: $54,449 — 8th lowest
[in-text-ad]

24. Arizona
> Beer shipment per adult 21+ in 2020: 27.0 gallons per adult
> 5 yr. change (2016-2020): -0.4% — the smallest decrease ( -0.1 gallons)
> 10 yr. change (2010-2020): -12.6% — 20th largest decrease (-3.9 gallons)
> Beer tax rate: $0.16 per gallon — 15th lowest
> Adults who report excessive drinking: 16.7% — 12th lowest
> Median household income: $62,055 — 23rd lowest
23. Minnesota
> Beer shipment per adult 21+ in 2020: 27.1 gallons per adult
> 5 yr. change (2016-2020): -5.9% — 21st smallest decrease ( -1.7 gallons)
> 10 yr. change (2010-2020): -6.2% — 7th smallest decrease (-1.8 gallons)
> Beer tax rate: $0.46 per gallon — 11th highest
> Adults who report excessive drinking: 21.7% — 5th highest
> Median household income: $74,593 — 13th highest

22. Kansas
> Beer shipment per adult 21+ in 2020: 27.4 gallons per adult
> 5 yr. change (2016-2020): 3.4% — 3rd largest increase ( 0.9 gallons)
> 10 yr. change (2010-2020): -5.2% — 5th smallest decrease (-1.5 gallons)
> Beer tax rate: $0.18 per gallon — 18th lowest
> Adults who report excessive drinking: 18.7% — 24th lowest
> Median household income: $62,087 — 24th lowest
[in-text-ad-2]

21. Delaware
> Beer shipment per adult 21+ in 2020: 27.4 gallons per adult
> 5 yr. change (2016-2020): -9.9% — 8th largest decrease ( -3.0 gallons)
> 10 yr. change (2010-2020): -20.6% — 4th largest decrease (-7.1 gallons)
> Beer tax rate: $0.26 per gallon — 24th highest
> Adults who report excessive drinking: 16.8% — 13th lowest
> Median household income: $70,176 — 16th highest

20. New Mexico
> Beer shipment per adult 21+ in 2020: 27.7 gallons per adult
> 5 yr. change (2016-2020): -4.5% — 15th smallest decrease ( -1.3 gallons)
> 10 yr. change (2010-2020): -17.6% — 8th largest decrease (-5.9 gallons)
> Beer tax rate: $0.41 per gallon — 15th highest
> Adults who report excessive drinking: 16.2% — 9th lowest
> Median household income: $51,945 — 6th lowest
[in-text-ad]

19. Oregon
> Beer shipment per adult 21+ in 2020: 27.7 gallons per adult
> 5 yr. change (2016-2020): -9.5% — 9th largest decrease ( -2.9 gallons)
> 10 yr. change (2010-2020): -11.5% — 24th smallest decrease (-3.6 gallons)
> Beer tax rate: $0.08 per gallon — 6th lowest
> Adults who report excessive drinking: 18.6% — 23rd lowest
> Median household income: $67,058 — 18th highest
18. Washington
> Beer shipment per adult 21+ in 2020: 27.8 gallons per adult
> 5 yr. change (2016-2020): -1.1% — 3rd smallest decrease ( -0.3 gallons)
> 10 yr. change (2010-2020): -9.4% — 19th smallest decrease (-2.9 gallons)
> Beer tax rate: $0.26 per gallon — 25th highest
> Adults who report excessive drinking: 17.4% — 20th lowest
> Median household income: $78,687 — 7th highest

17. Louisiana
> Beer shipment per adult 21+ in 2020: 28.1 gallons per adult
> 5 yr. change (2016-2020): -7.3% — 17th largest decrease ( -2.2 gallons)
> 10 yr. change (2010-2020): -19.3% — 5th largest decrease (-6.7 gallons)
> Beer tax rate: $0.4 per gallon — 16th highest
> Adults who report excessive drinking: 19.6% — 19th highest
> Median household income: $51,073 — 4th lowest
[in-text-ad-2]
16. Colorado
> Beer shipment per adult 21+ in 2020: 28.4 gallons per adult
> 5 yr. change (2016-2020): -1.7% — 6th smallest decrease ( -0.5 gallons)
> 10 yr. change (2010-2020): -6.9% — 12th smallest decrease (-2.1 gallons)
> Beer tax rate: $0.08 per gallon — 5th lowest
> Adults who report excessive drinking: 20.5% — 12th highest
> Median household income: $77,127 — 9th highest

15. Alabama
> Beer shipment per adult 21+ in 2020: 28.7 gallons per adult
> 5 yr. change (2016-2020): -4.3% — 12nd smallest decrease ( -1.3 gallons)
> 10 yr. change (2010-2020): -5.9% — 6th smallest decrease (-1.8 gallons)
> Beer tax rate: $0.53 per gallon — 8th highest
> Adults who report excessive drinking: 13.9% — 4th lowest
> Median household income: $51,734 — 5th lowest
[in-text-ad]

14. Nevada
> Beer shipment per adult 21+ in 2020: 28.8 gallons per adult
> 5 yr. change (2016-2020): -14.3% — 2nd largest decrease ( -4.8 gallons)
> 10 yr. change (2010-2020): -23.2% — 2nd largest decrease (-8.7 gallons)
> Beer tax rate: $0.16 per gallon — 15th lowest
> Adults who report excessive drinking: 19.3% — 22nd highest
> Median household income: $63,276 — 24th highest
13. Wyoming
> Beer shipment per adult 21+ in 2020: 30.0 gallons per adult
> 5 yr. change (2016-2020): 1.7% — 2nd smallest increase ( 0.5 gallons)
> 10 yr. change (2010-2020): -11.8% — 25th largest decrease (-4.0 gallons)
> Beer tax rate: $0.02 per gallon — the lowest
> Adults who report excessive drinking: 19.8% — 15th highest
> Median household income: $65,003 — 19th highest

12. Iowa
> Beer shipment per adult 21+ in 2020: 30.9 gallons per adult
> 5 yr. change (2016-2020): -5.5% — 20th smallest decrease ( -1.8 gallons)
> 10 yr. change (2010-2020): -12.5% — 21st largest decrease (-4.4 gallons)
> Beer tax rate: $0.19 per gallon — 19th lowest
> Adults who report excessive drinking: 22.1% — 3rd highest
> Median household income: $61,691 — 21st lowest
[in-text-ad-2]
11. Nebraska
> Beer shipment per adult 21+ in 2020: 31.3 gallons per adult
> 5 yr. change (2016-2020): -8.2% — 11th largest decrease ( -2.8 gallons)
> 10 yr. change (2010-2020): -12.3% — 22nd largest decrease (-4.4 gallons)
> Beer tax rate: $0.31 per gallon — 20th highest
> Adults who report excessive drinking: 21.7% — 4th highest
> Median household income: $63,229 — 25th highest

10. Mississippi
> Beer shipment per adult 21+ in 2020: 31.5 gallons per adult
> 5 yr. change (2016-2020): -2.2% — 7th smallest decrease ( -0.7 gallons)
> 10 yr. change (2010-2020): -9.0% — 17th smallest decrease (-3.1 gallons)
> Beer tax rate: $0.43 per gallon — 13th highest
> Adults who report excessive drinking: 13.6% — 3rd lowest
> Median household income: $45,792 — the lowest
[in-text-ad]

9. Texas
> Beer shipment per adult 21+ in 2020: 32.0 gallons per adult
> 5 yr. change (2016-2020): -1.5% — 4th smallest decrease ( -0.5 gallons)
> 10 yr. change (2010-2020): -8.0% — 14th smallest decrease (-2.8 gallons)
> Beer tax rate: $0.2 per gallon — 20th lowest
> Adults who report excessive drinking: 19.5% — 20th highest
> Median household income: $64,034 — 22nd highest

8. Wisconsin
> Beer shipment per adult 21+ in 2020: 32.3 gallons per adult
> 5 yr. change (2016-2020): -8.0% — 13th largest decrease ( -2.8 gallons)
> 10 yr. change (2010-2020): -12.9% — 15th largest decrease (-4.8 gallons)
> Beer tax rate: $0.06 per gallon — 3rd lowest
> Adults who report excessive drinking: 24.2% — the highest
> Median household income: $64,168 — 21st highest
7. South Carolina
> Beer shipment per adult 21+ in 2020: 32.5 gallons per adult
> 5 yr. change (2016-2020): 2.8% — 4th largest increase ( 0.9 gallons)
> 10 yr. change (2010-2020): -3.3% — 2nd smallest decrease (-1.1 gallons)
> Beer tax rate: $0.77 per gallon — 5th highest
> Adults who report excessive drinking: 17.4% — 18th lowest
> Median household income: $56,227 — 10th lowest
[in-text-ad-2]
6. Maine
> Beer shipment per adult 21+ in 2020: 32.5 gallons per adult
> 5 yr. change (2016-2020): -3.8% — 9th smallest decrease ( -1.3 gallons)
> 10 yr. change (2010-2020): 0.3% — the smallest increase (0.1 gallons)
> Beer tax rate: $0.35 per gallon — 18th highest
> Adults who report excessive drinking: 20.2% — 13th highest
> Median household income: $58,924 — 16th lowest

5. Vermont
> Beer shipment per adult 21+ in 2020: 33.9 gallons per adult
> 5 yr. change (2016-2020): 1.8% — 3rd smallest increase ( 0.6 gallons)
> 10 yr. change (2010-2020): -3.7% — 4th smallest decrease (-1.3 gallons)
> Beer tax rate: $0.27 per gallon — 23rd highest
> Adults who report excessive drinking: 19.5% — 21st highest
> Median household income: $63,001 — 25th lowest
[in-text-ad]
4. North Dakota
> Beer shipment per adult 21+ in 2020: 37.2 gallons per adult
> 5 yr. change (2016-2020): -4.4% — 13th smallest decrease ( -1.7 gallons)
> 10 yr. change (2010-2020): -9.5% — 20th smallest decrease (-3.9 gallons)
> Beer tax rate: $0.45 per gallon — 12th highest
> Adults who report excessive drinking: 24.1% — 2nd highest
> Median household income: $64,577 — 20th highest

3. South Dakota
> Beer shipment per adult 21+ in 2020: 37.3 gallons per adult
> 5 yr. change (2016-2020): -3.9% — 10th smallest decrease ( -1.5 gallons)
> 10 yr. change (2010-2020): -3.4% — 3rd smallest decrease (-1.3 gallons)
> Beer tax rate: $0.27 per gallon — 22nd highest
> Adults who report excessive drinking: 19.0% — 25th highest
> Median household income: $59,533 — 18th lowest

2. Montana
> Beer shipment per adult 21+ in 2020: 41.0 gallons per adult
> 5 yr. change (2016-2020): 2.2% — 4th smallest increase ( 0.9 gallons)
> 10 yr. change (2010-2020): -1.2% — the smallest decrease (-0.5 gallons)
> Beer tax rate: $0.14 per gallon — 11th lowest
> Adults who report excessive drinking: 20.9% — 10th highest
> Median household income: $57,153 — 11th lowest
[in-text-ad-2]

1. New Hampshire
> Beer shipment per adult 21+ in 2020: 41.4 gallons per adult
> 5 yr. change (2016-2020): 0.0% — no change
> 10 yr. change (2010-2020): -6.3% — 8th smallest decrease (-2.8 gallons)
> Beer tax rate: $0.3 per gallon — 21st highest
> Adults who report excessive drinking: 20.7% — 11th highest
> Median household income: $77,933 — 8th highest
Methodology
To identify the states drinking the most and least beer, 24/7 Tempo reviewed beer shipment data per capita in 2016 through 2020 provided by Beer Marketer’s Insights, a brewing industry trade publisher. States are ranked on shipment figures in gallons per adult — people 21 and over — in each state for 2020. Consumption is based on shipment volumes to each state.
Data on adults reporting excessive drinking of any form of alcohol, not just beer, came from 2020 County Health Rankings & Roadmaps, a Robert Wood Johnson Foundation and University of Wisconsin Population Health Institute joint program. Information on beer tax came from the Tax Foundation, a think tank that tracks U.S. tax policies.
Population and median household income came from the Census Bureau’s 2019 American Community Survey.
Cash Back Credit Cards Have Never Been This Good
Credit card companies are at war, handing out free rewards and benefits to win the best customers. A good cash back card can be worth thousands of dollars a year in free money, not to mention other perks like travel, insurance, and access to fancy lounges. See our top picks for the best credit cards today. You won’t want to miss some of these offers.
Flywheel Publishing has partnered with CardRatings for our coverage of credit card products. Flywheel Publishing and CardRatings may receive a commission from card issuers.
Thank you for reading! Have some feedback for us?
Contact the 24/7 Wall St. editorial team.


 24/7 Wall St.


 24/7 Wall St.

 24/7 Wall St.


 24/7 Wall St.
