Special Report
This Is How Many People Have Died From COVID-19 in Each State

Published:

Since the first death attributable to COVID-19 was reported in the United States on Feb. 29, 2020, an estimated 552,928 Americans have died — and that number continues to grow every day. Over the last seven-day period, an average of 1,015 Americans diagnosed with COVID-19 have died each day.
Adjusting for population, no state has reported more coronavirus deaths than New Jersey. Since the pandemic began, New Jersey has reported a total of 24,700 deaths — or 277 for every 100,000 people. Per capita deaths attributable to the virus are also high in New York, Massachusetts, Rhode Island, and Arizona. In each of these places, the death rate stands at at least 237 per 100,000 people.
For context, the national COVID-19 death rate stands at 169 deaths for every 100,000 people.
To date, Hawaii has reported the fewest coronavirus deaths on a per capita basis. There have been an estimated 33 COVID-19 deaths across the state for every 100,000 people since the pandemic began.
Though it is not always the case, states with higher than average COVID-19 deaths per capita are often also home to larger high-risk populations. One such group is retirement-age Americans, who are at least 90 times more likely to die from the virus if infected than those in the 18 to 29 age group. Nationwide, 16.5% of the population fall into that age group.
Though the U.S. has one of the highest per capita COVID-19 death rates in the world, Americans infected with the virus today appear more likely to survive than those who were infected earlier in the pandemic. Medical care providers now have months of experience treating COVID-19, and over that period have established more effective practices in treating the disease. According to one study conducted by researchers at the NYU Grossman School of Medicine released in October, the chances of death among critically ill patients was 18 percentage points lower in August 2020 than it was in March.
And now, inoculations against the coronavirus are underway in the United States, which will inevitably contribute to a reduction in the death rate.
All COVID-19 data used in the story is current as of April 8, 2021.

Alabama
> Total COVID-19 deaths in Alabama: 218 per 100,000 people (total: 10,652)
> Total COVID-19 infections in Alabama: 10,580 per 100,000 people (total: 517,114)
> 65 and older population: 17.4%
> Total population: 4,887,871

Alaska
> Total COVID-19 deaths in Alaska: 42 per 100,000 people (total: 309)
> Total COVID-19 infections in Alaska: 8,337 per 100,000 people (total: 61,480)
> 65 and older population: 12.4%
> Total population: 737,438
These are all the counties in Alaska where COVID-19 is slowing (and where it’s still getting worse).

Arizona
> Total COVID-19 deaths in Arizona: 237 per 100,000 people (total: 16,996)
> Total COVID-19 infections in Arizona: 11,789 per 100,000 people (total: 845,480)
> 65 and older population: 18.0%
> Total population: 7,171,646

Arkansas
> Total COVID-19 deaths in Arkansas: 188 per 100,000 people (total: 5,653)
> Total COVID-19 infections in Arkansas: 10,991 per 100,000 people (total: 331,261)
> 65 and older population: 17.4%
> Total population: 3,013,825

California
> Total COVID-19 deaths in California: 148 per 100,000 people (total: 58,541)
> Total COVID-19 infections in California: 9,060 per 100,000 people (total: 3,583,830)
> 65 and older population: 14.8%
> Total population: 39,557,045

Colorado
> Total COVID-19 deaths in Colorado: 108 per 100,000 people (total: 6,132)
> Total COVID-19 infections in Colorado: 8,256 per 100,000 people (total: 470,254)
> 65 and older population: 14.7%
> Total population: 5,695,564

Connecticut
> Total COVID-19 deaths in Connecticut: 222 per 100,000 people (total: 7,930)
> Total COVID-19 infections in Connecticut: 8,893 per 100,000 people (total: 317,729)
> 65 and older population: 17.6%
> Total population: 3,572,665

Delaware
> Total COVID-19 deaths in Delaware: 162 per 100,000 people (total: 1,567)
> Total COVID-19 infections in Delaware: 10,009 per 100,000 people (total: 96,806)
> 65 and older population: 19.5%
> Total population: 967,171

Florida
> Total COVID-19 deaths in Florida: 159 per 100,000 people (total: 33,780)
> Total COVID-19 infections in Florida: 9,632 per 100,000 people (total: 2,051,647)
> 65 and older population: 20.9%
> Total population: 21,299,325

Georgia
> Total COVID-19 deaths in Georgia: 183 per 100,000 people (total: 19,238)
> Total COVID-19 infections in Georgia: 10,140 per 100,000 people (total: 1,066,671)
> 65 and older population: 14.3%
> Total population: 10,519,475

Hawaii
> Total COVID-19 deaths in Hawaii: 33 per 100,000 people (total: 464)
> Total COVID-19 infections in Hawaii: 2,063 per 100,000 people (total: 29,311)
> 65 and older population: 19.0%
> Total population: 1,420,491
These are all the counties in Hawaii where COVID-19 is slowing (and where it’s still getting worse).

Idaho
> Total COVID-19 deaths in Idaho: 113 per 100,000 people (total: 1,974)
> Total COVID-19 infections in Idaho: 10,385 per 100,000 people (total: 182,182)
> 65 and older population: 16.2%
> Total population: 1,754,208
These are all the counties in Idaho where COVID-19 is slowing (and where it’s still getting worse).

Illinois
> Total COVID-19 deaths in Illinois: 186 per 100,000 people (total: 23,673)
> Total COVID-19 infections in Illinois: 9,902 per 100,000 people (total: 1,261,667)
> 65 and older population: 16.1%
> Total population: 12,741,080

Indiana
> Total COVID-19 deaths in Indiana: 196 per 100,000 people (total: 13,084)
> Total COVID-19 infections in Indiana: 10,344 per 100,000 people (total: 692,240)
> 65 and older population: 16.1%
> Total population: 6,691,878

Iowa
> Total COVID-19 deaths in Iowa: 185 per 100,000 people (total: 5,835)
> Total COVID-19 infections in Iowa: 11,218 per 100,000 people (total: 354,072)
> 65 and older population: 17.5%
> Total population: 3,156,145
These are all the counties in Iowa where COVID-19 is slowing (and where it’s still getting worse).

Kansas
> Total COVID-19 deaths in Kansas: 169 per 100,000 people (total: 4,927)
> Total COVID-19 infections in Kansas: 10,415 per 100,000 people (total: 303,227)
> 65 and older population: 16.4%
> Total population: 2,911,510
These are all the counties in Kansas where COVID-19 is slowing (and where it’s still getting worse).

Kentucky
> Total COVID-19 deaths in Kentucky: 138 per 100,000 people (total: 6,184)
> Total COVID-19 infections in Kentucky: 9,620 per 100,000 people (total: 429,841)
> 65 and older population: 16.9%
> Total population: 4,468,402

Louisiana
> Total COVID-19 deaths in Louisiana: 218 per 100,000 people (total: 10,174)
> Total COVID-19 infections in Louisiana: 9,591 per 100,000 people (total: 446,955)
> 65 and older population: 16.0%
> Total population: 4,659,978

Maine
> Total COVID-19 deaths in Maine: 56 per 100,000 people (total: 747)
> Total COVID-19 infections in Maine: 3,936 per 100,000 people (total: 52,679)
> 65 and older population: 21.3%
> Total population: 1,338,404
These are all the counties in Maine where COVID-19 is slowing (and where it’s still getting worse).

Maryland
> Total COVID-19 deaths in Maryland: 139 per 100,000 people (total: 8,378)
> Total COVID-19 infections in Maryland: 6,935 per 100,000 people (total: 419,055)
> 65 and older population: 15.9%
> Total population: 6,042,718

Massachusetts
> Total COVID-19 deaths in Massachusetts: 249 per 100,000 people (total: 17,201)
> Total COVID-19 infections in Massachusetts: 8,974 per 100,000 people (total: 619,429)
> 65 and older population: 17.0%
> Total population: 6,902,149

Michigan
> Total COVID-19 deaths in Michigan: 174 per 100,000 people (total: 17,343)
> Total COVID-19 infections in Michigan: 7,864 per 100,000 people (total: 786,123)
> 65 and older population: 17.7%
> Total population: 9,995,915

Minnesota
> Total COVID-19 deaths in Minnesota: 124 per 100,000 people (total: 6,967)
> Total COVID-19 infections in Minnesota: 9,457 per 100,000 people (total: 530,662)
> 65 and older population: 16.3%
> Total population: 5,611,179

Mississippi
> Total COVID-19 deaths in Mississippi: 237 per 100,000 people (total: 7,077)
> Total COVID-19 infections in Mississippi: 10,266 per 100,000 people (total: 306,611)
> 65 and older population: 16.4%
> Total population: 2,986,530

Missouri
> Total COVID-19 deaths in Missouri: 139 per 100,000 people (total: 8,509)
> Total COVID-19 infections in Missouri: 9,486 per 100,000 people (total: 581,164)
> 65 and older population: 17.2%
> Total population: 6,126,452

Montana
> Total COVID-19 deaths in Montana: 139 per 100,000 people (total: 1,477)
> Total COVID-19 infections in Montana: 9,916 per 100,000 people (total: 105,333)
> 65 and older population: 19.5%
> Total population: 1,062,305

Nebraska
> Total COVID-19 deaths in Nebraska: 113 per 100,000 people (total: 2,183)
> Total COVID-19 infections in Nebraska: 11,029 per 100,000 people (total: 212,785)
> 65 and older population: 16.1%
> Total population: 1,929,268

Nevada
> Total COVID-19 deaths in Nevada: 175 per 100,000 people (total: 5,297)
> Total COVID-19 infections in Nevada: 10,073 per 100,000 people (total: 305,652)
> 65 and older population: 16.2%
> Total population: 3,034,392
These are all the counties in Nevada where COVID-19 is slowing (and where it’s still getting worse).

New Hampshire
> Total COVID-19 deaths in New Hampshire: 92 per 100,000 people (total: 1,249)
> Total COVID-19 infections in New Hampshire: 6,378 per 100,000 people (total: 86,510)
> 65 and older population: 18.6%
> Total population: 1,356,458

New Jersey
> Total COVID-19 deaths in New Jersey: 277 per 100,000 people (total: 24,700)
> Total COVID-19 infections in New Jersey: 10,481 per 100,000 people (total: 933,736)
> 65 and older population: 16.6%
> Total population: 8,908,520

New Mexico
> Total COVID-19 deaths in New Mexico: 189 per 100,000 people (total: 3,960)
> Total COVID-19 infections in New Mexico: 9,200 per 100,000 people (total: 192,773)
> 65 and older population: 18.0%
> Total population: 2,095,428

New York
> Total COVID-19 deaths in New York: 258 per 100,000 people (total: 50,504)
> Total COVID-19 infections in New York: 9,832 per 100,000 people (total: 1,921,422)
> 65 and older population: 16.9%
> Total population: 19,542,209

North Carolina
> Total COVID-19 deaths in North Carolina: 117 per 100,000 people (total: 12,189)
> Total COVID-19 infections in North Carolina: 8,893 per 100,000 people (total: 923,430)
> 65 and older population: 16.7%
> Total population: 10,383,620
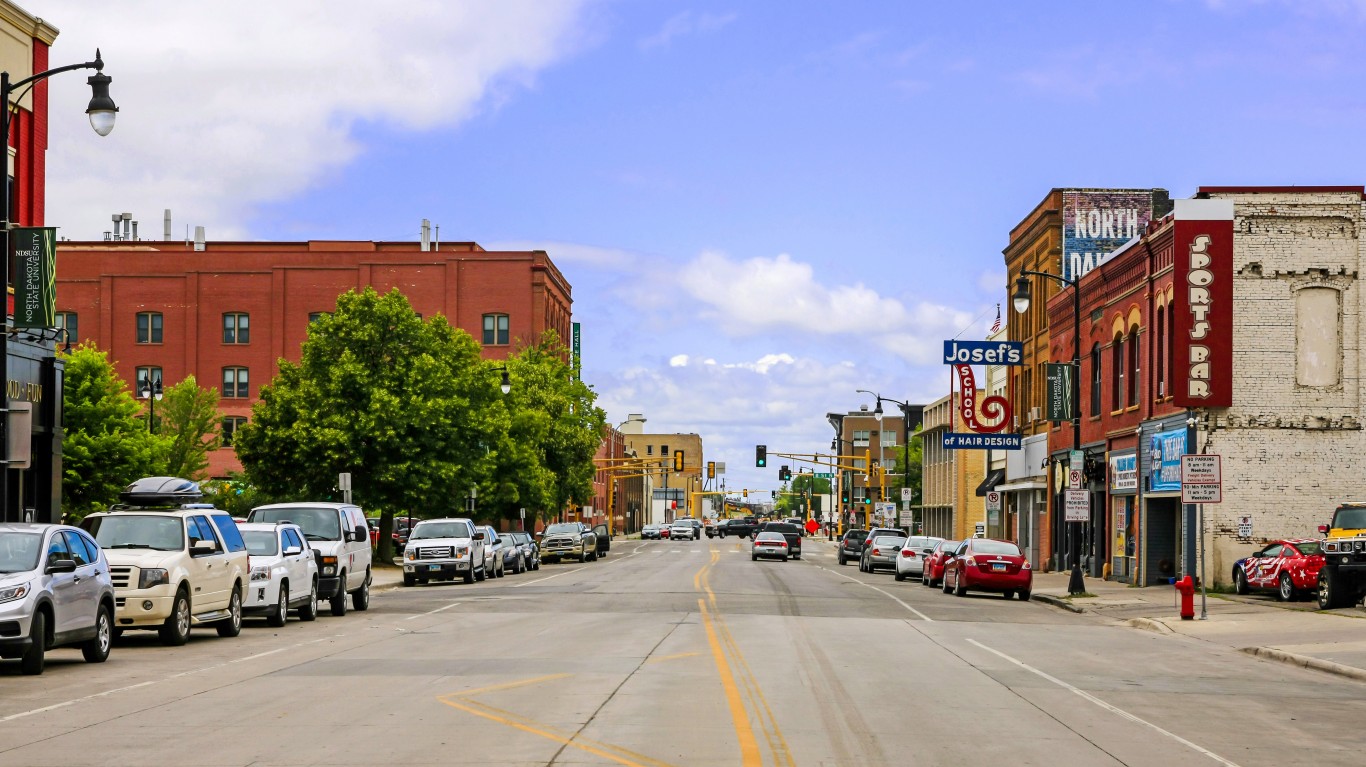
North Dakota
> Total COVID-19 deaths in North Dakota: 193 per 100,000 people (total: 1,468)
> Total COVID-19 infections in North Dakota: 13,705 per 100,000 people (total: 104,167)
> 65 and older population: 15.8%
> Total population: 760,077

Ohio
> Total COVID-19 deaths in Ohio: 160 per 100,000 people (total: 18,744)
> Total COVID-19 infections in Ohio: 8,801 per 100,000 people (total: 1,028,800)
> 65 and older population: 17.5%
> Total population: 11,689,442
These are all the counties in Ohio where COVID-19 is slowing (and where it’s still getting worse).

Oklahoma
> Total COVID-19 deaths in Oklahoma: 169 per 100,000 people (total: 6,675)
> Total COVID-19 infections in Oklahoma: 11,207 per 100,000 people (total: 441,906)
> 65 and older population: 16.1%
> Total population: 3,943,079

Oregon
> Total COVID-19 deaths in Oregon: 58 per 100,000 people (total: 2,427)
> Total COVID-19 infections in Oregon: 4,001 per 100,000 people (total: 167,658)
> 65 and older population: 18.2%
> Total population: 4,190,713
These are all the counties in Oregon where COVID-19 is slowing (and where it’s still getting worse).

Pennsylvania
> Total COVID-19 deaths in Pennsylvania: 197 per 100,000 people (total: 25,237)
> Total COVID-19 infections in Pennsylvania: 8,196 per 100,000 people (total: 1,049,655)
> 65 and older population: 18.7%
> Total population: 12,807,060

Rhode Island
> Total COVID-19 deaths in Rhode Island: 249 per 100,000 people (total: 2,632)
> Total COVID-19 infections in Rhode Island: 13,198 per 100,000 people (total: 139,549)
> 65 and older population: 17.7%
> Total population: 1,057,315

South Carolina
> Total COVID-19 deaths in South Carolina: 181 per 100,000 people (total: 9,213)
> Total COVID-19 infections in South Carolina: 10,988 per 100,000 people (total: 558,631)
> 65 and older population: 18.2%
> Total population: 5,084,127

South Dakota
> Total COVID-19 deaths in South Dakota: 220 per 100,000 people (total: 1,938)
> Total COVID-19 infections in South Dakota: 13,452 per 100,000 people (total: 118,680)
> 65 and older population: 17.4%
> Total population: 882,235

Tennessee
> Total COVID-19 deaths in Tennessee: 177 per 100,000 people (total: 11,967)
> Total COVID-19 infections in Tennessee: 12,083 per 100,000 people (total: 818,008)
> 65 and older population: 16.7%
> Total population: 6,770,010

Texas
> Total COVID-19 deaths in Texas: 167 per 100,000 people (total: 47,822)
> Total COVID-19 infections in Texas: 9,756 per 100,000 people (total: 2,800,254)
> 65 and older population: 12.9%
> Total population: 28,701,845
These are all the counties in Texas where COVID-19 is slowing (and where it’s still getting worse).

Utah
> Total COVID-19 deaths in Utah: 68 per 100,000 people (total: 2,137)
> Total COVID-19 infections in Utah: 12,268 per 100,000 people (total: 387,814)
> 65 and older population: 11.4%
> Total population: 3,161,105
These are all the counties in Utah where COVID-19 is slowing (and where it’s still getting worse).

Vermont
> Total COVID-19 deaths in Vermont: 37 per 100,000 people (total: 229)
> Total COVID-19 infections in Vermont: 3,253 per 100,000 people (total: 20,373)
> 65 and older population: 20.1%
> Total population: 626,299

Virginia
> Total COVID-19 deaths in Virginia: 122 per 100,000 people (total: 10,415)
> Total COVID-19 infections in Virginia: 7,386 per 100,000 people (total: 629,155)
> 65 and older population: 15.9%
> Total population: 8,517,685

Washington
> Total COVID-19 deaths in Washington: 70 per 100,000 people (total: 5,299)
> Total COVID-19 infections in Washington: 4,919 per 100,000 people (total: 370,652)
> 65 and older population: 15.9%
> Total population: 7,535,591

Washington D.C.
> Total COVID-19 deaths in Washington D.C.: 157 per 100,000 people (total: 1,074)
> Total COVID-19 infections in Washington D.C.: 6,608 per 100,000 people (total: 45,234)
> 65 and older population: 12.4%
> Total population: 702,455
Click here to see all current COVID-19 data for Washington D.C.

West Virginia
> Total COVID-19 deaths in West Virginia: 150 per 100,000 people (total: 2,707)
> Total COVID-19 infections in West Virginia: 7,975 per 100,000 people (total: 144,010)
> 65 and older population: 20.5%
> Total population: 1,805,832

Wisconsin
> Total COVID-19 deaths in Wisconsin: 126 per 100,000 people (total: 7,349)
> Total COVID-19 infections in Wisconsin: 11,021 per 100,000 people (total: 640,704)
> 65 and older population: 17.5%
> Total population: 5,813,568
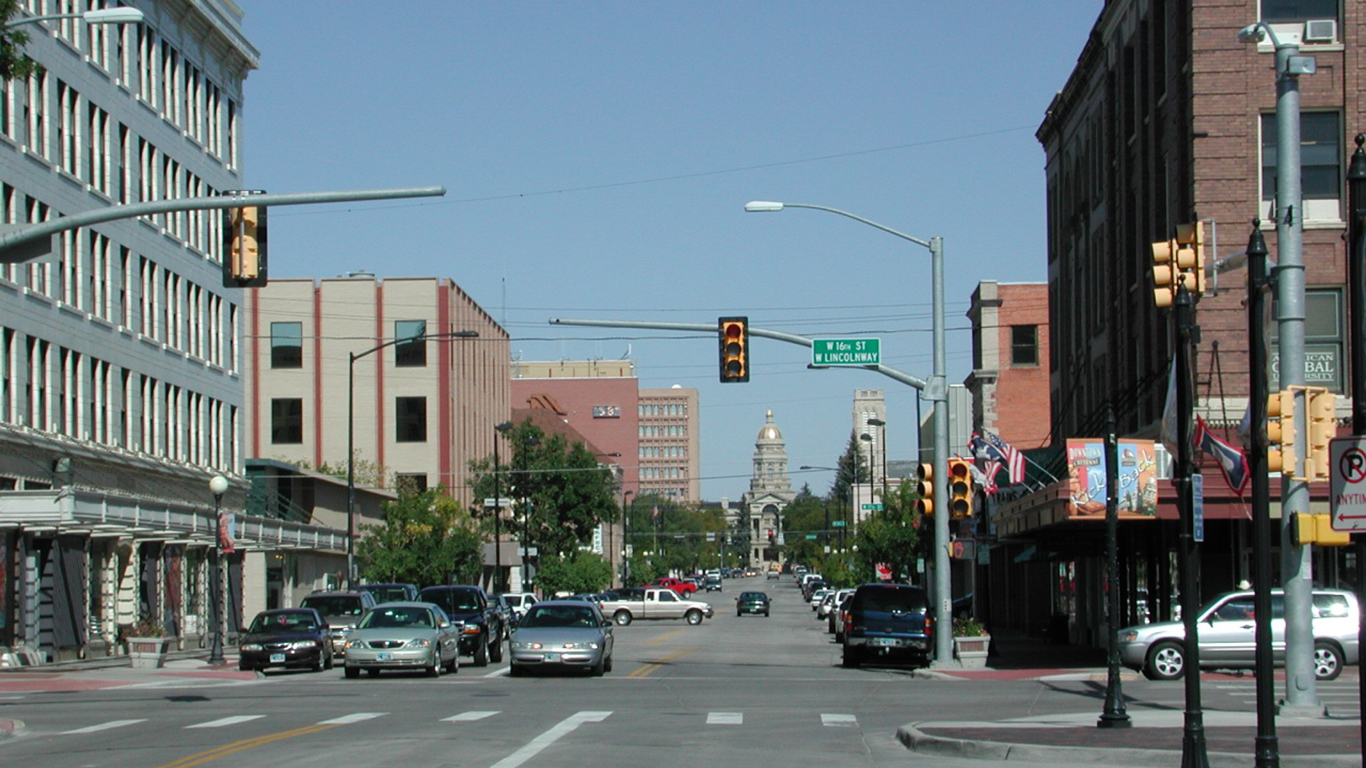
Wyoming
> Total COVID-19 deaths in Wyoming: 121 per 100,000 people (total: 701)
> Total COVID-19 infections in Wyoming: 9,800 per 100,000 people (total: 56,619)
> 65 and older population: 17.1%
> Total population: 577,737
Click here to see all coronavirus data for every state.
Let’s face it: If your money is just sitting in a checking account, you’re losing value every single day. With most checking accounts offering little to no interest, the cash you worked so hard to save is gradually being eroded by inflation.
However, by moving that money into a high-yield savings account, you can put your cash to work, growing steadily with little to no effort on your part. In just a few clicks, you can set up a high-yield savings account and start earning interest immediately.
There are plenty of reputable banks and online platforms that offer competitive rates, and many of them come with zero fees and no minimum balance requirements. Click here to see if you’re earning the best possible rate on your money!
Thank you for reading! Have some feedback for us?
Contact the 24/7 Wall St. editorial team.