Mortgage rates have risen in the past two months, and so have home prices, continuing the trend of the past year. This could cause an affordability squeeze for homebuyers, who continue to look for new places to live, often outside big cities that have been plagued by the COVID-19 pandemic. One measure economists consider in order to determine housing affordability is the total monthly home payments as a percentage of a person’s or household’s income. These payments include mortgage, taxes, and insurance.
Real estate research firm ATTOM Data Solutions recently issued its first-quarter 2021 U.S. Home Affordability Report. In it, the company based its figures “on a median-priced home, assuming an 20 percent down payment and a 28 percent maximum “front-end” debt-to-income ratio.”
To determine the county with the cheapest homes, 24/7 Wall St. reviewed the report and ranked counties on their ratio of annual wages to housing costs of a median priced home. Income data, based on annualized weekly wages, came from the Bureau of Labor Statistics.
Home prices nationwide rose 18% in the first quarter, compared to the same period a year ago, to $278,000. Home prices rose at least 10% in two-third of the country. Commenting on the trends, Todd Teta, chief product officer with ATTOM Data Solutions, remarked:
“The past year certainly has been an odd one for the U.S. housing market. Home prices surged at a remarkable pace even as the virus pandemic damaged the U.S. economy, which dropped historical affordability levels. But average workers untarnished by the pandemic were still able to afford the typical home because wages and rock-bottom interest rates worked to their favor in a big way.”
Nationwide, home expenses in the first quarter accounted for 23.7% of wages, the data on the 552 counties showed. Yet there was a wide range between the cheapest and most expensive counties to buy a home. In some, residents needed less than 7% of annualized weekly wages to buy a home. In others, home costs accounted for over 75% of annualized weekly wages.
Counties where homes are least affordable by ATTOM’s metrics tend to have very high incomes. Conversely, of the 33 least expensive places to own homes, just five have annual earnings higher than the typical U.S. earnings of just under $62,000. This is the poorest county in every state.
Click here to see the counties with the cheapest homes in America.

33. Sangamon County, Illinois
> Pct. of annual wages needed to afford median monthly housing costs: 13.9%
> Annualized weekly wages: $58,162
> Median home price, Q1 2021: $126,500
[in-text-ad]

32. Madison County, Indiana
> Pct. of annual wages needed to afford median monthly housing costs: 13.8%
> Annualized weekly wages: $42,042
> Median home price, Q1 2021: $115,900

31. Columbiana County, Ohio
> Pct. of annual wages needed to afford median monthly housing costs: 13.6%
> Annualized weekly wages: $41,132
> Median home price, Q1 2021: $106,800

30. Saginaw County, Michigan
> Pct. of annual wages needed to afford median monthly housing costs: 13.6%
> Annualized weekly wages: $48,633
> Median home price, Q1 2021: $115,000
[in-text-ad-2]

29. Allen County, Ohio
> Pct. of annual wages needed to afford median monthly housing costs: 13.5%
> Annualized weekly wages: $47,957
> Median home price, Q1 2021: $120,000

28. Houston County, Alabama
> Pct. of annual wages needed to afford median monthly housing costs: 13.4%
> Annualized weekly wages: $45,058
> Median home price, Q1 2021: $134,000
[in-text-ad]

27. Sullivan County, Tennessee
> Pct. of annual wages needed to afford median monthly housing costs: 13.4%
> Annualized weekly wages: $49,673
> Median home price, Q1 2021: $136,500
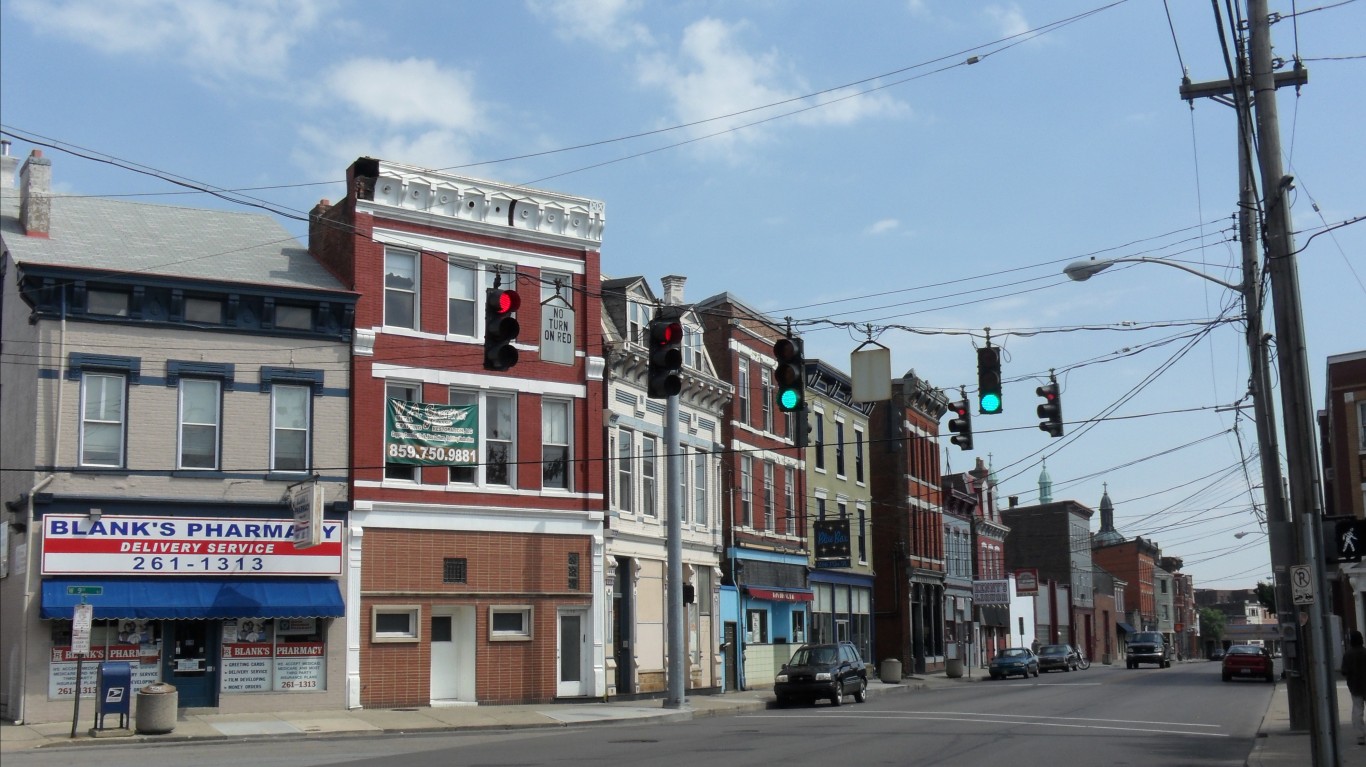
26. Kenton County, Kentucky
> Pct. of annual wages needed to afford median monthly housing costs: 13.4%
> Annualized weekly wages: $61,113
> Median home price, Q1 2021: $160,000
25. Jefferson County, Alabama
> Pct. of annual wages needed to afford median monthly housing costs: 13.4%
> Annualized weekly wages: $59,098
> Median home price, Q1 2021: $159,650
[in-text-ad-2]
24. Trumbull County, Ohio
> Pct. of annual wages needed to afford median monthly housing costs: 13.4%
> Annualized weekly wages: $41,223
> Median home price, Q1 2021: $94,850

23. La Salle County, Illinois
> Pct. of annual wages needed to afford median monthly housing costs: 13.3%
> Annualized weekly wages: $48,269
> Median home price, Q1 2021: $97,750
[in-text-ad]

22. Mercer County, Pennsylvania
> Pct. of annual wages needed to afford median monthly housing costs: 13.0%
> Annualized weekly wages: $44,876
> Median home price, Q1 2021: $100,900

21. Richmond County, Georgia
> Pct. of annual wages needed to afford median monthly housing costs: 12.6%
> Annualized weekly wages: $49,426
> Median home price, Q1 2021: $119,000

20. Blair County, Pennsylvania
> Pct. of annual wages needed to afford median monthly housing costs: 12.5%
> Annualized weekly wages: $44,668
> Median home price, Q1 2021: $130,000
[in-text-ad-2]

19. Montgomery County, Alabama
> Pct. of annual wages needed to afford median monthly housing costs: 12.5%
> Annualized weekly wages: $49,608
> Median home price, Q1 2021: $134,000

18. Clayton County, Georgia
> Pct. of annual wages needed to afford median monthly housing costs: 12.4%
> Annualized weekly wages: $62,036
> Median home price, Q1 2021: $150,000
[in-text-ad]

17. Delaware County, Indiana
> Pct. of annual wages needed to afford median monthly housing costs: 12.3%
> Annualized weekly wages: $43,615
> Median home price, Q1 2021: $107,053
16. Wayne County, Michigan
> Pct. of annual wages needed to afford median monthly housing costs: 12.2%
> Annualized weekly wages: $65,871
> Median home price, Q1 2021: $135,000

15. Mobile County, Alabama
> Pct. of annual wages needed to afford median monthly housing costs: 12.0%
> Annualized weekly wages: $50,323
> Median home price, Q1 2021: $127,000
[in-text-ad-2]

14. Calhoun County, Michigan
> Pct. of annual wages needed to afford median monthly housing costs: 11.9%
> Annualized weekly wages: $55,146
> Median home price, Q1 2021: $115,000

13. Baltimore City County, Maryland
> Pct. of annual wages needed to afford median monthly housing costs: 11.7%
> Annualized weekly wages: $70,876
> Median home price, Q1 2021: $145,000
[in-text-ad]

12. Rock Island County, Illinois
> Pct. of annual wages needed to afford median monthly housing costs: 11.7%
> Annualized weekly wages: $63,154
> Median home price, Q1 2021: $105,000

11. Chautauqua County, New York
> Pct. of annual wages needed to afford median monthly housing costs: 11.6%
> Annualized weekly wages: $43,498
> Median home price, Q1 2021: $92,365

10. Jackson County, Mississippi
> Pct. of annual wages needed to afford median monthly housing costs: 11.5%
> Annualized weekly wages: $52,273
> Median home price, Q1 2021: $117,380
[in-text-ad-2]

9. Peoria County, Illinois
> Pct. of annual wages needed to afford median monthly housing costs: 11.3%
> Annualized weekly wages: $62,517
> Median home price, Q1 2021: $104,500

8. Calcasieu County, Louisiana
> Pct. of annual wages needed to afford median monthly housing costs: 11.1%
> Annualized weekly wages: $53,105
> Median home price, Q1 2021: $124,000
[in-text-ad]

7. Calhoun County, Alabama
> Pct. of annual wages needed to afford median monthly housing costs: 11.0%
> Annualized weekly wages: $42,471
> Median home price, Q1 2021: $100,500

6. Cambria County, Pennsylvania
> Pct. of annual wages needed to afford median monthly housing costs: 10.8%
> Annualized weekly wages: $42,081
> Median home price, Q1 2021: $77,250

5. Robeson County, North Carolina
> Pct. of annual wages needed to afford median monthly housing costs: 10.6%
> Annualized weekly wages: $37,167
> Median home price, Q1 2021: $78,265
[in-text-ad-2]

4. Macon County, Illinois
> Pct. of annual wages needed to afford median monthly housing costs: 9.9%
> Annualized weekly wages: $53,729
> Median home price, Q1 2021: $80,270

3. Fayette County, Pennsylvania
> Pct. of annual wages needed to afford median monthly housing costs: 8.4%
> Annualized weekly wages: $42,952
> Median home price, Q1 2021: $63,600
[in-text-ad]
2. Bibb County, Georgia
> Pct. of annual wages needed to afford median monthly housing costs: 8.3%
> Annualized weekly wages: $46,020
> Median home price, Q1 2021: $71,000

1. Schuylkill County, Pennsylvania
> Pct. of annual wages needed to afford median monthly housing costs: 6.3%
> Annualized weekly wages: $45,110
> Median home price, Q1 2021: $45,270
The #1 Thing to Do Before You Claim Social Security (Sponsor)
Choosing the right (or wrong) time to claim Social Security can dramatically change your retirement. So, before making one of the biggest decisions of your financial life, it’s a smart idea to get an extra set of eyes on your complete financial situation.
A financial advisor can help you decide the right Social Security option for you and your family. Finding a qualified financial advisor doesn’t have to be hard. SmartAsset’s free tool matches you with up to three financial advisors who serve your area, and you can interview your advisor matches at no cost to decide which one is right for you.
Click here to match with up to 3 financial pros who would be excited to help you optimize your Social Security outcomes.
Have questions about retirement or personal finance? Email us at [email protected]!
By emailing your questions to 24/7 Wall St., you agree to have them published anonymously on a673b.bigscoots-temp.com.
By submitting your story, you understand and agree that we may use your story, or versions of it, in all media and platforms, including via third parties.
Thank you for reading! Have some feedback for us?
Contact the 24/7 Wall St. editorial team.
 24/7 Wall St.

 24/7 Wall St.
 24/7 Wall St.
 24/7 Wall St.