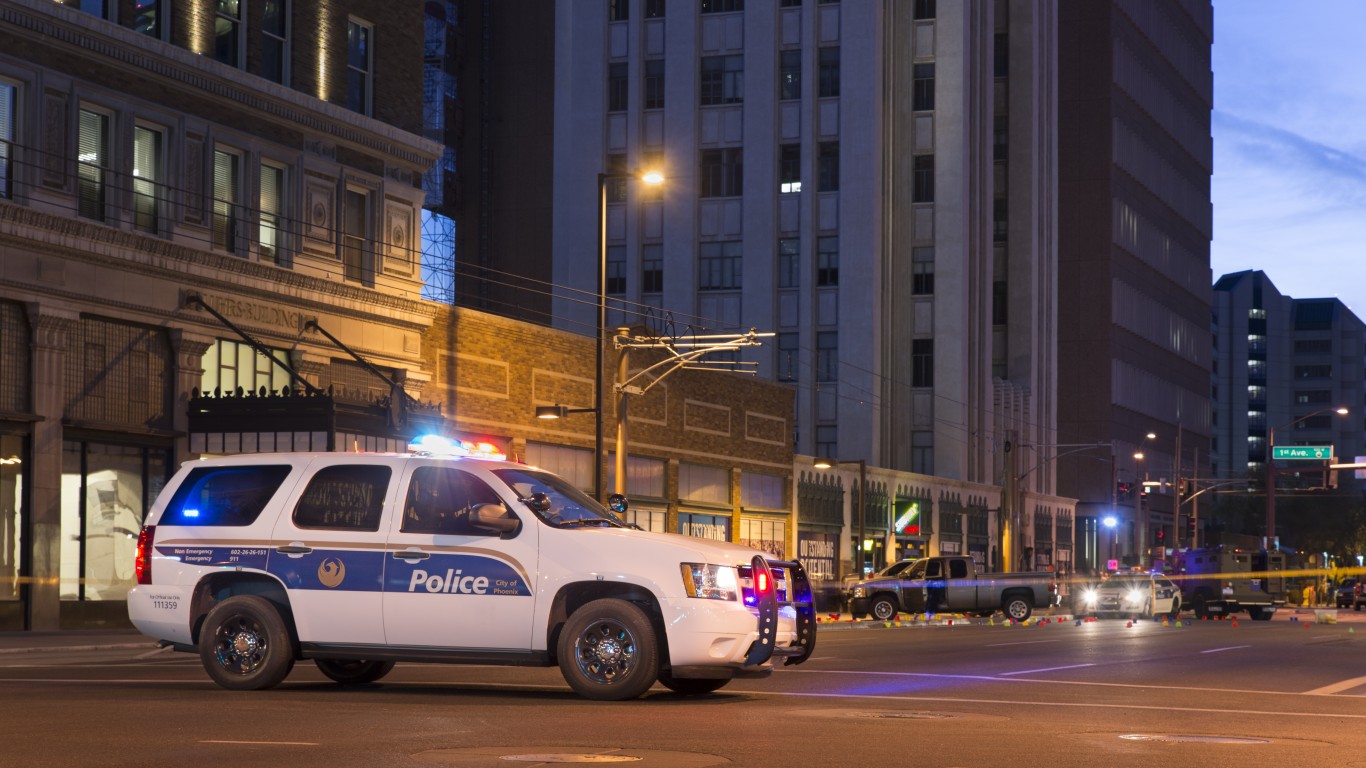
Although 2020 was the worst year for gun violence in America in decades, with both deaths and injuries soaring, other types of violent crime have declined in recent years. This continues a trend of decreasing crime rates in many major cities since a peak in the early 1990s.
For the past 80 years, the FBI has collected data on crime across the country and published a summary of its findings annually. Based on the bureau’s most recent report, 24/7 Wall St. has identified 25 cities where violent offenses have fallen most precipitously. Between 2014 and 2019, according to the FBI, violent crimes in these cities dropped by at least 25%.
“For the last three years,” said then-deputy director of the bureau Dave Bowdich when the report was published, “the Department of Justice has worked tirelessly with our federal, state, local, and tribal partners to pursue those violent criminals, cartels, and gangs who seek to harm our communities.”
Click here to see 25 cities where crime is falling.
Of the 25 cities with the steepest decline in violent crime listed here, 14 are in Florida, three are in Connecticut, and two are in New Jersey. The rest are scattered across the rest of the country, including the Midwest, Southwest, and West Coast. A low crime rate is only one of many reasons to consider the best cities to live in every state.
Despite falling crime rates in these areas, 2019 still saw 1.2 million violent crimes in the U.S., including assaults, robberies, rapes, and murders. While violent crimes have decreased in the cities on this list, here are the 25 cities where crime is soaring.

25. Punta Gorda, Florida
> 5-yr. change in violent crime rate: -25.2%
> Violent crimes reported in 2019: 196.2 per 100,000 people (total: 367)
> Violent crimes reported in 2014: 262.4 per 100,000 people (total: 439)
> Violent crime with largest pop.-adj. 5-yr. Increase: Robbery (-50.2%)
[in-text-ad]
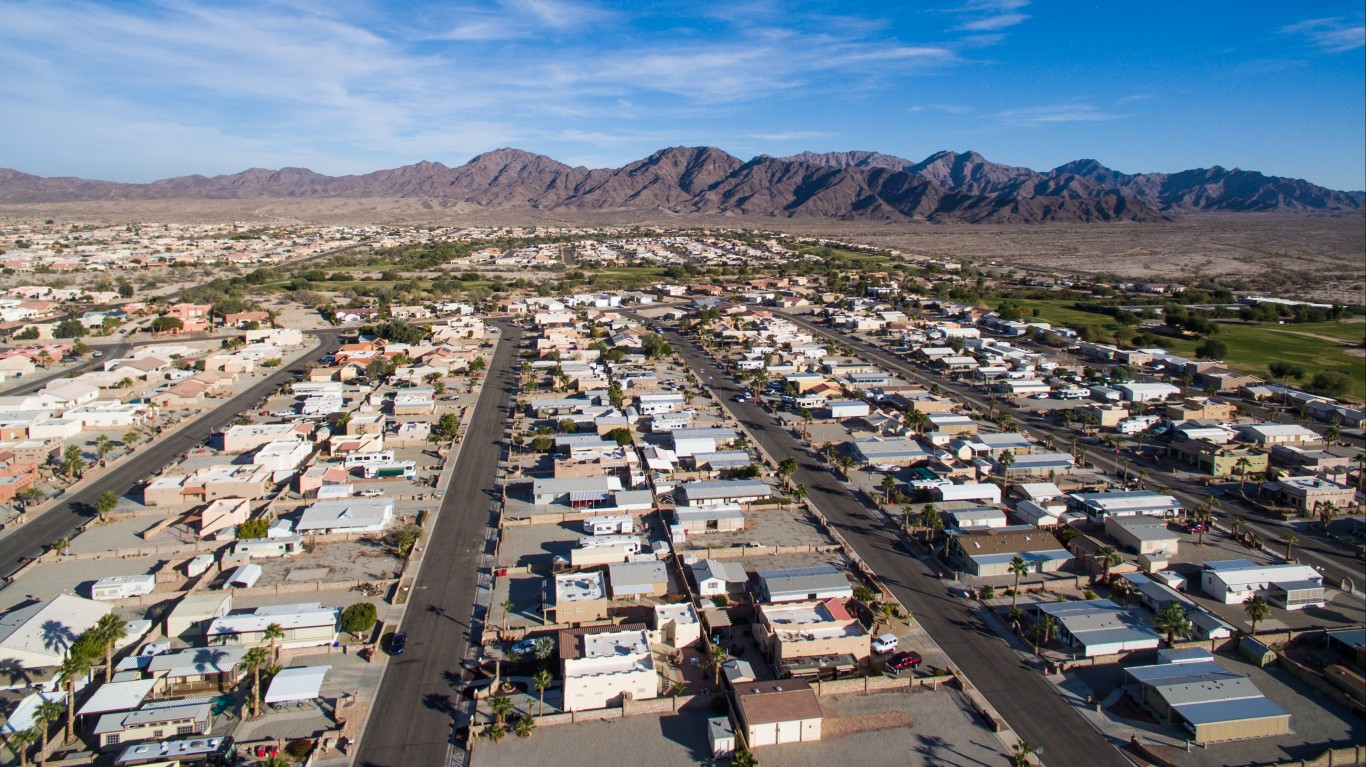
24. Yuma, Arizona
> 5-yr. change in violent crime rate: -25.4%
> Violent crimes reported in 2019: 277.8 per 100,000 people (total: 595)
> Violent crimes reported in 2014: 372.3 per 100,000 people (total: 759)
> Violent crime with largest pop.-adj. 5-yr. Increase: Robbery (-55.8%)
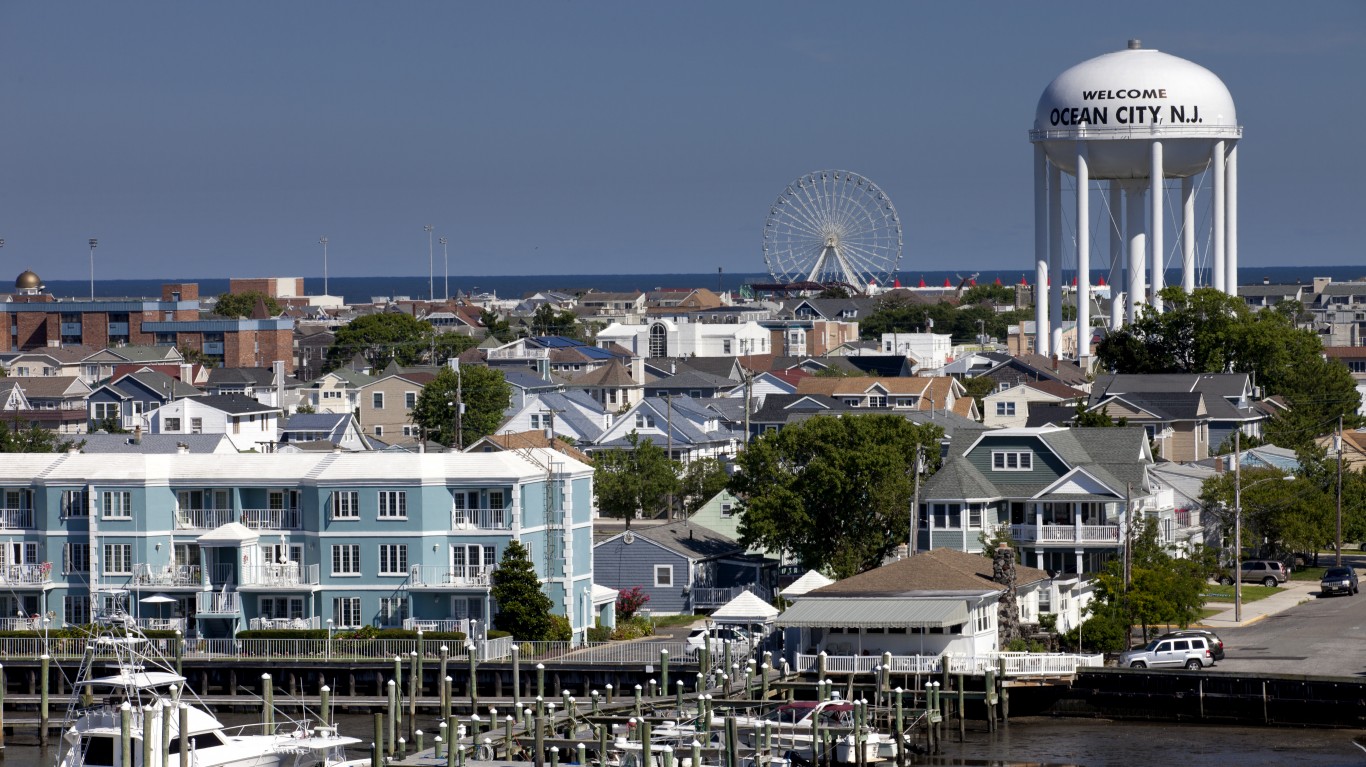
23. Ocean City, New Jersey
> 5-yr. change in violent crime rate: -26.2%
> Violent crimes reported in 2019: 175.8 per 100,000 people (total: 161)
> Violent crimes reported in 2014: 238.2 per 100,000 people (total: 228)
> Violent crime with largest pop.-adj. 5-yr. Increase: Robbery (-54.7%)

22. Lewiston, ID-WA
> 5-yr. change in violent crime rate: -26.2%
> Violent crimes reported in 2019: 138.9 per 100,000 people (total: 88)
> Violent crimes reported in 2014: 188.3 per 100,000 people (total: 118)
> Violent crime with largest pop.-adj. 5-yr. Increase: Murder (-66.7%)
[in-text-ad-2]

21. Worcester, MA-CT
> 5-yr. change in violent crime rate: -26.3%
> Violent crimes reported in 2019: 310.4 per 100,000 people (total: 2702)
> Violent crimes reported in 2014: 421.0 per 100,000 people (total: 3604)
> Violent crime with largest pop.-adj. 5-yr. Increase: Robbery (-47.5%)
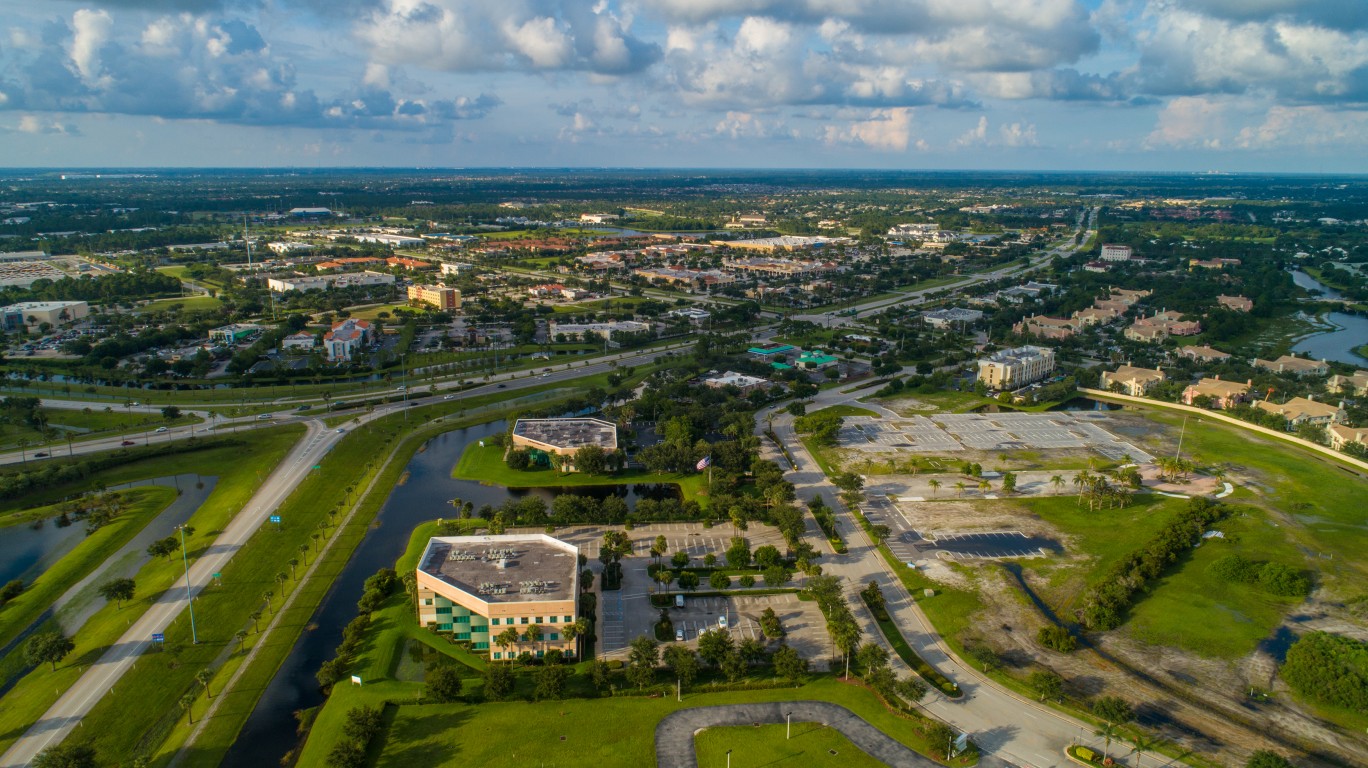
20. Port St. Lucie, Florida
> 5-yr. change in violent crime rate: -27.9%
> Violent crimes reported in 2019: 238.8 per 100,000 people (total: 1161)
> Violent crimes reported in 2014: 331.3 per 100,000 people (total: 1474)
> Violent crime with largest pop.-adj. 5-yr. Increase: Robbery (-38.1%)
[in-text-ad]
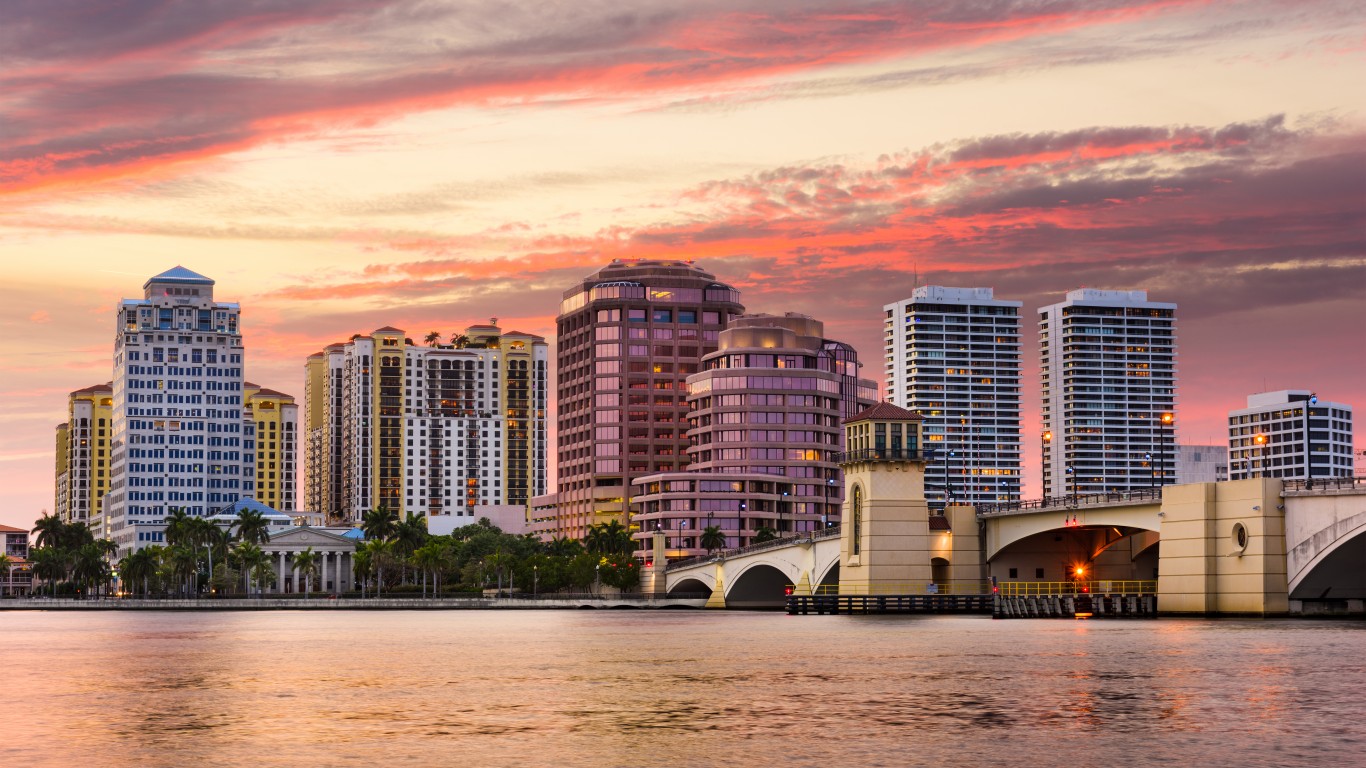
19. West Palm Beach-Boca Raton-Boynton Beach, Florida
> 5-yr. change in violent crime rate: -28.5%
> Violent crimes reported in 2019: 377.0 per 100,000 people (total: 5643)
> Violent crimes reported in 2014: 527.0 per 100,000 people (total: 7354)
> Violent crime with largest pop.-adj. 5-yr. Increase: Robbery (-36.1%)

18. Bridgeport-Stamford-Norwalk, Connecticut
> 5-yr. change in violent crime rate: -28.8%
> Violent crimes reported in 2019: 174.2 per 100,000 people (total: 1619)
> Violent crimes reported in 2014: 244.6 per 100,000 people (total: 2268)
> Violent crime with largest pop.-adj. 5-yr. Increase: Robbery (-34.5%)

17. Las Vegas-Henderson-Paradise, Nevada
> 5-yr. change in violent crime rate: -29.2%
> Violent crimes reported in 2019: 525.7 per 100,000 people (total: 11935)
> Violent crimes reported in 2014: 743.0 per 100,000 people (total: 15354)
> Violent crime with largest pop.-adj. 5-yr. Increase: Robbery (-53.9%)
[in-text-ad-2]
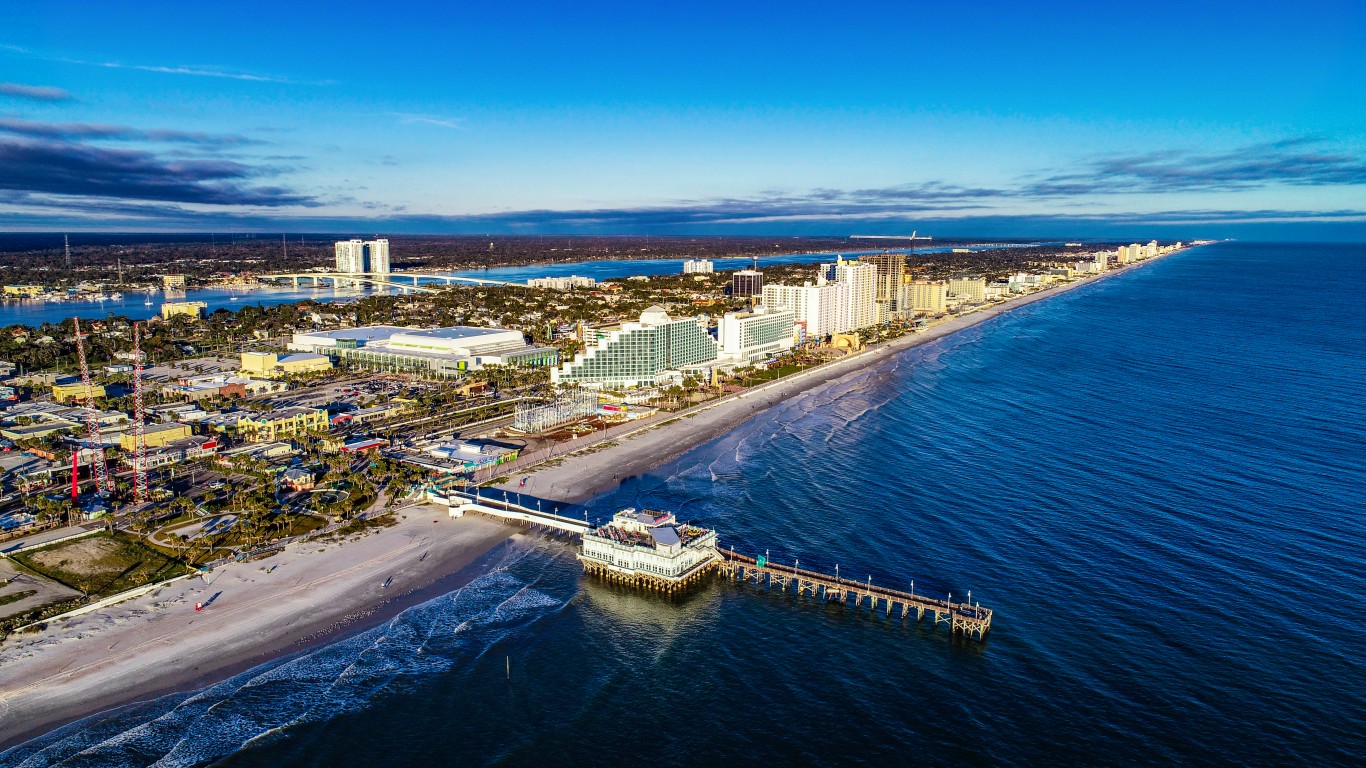
16. Deltona-Daytona Beach-Ormond Beach, Florida
> 5-yr. change in violent crime rate: -30.8%
> Violent crimes reported in 2019: 319.3 per 100,000 people (total: 2120)
> Violent crimes reported in 2014: 461.1 per 100,000 people (total: 2804)
> Violent crime with largest pop.-adj. 5-yr. Increase: Rape (-50.5%)

15. Springfield, Ohio
> 5-yr. change in violent crime rate: -32.9%
> Violent crimes reported in 2019: 246.5 per 100,000 people (total: 330)
> Violent crimes reported in 2014: 367.1 per 100,000 people (total: 498)
> Violent crime with largest pop.-adj. 5-yr. Increase: Rape (-69.2%)
[in-text-ad]

14. Atlantic City-Hammonton, New Jersey
> 5-yr. change in violent crime rate: -33.5%
> Violent crimes reported in 2019: 255.4 per 100,000 people (total: 672)
> Violent crimes reported in 2014: 384.0 per 100,000 people (total: 1062)
> Violent crime with largest pop.-adj. 5-yr. Increase: Robbery (-41.5%)

13. Palm Bay-Melbourne-Titusville, Florida
> 5-yr. change in violent crime rate: -33.8%
> Violent crimes reported in 2019: 371.0 per 100,000 people (total: 2224)
> Violent crimes reported in 2014: 560.4 per 100,000 people (total: 3121)
> Violent crime with largest pop.-adj. 5-yr. Increase: Aggravated assault (-36.4%)

12. Tampa-St. Petersburg-Clearwater, Florida
> 5-yr. change in violent crime rate: -34.7%
> Violent crimes reported in 2019: 292.1 per 100,000 people (total: 9254)
> Violent crimes reported in 2014: 447.5 per 100,000 people (total: 13043)
> Violent crime with largest pop.-adj. 5-yr. Increase: Robbery (-49.2%)
[in-text-ad-2]

11. Crestview-Fort Walton Beach-Destin, Florida
> 5-yr. change in violent crime rate: -37.2%
> Violent crimes reported in 2019: 313.2 per 100,000 people (total: 885)
> Violent crimes reported in 2014: 498.6 per 100,000 people (total: 1298)
> Violent crime with largest pop.-adj. 5-yr. Increase: Robbery (-61.1%)

10. Orlando-Kissimmee-Sanford, Florida
> 5-yr. change in violent crime rate: -37.3%
> Violent crimes reported in 2019: 429.9 per 100,000 people (total: 11242)
> Violent crimes reported in 2014: 685.4 per 100,000 people (total: 15901)
> Violent crime with largest pop.-adj. 5-yr. Increase: Robbery (-43.1%)
[in-text-ad]

9. Lakeland-Winter Haven, Florida
> 5-yr. change in violent crime rate: -38.7%
> Violent crimes reported in 2019: 277.5 per 100,000 people (total: 1990)
> Violent crimes reported in 2014: 452.9 per 100,000 people (total: 2867)
> Violent crime with largest pop.-adj. 5-yr. Increase: Robbery (-46.8%)

8. Pensacola-Ferry Pass-Brent, Florida
> 5-yr. change in violent crime rate: -39.1%
> Violent crimes reported in 2019: 409.7 per 100,000 people (total: 2037)
> Violent crimes reported in 2014: 672.8 per 100,000 people (total: 3194)
> Violent crime with largest pop.-adj. 5-yr. Increase: Aggravated assault (-43.1%)
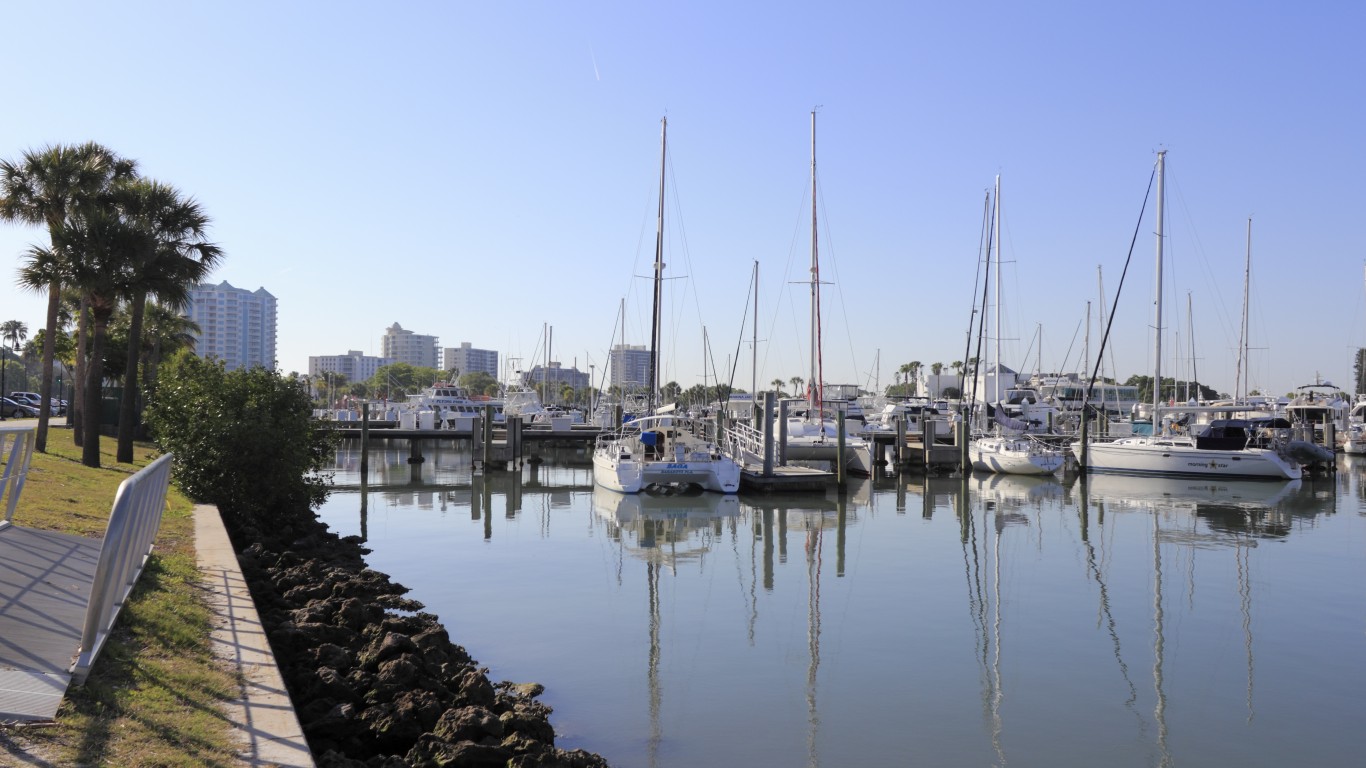
7. North Port-Sarasota-Bradenton, Florida
> 5-yr. change in violent crime rate: -39.5%
> Violent crimes reported in 2019: 328.4 per 100,000 people (total: 2732)
> Violent crimes reported in 2014: 542.8 per 100,000 people (total: 4049)
> Violent crime with largest pop.-adj. 5-yr. Increase: Robbery (-51.9%)
[in-text-ad-2]

6. Naples-Marco Island, Florida
> 5-yr. change in violent crime rate: -41.0%
> Violent crimes reported in 2019: 233.7 per 100,000 people (total: 896)
> Violent crimes reported in 2014: 396.2 per 100,000 people (total: 1374)
> Violent crime with largest pop.-adj. 5-yr. Increase: Robbery (-45.4%)
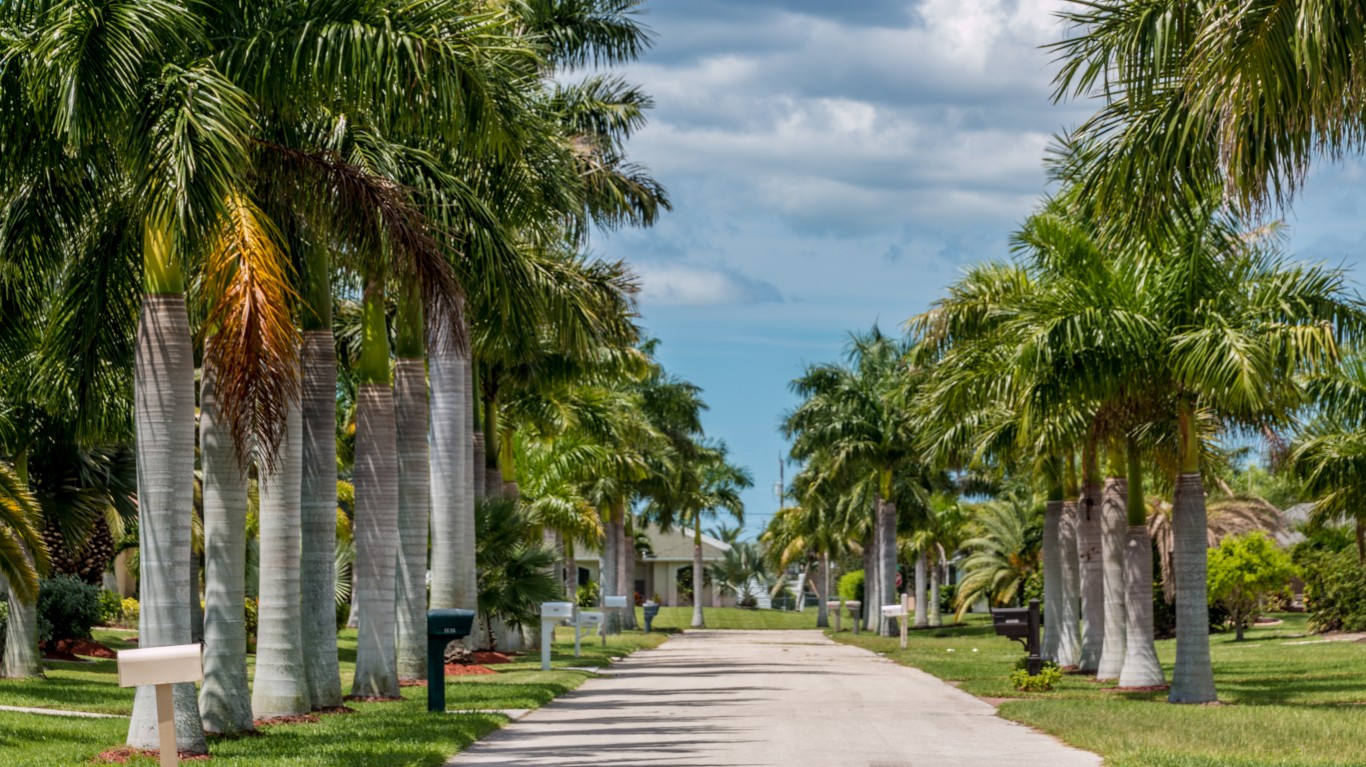
5. Cape Coral-Fort Myers, Florida
> 5-yr. change in violent crime rate: -41.3%
> Violent crimes reported in 2019: 257.8 per 100,000 people (total: 1979)
> Violent crimes reported in 2014: 439.4 per 100,000 people (total: 2975)
> Violent crime with largest pop.-adj. 5-yr. Increase: Murder (-54.5%)
[in-text-ad]

4. Bangor, Maine
> 5-yr. change in violent crime rate: -42.4%
> Violent crimes reported in 2019: 44.3 per 100,000 people (total: 67)
> Violent crimes reported in 2014: 76.9 per 100,000 people (total: 118)
> Violent crime with largest pop.-adj. 5-yr. Increase: Murder (-73.1%)
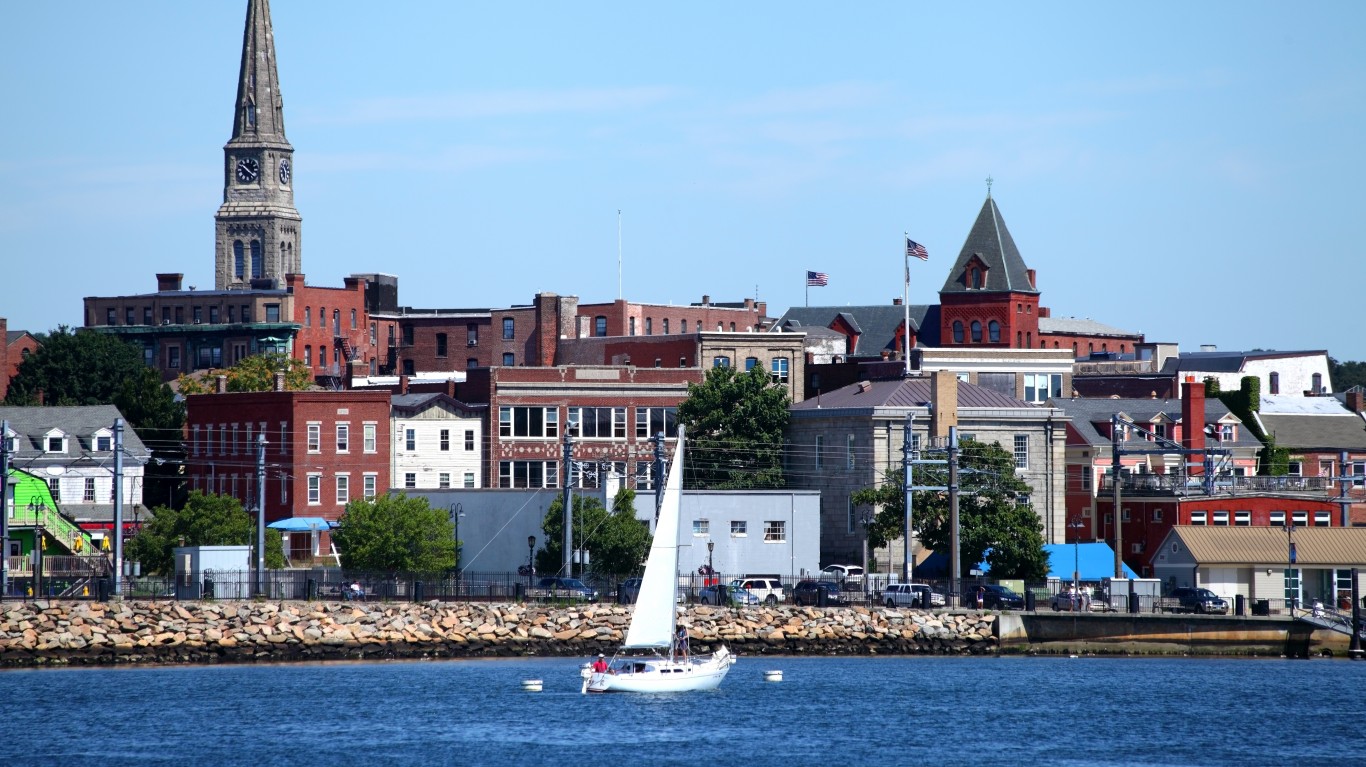
3. Norwich-New London, Connecticut
> 5-yr. change in violent crime rate: -42.9%
> Violent crimes reported in 2019: 193.8 per 100,000 people (total: 339)
> Violent crimes reported in 2014: 339.6 per 100,000 people (total: 496)
> Violent crime with largest pop.-adj. 5-yr. Increase: Aggravated assault (-52.0%)

2. San Luis Obispo-Paso Robles, California
> 5-yr. change in violent crime rate: -47.2%
> Violent crimes reported in 2019: 222.3 per 100,000 people (total: 630)
> Violent crimes reported in 2014: 420.9 per 100,000 people (total: 1177)
> Violent crime with largest pop.-adj. 5-yr. Increase: Aggravated assault (-55.6%)
[in-text-ad-2]
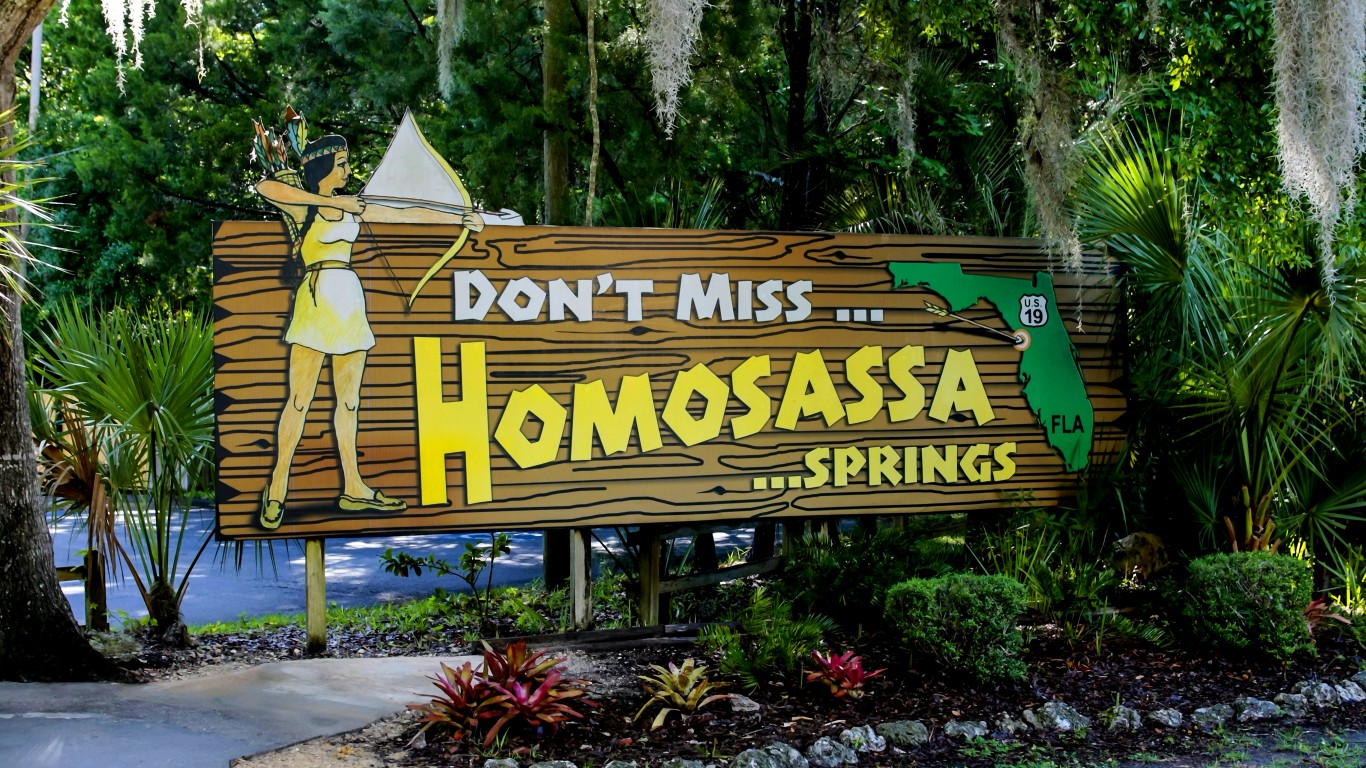
1. Homosassa Springs, Florida
> 5-yr. change in violent crime rate: -52.2%
> Violent crimes reported in 2019: 252.5 per 100,000 people (total: 373)
> Violent crimes reported in 2014: 528.3 per 100,000 people (total: 739)
> Violent crime with largest pop.-adj. 5-yr. Increase: Rape (-63.4%)
Credit card companies are handing out rewards and benefits to win the best customers. A good cash back card can be worth thousands of dollars a year in free money, not to mention other perks like travel, insurance, and access to fancy lounges. See our top picks for the best credit cards today. You won’t want to miss some of these offers.
Flywheel Publishing has partnered with CardRatings for our coverage of credit card products. Flywheel Publishing and CardRatings may receive a commission from card issuers.
Thank you for reading! Have some feedback for us?
Contact the 24/7 Wall St. editorial team.
 24/7 Wall St.

